Fixed Guideway Transit: An Estimate of Probable Costs
|
|
|
- Brent Smith
- 6 years ago
- Views:
Transcription
1 Fixed Guideway Transit: An Estimate of Probable Costs Fixed Guideway transit includes services such as Bus Rapid Transit, Light Rail, and Modern Streetcar. The range of costs for the Fixed Guideway systems identified in the Comprehensive Mobility Proposal is referred to as estimated probable cost per industry standards. Each guideway system will have unique characteristics, opportunities, and constraints. For example, some guideway systems may be built through existing commercial or residential corridors, requiring extensive and complex right-of-way acquisitions. In other instances, transit may be accommodated on the managed or dedicated lanes on the Interstate system. Until further Systems Planning is conducted to determine feasible alignments, actual limits, and modes, the broad range of costs serves the purpose for high level planning. Furthermore, operational and maintenance costs will depend on the selected mode, length of system, headways, ridership, and other requirements and features. These costs may change as systems mature, or if the modes change over time. The tables below list the estimated ranges for the Fixed Guideway corridors and the associated assumptions. The estimated probable cost of Modern Streetcar was not calculated separately as it is typically within the range of costs for Bus Rapid Transit and Light Rail. These initial estimates are based on information in the following reports (attached): Transit Technology Costs, AECOM OPEX Comparisons, Information tabulated by AECOM, and Final review of estimates of probable costs, a letter from AECOM In addition, the Hillsborough County Transit Options Assessment report (attached) was used as a guide for determining potential viable routes and modes. This report analyzed various Fixed Guideway transit alternatives through review of existing data at a planning level and the cost effectiveness of the different options. It also provided the necessary steps to positioning our community for federal and state grants in the future. Table 1 Summary of Estimated Probable Cost of Fixed Guideway Transit Routes Corridor Limits Length (miles) Total Capital (millions) Total O&M/year (millions) Low High BRT LRT Downtown to Westshore Marion Transit to Westshore Blvd. 4.7 $250 $800 $5.6 $9.2 Downtown to USF Marion Transit to USF Campus 9.8 $515 $1,500 $11.8 $19.4 Downtown to Brandon Marion Transit to Dover Road 15.9 $835 $1,500 $ Dale Mabry I-4 to Van Dyke Road 12.0 $630 $1,100 $ Note: These numbers have been rounded and are consistent with those in the presentation 1 of 2
2 Table 2 - Estimated Probable Cost Calculation for Fixed Guideway Transit Routes Corridor BRT LRT BRT LRT Low High Low High Downtown to Westshore Marion Transit to Westshore Blvd. 4.7 $53 $88 $245 $409 $5 $391 $250 $800 Downtown to USF Marion Transit to USF Campus 9.8 $53 $88 $517 $862 - $638 $517 $1,500 Downtown to Brandon Marion Transit to Dover Road 15.9 $53 - $ $666 $834 $1,500 Dale Mabry I-4 to Van Dyke Road 12.0 $53 - $ $469 $631 $1,100 *Based on figures from AECom (see attached) Limits CAPITAL COSTS Length (miles) Capital Cost per mile (millions)* Construction Cost (millions) Right-of-Way (millions) Total Capital (millions) OPERATING AND MAINTENANCE (O&M) COSTS Corridor Limits Length (miles) Maintenance Cost per mile/year (millions)*** Total Maintenance Cost per year (millions) Operating Cost per mile/year (millions) Total Operating Cost per year (millions) Total O&M/year (millions) BRT LRT BRT LRT BRT* LRT** BRT LRT BRT LRT Downtown to Westshore Marion Transit to Westshore Blvd. 4.7 $0.08 $0.38 $0.35 $1.75 $1.12 $1.61 $5.23 $7.48 $6 $9 Downtown to USF Marion Transit to USF Campus 9.8 $0.08 $0.38 $0.74 $3.68 $1.12 $1.61 $11.03 $15.76 $11.8 $19.4 Downtown to Brandon Marion Transit to Dover Road 15.9 $ $ $ $ $19 - Dale Mabry I-4 to Van Dyke Road 12.0 $ $ $ $ $14 - *Operating cost based on average of Cleveland and LA total yearly cost divided by total length (see attached) **Operating cost based on average of eight cities - total yearly cost divided by total length (see attached) ***Based on averages from FTA National Transit Database (see ) 2 of 2
3 Attachment 1 Transit Technology Costs (Used to Determine Capital Costs)
4 Transit Technology Costs Hillsborough County July 18, 2014

5 Public Transport Alternatives


6 Bus Rapid Transit (BRT) Advantages Lower capital costs Exclusive busway Traffic priority Disadvantages Local Emissions Perception: It s just a bus Flexible route design Substantial stations Attracts development
7 Bus Rapid Transit (BRT) Cost Comparisons System Year Length (miles) Total Cost (US$ millions) Cost per mile (US$ millions) Boston $625.0 $168.9 Pittsburgh $272.0 $64.8 Cleveland $199.8 $29.8 Eugene, OR $25.0 $6.25 Grand Rapids $40.0 $4.2 Average cost per mile for BRT is $52.6 million in 2014$


8 Light Rail Transit Advantages Higher capacity than BRT Level platform loading Attracts development Disadvantages Higher capital cost than BRT No flexibility once built Traffic impacts
9 Light Rail Transit (LRT) Cost Comparisons System Year Length (miles) Total Cost (US$ millions) Cost per mile (US$ millions) Pittsburgh $523.4 $436.2 * San Diego $504.0 $91.6 Phoenix $1,400.0 $70.00 Minneapolis $672.5 $57.9 Salt Lake City $290.0 $48.3 Average cost per mile for LRT is $87.8 million in 2014$


10 Tram/Modern Streetcar Advantages Medium capacity Downtown circulator Attracts development Disadvantages Higher capital cost than BRT No flexibility once built Traffic impacts
11 Streetcar/Tram Cost Comparisons System Year Length (miles) Total Cost (US$ millions) Cost per mile (US$ millions) Kansas City $102.0 $51.00 Tucson $196.0 $50.3 Seattle $56.4 $43.4 Cincinnati $148.1 $41.1 Portland $57.0 $12.4 Average cost per mile for streetcar is $55 million in 2014$
 Low High Average (2014) Rapid Bus (BRT")
 $30.0 $168.")
 $48.3 $436.2 $87.")
12 Cost Comparisons Technology Cost per Mile ($ millions) Low High Average (2014) Rapid Bus (BRT Lite) $4.2 $6.5 $6.0 Diesel multiple unit (DMU) $3.3 $32.4 $20.0 Bus Rapid Transit (BRT) $30.0 $168.0 $52.6 Streetcar/tram $12.4 $51.0 $55.0 Light Rail Transit (LRT) $48.3 $436.2 $87.8 Metro Rail (HRT) $172.4 $349.4 $319.8
13 Attachment 2 OPEX Comparisons (Operational Expenditure Comparison)
14 Bus Rapid Transit (BRT) OPEX Comparisons System Length (miles) Total Cost Cost per vehicle mile Cost per Boarding Boston 3.7 n/a n/a n/a Cleveland 6.7 $6,514,207 $9.47 $1.41 Los Angeles 17.7 $22,550,664 $14.30 $2.88 Pittsburgh 4.2 n/a n/a n/a Eugene, OR 4.0 n/a n/a n/a National BRT Average $12.80 $2.30 Source: FTA, National Transit Database 2012; published November 2013.
15 Light Rail Transit (LRT) OPEX Comparisons System Length (miles) Total Cost Cost per Vehicle Mile Cost per Boarding Charlotte 9.3 $17,537,021 $20.21 $3.59 Cleveland 15.2 $12,339,684 $17.65 $4.71 Minneapolis 12.4 $27,886,232 $13.56 $2.66 Phoenix 19.6 $28,909,660 $11.87 $2.13 Pittsburgh 24.8 $52,043,343 $26.98 $7.30 Portland 52.1 $99,710,015 $12.88 $2.36 Salt Lake City 35.4 $42,177,868 $7.11 $2.42 San Diego 52.2 $63,309,242 $8.39 $1.94 National LRT Average $16.30 $3.30 Source: FTA, National Transit Database 2012; published November 2013.
16 Attachment 3 Final Review of Estimates of Probable Cost


17 AECOM 1001 Lakeside Avenue Suite 1010 Cleveland, OH tel fax July 30, 2014 Mr. Michael J. Williams, P.E. Manager, Design and Engineering Support Section Hillsborough County 601 E. Kennedy Blvd, 23 rd Floor Tampa, FL Subject: Review of Estimates of Probable Cost Dear Mr. Williams: AECOM has reviewed the estimated cost information you sent regarding potential transit alternatives. Overall we believe your estimates of probable cost to be reasonable and within the range of expected costs if built and operated using 2014 dollar values as the basis for comparison. AECOM provided Hillsborough County with national averages for transit construction estimates of probable cost for CAPEX on a per mile basis developed as computed by our cost estimators. These costs are based on the Federal Transit Administration s (FTA) Capital Cost Database of as-built costs for 35, federally-funded, light rail (LRT) and heavy rail transit (HRT) projects. The projects costs have been validated by the project sponsors. The database is used by AECOM to prepare conceptual, ballpark estimates for conceptual projects or for better understanding the unique characteristics of a cost estimate by comparing the costs to historical experiences. In addition, AECOM maintains a library of as-built capital costs used by our cost estimators in preparing cost estimates for highway, bridge and bus rapid transit projects. The average cost per mile for CAPEX provided in the Hillsborough County Transit Technology Assessment reflect these average CAPEX costs and are denominated in current 2014 dollars. Project costs are evaluated on year of expenditure values, which account for future costs. The Comparison of OPEX prepared by AECOM highlights several BRT, streetcar and LRT systems as examples of the range of operating and maintenance expenditures (OPEX) incurred annually by the systems noted in the tables. The national averages are for total OPEX, which includes vehicle and nonvehicle maintenance and operating costs. These costs are based on the FTA National Transit Database and are averages for 2012, the last year published. Although your table slightly overstates the total OPEX, it is within a reasonable range for estimates of probable operating and maintenance costs valued in 2014 dollars. Should you have any further questions or in need of additional clarification, please feel free to contact me. Sincerely, AECOM Technical Services, Inc. Kenneth G. Sislak Associate Vice President - Senior Project Manager
18 Attachment 4 Hillsborough County Transit Options Assessment

19 Hillsborough County Transit Options Assessment May 2014

20 HILLSBOROUGH COUNTY TRANSIT OPTIONS ASSESSMENT Prepared by: One Metro Center 4010 Boy Scout Boulevard Suite 300 Tampa, FL May 7, 2014
21 Contents Executive Summary Introduction Purpose of this Report Prior Studies Review of Prior Studies Findings and Conclusions Review of Technology Options Capacity of Transit Technologies Local Bus Enhanced Bus/Rapid Bus Bus Rapid Transit (BRT) Regional Commuter Rail with Diesel-Multiple Unit (DMU) Tram/Modern Streetcar Light Rail Transit (LRT) Findings and Conclusions Travel Market Analysis Review of Capital Expenditure Estimates (CAPEX) Operating and Maintenance Expenditure Estimates (OPEX) Cost Effectiveness Land Use Impact Recommendations May 7, 2014 Page i
22 Executive Summary Travel demand in the Tampa Bay region has been growing, and is forecast to continue to grow. The rising roadway congestion will cause longer travel times, reduced reliability of arriving at destinations as planned, higher operating costs, and reduced competiveness of the region when compared to other regions investing in integrated multimodal transportation systems. This report includes: Review of several transit studies completed for the Tampa region over the past 20 years; Review of transit technology options, looking at local applicability; Revised transit ridership forecasts; Revisions to capital, operating and maintenance costs to reflect current year costs; and An assessment of Federal Transit Administration (FTA) New Starts evaluation guidance for cost effectiveness, to determine if certain corridors might qualify for federal funds. Findings: Based upon this review, it appears the Northeast Corridor linking downtown Tampa and the University of South Florida and the West Corridor linking downtown to the Westshore development and airport show the most promise; however, the analysis also determined that: Transit ridership in Hillsborough County has shown impressive growth but remains modest for a community considering rail transit investments. The vast majority of new rail projects implemented over the past few decades have occurred in communities where existing transit ridership levels are significantly higher than those currently observed in Hillsborough County. At this time, it appears that light rail transit in either corridor would not qualify for an FTA medium or higher rating, which is the usual threshold to be considered for federal funds. Bus rapid transit was found to be more cost effective for these corridors, with one option in the Northeast Corridor being just over the cost effectiveness threshold to qualify for a medium rating. Recommendations: There is significant room for ridership growth in the area before a major investment in light rail transit would be viable. Hillsborough County should undertake steps to build patronage on the current bus transit system and develop a long-term transit and land use strategy that will support fixed-guideway transit, and that could allow a project to qualify for federal funds. Specific recommendations include: Continue investing in improvements to existing bus services, such as expansion of the MetroRapid enhanced bus system, which will help to increase transit use in key corridors. A full bus rapid transit option in some corridors might qualify for FTA funding once the projected ridership is higher and investment costs are lower. Develop a long-term transit/land-use plan that identifies travel corridors that could be developed to contain high capacity transit, and adopt specific land use policies that encourage transit-supportive development in these corridors. Include in the transit/land use plan a dedicated local funding source for transit investments, which will demonstrate a commitment to fund fixed-guideway transit Invest in complete streets and other infrastructure that can create more walkable, transit supportive development in these key corridors, including Downtown circulator. Continue dialogue with CSX to determine if commuter rail options are operationally feasible and cost effective in their rights-of-way. May 7, 2014 Page 1
23 1. Introduction Current travel demand in the Tampa Bay region generally exceeds roadway capacity, and according to the Hillsborough County Metropolitan Planning Organization (MPO), is forecast to increase. Even when accounting for planned roadway and transit improvements in the region, future travel demand will continue to overwhelm roadway capacity. In addition, rising roadway congestion will cause longer travel times, reduced reliability of arriving at destinations as planned, higher operating costs, and reduced competiveness of the region when compared to other regions investing in integrated multimodal transportation systems. SunRail, the new commuter rail service launched April 30 in Orlando and the planned referendum on light rail transit (LRT) in neighboring Pinellas County have heightened the sensitivity of Hillsborough County leaders to the prospect that they may fall further behind in providing quality transit options. 2. Purpose of this Report The purpose of this report is to support Hillsborough County in analyzing various fixed guideway transit alternatives through review of existing data at a planning level and advising executive leadership on the cost effectiveness of the options under consideration. Hillsborough County s immediate goal is to determine whether a viable starter line alternative exists, and if it does, the general parameters of such a starter line. 3. Prior Studies Numerous planning studies have been conducted since 1988 with the Hillsborough County Mass Transit Corridor Alternatives Analysis Study, which looked at fixed-guideway options. Significant consideration for a transit system serving Hillsborough County began with the Tampa Bay Commuter Rail Authority s Tampa Bay Regional Commuter Rail Feasibility Study (1993). Following this effort, several local, regional, and state agencies initiated studies looking at a wide range of alternatives for transit systems in the greater Tampa Bay region Review of Prior Studies The following subsections briefly summarize the findings of the previous studies Tampa Bay Regional Commuter Rail Feasibility Study (Wilbur Smith Associates). The Tampa Bay Commuter Rail Authority examined the feasibility of operating commuter rail service between Downtown Tampa and Lakeland, Florida, which led to a wider study of other regional rail corridors utilizing the existing CSX right-of-way. The study concluded that dieselmultiple unit technology operating on several corridors serving MacDill Air Force Base and the University of South Florida through Downtown Tampa was technically feasible. The study found that the cost of acquiring trackage rights from CSX would require approval from corporate offices in Jacksonville. May 7, 2014 Page 2

24 1998 Alternatives for Mobility Enhancement Major Investment Study (BRW) The study s problem statement noted that the area s growth in travel demand will exceed the capacity of the existing and committed transportation facilities, and that there are limited opportunities to provide new capacity in the existing transportation system due to physical and funding constraints. Moreover, there are incomplete connections between regional activity centers for those who are unable or who choose not to drive. The report noted that by 2015 many area highways would be over capacity or near capacity. The final plan recommended seven corridors: 1) Northeast Corridor (downtown to USF); 2) West Corridor (downtown to Westshore area and Airport); 3) Southwest Corridor (downtown to Interbay/Port Tampa); 4) Southeast Corridor (downtown to Brandon); 5) Northwest Corridor (Westshore to Carrollwood and Citrus Park); 6) North Corridor (downtown to Fowler Avenue to Bearss Avenue/I-275); 7) East Corridor (downtown to Lakeland). The report recommended the Northeast and Southwest corridors be constructed first. Approximately $700 million in capital and $400 million in operating funding would be needed from a new local source such as a sales tax. No new transit organization or operational changes were included in the final plan. Figure 1 below shows the Locally Preferred Alternative for all improvements in the 1998 Study. Figure 1 Locally Preferred Strategy from 1998 Mobility Study May 7, 2014 Page 3
25 It also noted need for bus, roadway, and pedestrian and bicycle improvements to allow for full range of multimodal connections. Diesel Multiple Unit (DMU) was recommended for all corridors, with commuter rail type equipment for the East Corridor to Lakeland. This study validated similar findings outlined in the Tampa Bay Regional Commuter Rail Feasibility Study that was completed in Capital costs for all lines were $4.1 billion ( ); the rail alternative would be $1.2 billion of that figure with the remainder would be pedestrian and bicycle improvements, street improvements, transportation system management and bus system improvements. The gross operating costs for all projects (new roadways, bus, transportation system management and rail) were estimated to be $3.2 billion over that same time period. Of that total, the rail fixed guideway operating costs would be $255 million. The full preferred alternative would result in 121,000 daily transit boardings with $68.4 million dollars in travel time savings in the region. All figures are in 1997 dollars Tampa Rail Project (URS) Following up the 1998 Alternatives for Mobility Enhancement Major Investment Study, in 1999 the Federal Transit Administration (FTA) granted approval under the New Starts program to permit the preparation of an Alternatives Analysis and Environmental Impact Statement (AA/EIS), which was completed in 2002 with a Record of Decision (ROD) delivered in The AA/EIS was for a 30 mile corridor that connected downtown Tampa to USF, the Port Tampa area in the southwest, and the Tampa International Airport (TIA) in the west. The project was called the Tampa Rail Project. Development of the Tampa Rail Project continued until January 2005 when Hillsborough Area Regional Transit (HART) suspended further work on the project and withdrew it from the New Starts program due to lack of a local funding source Regional Transit Action Plan This short study considered long-term transit improvements in the West Central Florida region, which included Hillsborough County. The report recommended the development of a regional transit agency to improve transit coordination in the West Central Florida region and to develop a more detailed transit development plan that would recommend fixed guideway transit routes, a governing structure to manage it and a dedicated funding course to construct and maintain a regional transit system. The plan also recommends regional bus rapid transit corridors that parallel many of the same corridors identified for rail in the 1998 study. The study was limited in scope and recommended governance, operational and funding options for consideration in the region 2006 MPO Transit Study (Parsons Brinckerhoff) At the urging of the Citizens Advisory Committee, and the request from the Hillsborough County Metropolitan Planning Organization (MPO) Board, the MPO Transit Study commenced in November of 2006 to begin addressing pressing questions for Hillsborough County, which included how do to deal with growing population and resulting increases in congestion. The timing of the MPO Transit Study also coincides with the concurrent effort by the Tampa Bay Area Regional Transportation Authority (TBARTA) to develop a regional transit master plan for the eight county region. May 7, 2014 Page 4
26 The MPO Transit Study included the development of scenarios to illustrate the benefits and tradeoffs associated with different mobility strategies for the county. One scenario focused on creating a major transit system for the county, while the other no-build concept relied primarily on roadways to address long term mobility needs. The conclusion from this study is that a major transit investment in improved bus and possible rail service is a more desirable choice. The key findings illustrated the benefits associated with a transit rich future to address mobility needs that cannot be achieved through roadway capacity improvements alone. The 2050 Transit Vision can benefit citizens of Hillsborough County by: Accommodating future growth in a more efficient and sustainable manner Providing a fast and more reliable transportation choice for citizens over time The Transit Concept for 2050 illustrated in more detail the key advantages of this transit future. The 2050 Transit Concept is set within the larger regional context that responds to local desires and opportunities concerning mobility, development patterns and the ability to accommodate future growth. Recognizing that transit must work in concert with the existing roadway system and respond to community preferences concerning land use and development patterns, the study examines a wide range of transit technologies and complementary transit supportive development options. The process involved a significant public outreach and engagement campaign; the development of guiding principles; technical analysis of future travel demand; transit rail and bus technology assessments; and conceptual level fatal flaw analysis for various transit concepts Tampa International Airport Conceptual Planning for Transit Station and Access The Hillsborough County Aviation Authority (HCAA) studied potential transit options and alignments for a future transitway and two transit stations at TIA. This transitway alignment was part of the regional transit system identified by the Tampa Bay Area Regional Transportation Authority s Master Plan. Goals of the TIA study were to optimize transit connections at terminals, improve passenger convenience, and minimize impacts to airport operations in light of TIA s long-range expansion plans. Two transit technologies were determined to be best suited for the purpose: Bus rapid transit (BRT) and light rail transit (LRT). As part of the study, TIA assumed the most restrictive criteria for both technologies so as not to preclude either option when the regional transit line is built. As a result, the study recommended: An at-grade alignment option at the south end of the airport by prohibiting any development along West Spruce Street airport property to the south service road. An aerial alignment along the George Bean Parkway to the terminal. An aerial alignment for connection to the future North Terminal. As a result of a significant update to the Tampa International Airport Master Plan in 2012, the commitment to a northern terminal was eliminated and right-of-way previously envisioned for this potential transit corridor was committed to people mover connections to remote parking and future airport expansion. Previous plans called for a new terminal on this land, which planners believed was necessary once the airport served 25 million annual passengers. The 2012 Master May 7, 2014 Page 5
27 Plan update allows the existing facilities to accommodate 34.7 million annual passengers, preserving the north property for airport growth far into the future. Subsequent planning amended future potential rail alignments as skirting the Eastern Airport border area Tampa Bay Area Regional Transit Authority (TBARTA): Master Plan In 2007 the Governor signed into law legislation that created the Tampa Bay Area Regional Transportation Authority (TBARTA), a new governing body covering seven counties created to address the transportation needs for the West Central Florida region. TBARTA adopted its first Regional Transportation Master Plan in The inaugural master plan identified the vision for the regional transit network. The 2009 Regional Transportation Master Plan noted that areas attracting the most trips in the region included the Tampa International Airport, University of Tampa, University of South Florida (USF), Ybor City and downtown Tampa. With this background, TBARTA studied alternatives for two corridors: downtown Tampa to the Tampa International Airport (West Corridor) and downtown to USF (Northeast). An update was completed in 2011 that introduced a regional freight and a regional roadway network to the plan. The 2013 Master Plan Update is a minor update to refine all networks, and incorporate the progress made locally and regionally towards implementing the regional vision. The Master Plan is updated every two years to ensure that TBARTA continues to represent the changing needs for the mobility of passengers and freight throughout the region HART Alternatives Analysis (Parsons Brinckerhoff) This 2010 study builds upon the 2003 AA/EIS. The study also noted a 2007 Tampa International Airport Conceptual Planning for Transit Station and Access study which recommended an alignment to serve the airport. The HART AA work scope included examining and updating the previous Tampa Rail LPA, adopted by the HART Board in October 2001, and documented in the Final Environmental Impact Statement (FEIS) in December 2002, and approved by a Record of Decision (ROD) issued by the FTA on April 16, This Alternatives Analysis (AA) compared the Tampa Rail locally preferred alternative (LPA) to other potential alternatives, developing recommendations on an alternative that would best meet community needs. The AA focused on two corridors: the Northeast and West Corridors. The Northeast Corridor spans from New Tampa, south to Downtown Tampa and is approximately 18 miles in length. (The Northeast Corridor spanned from downtown Tampa to the USF area initially and was extended to the new Tampa area in an attempt to serve additional markets. The West Corridor spans from Downtown Tampa, west to TIA and is approximately 7 miles in length. (This corridor was also extended through the airport to the northwest in an attempt to serve additional markets. The width of the Northeast Corridor is at most 5 miles. The width of the West Corridor is at most 4 miles. Work on the study commenced in July 2009 and was essentially completed in early The study area s population was projected to increase by 63 percent and employment was projected to increase by 59 percent from 2006 through The area has a high number of transportation-disadvantaged households (sometimes called transit-dependent). The area has buses with long headways and travel times that are not competitive with the automobile. By 2035, travel demand was predicted to exceed capacity by nearly 2 to 1 for the existing and planned facilities. Air quality for Hillsborough County was also noted as a concern. The study May 7, 2014 Page 6

28 area also has some of the highest densities in the area. For example, the study area has nearly 35 percent of the population and over 40 percent of the employment on only 10 percent of the land in Hillsborough County. The study screened several alignments within the Northeast and West Corridors. After two rounds of screening, three alignments were still under consideration for the Northeast Corridor, along with two West Corridor alignments. For both corridors, the alignment options generally followed either I-275 or the CSX railroad. The alternative recommended included the I-275 alignment for both corridors for the following reasons: the greater capital expense of negotiating the use of the CSX right-of-way (on the Northeast corridor); the lower overall travel time for the I-275 route for both corridors; and the lower level of possible community impacts along I-275 route. The report noted the need for further study on the routing within downtown Tampa. The report recommended LRT over BRT since it was reported that LRT was consistent with local and regional plans, had a better record for encouraging positive land use patterns, had greater air quality benefits, and had support from agencies and the public. The final screening table 4-3 noted that LRT costs were projected to be $78 million to $120 million per mile, with BRT costing between $37 million and $53 million per mile. LRT operating and maintenance costs were also projected to be higher than BRT. Figures 2 and Figure 3 below indicate the Locally Preferred Alternatives for the Northeast and West Corridors. Figure 2 HART AA Northeast Corridor May 7, 2014 Page 7
. This starter project would include the West Corridor and then a Northwest Corridor that terminated north of the Airport.")
29 Figure 3 HART AA West Corridor HART staff recommended a 12 mile starter demonstration project from downtown to the Tampa Airport to Linebaugh Avenue, with a projected a $825 million capital cost and an average weekday ridership of 11,300 (by 2035). This starter project would include the West Corridor and then a Northwest Corridor that terminated north of the Airport. The project recommended designing the light rail line to be constructed simultaneously with the reconstruction of I-275. Moreover, since the West Corridor was included in the EIS completed in 2003, the West Corridor might take less time to receive environmental clearance than the Northeast Corridor. Finally, the West Corridor had a lower per-mile construction estimate, making it a more feasible starter project. No cost effectiveness indices were calculated for any of the corridors evaluated. Figure 4 below shows the general alignments for the demonstration project. However, the modified TIA Master Plan precludes this alignment through the airport. May 7, 2014 Page 8

30 Figure 4 Proposed LRT Demonstration Project 2013 Downtown Transit Assets and Opportunities Study (URS) The MPO and the Tampa Downtown Partnership initiated the Downtown Transit Assets & Opportunities Study in late 2013 to investigate potential opportunities for expansion and/or extension of the existing transit assets. The study is focused on downtown Tampa with potential connections to Tampa International Airport. The current Downtown Transit Assets & Opportunities Study builds upon many previous transit investment studies in Hillsborough County. The current transit assets and opportunities study is being guided by the City of Tampa, the MPO, HART, Florida Department of Transportation (FDOT) and the Tampa Historic Streetcar board. The Final Report and recommendations are anticipated by the end of May 2014 and will feed into the MPO s long range plan and HART s Transit Development Plan. Figure 5 illustrates the current recommendation of the Steering Committee. May 7, 2014 Page 9

31 Figure 5 Recommended Transit Options The estimate of probable capital cost of the recommended alternative is approximately $1.0 - $1.3 billion and is estimated to cost $14.1 to $16.9 million annually to operate and maintain. The estimated ridership is unreported at this time Tampa Bay Express Lanes (TBX) and Intermodal System (Jacobs Engineering) The purpose of this study is to determine the feasibility of operating a BRT service within proposed interstate tolled express lanes. This project evaluates the opportunity for BRT service with the goal of increasing the overall capacity of the interstate express lanes. This study also focuses on providing a regional transit service between Pasco, Hillsborough, and Pinellas Counties; making connections to beaches, business districts, and regional multi-modal centers. The study will not be completed until later this year Findings and Conclusions All of the prior studies concentrate on a few major travel corridors radiating from downtown Tampa. Several of the studies recommend investments in: the Northeast Corridor linking Downtown Tampa with the University of South Florida, or May 7, 2014 Page 10
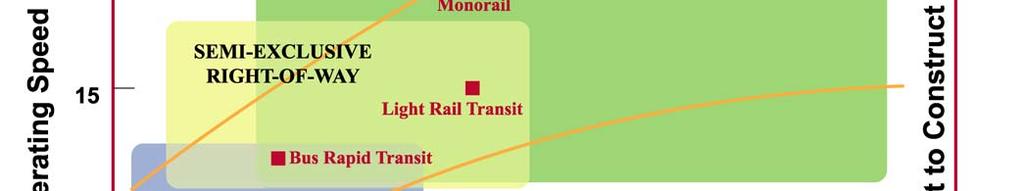
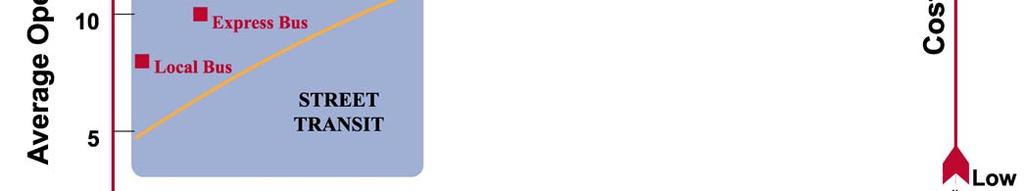
32 the West Corridor linking downtown with the Tampa International Airport and the Westshore development. Our review of the findings and recommendations from the prior studies suggests the initial transit investment should be in a travel corridor with the potential to generate very high transit ridership at a very low start-up cost to improve the project s cost effectiveness and increasing the probability of obtaining federal funding support. This will be discussed in the following sections. 4. Review of Technology Options A family of public transportation technologies appropriate to urban mass transit was evaluated during the prior studies. These technologies ranged from buses to rail rapid transit systems. Several of the technologies were eliminated from further evaluation and technical analysis. These technologies were deemed either inappropriate due to estimates of probable cost or higher capacity than required by the ridership estimates for the regional transit network contemplated. Technologies included in the final set of options were BRT, LRT, tram/modern streetcar and regional commuter rail using diesel multiple unit (DMU) trainsets Capacity of Transit Technologies The capacity of a transit line is measured by calculating the number of persons per hour per direction (PHPD) the system is required to carry. This is achieved by multiplying vehicle capacity times the number of buses or trains operating per hour passing a given station. For example, assuming standard 40-foot buses seat 50 people and the public transport system maximum load factor is 120 percent of seated capacity, the peak capacity of the bus is approximately 60 passengers. With this load factor, a busway could theoretically serve up to 14,400 PHPD. This would be the equivalent of operating 4 buses per minute during the peak hour passing a station stop. This capacity can be significantly increased by utilizing articulated or bi-articulated buses as is done in South America where some busways can carry up to 40,000 passengers per hour per direction. Although buses passing a given point on a busway can achieve this throughput, not all buses can stop unless fairly elaborate stations with multiple bus bays are provided. At such levels of development, the bus system is likely to exhibit capital and operating costs comparable to or higher than light rail transit. However, the proposed Tampa Bay regional transit network does not require such high capacity technologies and the supporting infrastructure necessary to achieve such high loading capabilities. The preliminary ridership estimates for the priority corridors in the 2010 HART Alternatives Analysis ranged between 14,740 and 19,500 average total daily linked trips, depending upon alignment and technology alternative. Consequently, technologies with extremely high capacity capabilities are unnecessary. The following technologies are appropriate for the Hillsborough County area. May 7, 2014 Page 11


33 Local Bus Local bus service is already provided by HART throughout the region. The slow travel speed and frequent stops makes this transit option less than ideal for providing the connectivity to large job centers like downtown Tampa, Westshore and the airport. Further, local bus improvements are unlikely to generate substantial ridership gains unless the service area coverage, span of service and frequency of service is substantially improved. Local bus will be an important feature of any transit improvement in the region. Local bus services provide a critical access linkage between neighborhoods and the potential rail and bus rapid transit services effectively increasing access and mobility Enhanced Bus/Rapid Bus Limited-stop bus service could provide a faster trip to serve job destinations in downtown Tampa. Enhanced Bus/Rapid Bus service operating in mixed traffic could connect many neighborhoods with high frequency service at a low-to-medium cost. Station spacing would be flexible depending on the destinations in the extended route corridor. The characteristics of this service would include substantial stations, passenger information systems and transit signal priority but would operate in mixed-traffic similar to the MetroRapid service currently operating in Tampa.. This system of express bus services currently operates successfully in Houston and Los Angeles using stations in the median of freeways with special access/exit ramps that avoid congested interchanges. The HART MetroRapid operates north on Nebraska Avenue from downtown Tampa then east along Fletcher Avenue to the vicinity of Telecom Park (west of I-75). Hidden River Regional Park-n-Ride is the northern terminus. Enhanced Bus/Rapid Bus could also be operated on the Tampa Bay Express Lanes (TBX) on the regional freeway network. Buses could operate at higher speeds on the managed TBX lanes and act as their own collector/distributor system while operating on local roads Bus Rapid Transit (BRT) Bus Rapid Transit (BRT) is a bus operation generally characterized by use of exclusive or reserved rights-of-way (busways) that permit higher speeds and avoidance of delays from general traffic flows. The HealthLine in Cleveland is the best example of full BRT in North America. Full BRT service operating in an exclusive lane could connect downtown Tampa to the Tampa International Airport with high frequency service and appropriate and flexible station spacing, at a cost similar to the HealthLine in Cleveland. May 7, 2014 Page 12

 commuter rail service between West Palm Beach and Miami sharing tracks with CSX freight trains.")
34 Regional Commuter Rail with Diesel-Multiple Unit (DMU) The development of diesel-multiple unit (DMU) railcars capable of operating on the CSX freight railroad tracks makes this technology option a lower cost alternative than building LRT. It is considered a shared right-of-way light rail technology option. DMU have been successfully deployed in Austin, Camden/Trenton, Dallas, Miami, Portland, and San Diego. DMU operates on the South Florida Regional Transit Authority (Tri- Rail) commuter rail service between West Palm Beach and Miami sharing tracks with CSX freight trains. In New Jersey, the River Line operates DMU trains between Camden and Trenton. The DMU operate in city streets in Camden and then follow the Delaware River on the former Bordentown-Trenton Branch of the former Conrail freight railroad. New Jersey Transit purchased the branch line from Conrail in 1999 and today shares tracks with Norfolk-Southern under an FRA approved operating agreement. The DMU could operate in downtown Tampa on city streets similar to the operation in Camden/Trenton or Austin and then utilize the existing CSX right-of-way and improved tracks. There are significant institutional and operational challenges that must be overcome to accomplish this. As the County understands, negotiations with the CSX railroad will be complex, lengthy and costly. The DMU option was considered to be an appropriate technology according to the 1993 Tampa Bay Regional Commuter Rail Feasibility Study, the 1998 Mobility Study and the current Downtown Transit Assets and Opportunity Study Tram/Modern Streetcar Modern streetcars are a form of urban rail public transportation operating entire routes predominantly on streets, often in mixedtraffic. The service typically operates with single-car trains with frequent stops powered by an overhead contact system. Portland operates a very large modern streetcar system. The cities of Atlanta, Cincinnati, Detroit, Kansas City, Los Angeles, Tucson and Washington, DC are building modern streetcar lines as downtown circulator systems. Tampa has a 2.4 mile heritage streetcar line (TECO) operating between Downtown, Channelside and Ybor City. There are aspirations and plans to extend the TECO streetcar line to serve more destinations in the Downtown area, specifically as part of the Downtown Transit Assets and Opportunities Study Light Rail Transit (LRT) Light rail transit (LRT) is a rail transit technology capable of providing a broad range of passenger capacities. Modern electric rail vehicles operate singly or in short trains. Taking May 7, 2014 Page 13

35 power from an overhead wire, they can run on either exclusive or shared rights-of-way with or without grade crossings, or occasionally in mixed traffic lanes on city streets. Locational flexibility is the primary defining attribute separating LRT from other rail transit technology options. LRT has significant passenger capacity that requires substantial capital expenditures and operating and maintenance cost investment in corridors that have the population densities to support it. Such a major transit investment would require a local dedicated funding source to support an application for federal funding participation Findings and Conclusions Each technology option has advantages and disadvantages associated with capacity and speeds. The higher speed and capacity transit options cost more than options operating at lower speed and with less carrying capacity. Generally, higher speeds and high capacity are required for longer trips, which require exclusive right-of-way. These longer distance commuter trips are best served by commuter rail (DMU), LRT and BRT operating on exclusive transitways or in managed lanes on freeways in the case of express buses. Convenient and highly accessible systems, such as streetcars and local buses, serve generally shorter trips but provide greater access to the transit system. These systems operate at slower commercial speeds and can operate in mixed-traffic. The balance must be found between near term and ultimate capacity for future population and travel patterns and select technologies that match travel market needs and capacities. BRT is a viable technology alternative and should be a considered option. It is significantly lower in cost than LRT and has greater flexibility in terms of developing an operating plan that grows with the market. It can be implemented faster and sooner and provides the opportunity to provide quality curb to curb connections by providing one-seat trips by circulating on local streets to collect or distribute passengers. The shorter vehicle life, 12 versus years provides the opportunity to update propulsion technology, amenities and features more frequently. BRTs land use impact is not as proven as LRT, but early results look promising as seen in Cleveland. LRT is a viable technology that should be considered where high capacity is needed for (longer) line haul trips. Streetcar is a viable technology for a downtown circulator, but not for a line haul service requiring higher average commercial speeds. LRT and modern streetcar have attracted significant development around stations that are located within areas of the city that can support redevelopment. Regional rail utilizing the infrastructure and facilities of the general railroad system make it an attractive option for achieving regional mobility improvements at a fraction of the cost of a light rail transit (LRT) system. This is the technology implemented in Austin and Denton County, Texas. Regional rail utilizing the CSX right-of-way is a viable technology alternative and should be a considered option, which was the recommendation of the 1993 Tampa Bay Regional Commuter Rail Feasibility Study. May 7, 2014 Page 14
36 Automated guideway transit (AGT) connecting the Tampa International Airport and a proposed Airport Intermodal Center is a viable transit option. The airport has already invested in a proprietary system that connects the main terminal building to departure/arrival gates. Land use along the alignments influence potential transit oriented development and ridership. Alignments in the middle of freeways are more removed from convenient access to residential and mixed-use commercial development and are less likely to have direct walk access. Stations in the median of freeways are less likely to encourage transit oriented development and high land use impact. 5. Travel Market Analysis The HART Alternatives Analysis (AA) ridership forecasts were updated to reflect changes in horizon year population and employment forecasts and most recent changes to FTA s costeffectiveness measure under MAP-21. This update was conducted at a planning level commensurate with project scope for an initial feasibility review. The HART AA study used the MPO s 2035 population and employment forecasts, the most recent forecasts available at the time of the study. Recently the Hillsborough MPO developed 2040 forecasts, which differ substantially from the 2035 forecasts, as described further in this section. The Hillsborough MPO also recently developed population and employment estimates for The HART AA study calibrated the travel models using the then-latest 2006 estimates. The MPO s 2010 estimates were used to develop sketch-planning 2010 project ridership for this analysis. The 2010 population and employment estimates are modestly higher than their 2006 counterparts. These contribute to a 6 percent growth in unlinked trips between 2006 and 2010 according to HART s National Transit Database summary reports for those years. The 2040 West and Northeast Corridor population and employment estimates are all lower by 10 percent than their 2035 counterparts except for population in the West Corridor. Most notable is the decline in horizon year CBD employment: it was assumed to be 97,600 in 2035 but is 67,800 in 2040, a 30 percent reduction. Consequently the growth rates between base and horizon years are lower than in the HART AA (except for West Corridor population) but still strong compared to other urban areas around the country. All of the above information indicates that the HART AA ridership forecasts are higher than what would be expected if the model were recalibrated and re-run with the 2010 Census and 2040 datasets, assuming the networks and project characteristics were identical. The 2035 ridership forecasts were updated to 2040 by reflecting both the 6 percent increase in unlinked trips between 2006 and 2010 and the reduced growth between the sociodemographic forecasts. An estimate of 2010 ridership was created by adjusting the newly developed 2040 ridership downwards using the growth rates. No differences were assumed between LRT and BRT ridership for the HART Alternatives Analysis because the alignments were physically identical and the BRT and LRT would operate nearly identically. This assumption was maintained for this update, but a more rigorous update to the ridership forecasts would reflect modal differences. The revised ridership forecasts are shown in Table 1. May 7, 2014 Page 15
37 Table 1: Revised Ridership Forecast Ridership 30 th Street & CSX 20 th - 22 nd & CSX I-275 Northeast I-275 West Cypress Street Average Daily Trips 14,325 12,343 12,123 4,473 5,709 Annual Trips Source: AECOM, May ,004,486 3,450,428 3,388,928 1,250,406 1,595, Review of Capital Expenditure Estimates (CAPEX) Capital cost development usually results from engineering analysis of alignment studies by defining infrastructure and rolling stock requirements. Cost estimates prepared during the early project development stage brings with it several challenges, including questions about whether the current economic conditions, construction industry configuration, and building technologies will apply to a project implemented many years in the future. In general, the estimating process assumes future conditions will be predictably similar to historical trends. A recurring issue in estimating capital costs during a project s conceptual phase is evaluating and treating uncertainty. Uncertainty can result in a difference between a project s estimated cost as defined during the concept phase and the project s actual cost, which is ultimately implemented. As cost estimates are built-up, explicit allowances for these risks must be accounted for. There risks are typically categorized as follows: Changes in project scope; Changes in design or operating standards; Incorrect unit cost / quantity assumptions; and Unforeseen issues in implementation. As part of this review of prior studies, especially the 2010 HART Alternatives Analysis and the current Downtown Transit Assets and Opportunities Study, capital cost estimates were reviewed to determine whether they were still a valid estimate of probable cost to design and construct the alternatives under review. The HART Northeast and West Corridors Alternatives Analysis capital cost estimates were compared to an independent estimate of LRT and BRT alignments in other cities using the FTA Standardized Cost Category (SCC) format. The SCC includes the following categories as applicable: Guideway & Track Elements; Stations, Stops, Terminals, Intermodal; Support Facilities: Yards, Shops, Administration Buildings; May 7, 2014 Page 16
APPENDIX N East King County Subarea High Capacity Transit (HCT) Analysis: Approach to Assessing System-Level Alternatives
 Analysis: Approach to Assessing System-Level Alternatives") Sound Transit Regional Transit Long-Range Plan Draft Supplemental Environmental Impact Statement APPENDIX N East King County Subarea High Capacity Transit (HCT) Analysis: Approach to Assessing System-Level
Sound Transit Regional Transit Long-Range Plan Draft Supplemental Environmental Impact Statement APPENDIX N East King County Subarea High Capacity Transit (HCT) Analysis: Approach to Assessing System-Level
HILLSBOROUGH COUNTY METROPOLITAN PLANNING ORGANIZATION
 HILLSBOROUGH COUNTY METROPOLITAN PLANNING ORGANIZATION 2035 Long Range Transportation Plan Needs Assessment Segment Summary: Prepared for: Hillsborough County Metropolitan Planning Organization P.O. Box
2004 FEASIBILITY STUDY UPDATE
 Austin-San Antonio Intermunicipal Commuter Rail District 2004 FEASIBILITY STUDY UPDATE December 2004 EXECUTIVE SUMMARY INTRODUCTION Almost 3 million people in Central Texas, living and working between
I-26 Fixed Guideway Alternatives Analysis. Transit Talk: ULI Executive Round Table Discussion. Thursday, April 30, :30 AM 1:00 PM
 I-26 Fixed Guideway Alternatives Analysis Transit Talk: ULI Executive Round Table Discussion Thursday, April 30, 2015 8:30 AM 1:00 PM AGENDA 1) i-26alt Project Overview 2) Conceptual Alignments & Modes
Midtown Corridor Alternatives Analysis. Technical Advisory Committee Meeting November 15, 2012
 Midtown Corridor Alternatives Analysis Technical Advisory Committee Meeting November 15, 2012 Today s Agenda Introductions Roles and Responsibilities Alternatives Analysis Process Overview Outreach Overview
Chapter 6: Regional Transportation
 Chapter 6: Regional Transportation Continued growth and development throughout the region magnifies the significance of connections to surrounding counties as economic and social interactions continue
FINAL. Sound Transit Long-Range Plan Update Issue Paper S.6: Potential Tacoma Link Extension - East. Prepared for: Sound Transit
 Sound Transit Long-Range Plan Update Issue Paper S.6: Potential Tacoma Link Extension - East Prepared for: Sound Transit Prepared by: Parsons Brinckerhoff Quade & Douglas, Inc. FINAL March 2005 Foreword
SOUTHWEST LRT (METRO GREEN LINE EXTENSION)
") 8 Evaluation of Alternatives This chapter evaluates the effectiveness of the No Build Alternative and the Southwest Light Rail Transit (LRT) Project (the Project) based on the information contained in
8 Evaluation of Alternatives This chapter evaluates the effectiveness of the No Build Alternative and the Southwest Light Rail Transit (LRT) Project (the Project) based on the information contained in
Introduction... 1 Florida s Rail System... 1 Rail Freight... 3 Rail Passengers... 5 Conclusions... 9
 January 2011 Table of Contents Introduction... 1 Florida s Rail System... 1 Rail Freight... 3 Rail Passengers... 5 Conclusions... 9 Table of Figures and Tables Figure 1 Florida Rail System Map... 2 Figure
Transit Carrying Capacity MPO Transit Study
 rying December 14, 2007 Hillsborough County Metropolitan Planning Organization County Center, 18 th Floor Tampa, Florida 33602 813-272-5940 www.hillsboroughmpo.org rying INTRODUCTION In parallel with the
The development of potential alignment segments was based on the review of:
 5.0 FEASIBILITY ANALYSIS This section summarizes the results of analysis used to determine the feasibility of a Monorail/AGT system in the WILMAPCO region. The section begins with a discussion of the identification
HILLSBOROUGH COUNTY METROPOLITAN PLANNING ORGANIZATION
 HILLSBOROUGH COUNTY METROPOLITAN PLANNING ORGANIZATION 2035 Long Range Transportation Plan Needs Assessment Segment Summary: Downtown Tampa to University of South Florida Prepared for: Hillsborough County
Chapter 1: Overview. page 1. Figure 2-1: Road congestion is expected to continue to grow
 Chapter 1: Overview Figure 2-1: Road congestion is expected to continue to grow The region s mobility so fundamental to its economic vitality and quality of life is challenged by mounting congestion, rising
2030 Transportation Policy Plan SUMMARY PRESENTATION. Land Use Advisory Committee November 15, 2012
 2030 Transportation Policy Plan SUMMARY PRESENTATION Land Use Advisory Committee November 15, 2012 Today s Topics Transportation Policy Plan (TPP) Requirements and Background Current TPP Policies, Issues
Locally Preferred Alternative. Work In Progress; Subject To Change Without Notice 1
 Locally Preferred Alternative 1 Riverview Corridor Study Area 12 mile study area between Saint Paul and Bloomington. Connects major destinations, neighborhoods and job concentrations. Serves growing and
Nashville Southeast Corridor High-Performance Transit Alternatives Study. Final Report
 Nashville Southeast Corridor High-Performance Transit Alternatives Study Final Report August 2007 - Nashville Southeast Corridor Executive Summary I. Introduction The southeast corridor is a 30 mile long
Executive Summary and Staff Recommendation
 Executive Summary and Staff Recommendation January 2017 Project Background In 2010, NFTA completed an update to our 2001 Strategic Assessment. This assessment identified four corridors for potential rail
Overview of Alternatives Analysis
 Red Line/HealthLine Extension Major Transportation Improvement Analysis Greater Cleveland Regional Transit Authority Public Meeting: February 11, 2016 Final Report Overview of Alternatives Analysis Public
POLK COUNTY TPO Polk County 2060 Transportation Vision Plan Final Report. ADOPTED June 18, 2009
 POLK COUNTY TPO Polk County 2060 Transportation Vision Plan Final Report ADOPTED June 18, 2009 TABLE OF CONTENTS CHAPTER 1 Introduction and Prior Planning Effort...Page 1-1 CHAPTER 2 Population and Employment
2040 Transportation Policy Plan Conversion to Performance Based Planning Basis. 25 th Annual CTS Transportation Research Conference May 21, 2014
 2040 Transportation Policy Plan Conversion to Performance Based Planning Basis 25 th Annual CTS Transportation Research Conference May 21, 2014 1 About the plan Long-range transportation plan for the Twin
10. PROJECT DEVELOPMENT, LEADERSHIP, AND OVERSIGHT GUIDELINES
 10. PROJECT DEVELOPMENT, LEADERSHIP, AND OVERSIGHT GUIDELINES It is important to note that the Transitway Guidelines are not intended to be prescriptive, but rather to provide a consistent basis for planning,
Airports in the Region Case Study
 DESTINATION LINDBERGH: COLLABORATION AND VISION TO MEET SAN DIEGO S MOBILITY NEEDS By Bob Leiter, FAICP, Keith Wilschetz, and Tait Galloway INTRODuCTION Destination Lindbergh was a year-long, comprehensive
3.0 REVIEW OF PREVIOUS STUDIES
 3.0 REVIEW OF PREVIOUS STUDIES This section of the highlights the significant features from previous plans and studies that could impact the development of the I-20 East Transit Initiative. Much of the
APPENDIX B - GLOSSARY FEBRUARY 2017
 APPENDIX B - GLOSSARY FEBRUARY 2017 DENVERMOVES Transit Denver Moves: Transit - ii - APPENDIX B TRANSIT AND MOBILITY GLOSSARY Amenities, stop or station: Objects or facilities (such as a shelter, bench,
What is the Transportation Policy Plan (TPP)?
?") Summary What is the Transportation Policy Plan (TPP)? The region s long range transportation plan Includes all modes of transportation: highways, transit, airports, freight, biking, pedestrians Meets the
Summary What is the Transportation Policy Plan (TPP)? The region s long range transportation plan Includes all modes of transportation: highways, transit, airports, freight, biking, pedestrians Meets the
Preparation of an Environmental Impact Statement for High Capacity Transit
 This document is scheduled to be published in the Federal Register on 11/19/2013 and available online at http://federalregister.gov/a/2013-27583, and on FDsys.gov DEPARTMENT OF TRANSPORTATION Federal Transit
Guiding Principles of the Plan:
 REGIONAL TRANSIT FEASIBILITY PLAN The Regional Transit Feasibility Plan continues to make progress, having completed the first step of the defined process to evaluate opportunities for premium transit
Regional Transit Framework Study
 MARICOPA ASSOCIATION OF GOVERNMENTS Regional Transit Framework Study Regional Stakeholders Group Meeting #1 February 29, 2008 Copyright 2008 AGENDA Welcome and Introductions Project Process Regional Transit
Final. Project Summary Report
 Final Project Summary Report February 2017 TABLE OF CONTENTS PROJECT SUMMARY REPORT FINAL Prepared for: FDOT District 5 Prepared by: Parsons Brinckerhoff, Inc. March 2017 i February 2017 TABLE OF CONTENTS
12 Evaluation of Alternatives
 12 Evaluation of Alternatives This chapter evaluates the effectiveness of the No-Build Alternative and the proposed METRO Blue Line Light Rail Transit (BLRT) Extension project based on the information
REGIONAL INTERMODAL RAIL TRANSIT SYSTEMS ENSURING OUR ECONOMIC AND TRANSPORTATION FUTURE
 REGIONAL INTERMODAL RAIL TRANSIT SYSTEMS ENSURING OUR ECONOMIC AND TRANSPORTATION FUTURE REGIONAL TRANSIT SYSTEMS Comprehensive transit system serving the mobility needs of an entire region Transit modes
Chicago Transit Authority Orange Line Alternatives Analysis Study
 Chicago Transit Authority July 10, 2009 Written questions and comments regarding the were submitted by a variety of individuals and groups from throughout the Chicago region at the study s Screen 2 Public
Congestion Management Process (CMP)
") Congestion Management Process (CMP) Introduction The Congestion Management Process (CMP) is a systematic, data-driven, and regionally accepted approach that aims to improve the performance of the transportation
Congestion Management Process (CMP) Introduction The Congestion Management Process (CMP) is a systematic, data-driven, and regionally accepted approach that aims to improve the performance of the transportation
2035 LRTP Transportation Options Introduction
 2035 LRTP Transportation Options Introduction What is the 2035 LRTP? The 2035 Long-Range Transportation Plan (LRTP) is the guide for major transportation investments in the Durham-Chapel Hill-Carrboro
REGIONAL INTERMODAL RAIL TRANSIT SYSTEMS ENSURING OUR ECONOMIC AND TRANSPORTATION FUTURE
 REGIONAL INTERMODAL RAIL TRANSIT SYSTEMS ENSURING OUR ECONOMIC AND TRANSPORTATION FUTURE REGIONAL TRANSIT SYSTEMS Comprehensive transit system serving the mobility needs of an entire region Transit modes
TBARTA 2015 Regional Transportation Master Plan 2040 Regional Long Range Transportation Plan AUGUST 2015
 TBARTA 2015 Regional Transportation Master Plan AUGUST 2015 Table of Contents 1.0 Introduction... 2 1.1 Updating the Master Plan... 2 1.2 About this Document... 2 2.0 Regional Long Range Transportation
Riverview Corridor Pre-Project Development Study
 Riverview Corridor Pre-Project Development Study American Society of Civil Engineers - Minnesota May 25, 2016 Work in Progress; Subject to Change 1 History 2000: Major Investment Study (MIS) offered several
Alternatives Evaluation Methodology
 Alternatives Evaluation Methodology www.vision54 56.com B 1 Phase 2 Alternatives Evaluation Methodology PASCO COUNTY METROPOLITAN PLANNING ORGANIZATION 8731 Citizens Drive New Port Richey, FL 34654 Ph
Transportation and Utilities
 4 Section 4 Transportation and Utilities 4.0 Introduction Transportation and utility systems are essential to accommodate and support development proposed in the Future Land Use Map. The following pages
3. STATION SPACING AND SITING GUIDELINES
 3. STATION SPACING AND SITING GUIDELINES The station spacing and siting guidelines are summarized in Table 3-1. Table 3-1 also includes benchmark information for local transit service and express bus as
6.0 CONGESTION HOT SPOT PROBLEM AND IMPROVEMENT TRAVEL DEMAND MODEL ANALYSIS
 6.0 CONGESTION HOT SPOT PROBLEM AND IMPROVEMENT TRAVEL DEMAND MODEL ANALYSIS 6.1 MODEL RUN SUMMARY NOTEBOOK The Model Run Summary Notebook (under separate cover) provides documentation of the multiple
Technical Report. Assessment of Potential Options for Passenger Service
 Contract 2012-001 Assessment of Potential Options for Passenger Service July 23, 2013 Prepared by: HDR Engineering, Inc. (HDR) 1. Report Summary This report evaluates the feasibility of a passenger service
Travel Demand Forecasting User Guide
 Travel Demand Forecasting User Guide A Supplement to the Regional Transitway Guidelines Metropolitan Council February 2012 This document supplements the Project Development, Leadership, and Oversight discussion
Evaluation of Alternatives
 Chapter 9.0 Evaluation of Alternatives Chapter 9.0 provides a summary evaluation of the No Build Alternative and the Preferred Alternative. The evaluation contained within this chapter is an assessment
Operations Guidelines for Metrobus in. Bus Rapid Transit/Light Rail Transit/Streetcar Corridors. Final Report
 Operations Guidelines for Metrobus in Bus Rapid Transit/Light Rail Transit/Streetcar Corridors Final Report Operations Plan for Metrobus in BRT/LRT/SC Corridors Table of Contents 1 Forward... 1 2 Executive
Chapter 4. Recommendations
 Chapter 4 Recommendations Project Rating Methodology 1.0 Introduction This chapter outlines the prioritization of potential investments that were identified during this MIS process. During this study there
VDOT and DRPT MPO and PDC Winter Meeting Amy Inman Planning & Mobility Programs Administrator Virginia Department of Rail and Public Transportation
 VDOT and DRPT MPO and PDC Winter Meeting Amy Inman Planning & Mobility Programs Administrator Virginia Department of Rail and Public Transportation www.drpt.virginia.gov 1 DRPT Customers 54 Transit Systems
Chapter 1: The MPO Board includes representatives of four local governments and four transportation authorities
 Safe, Accountable, Flexible, And Efficient Transportation Equity Act: A Legacy for Users (SAFETEA-LU). The Imagine 2040 Plan will follow the guidelines as outlined in the current Federal Transportation
METRA UP-W LINE. Locally Preferred Alternative Report
 METRA UP-W LINE Cook, Kane, and DuPage Counties Illinois Alternatives Analysis Study Document #9 Locally Preferred Alternative Report August 13, 2007 Prepared by Parsons Alternatives Analysis Documents
Chapter 4: Transportation and Land Use
 Chapter 4: Transportation and Land Use Transportation and land use together make possible the wide range of destination opportunities in the region. Transportation provides the connections, and, in turn,
A Presentation to: Project Advisory Group Meeting #7
 A Presentation to: Project Advisory Group Meeting #7 June 10, 2015 Agenda Introductions Action items from last PAG meeting (March 25, 2015) Public involvement update April Public Meetings Elected Official
An Overview of Transportation Issues in the NY Metro Area July 26, 2010
 An Overview of Transportation Issues in the NY Metro Area July 26, 2010 Joel P. Ettinger, Executive Director New York Metropolitan Transportation Council Forecast of Riders Urbanized Area Project Daily
Tampa Bay Transportation Management Area (TMA) Leadership Group
 Leadership Group") Tampa Bay Transportation Management Area (TMA) Leadership Group Representing the MPOs in Pasco, Pinellas, & Hillsborough Counties Meeting Objectives Friday, May 11, 2018 9:30 a.m. - 12:30 p.m. Pasco County
Tampa Bay Transportation Management Area (TMA) Leadership Group Representing the MPOs in Pasco, Pinellas, & Hillsborough Counties Meeting Objectives Friday, May 11, 2018 9:30 a.m. - 12:30 p.m. Pasco County
Issue Paper on Regional Land Use and Transit Planning (Draft)
") Regional Transit Long-Range Plan Update Issue Paper on Regional Land Use and Transit Planning (Draft) 401 South Jackson Street Seattle, WA 98104-2826 October 2014 Issue Pap er on Region al La nd Use an
Regional Transit Long-Range Plan Update Issue Paper on Regional Land Use and Transit Planning (Draft) 401 South Jackson Street Seattle, WA 98104-2826 October 2014 Issue Pap er on Region al La nd Use an
Sunrise Project South I-205 Corridor Improvement Project
 Sunrise Project South I-205 Corridor Improvement Project January 24, 2007 Sunrise and I-205 Project Summary Conclusions Sunrise Scoping Study Key Results South I-205 Scoping Study Key Results South I-205
Federal Way Transit Center to Tacoma Dome Light Rail
 Subarea South King/Pierce Primary Mode Light Rail Facility Type Corridor Length 9.7 miles Date Last Modified July 1, 2016 PROJECT AREA AND REPRESENTATIVE ALIGNMENT SHORT PROJECT DESCRIPTION This project
South Sounder Capital Improvements Program
 Subarea South King/Pierce Primary Mode Commuter Rail Facility Type Infrastructure Improvement Length Date Last Modified July 1, 2016 PROJECT AREA AND REP RESENTATIVE ALIGNMENT SHORT PROJECT DESCRIPTION
SIS Policy & Implementation
 SIS Policy & Implementation Performance Planning & Programming (before it was cool) presented by Carl Mikyska, Florida MPO Advisory Council October 25, 2017 Strategic Intermodal System (SIS) Background
This letter is intended for inclusion in the Public Record
 s2 Citizens for Appropriate Transportation 728 South Euclid Avenue Oak Park, Illinois 60304 www.citizensforappropriatetransportation.org This letter is intended for inclusion in the Public Record January
Chapter 14 Work Program
 Chapter 14 Work Program The Metropolitan Council will carry out or participate in many studies and plans over the next three years. This is not an exhaustive list of all work to be completed by the Metropolitan
Southern Maryland Transit Corridor Preservation Study Charles County Board of County Commissioners September 22, 2009
 Southern Maryland Transit Corridor Preservation Study Charles County Board of County Commissioners September 22, 2009 Study Overview Called for in Senate Bill 281 Southern Maryland Transportation Commission
Appendix A: Project Planning and Development A-1 White Paper on Transit and the Tappan Zee Hudson River Crossing Project
 Appendix A: Project Planning and Development A-1 White Paper on Transit and the Tappan Zee Hudson River Crossing Project Purpose of White Paper White Paper on Transit and the Tappan Zee Hudson River Crossing
Agenda. Public Input: Results from Open House 1. Evaluation Criteria: FTA and Local Considerations
 Agenda Jackson County Commuter Corridors Alternatives Analysis Stakeholder Advisory Panel Meeting Two 2:30 p.m. November 16, 2011 Kansas City Area Transportation Authority, 1200 E. 18 th, Kansas City,
MARC Brunswick/Frederick Line Improvement Proposal
 MD State Highway Administration Project No. M00695172 IS 270 Innovative Congestion Management Project MARC Brunswick/Frederick Line Improvement Proposal Action Committee for Transit November 2016 MARC
Table of Contents. Introduction 1. E1 Purpose and Need 1. E2 Alternatives Development Approach 7. E3 Tier I Alternatives 9. E4 Tier II Alternatives 13
 Table of Contents Introduction 1 E1 Purpose and Need 1 E1.1 Study Area 1 E1.2 Land Use and Zoning 3 E1.3 Demographics 3 E1.4 Transportation Facilities and Transit Services 5 E1.5 Mobility Constraints 5
Environmental Impact Statement for the Green Line to the Airport Project. ACTION: Notice of Intent to Prepare an Environmental Impact Statement (EIS).
.") This document is scheduled to be published in the Federal Register on 11/18/2015 and available online at http://federalregister.gov/a/2015-29418, and on FDsys.gov DEPARTMENT OF TRANSPORTATION Federal Transit
This document is scheduled to be published in the Federal Register on 11/18/2015 and available online at http://federalregister.gov/a/2015-29418, and on FDsys.gov DEPARTMENT OF TRANSPORTATION Federal Transit
Fairfax County Countywide Transit Network Study
 Fairfax County Countywide Transit Network Study Proposed High Quality Transit Network Concept Metropolitan Washington Council of Governments Travel Forecasting Subcommittee September 20, 2013 1 Presentation
CTA Blue Line Forest Park Branch Feasibility/Vision Study: Transit Ridership Forecasting Analysis Technical Memorandum Submitted By
 Feasibility/Vision Study: Technical Memorandum Submitted By WSP Parsons Brinckerhoff 30 N. LaSalle Street, Suite 4200 Chicago, IL 60602 December 2016 TABLE OF CONTENTS 1.0 INTRODUCTION... 1 1.1 Organization
ACTIVE TRANSPORTATION ADVISORY COMMITTEE. Memphis MPO March 30, 2015
 ACTIVE TRANSPORTATION ADVISORY COMMITTEE Memphis MPO March 30, 2015 Agenda Welcome & Introductions Announcements and Briefings Livability 2040: Regional Transportation Plan Congestion Management Process
MOBILITY 2025: THE METROPOLITAN TRANSPORTATION PLAN
 MOBILITY 2025: THE METROPOLITAN TRANSPORTATION PLAN Dan Lamers, P.E. North Central Texas Council of Governments Transportation Department www.nctcog.org/trans NORTH CENTRAL TEXAS COUNCIL OF GOVERNMENTS
Southwest Corridor Plan Project Update. June 11, 2013
 Southwest Corridor Plan Project Update June 11, 2013 The Southwest Corridor Collaborative effort Major Timeline Objectives Accountability and partnership Manage resources responsibly, foster collaborative
FROM THE CHAIR By: Michael Dorweiler, AICP 2007 Chairman for the Tampa Bay Applications Group DATES TO REMEMBER
 An Open Forum for Transportation-Related Issues TAMPA BAY APPLICATIONS GROUP February 2007 DATES TO REMEMBER Meeting dates for Tampa Bay Applications Group Year 2007 February 22 May 17 August 23 November
Los Angeles County Congestion Reduction Demonstration Project
 Los Angeles County Congestion Reduction Demonstration Project frequently asked questions update #1 /august 2008 Los Angeles County Metropolitan Transportation Authority (Metro), California Department of
Overview. Project Objectives EXECUTIVE SUMMARY FEASIBILITY STUDY FOR DEVELOPMENT OF AN IMPROVED YAMHILL COUNTY RAIL SYSTEM FOR PASSENGERS AND FREIGHT
 EXECUTIVE SUMMARY Overview This study offers a feasibility assessment for passenger commuter rail and other select rail system improvements for. This study was undertaken in light of continued growth and
Alternatives Evaluation Report. Appendix C. Alternatives Evaluation Report
 s Evaluation Report Appendix C s Evaluation Report I-35W North Corridor Project EA Minnesota Department of Transportation Final Project s Report I-35W North Corridor Preliminary Design Project Report Version
KNOXVILLE REGIONAL TRANSIT CORRIDOR STUDY
 KNOXVILLE REGIONAL TRANSIT CORRIDOR STUDY April 2013 Alignments Alignments Magnolia Ave Northeast corridor Knoxville Transit Center Hall of Fame Dr Magnolia Ave Prosser Rd. Corridor contains commercial,
MOBILITY AND ALTERNATIVES ANALYSIS
 6 MOBILITY AND ALTERNATIVES ANALYSIS BACK OF SECTION DIVIDER 6.0 Mobility and Alternatives Analysis Travel demand analysis provides a framework for the identification of transportation facilities and services
1.1 Purpose of the Project
 Chapter 1 Purpose and Need for East Link Project 1.1 Purpose of the Project The purpose of the East Link Project is to expand the Sound Transit Link light rail system from Seattle to Mercer Island, Bellevue
GULF COAST RAIL DISTRICT VISION FOR REGIONAL RAIL
 GULF COAST RAIL DISTRICT VISION FOR REGIONAL RAIL OCTOBER 2014 Cover photographs courtesy of Top left - Mike Bates TABLE OF CONTENTS MISSION... 1 INTRODUCTION... 1 VISION STATEMENT... 1 BACKGROUND... 2
Columbia Pike Transit Initiative
 The purpose of this project is to implement higher-quality and higher-capacity transit service in the corridor in order to: Provide more capacity; Enhance access within the corridor and provide connections
EXHIBIT A SCOPE OF SERVICES FOR MODAL DEVELOPMENT (MD) SUPPORT - CONTINUING. Financial Project Nos
 SUPPORT - CONTINUING. Financial Project Nos") EXHIBIT A SCOPE OF SERVICES FOR MODAL DEVELOPMENT (MD) SUPPORT - CONTINUING Financial Project Nos. 411461-1-12-10 422799-2-12-12 FLORIDA DEPARTMENT OF TRANSPORTATION DISTRICT SEVEN Revised: 07/16/18 07/10/18
EXHIBIT A SCOPE OF SERVICES FOR MODAL DEVELOPMENT (MD) SUPPORT - CONTINUING Financial Project Nos. 411461-1-12-10 422799-2-12-12 FLORIDA DEPARTMENT OF TRANSPORTATION DISTRICT SEVEN Revised: 07/16/18 07/10/18
SECTION 4. Citizen s Guide to DEIS
 SECTION 4 Citizen s Guide to DEIS This page intentionally left blank Record of Public Comment on Central Corridor Draft Environmental Impact Statement 51 The Central Corridorx Draft Environmental Impact
Regional Transitway Guidelines
 This document is made available electronically by the Minnesota Legislative Reference Library as part of an ongoing digital archiving project. http://www.leg.state.mn.us/lrl/lrl.asp Regional Transitway
INTERMODAL RAIL TRANSIT SYSTEMS ENSURING OUR ECONOMIC AND TRANSPORTATION FUTURE
 INTERMODAL RAIL TRANSIT SYSTEMS ENSURING OUR ECONOMIC AND TRANSPORTATION FUTURE INTERMODAL TRANSIT Seamless movement of passengers from one mode of transit to another through a central hub Transit modes
CHAPTER 5: TRANSPORTATION
 CHAPTER 5: TRANSPORTATION GOAL 12: TRANSPORTATION BACKGROUND SUMMARY INTRODUCTION Albany s location and transportation facilities provide excellent advantages for commerce and economic development. Albany
Connecting the Nation's Capital Transportation System
 Connecting the Nation's Capital Transportation System 12th National Light Rail Conference November 2012 Greg Benz, Henry Kay Mike Madden, Monica Meade Overview New LRT systems can provide intermodal connectively
Greenhouse Gas Emissions Are Growing
 Climate Change and Transportation TBAG Meeting October 29, 2009 Kathy Neill Office of Policy Planning Florida Department of Transportation Greenhouse Gas Emissions Are Growing Florida Gross GHG Emissions
Future of Transportation in Florida
 Future of Transportation in Florida Florida Transportation Commission Meeting of the Modes February 12, 2007 Bob Romig, Director Office of Policy Planning Florida Department of Transportation Key Trends
FLORIDA DEPARTMENT OF TRANSPORTATION PROCEDURE DEVELOPMENT OF THE
 FLORIDA DEPARTMENT OF TRANSPORTATION PROCEDURE DEVELOPMENT OF THE FLORIDA INTRASTATE HIGHWAY SYSTEM Topic No.: 525-030-250-f Office: Systems Planning Effective Date: May 16, 2002 DEVELOPMENT OF THE FLORIDA
Current Trends in Traffic Congestion Mitigation
 Current Trends in Traffic Congestion Mitigation April 24, 2009 NCSL Spring Forum Washington, DC Jeff Lindley Associate Administrator, Office of Operations Federal Highway Administration U.S. Department
Infrastructure and Growth Leadership Advisory Group Ideas and Approaches Survey
 Infrastructure and Growth Leadership Advisory Group Ideas and Approaches Survey Maintain transportation system in state of good repair 1. Increase focus on maintenance of existing infrastructure in poor
AT L A N TA B E LT L I N E C I T Y O F AT L A N TA, F U LTO N C O U N T Y, G A
 AT L A N TA B E LT L I N E C I T Y O F AT L A N TA, F U LTO N C O U N T Y, G A T I E R 1 F I N A L E N V I R O N M E N TA L I M PA C T S TAT E M E N T / S E C T I O N 4 ( F ) E VA LUAT I O N U.S. Department
Alternatives Analysis, New Starts
 Alternatives Analysis, New Starts E. Beimborn, University of Wisconsin-Milwaukee 1 Outline Overview The process at the local level FTA new starts process Project justification Financial rating Forecasting
2040 Transportation Policy Plan Amendment #1
 2040 Transportation Policy Plan Amendment #1 Overview Amendment Purpose This 2040 Transportation Policy Plan amendment adds the Riverview Modern Streetcar transitway project to the Current Revenue Scenario.
4: Transportation and Land Use
 Chapter Figure 4-1: Recent development has brought more housing and mixed use Downtown Minneapolis - looking north from E 15th Street at the Grant Street / 11th Street exit 4: Transportation and Land Use
Transit Service Guidelines
 G R E AT E R VA N CO U V E R T R A N S P O RTAT I O N A U T H O R I T Y Transit Service Guidelines PUBLIC SUMMARY REPORT JUNE 2004 Greater Vancouver Transportation Authority TRANSIT SERVICE GUIDELINES
Gateway Corridor Transitway
 Locally Preferred Alternative Summary Gateway Corridor Transitway 1 Metropolitan Council, Nov. 12, 2014 Gateway Corridor Transitway Proposed highcapacity transit improvement connecting east metro suburbs
BUS RAPID TRANSIT CORRIDOR
 DOWNTOWN UPTOWN OAKLAND EAST END BUS RAPID TRANSIT CORRIDOR Scoping Booklet for National Environmental Policy Act Review City of Pittsburgh Port Authority of Allegheny County Uptown/Downtown Scoping Meeting
Washington Metropolitan Area Transit Authority Board Action/Information Summary
 Washington Metropolitan Area Transit Authority Board Action/Information Summary nmlkj Action nmlkji Information MEAD Number: Resolution: Yes No nmlkj nmlkji TITLE: Update on Regional Transit System Plan
Alternatives Analysis Executive Summary
 Durham-Orange County Corridor APRIL 2012 Prepared for: TriangleTransit Prepared by: URS Team Executive Summary Introduction The 2035 Long Range Transportation Plan, jointly adopted by the Durham Chapel