Analysis of EBSD Data
|
|
|
- Rachel Leonard
- 6 years ago
- Views:
Transcription


1 Analysis of EBSD Data Texture, Microstructure & Anisotropy B. El-Dasher*, A.D. Rollett, M.H. Alvi, G.S. Rohrer, P.N. Kalu 1, T. Bennett 2, N. Bozzolo 3 and F. Wagner 4 *formerly at Lawrence Livermore Natl. Lab.; Intel; 1 FAMU/FSU; 2 Jamaica; 3 CEMEF, Sophia Antipolis, France; 4 LEM 3, Metz, France; Last revised: 30 th March 16
 Provides (2D regular")
 Metall. Mater. Trans.")
2 Electron Back-Scatter Diffraction (EBSD/OIM) Schematic diagram of a typical EBSD system (Oxford INCA) Provides (2D regular grid) maps of crystal orientation from polished cross-sections Adams, B., K. Kunze and S. I. Wright (1993) Metall. Mater. Trans. 24A: 819
3 Overview Understanding the program: Important menus Definition of Grains in OIM Partitioning datasets Cleaning up the data: Types Examples of Neighbor correlation Importance of reporting clean-up in reports Orientation: System Definition Distribution Functions (ODFs) Plotting ODFs
4 Overview Misorientation: Definitions - Orientation vs. Misorientation Distribution Functions (MDFs) Plotting MDFs Other tools: Plotting Distributions Interactive tools Frames of Reference: Spatial versus Euler frames Different suppliers of software Issues with Hexagonal materials Important: the menus change as the software packages are updated. Although this lecture is illustrated from (older versions of) the TSL software, similar functions area available in other EBSD analysis software. Mtex also provides a number of the analysis functions.
5 Questions & Answers How are Orientation Distributions computed? The discrete orientations provide the input data to which the coefficients of the generalized spherical harmonic functions are fitted. What is the difference between a discrete plot and a contour plot and when should I use them? The discrete plots provide individual points in pole figures, inverse pole figures, ODs etc. Contour plots are always based on the fitted generalized spherical harmonic functions. What is meant by the various different measures of orientation spread within a grain, and what are they useful for? The names given to the functions vary across the packages. There is a pixel-based measure that computes the average of the misorientation between a given point/pixel and its first nearest neighbor points (generally, 8 NN in a square lattice); there is also an average over all points in a given grain (e.g. Grain Average Misorientation). This is sensitive to only local orientation gradients. There is also a pixel-based measure that gives the misorientation between the given point and the average orientation for the grain; likewise there is an average quantity for the whole grain. This pair of measures are sensitive to long range orientation gradients (found, e.g., in shear bands, kink bands etc.).
6 Questions & Answers Why do I have to worry about reference frames? Orientations are given in reference to a frame that is different from the frame in which the coordinates of the image; see the notes for details. Different softwares have different alignments, and hexagonal materials are a particular problem because of different conventions for the alignment of the orthonormal frame used for calculation versus the crystallographic frame of reference. What is clean-up? Clean-up is a generic term for the various steps used to remove unreliable or non-indexed points from the map and replace them with (in general) more reliable orientations from neighboring pixels. Generally speaking, the methods are analogous to erosion and dilation used in image processing. How is the grain structure determined (slide 9)? The procedure that is typically used is known as a burn algorithm in percolation analysis. One starts at an arbitrary pixel location and uses it as the starting point of a grain; add any nearest neighbor pixel to the grain that has a misorientation with the first point less than some user-chosen threshold. Repeat until no more points can be added according to the threshold. The largest threshold typically used is 15, i.e. the limit for low-angle boundaries in cubic materials.


7 Navigating the menus There are two menus that access virtually everything: Check the scan stats Creates new partitions Rotate the orientations of each point about sample frame Cut out scan sections Check the partition stats & definition Change the partition properties: - Decide which points to include - Define a grain Imports data as partitions Access to routines that cleanup the dataset Use this to export text.ang files Access to menu for: - Maps - Texture calculation - Texture plots Export grain ID data associated with each point
")
8 Grain Definitions OIM defines a set of points to constitute a grain if: - A path exists between any two points (in the set) such that it does not traverse a misorientation angle more than a specified tolerance - The number of points is greater than a specified number Points with a CI less than specified are excluded from statistics Note: Points that are excluded are given a grain ID of 0 (zero) in exported files


9 Grain Definitions Examples of definitions 3 degrees 15 degrees Note that each color represents 1 grain


10 Partitioning Datasets - Choose which points to include in analysis by setting up selection formula Use to select by individual point attributes Use to select by grain attributes Selection formula is explicitly written here


11 Data Cleanup Grain Neighbor Dilation: CI Standardization: CI Phase Orient. Correlation Correlation - - Acts Changes Performed Same only as on the Grain only points CI all Dilation of all that points points do but with not the belong within CI instead dataset less a to than grain of any using a grain to given be the as that minimum grain defined of with the - highest - most For A The point cleanup number orientation within becomes level of each neighboring and part n: grain CI of of the the grain - neighbor points, - Most Condition with useful the with the phase 1: if most highest Orientation a minimum with number CI the is of most CI of 6-n surrounding criterion assigned number nearest is of neighbors to used neighboring points these points analyzing is different points is - data - used than Takes Use (prevents current when the orientation majority point low CI of and points CI of within are (misorientation the high neighboring a grain CI, and from angle only point being a > few with chosen) lost) bad highest points Output - Condition exist CI Options: 2: Orientation of 6-n - nearest Use to remove neighbors bad is points the same due to - as Overwrite pits each or at other G.Bs current dataset - If both conditions are met, the - point s Create orientation cleaned up is chosen dataset to as a be new a neighbor s dataset at random - Repeat low cleanup levels -(n=3 Write max) the cleaned until no more up dataset points directly change to for file best results
 Level 3")
12 Neighbor Correlation Example No Cleanup Level 0 Note that Higher cleanup levels are iterative (i.e. Level 3= Levels 0,1,2,3) Level 3
13 Definition of Orientation By definition an orientation is always relative. The OIM uses the sample surface to define the orthogonal reference frame. e 2 s e 1 s Quantities are transformed from sample frame to crystal frame ϕ 1 Φ ϕ 2 NB: a more comprehensive discussion of reference frames is given later
14 Reference Frames This next set of slides is devoted to explaining, as best we can, how to relate features observed in EBSD images/maps to the Euler angles. In general, the Euler frame is not aligned with the x-y axes used to measure locations in the maps. The TSL (OIM ) and Channel (HKL) softwares both rotate the image 180 relative to the original physical sample. Both TSL (OIM ) and Channel (HKL) softwares use different reference frames for measuring spatial location versus the the Euler angles, which is, of course, extremely confusing.
15 TSL / OIM Reference Frames Z spatial points in to the plane Z Euler points out of the plane TD = y Euler = 010 sample x spatial The purple line indicates a direction, associated with, say, a scratch, or trace of a grain boundary on the specimen. Physical specimen: Mounted in the SEM, the tilt axis is parallel to x spatial ND = z Euler -RD = -x Euler RD = x Euler =100 sample Sample Reference Frame for Orientations/Euler Angles -TD = -y Euler + denotes the Origin + y spatial Image: Note the 180 rotation. x spatial + y spatial Crystal Reference Frame: Remember that, to obtain directions and tensor quantities in the crystal frame for each grain (starting from coordinates expressed in the Euler frame), one must use the Euler angles to obtain a transformation matrix (or equivalent). Z spatial Reference Frame for Spatial Coordinates
16 TSL / OIM Reference Frames for Images Conversion from spatial to Euler and vice versa (TSL only) From Herb Miller s notes: The axes for the TSL Euler frame are consistent with the RD-TD-ND system in the TSL Technical Manual, but only with respect to maps/images, not the physical specimens. The axes for the HKL system are consistent with the information provided by users in Metz. Here, x is in common, but the two y-axes point in opposite directions. # & % ( % ( $ 0 0 1' Note that the transformation is a 180 rotation about the line x=y Notes: the image, as presented by the TSL software, has the vertical axis inverted in relation to the physical sample, i.e. a 180 rotation.
17 TSL / OIM Reference Frames: Coordinates in Physical Frame, Conversion to Image The previous slides make the point that a transformation is required to align spatial coordinates with the Euler frame. However, there is also a 180 rotation between the physical specimen and the image. Therefore to align physical markings on a specimen with traces and crystals in an image, it is necessary to take either the physical data and rotate it by 180, or to rotate the crystallographic information. -RD = -x Euler ND = z Euler x spatial Sample Reference Frame for Orientations -TD = -y sample Z spatial + y spatial How to measure lines etc. on a physical specimen? Answer: use the spatial frame as shown on the diagram to the left (which is NOT the normal, mathematical arrangement of axes) and your measured coordinates will be correct in the images, provided you plot them according to the IMAGE spatial frame. The purple line, for example, will appear on the image (e.g. an IPF map) as turned by 180 in the x-y plane.
18 Cartesian Reference Frame for Physical Measurement y Euler x Euler y Cartesian # 0 1 0& % ( % ( $ 0 0 1' x Cartesian How to measure lines etc. on a physical specimen using the standard Cartesian frame with x pointing right, and y pointing up? Answer: use the Cartesian frame as shown on the diagram to the left (which IS the normal, mathematical arrangement of axes and is NOT the frame used for point coordinates that you find in a.ang file). Apply the transformation of axes (passive rotation) as specified by the transformation matrix shown and then your measured coordinates will be in the same frame as your Euler angles. This transformation is a +90 rotation about z sample. In this case, the z-axis points out of the plane of the page.

19 TSL / OIM Reference Frames: Labels in the TSL system = y spatial = x Euler = x spatial = y Euler The diagram is reproduced from the TSL Technical Manual (v5 and older); the designation of RD, TD and ND is only correct for Euler angles in reference to the plotted maps/ images, not the physical specimen What do the labels RD, TD and ND mean in the TSL literature? The labels should be understood to mean that RD is the x-axis, TD is the y- axis and ND the z-axis, all for Euler angles (but not spatial coordinates). The labels on the Pole Figures are consistent with the maps/images (but NOT the physical specimen). The labels on the diagram are consistent with the maps/images, but NOT the physical specimen, as drawn. The frame in which the spatial coordinates are specified in the datasets is different from the Euler frame (RD-TD-ND) see the preceding diagrams for information and for how to transform your spatial coordinates into the same frame as the Euler angles, using a 180 rotation about the line x=y.
20 TSL versus HKL Reference Frames The two spatial frames are the same, exactly as noted by Changsoo Kim and Herb Miller previously. The figures show images (as opposed to physical specimen)." The Euler angle references frames differ by a rotation of +90 (add 90 to the first Euler angle) going from the TSL to the HKL frames (in terms of an axis transformation, or passive rotation). Vice versa, to pass from the HKL to the TSL frame, one needs a rotation of -90 (subtract 90 from the first Euler angle)." The position of the sample axes is critical. The names RD and TD do not necessarily correspond to the physical rolling direction and transverse direction because these depend on how the sample was mounted in the microscope." TD =010 sample = y Euler Z (x) + RD =100 sample = x Euler x spatial Z (x) RD =100 sample = x Euler + TD =010 sample = y Euler x spatial y spatial y spatial HKL TSL

21 Test of Euler Angle Reference Frames Φ φ 1 Hexagonal crystal symmetry (no sample symmetry) Euler angles: 17.2, 14.3, 0.57 HKL A simple test of the frames used for the Euler angles is to have the softwares plot pole figures for a single orientation with small positive values of the 3 angles. This reveals the position of the crystal x-axis via the sense of rotation imposed by the second Euler angle, Φ. Clearly, one has to add 90 to φ 1 to pass from HKL coordinates to TSL coordinates. Note that the CMU TSL is using the x//1120 convention ( X convention ), whereas the Metz Channel/HKL software is using the y// 1120 convention ( Y convention ). Φ φ 1 TSL
22 The Axis Alignment Issue for Hexagonal The issue with hexagonal materials is the alignment of the Cartesian coordinate system used for calculations with the crystal coordinate system (the Bravais lattice). In one convention (e.g. popla, TSL), the x-axis, i.e. [1,0,0], is aligned with the crystal a 1 axis, i.e. the [2,-1,-1,0] direction. In this case, the y-axis is aligned with the [0,1,-1,0] direction. In the other convention, (e.g. HKL, Univ. Metz software), the x-axis, i.e. [1,0,0], is aligned with the crystal [1,0,-1,0] direction. In this case, the y-axis is aligned with the [-1,2,-1,0] direction. See next page for diagrams. This is important because texture analysis can lead to an ambiguity as to the alignment of [2,-1,-1,0] versus [1,0,-1,0], with apparent 30 shifts in the data. Caution: it appears that the axis alignment is a choice that must be made when installing TSL software so determination of which convention is in use must be made on a case-by-case basis. It is fixed to the y-convention in the HKL software. The main clue that something is wrong in a conversion is that either the 2110 & 1010 pole figures are transposed, or that a peak in the inverse pole figure that should be present at 2110 has shifted over to 1010.
23 Hexagonal Materials: Diagram of Axes a 3 // [1 1 20] y // [010] Cartesian a 2 // [ ] [01 1 0] a 1 // [21 10] x // [100] Cartesian [101 0] [uvwx] Direction Cartesian/ x-convention Cartesian/ y-convention [2 1 10] +1, 0, 0 + 3, -1, 0 [121 0] -1, + 3, 0 0, 1, 0 [1 120] -1, - 3, 0-3, -1, 0 [101 0] + 3, +1, 0 1, 0, 0 [011 0] 0, +1, 0 +1, + 3, 0 [11 00] + 3, -1, 0 +1, - 3, 0
24 Euler Angles To add to the confusion, all of the different Euler angle conventions can, and are used for hexagonal materials. Recall that Bunge Euler angles make the second rotation about the x-axis, whereas Roe, Matthies and Kocks angles rotate about the y-axis. Generally speaking there is no problem provided that one stays within a single software analysis system for which the indexing is self-consistent. There are, however, known issues with calculation of inverse pole figures in the popla package.
25 Xpix HKL frames Ypix Z1 top Ypix Xpix bottom Euler angle reference frame X1 Y1 CS1 = raw data format first acquired pixel (Xpix=1,Ypix=1) CS0 is modified by the user to align axes however they please. The CTF format always exports in CS0 arrangement. "Virtual chamber" of HKL software, which is used to define the specimen orientation in the microscope chamber (= how to align frame_0 with frame_1); picture is drawn as if the observer was the camera. Note that the maps are turned by 180 with respect to this picture. - original Euler angles are given in frame_1 (also called CS1) The ctf format is designed to export Euler angle into frame_0 (CS0), which is correct, provided that the specimen orientation is correctly defined. 25
26 HKL software keeping CS0 (sample frame) aligned with CS1(microscope frame) relying on what the virtual chamber is showing : Xpix Ypix Z1 Xpix top Ypix bottom CS1 first acquired pixel (X spatial =1,Y spatial =1) = top left pixel of the resulting map X1 Y1 CS1 as shown in the virtual chamber but this alignment is not consistent with the axes of the PF plots or with previous experience with data sets from the HKL software


27 Beta-transformed Ti (from Nathalie Gey, LETAM now LEM3) Traces of {10-10} planes (Z0 pointing out) Xspatial Euler frame Yspatial EBSD map Xpix, Ypix = spatial frame X0,Y0,Z0 = euler angle frame, supposed to be aligned with X1,Y1,Z1 (µscope frame) Note that a rotation of the PF axes by 180 around Z to recover the frame numbered 3 on the PF plots, would also be consistent with the trace being perpendicular to <10-10> Spatial frame
28 Notes on HKL Frames There is a discrepancy in the HKL software between how the frame CS1 (and CS0) is represented in the virtual chamber and how the PF axes are placed The difference is a rotation by 180 around the Z direction (frame numbered 2 versus frame 3) It is not possible to determine which one is correct from the two previous slides Nevertheless, the test maps acquired with LETAM's HKL system and with MRSEC's TSL one did show that the frame number 2 was the correct one
 function Fast")

29 Orientation Distribution Functions The ODF displays how the measured orientations are distributed in orientation space Two types of distributions can be calculated: Discrete Continuous ODF: ODF: Bin Generalized size defines Spherical the volume Harmonic of each Functions: element Rank in defines orientation the space resolution (5 o x5of o x5 the o ) function Fast Equivalent calculation to a Fourier transform Calculation time rises steeply with Suitable for most texture rank number (32 is an effective strengths maximum) but not weak textures if Time the number intensive of grains is small (consider Mostly appropriate the number for weaker of data points textures per cell required to achieve Some smoothing reasonably is inherent low noise)


 more Used than to visualize one PF, they The indices")

30 Plotting Orientation Distributions One must select the types of data visualization desired Euler Inverse Pole space figures Pole plot Figures show the are distribution shows used to the illustrate distribution of specific which of crystal intensity plane planes as normals a w.r.t. are sample function parallel reference of the to Euler sample frame angles directions For the (generally generation RD, of TD & ND) more Used than to visualize one PF, they The indices entered need pockets represent to of be texture which added sample as one at a well reference time. as fiber frame textures plane is being Resolution considered: defines 100, 010 how and 001 many are slices typical are choices possible Multiple in planes the plot also need to be entered one at a time


31 Types of ODF/Pole Figure/ Inverse PF Plots Choose texture and desired plot type Use to add multiple plots to the same image NB: a more comprehensive discussion of reference frames is given later
32 Preparation of the data for analysis Courtesy of N. Bozzolo The Average Orientation of the pixels in a grain is given by this equation: q = (q 1 + q q N ) / q 1 + q q N. Very simple, n est-ce pas? However, there is a problem... As a consequence of the crystal symmetry, there are several equivalent orientations. This example illustrates the point: {111} RD orientations near to the Brass component: represented by a {111} pole figure and, in the complete Euler space to show the 24 equivalents resulting from application of cubic crystal symmetry i=1,24 M(g) équivalent = M(g) mesuré. S i [ ] cristal Cho J H, Rollett A D and Oh K H (2005) Determination of a mean orientation in electron backscatter diffraction measurements, Metall. Mater. Trans. 36A


33 Parameters for texture analysis: example of Zr alloy ϕ 1 =0 ϕ 1 =5 ϕ 1 =10 ϕ 1 =15... max = Courtesy of N. Bozzolo, CEMEF
34 Parameters for texture analysis Courtesy of N. Bozzolo Resolution 32x32x16 Gaussian 3 L max 22 Bin Size 5 Effect of the binning resolution 16x16x max = 5.56 Effect of the width of the Gaussian 32x32x max = 5.37 max = 4.44

35 Effect of the maximum rank in the series expansion, L max Resolution 32x32x16 Gaussian 3 L max 22 Bin Size 5 Courtesy of N. Bozzolo L max = 34 L max = 22 L max = 16 L max = 8 L max = 5 max = 6.36 max = 5.56 max = 5.17 max = 4.04 max = 2.43 Clearly, taking the fitting to higher order (angular frequency) provides better resolution of the texture


36 Direct Method Courtesy of N. Bozzolo max = 5.56 In effect the harmonic method gives some smoothing". Without this, a coarse binning of, say, 10, produces a very lumpy result because the Gaussian applied around each point is not sufficiently wide to give a continuous distribution. Same, with 10 binning : max = 31! ϕ 1 =5
37 Statistical Aspects Texture = distribution of orientations Problem of sampling! 8.2 at { } 9.0 at { } 15.5 at { } Triclinic sample symmetry Number of grains measured Width of the Gaussian ( and/or L max ) Influence of the sample symmetry 7.1 at { } grains 6.9 at { } grains 7.3 at { } 2000 grains Orthorhombic sample symmetry 6.6 at { } 6.7 at { } 5.8 at { } Zirconium, equiaxed Sections thru the OD at constant ϕ 1 (L max = 34) Courtesy of N. Bozzolo 7.6 at { } 7.9 at { } 8.3 at { }


")
 equiaxed Ti RD {10.0} (00.")
38 Statistical Aspects Homogeneity/heterogeneity of the specimen... Courtesy of N. Bozzolo Not just the number of grains must be considered but also their spatial distribution: Single EBSD map (1 mm 2 ) Multiple maps, different locations ( total =1 mm 2 ) equiaxed Ti RD {10.0} (00.1) TD ND asymmetry of intensity
 ϕ 1 = 0 Φ 7.41 90 0 ϕ 60 2 Global texture 0.7 1.4 2.0 2.8 4.0 5.6 8.0 11.3 16.")

39 Texture Microstructure Coupling 0 Example : partial texture of populations of grains identified by a grain size criterion (zirconium at the end of recrystallization ) ϕ 1 = 0 Φ ϕ 60 2 Global texture Important for texture evolution during grain growth: the large grains grow at the expense of the small grains. Since the large grains have a different texture, the overall texture also changes during growth. partial texture of the largest grains D > 2D (=11 µm) 3496 grains 17.9% surf. Partial texture of the smallest grains D < D/2 (=2.75 µm) grains 1.7% surf.
40 Definition of Misorientation z g A -1 g B x y Misorientation is an orientation defined with another crystal orientation frame as reference instead of the sample reference frame Thus a misorientation is the axis transformation from one point (crystal orientation) in the dataset to another point x,y,z are sample reference axes g A is orientation of data point A (reference orientation) w.r.t sample reference g B is orientation of data point B w.r.t. sample reference Misorientation = g B g A -1


41 Misorientation Distribution Functions Calculating MDFs is very similar to calculating ODFs Correlated Uncorrelated Texture Reduced: MDF: MDF: Misorientations Requires both are calculated Correlated only between and all between pairs Uncorrelated of orientations neighbors MDFs to in dataset be If calculated the misorientation for the is same This greater is plot the than type texture the grain derived This definition MDF MDF is simply as angle, it effectively the data Correlated point is is / included calculated Uncorrelated from values the ODF This May effectively be used to only plots amplify Only the effectively any features used in misorientations if the the correlated sample has MDF weak between texture neighboring points across a G.B. Again the function can be either discrete or continuous


 Use to generate plot")
42 Plotting MDFs Again, you need to choose what data you want to see Select the Texture dataset Select the plot type (axis/ angle ; Rodrigues; Euler) Use to generate plot sections

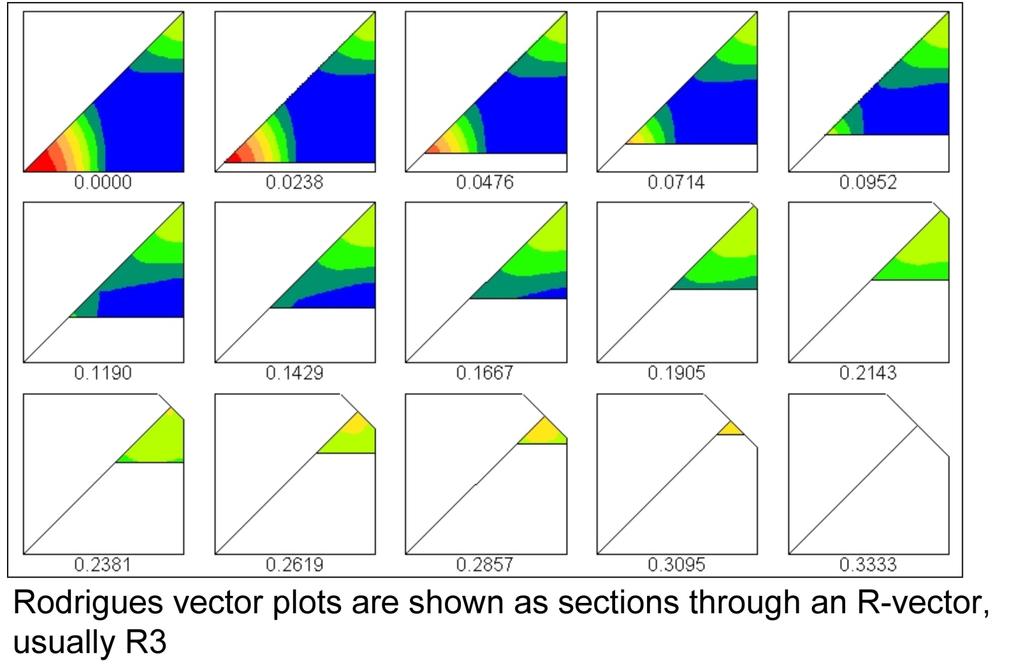
43 Sections through Misorientation Space


44 Charts Charts are easy to use in order to obtain statistical information Increasing bin #
45 Kernel Average Misorientation (KAM) For each point (orange box), compute the misorientation (θ, angle only, purple arrows) for each nearest neighbor (26 in 3D). For all values < chosen threshold (ψ, say, = 5 ) compute an average value. Use of a threshold eliminates any contribution from high angle boundaries. High values indicate orientation gradients, obviously, which are closely related to GND. Averaged over a grain gives Grain Ave. Misorientation (GAM) neighbor g = {O c }g B g A -1 {O c } neighbor neighbor neighbor KAM = θ( g point,g ) neighbor θ <ψ Why is KAM important? Nucleation of recrystallization, e.g. 45
46 Intra-Granular Misorientation (IGM) For all points in a given grain compute an average value, g GrainAverage. For each point, compute the misorientation (θ, angle only) with the average orientation. High values indicate large differences from the grain averaged orientation. Variation from dark (large IGM) to light (small IGM) shows the idea. Sometimes called the Grain Reference Deviation (GRD). When averaged over the grain, one obtains the Grain Orientation Spread (GOS). IGM x g = {O c }g B g A -1 {O c } ( ) =θ g x ( ( ), g ) GrainAverage Why is IGM important? Long range orientation gradients, for example 46
, N 1 N j=1 i=1 j i GAM Nearest neighbor pixel pairs short range")
47 47 GOS and GAM 1 1 N n GAM = Δgij ( gi,g j ) N n j=1 i=1 n = no. nearest neighbors N = number of pixels 1 1 N N GOS = Δgij (gi,g j ), N 1 N j=1 i=1 j i GAM Nearest neighbor pixel pairs short range orientation gradients GOS M.H. Alvi All pixel pairs long range orientation gradients


48 48 GOS and GAM Recrystallized Recrystallized Unrecrystallized Unrecrystallized GAM GOS Overlapping peaks for deformed and recrystallized regions M.H. Alvi


49 49 Partitioned scan: threshold GOS = 3 Deformed Grains Recrystallized Grains Cube texture in hot rolled Aluminum Alloy 1050 (AA1050) - nucleation and growth behavior, M. H. Alvi, S. W. Cheong, J. P. Suni, H. Weiland, A. D. Rollett, Acta materialia, (2008).

50 As-deformed Fe-1%Si Intergranular variations in GOS greater in 8% temperrolled material. Maps shaded according to GOS. AGG is a local phenomenon. AGG occurs more readily in 8% material because of greater local intergranular orientation gradients. Density of abnormally large grains will be higher in the 8% material. Presence of several samestored-energy regions in 1.5% material leads to lower density of abnormally large grains. Grains that grow abnormally already exist in the as-deformed material. "Strain-Induced Selective Growth in 1.5 % Temper-Rolled Fe similar to 1 % Si", Tricia A. Bennett, Peter N. Kalu; Anthony D.50 Rollett, Microscopy and Microanalysis, 17(3) (2011)


51 Orientation Spread, Fe-1%Si 1.5% and 8% temper-rolled Fe-1%Si, annealed in air at 787 C for various times. 1.5% temper-rolled 60min. min min. 30 8% temper-rolled 0.5 min. 15 min. min. 530 min. T.A. Bennett Overall, GOS decreases with annealing time. 51


52 Pure Nb: Longitudinal Section Etched 3mm from top of cavity Inner surface of cavity Secondary electron image Backscattered electron image EBSD Grid R. Crooks 52

53 Nb: EBSD IPF Map R. Crooks Crystal directions normal to sheet surface Color changes within grain show distortion of crystal 95% hit rate, 560,200 data points, 1 µm spatial resolution 53


54 Nb: EBSD GOS Map Strain in isolated grains GOS: The average orientation is first calculated for each grain. The spread is then the average deviation between the orientation of each point in the grain and the grain average. R. Crooks 1 µm spatial resolution As-received sheet 54

55 0 Nb: EBSD KAM Map Stored Strain Energy very high at 500 µm from inner surface R. Crooks 1 µm spatial resolution 55

56 Nb: EBSD IPF Map 500 µm deep 750 x 500, 0.3 µm spatial resolution R. Crooks 56

57 Nb: EBSD GOS Map 500 µm deep 0.3 µm spatial resolution R. Crooks 57

58 Nb: EBSD KAM Map 500 µm deep KAM 3 rd neighbor x 0.3 µm spatial resolution Stored Strain Energy R. Crooks 58

59 Nb: EBSD GROD Map 500 µm deep Severely deformed, >15 in 50 µm Deviation from grain minimum KAM R. Crooks 0.3 µm spatial resolution 59

60 Nb: Backscattered electron image Channeling contrast of Polished and etched surface resembles EBSD map In as-deep-drawn condition, severe strain located in pockets through-thickness. Greater strain at 300 and 500 µm than at surface. R. Crooks 60
 list of line segment data.")

.")
61 Reconstructed Boundaries The Data software MUST be includes on an analysis of grain boundaries that outputs hexagonal the grid information as a (long) list of line segment data. use Clean of up the the GB data segment to analysis is an essential preliminary step before desired performing level the stereological 5-parameter analysis of GBCD. The Choose data boundary must be on a hexagonal/triangular grid. If you have a map deviation a limit square grid, you must convert it to a hexagonal grid. Use the Generate software a called map with OIMTools to do this (freely available fortran program). reconstructed boundaries selected Export g.b. data into text file This type of data is required for stereological analysis of 5-parameter grain boundary character
62 Geometrically Necessary Dislocations (GND) Orientation gradients in (crystalline) metals and ceramics can be accommodated in various ways. 1. Elastic distortions of the lattice 2. Arrays of dislocations 3. Grain boundaries (high angle) 4. Disclinations Ceramics rarely exhibit orientation gradients because they are difficult to deform plastically (high Peierls stress). Elastic distortions are likely to be extremely small in metals because of the low resistance to dislocation motion, generally speaking. Dislocation arrays are how orientation gradients are produced within grains. This dislocation content is known as the Geometrically Necessary Dislocation density (GND) and represents a lower bound on the dislocation density. Statistically stored dislocations are considered to be unobservable at the scale of EBSD. GND is created during the plastic deformation of metals. High angle grain boundaries with atomically disordered interface structures also accommodate orientation gradients (in the sense of a sharp interface limit). Disclinations are an alternative approach to accommodating orientation gradients. They are more controversial because there are very few direct observations of disclinations, by contrast to lattice dislocations.
63 GND, contd. We now address the analysis of GND. There is a tensor known as the dislocation tensor or Nye s tensor, α. α ij = e ikl ε e jl,k + g jl,k ( ) Here, ε e is the elastic strain tensor and g is the lattice orientation expressed as an orientation matrix in the usual fashion. In the absence of long-range elastic stress fields, Nye s original formulation of the dislocation tensor is obtained: α ij = e ikl g jl,k The dislocation tensor can thus be directly calculated from the observable, i.e. the gradient of the orientation field. We can also write: α = curl(g) J.F. Nye, Some geometrical relations in dislocated crystals Acta Metall., 1, 153 (1953). El-Dasher et al., Viewpoint: experimental recovery of geometrically necessary dislocation density in polycrystals Scripta mater. 48, 141.
64 Nye tensor to GND content Nye s original work also shows a precise connection between the dislocation tensor and the local dislocation network, formally expressed as: α ij = K k=1 ρ k b ikẑ j k Here, ρ is the dislocation density of the k th dislocation type, b is the associated Burgers vector and z is the corresponding line direction. There are 1 through K dislocations types. It is typical to make the line direction discrete, i.e. either edge (perpendicular to the Burgers vector) or screw type (parallel to b). In fcc metals with 6 distinct <110> Burgers vectors, this gives 18 dislocation types because each <110> edge can exist on two different slip planes. The analytical challenge is, therefore, the undetermined nature of the equation because there are more free variables on the RHS than (derived) observables on the LHS. Generally speaking, numerical methods such as simplex must be resorted to, combined with a constraint such as minimization of the total dislocation line length.
65 Disclination analysis Analyzing orientation gradients in terms of disclinations has been known for many years. Disclinations can be thought of as wedges on a continuum basis. Isolated disclinations have divergent strain fields but disclination dipoles are similar (but not the same as) arrays of edge dislocations. Disclination analysis has been developed by a number of people such as Romanov; most recently Fressengeas and Capolungo.
66 Disclinations, analysis To make a start, consider the gradient of the displacement field, formally the distortion tensor and equivalent to strain. U = grad(u) Consider the incompatible elastic distortion of the lattice that arises to maintain lattice continuity. The curl of this tensor provides the same Nye tensor as before. α = curl(u e ) curl(g) There is a similar equation for the disclination density, θ, based on the curl of the elastic curvature, κ e : θ = curl(κ e ) The tricky part is how to obtain the elastic curvature from the observable, i.e. the orientation field, g. Here, ω e is the rotation vector, obtained from the misorientation rotation matrix, g. κ e = grad( ω e ); ω i e = e ijk g jk ; thus κ ij e ω i / x j ;θ ij e jkl ω i / x l / x k
67 Disclinations, analysis, contd. It is useful to note that one can always compute the Nye tensor and fit a dislocation density to this value at each point. The curl of the curvature tensor, κ e, which is the disclination vector, is assumed to be zero for this. If this field is non-zero, then a disclination field is present. This disclination field can be regarded as a quantification of the rotation defects present in the material. Recent papers on this topic include these: - M. Upadhyay, L. Capolungo, V. Taupin, C. Fressengeas, Grain boundary and triple junction energies in crystalline media: A disclination based approach, International Journal of Solids and Structures 48 (2011) C. Fressengeas, V. Taupin, M. Upadhyay, L. Capolungo, Tangential continuity of elastic/plastic curvature and strain at interfaces, International Journal of Solids and Structures 49 (2012)
Crystallographic orientation
 Crystallographic orientation Orientations and misorientations Orientation (g): The orientation of the crystal lattice with respect to some reference frame; usual a frame defined by the processing or sample
Orientation Distribution (OD)
") Orientation Distribution (OD) The Orientation Distribution (OD) is a central concept in texture analysis and anisotropy. Normalized probability* distribution, is typically denoted by f in whatever space
Orientation Distribution (OD) The Orientation Distribution (OD) is a central concept in texture analysis and anisotropy. Normalized probability* distribution, is typically denoted by f in whatever space
Symmetry and Anisotropy Structure, Properties, Sample and Material, Texture and Anisotropy, Symmetry
 Symmetry and Anisotropy Structure, Properties, Sample and Material, Texture and Anisotropy, Symmetry Objectives Symmetry Operators & Matrix representation. Effect of crystal and sample symmetry
Crystallographic Distribution of Low Angle Grain Boundary Planes in Magnesium Oxide
 Citation & Copyright (to be inserted by the publisher ) Crystallographic Distribution of Low Angle Grain Boundary Planes in Magnesium Oxide D.M. Saylor 1, A. Morawiec 2, K.W. Cherry 1, F.H. Rogan 1, G.S.
The effect of different step-size on the visualization of crystallographic defects using SEM/EBSD technique
 Int. Jnl. of Multiphysics Volume 9 Number 1 2015 37 The effect of different step-size on the visualization of crystallographic defects using SEM/EBSD technique Yoshikazu HIGA*, Ken SHIMOJIMA and Takashi
{001} Texture Map of AA5182 Aluminum Alloy for High Temperature Uniaxial Compression
 Materials Transactions, Vol., No. (00) pp. 6 to 67 #00 The Japan Institute of Light Metals {00} Texture Map of AA8 Aluminum Alloy for High Temperature Uniaxial Compression Hyeon-Mook Jeong*, Kazuto Okayasu
Introduction to Electron Backscattered Diffraction. TEQIP Workshop HREXRD Feb 1 st to Feb 5 th 2016
 Introduction to Electron Backscattered Diffraction 1 TEQIP Workshop HREXRD Feb 1 st to Feb 5 th 2016 SE vs BSE 2 Ranges and interaction volumes 3 (1-2 m) http://www4.nau.edu/microanalysis/microprobe/interact-effects.html
Modeling the evolution of orientation distribution functions during grain growth of some Ti and Zr alloys
 Materials Science Forum Vols. 558-559 (2007) pp. 1163-1168 online at http://www.scientific.net (2007) Trans Tech Publications, Switzerland Modeling the evolution of orientation distribution functions during
Distribution and Energies of Grain Boundaries in Magnesia as a Function of. Five Degrees of Freedom
 Distribution and Energies of Grain Boundaries in Magnesia as a Function of Five Degrees of Freedom David M. Saylor a, Adam Morawiec b, Gregory S. Rohrer c Materials Science and Engineering Dept., Carnegie
In-situ Observation of Microstructure Change in Steel by EBSD
 NIPPON STEEL & SUMITOMO METAL TECHNICAL REPORT No. 114 MARCH 2017 Technical Report UDC 621. 785. 36 In-situ Observation of Microstructure Change in Steel by EBSD Masayuki WAKITA* Seiichi SUZUKI Abstract
Chapter 8 Strain Hardening and Annealing
 Chapter 8 Strain Hardening and Annealing This is a further application of our knowledge of plastic deformation and is an introduction to heat treatment. Part of this lecture is covered by Chapter 4 of
Distribution of grain boundaries in aluminum as a function of five macroscopic parameters
 Acta Materialia 52 (2004) 3649 3655 www.actamat-journals.com Distribution of grain boundaries in aluminum as a function of five macroscopic parameters David M. Saylor 1, Bassem S. El Dasher 2, Anthony
Recrystallization Theoretical & Practical Aspects
 Theoretical & Practical Aspects 27-301, Microstructure & Properties I Fall 2006 Supplemental Lecture A.D. Rollett, M. De Graef Materials Science & Engineering Carnegie Mellon University 1 Objectives The
Three-Dimensional Microstructure Reconstruction Using FIB-OIM
 Materials Science Forum Vols. 558-559 (2007) pp. 915-920 online at http://www.scientific.net (2007) Trans Tech Publications, Switzerland Three-Dimensional Microstructure Reconstruction Using FIB-OIM S.-B.
Homework 6: Calculation of Misorientation; A.D. Rollett, , Texture, Microstructure and Anisotropy
 Homework 6: Calculation of Misorientation; A.D. Rollett, 27-75, Texture, Microstructure and Anisotropy Due date: 8 th November, 211 Corrected 8 th Nov. 211 Q1. [6 points] (a) You are given a list of orientations
Microstructure Evolution of Polycrystalline Pure Nickel during Static Recrystallization 1
 Materials Transactions, Vol. 43, No. 9 (2002) pp. 2243 to 2248 c 2002 The Japan Institute of Metals Microstructure Evolution of Polycrystalline Pure Nickel during Static Recrystallization 1 Makoto Hasegawa
Carnegie Mellon MRSEC
 Carnegie Mellon MRSEC Texture, Microstructure & Anisotropy, Fall 2009 A.D. Rollett, P. Kalu 1 ELECTRONS SEM-based TEM-based Koseel ECP EBSD SADP Kikuchi Different types of microtexture techniques for obtaining
Influence of Crystal Orientations on the Bendability of an Al-Mg-Si Alloy
 Materials Transactions, Vol. 51, No. 4 (2010) pp. 614 to 619 Special Issue on Crystallographic Orientation Distribution and Related Properties in Advanced Materials II #2010 The Japan Institute of Light
3. Anisotropic blurring by dislocations
 Dynamical Simulation of EBSD Patterns of Imperfect Crystals 1 G. Nolze 1, A. Winkelmann 2 1 Federal Institute for Materials Research and Testing (BAM), Berlin, Germany 2 Max-Planck- Institute of Microstructure
Twins & Dislocations in HCP Textbook & Paper Reviews. Cindy Smith
 Twins & Dislocations in HCP Textbook & Paper Reviews Cindy Smith Motivation Review: Outline Crystal lattices (fcc, bcc, hcp) Fcc vs. hcp stacking sequences Cubic {hkl} naming Hcp {hkil} naming Twinning
Homework 6: Misorientations; Solution A.D. Rollett, , Texture, Microstructure and Anisotropy. Due date: 26 th March, 2014
 Homework 6: Misorientations; Solution A.D. Rollett, 27-75, Texture, Microstructure and Anisotropy Due date: 26 th March, 214 Q1. [1 points] Starting with a set of Euler angles {155.9419988793937, 8.5275738913345,
Microstructure and texture of asymmetrically rolled aluminium and titanium after deformation and recrystallization
 IOP Conference Series: Materials Science and Engineering PAPER OPEN ACCESS Microstructure and texture of asymmetrically rolled aluminium and titanium after deformation and recrystallization To cite this
Development of a Reconstruction Method of Prior Austenite Microstructure Using EBSD Data of Martensite
 Technical Report UDC 621. 785. 36 Development of a Reconstruction Method of Prior Austenite Microstructure Using EBSD Data of Martensite Kengo HATA* Kazuki FUJIWARA Masayuki WAKITA Kaori KAWANO Abstract
Stuart I. Wright EDAX-TSL, Draper, Utah
 Stuart I. Wright EDAX-TSL, Draper, Utah EBSD Probably the Best Measurement in the World Austin Day, Microscopy & Microanalysis, 11, 502-503 (2005) OIM 3D Introduction to EBSD 3D Data Acquisition Serial
A Quantitative Evaluation of Microstructure by Electron Back-Scattered Diffraction Pattern Quality Variations
 Microsc. Microanal. 19, S5, 83 88, 2013 doi:10.1017/s1431927613012397 A Quantitative Evaluation of Microstructure by Electron Back-Scattered Diffraction Pattern Quality Variations SukHoonKang, 1 Hyung-Ha
Theory of orientation gradients in plastically strained crystals
 Acta Materialia 50 (2002) 421 440 www.elsevier.com/locate/actamat Theory of orientation gradients in plastically strained crystals D. Raabe a,*, Z. Zhao a, S.-J. Park b, F. Roters a a Max-Planck-Institut
MAX-PLANCK PROJECT REPORT
 FINITE ELEMENT SIMULATION OF PLASTIC DEFORMATION OF STEELS MAX-PLANCK PROJECT REPORT D. Raabe, F. Roters Max-Planck-Institut für Eisenforschung Max-Planck-Str. 1 40237 Düsseldorf Germany February 2004,
AN INTRODUCTION TO OIM ANALYSIS
 AN INTRODUCTION TO OIM ANALYSIS Raising the standard for EBSD software The most powerful, flexible, and easy to use tool for the visualization and analysis of EBSD mapping data OIM Analysis - The Standard
Effect of grain orientation on the development of dislocation substructures during colddeformation
 Effect of grain orientation on the development of dislocation substructures during cold-deformation of pure Tantalum. Link with static recrystallization and recovery. Christophe Kerisit, Nathalie Bozzolo,
Crystallographic Textures Measurement
 Crystallographic Textures Measurement D. V. Subramanya Sarma Department of Metallurgical and Materials Engineering Indian Institute of Technology Madras E-mail: vsarma@iitm.ac.in Macrotexture through pole
Characterization of Cold Drawn Gold bonding Wire with EBSD
 499 Material Science Forum Vols. 408-412(2002) pp. 499-504 2002 Trans Tech Publications, Switzerland Characterization of Cold Drawn Gold bonding Wire with EBSD Jae-Hyung Cho 1,2, J.S. Cho 3, J.T. Moon
Origins of Microtexture Development in Friction Stir Welds of Aluminum
 Origins of Microtexture Development in Friction Stir Welds of Aluminum David P. Field, TexSEM Laboratories Tracey W. Nelson, Brigham Young University Kumar V. Jata, WPAFB Acknowledgments: Kevin Colligan,
Texture Analysis using OIM
 Texture Analysis using OIM Stuart I. Wright Acknowledgements: David Field, Washington State University Karsten Kunze, ETH Zurich Outline What is crystallographic texture? Mathematical constructs Texture
Geometric and Crystallographic Characterization of WC Surfaces and Grain. Boundaries in WC-Co Composites
 Geometric and Crystallographic Characterization of WC Surfaces and Grain Boundaries in WC-Co Composites Chang-Soo Kim and Gregory S. Rohrer Department of Materials Science and Engineering, Carnegie Mellon
EVOLUTION OF THE GRAIN BOUNDARY CHARACTER DISTRIBUTION IN STRONTIUM TITANATE DURING GRAIN GROWTH
 EVOLUTION OF THE GRAIN BOUNDARY CHARACTER DISTRIBUTION IN STRONTIUM TITANATE DURING GRAIN GROWTH Herbert M. Miller, Gregory S. Rohrer Department of Materials Science and Engineering Carnegie Mellon University
Plastic Anisotropy in Recrystallized and Unrecrystallized Extruded Aluminium Profiles
 Proceedings of the 9 th International Conference on Aluminium Alloys (24) 14 Edited by J.F. Nie, A.J. Morton and B.C. Muddle Institute of Materials Engineering Australasia Ltd Plastic Anisotropy in Recrystallized
Representation of Orientation
 Representation of Orientation Lecture Objectives - Representation of Crystal Orientation Stereography : Miller indices, Matrices 3 Rotations : Euler angles Axis/Angle : Rodriques Vector, Quaternion - Texture
Advances in Experimental Method and Analysis for Estimation of Geometrically-Necessary Dislocations
 Brigham Young University BYU ScholarsArchive All Faculty Publications 2003-03-01 Advances in Experimental Method and Analysis for Estimation of Geometrically-Necessary Dislocations Brent L. Adams b_l_adams@byu.edu
Three stages: Annealing Textures. 1. Recovery 2. Recrystallisation most significant texture changes 3. Grain Growth
 Three stages: Annealing Textures 1. Recovery 2. Recrystallisation most significant texture changes 3. Grain Growth Cold worked 85% Cold worked 85% + stress relieved at 300 C for 1 hr Cold worked 85% +
Geometric and Crystallographic Characterization of WC Surfaces and Grain Boundaries in WC-Co Composites
 INTERFACE SCIENCE 12, 19 27, 2004 c 2004 Kluwer Academic Publishers. Manufactured in The Netherlands. Geometric and Crystallographic Characterization of WC Surfaces and Grain Boundaries in WC-Co Composites
Microstructural and Textural Evolution by Continuous Cyclic Bending and Annealing in a High Purity Titanium
 Materials Transactions, Vol. 45, No. 9 (24) pp. 2826 to 2831 #24 The Japan Institute of Metals Microstructural and Textural Evolution by Continuous Cyclic Bending and Annealing in a High Purity Titanium
Single crystal defect properties and tensile behavior of high purity Nb from Nb ingot slice
 Single crystal defect properties and tensile behavior of high purity Nb from Nb ingot slice D.C. Baars, P. Darbandi, D. Kang, F. Pourboghrat, T.R. Bieler, C. Compton* Michigan State University, * National
MICROSTRUCTURAL INVESTIGATION OF SPD PROCESSED MATERIALS CASE STUDY
 TEQIP Workshop on HRXRD, IIT Kanpur, 05 Feb 2016 MICROSTRUCTURAL INVESTIGATION OF SPD PROCESSED MATERIALS CASE STUDY K.S. Suresh Department of Metallurgical and Materials Engineering Indian Institute of
How to use Matlab Texture, Microstructure & Anisotropy A.D. Rollett. Last revised: 25 th Feb. 14
 1 How to use Matlab 27-750 Texture, Microstructure & Anisotropy A.D. Rollett Last revised: 25 th Feb. 14 2 In- Class Questions What is the procedure that one can follow to use Matlab+MTex to construct
The Effect of Crystallographic Texture on the Wrap Bendability in AA5754-O Temper Sheet Alloy
 Proceedings of the 12th International Conference on Aluminium Alloys, September 5-9, 2010, Yokohama, Japan 2010 The Japan Institute of Light Metals pp. 607-612 607 The Effect of Crystallographic Texture
MEASURING RELATIVE GRAIN BOUNDARY ENERGIES AND MOBILITIES IN AN ALUMINUM FOIL FROM TRIPLE JUNCTION GEOMETRY
 v MEASURING RELATIVE GRAIN BOUNDARY ENERGIES AND MOBILITIES IN AN ALUMINUM FOIL FROM TRIPLE JUNCTION GEOMETRY C.-C. Yang, A. D. Rollett and W. W. Mullins Carnegie Mellon University, Materials Science and
Finding Grain and Antigrains. Matt Nowell May 2016
 Finding Grain and Antigrains Matt Nowell May 2016 1 Grains Grain Boundaries Grain Size Measurements Special Boundaries Grain Shape Antigrains Outline Acknowledgements Stuart Wright, Rene de Kloe (EDAX),
Lectures on: Introduction to and fundamentals of discrete dislocations and dislocation dynamics. Theoretical concepts and computational methods
 Lectures on: Introduction to and fundamentals of discrete dislocations and dislocation dynamics. Theoretical concepts and computational methods Hussein M. Zbib School of Mechanical and Materials Engineering
CHEM-E5225 :Electron Microscopy Imaging II
 CHEM-E5225 :Electron Microscopy Imaging II D.B. Williams, C.B. Carter, Transmission Electron Microscopy: A Textbook for Materials Science, Springer Science & Business Media, 2009. Z. Luo, A Practical Guide
E45 Midterm 01 Fall 2007! By the 0.2% offset method (shown on plot), YS = 500 MPa
, YS = 500 MPa") 1.!Mechanical Properties (20 points) Refer to the following stress-strain plot derived from a standard uniaxial tensile test of a high performance titanium alloy to answer the following questions. Show
1.!Mechanical Properties (20 points) Refer to the following stress-strain plot derived from a standard uniaxial tensile test of a high performance titanium alloy to answer the following questions. Show
9/29/2014 8:52 PM. Chapter 3. The structure of crystalline solids. Dr. Mohammad Abuhaiba, PE
 1 Chapter 3 The structure of crystalline solids 2 Home Work Assignments HW 1 2, 7, 12, 17, 22, 29, 34, 39, 44, 48, 53, 58, 63 Due Sunday 12/10/2014 Quiz # 1 will be held on Monday 13/10/2014 at 11:00 am
MTEX. an open source texture analysis toolbox. Ralf Hielscher. Belo Horizonte, TU Chemnitz, Germany
 MTEX an open source texture analysis toolbox Ralf Hielscher TU Chemnitz, Germany Belo Horizonte, 2015 What is MTEX? 1 a MATLAB toolbox for quantitative texture analysis 2 a scripting language 3 a tool
ANALYSIS OF NEAR-COINCIDENCE SITE LATTICE BOUNDARY FREQUENCY IN AZ31 MAGNESIUM ALLOY. Andriy Ostapovets, Peter Molnár, Aleš Jäger, Pavel Lejček
 ANALYSIS OF NEAR-COINCIDENCE SITE LATTICE BOUNDARY FREQUENCY IN AZ31 MAGNESIUM ALLOY Andriy Ostapovets, Peter Molnár, Aleš Jäger, Pavel Lejček Institute of Physics ASCR, Na Slovance 2, Prague, Czech Republic,
OD Calculation from Pole Figure Data
 1 OD Calculation from Pole Figure Data 27-750 Texture, Microstructure & Anisotropy A.D. Rollett Last revised: 2 nd Feb. 14 2 p Intensity in pole figure α, β angles in pole fig. Ψ,Θ,φ Euler angles (Roe/Kocks)
Risks of Cleaning Electron Backscatter Diffraction Data
 Risks of Cleaning Electron Backscatter Diffraction Data L.N. Brewer* and J.R. Michael Sandia National Laboratories, P.O. Box 5800, Albuquerque, NM 87185 * lnbrewe@sandia.gov Introduction Collecting good
9/16/ :30 PM. Chapter 3. The structure of crystalline solids. Mohammad Suliman Abuhaiba, Ph.D., PE
 Chapter 3 The structure of crystalline solids 1 Mohammad Suliman Abuhaiba, Ph.D., PE 2 Home Work Assignments HW 1 2, 7, 12, 17, 22, 29, 34, 39, 44, 48, 53, 58, 63 Due Sunday 17/9/2015 3 Why study the structure
ORIENTATION DEPENDENCE OF DISLOCATION STRUCTURE EVOLUTION OF ALUMINUM ALLOYS IN 2-D AND 3-D COLIN CLARKE MERRIMAN
 ORIENTATION DEPENDENCE OF DISLOCATION STRUCTURE EVOLUTION OF ALUMINUM ALLOYS IN 2-D AND 3-D By COLIN CLARKE MERRIMAN A thesis submitted in partial fulfillment of the requirements for the degree of: MASTER
Appendix 1 TEXTURE A1.1 REPRESENTATION OF TEXTURE
 Appendix 1 TEXTURE The crystallographic orientation or texture is an important parameter describing the microstructure of a crystalline material. Traditionally, textures have been determined by x-ray diffraction
Correlation between thermal fatigue and thermal anisotropy in pure Sn and a Pb-free solder alloy. E.W.C. Coenen
 Correlation between thermal fatigue and thermal anisotropy in pure Sn and a Pb-free solder alloy E.W.C. Coenen September 2005 MT05.15 Coach: M.A. Matin Summary During service solder joints are subjected
9/28/2013 9:26 PM. Chapter 3. The structure of crystalline solids. Dr. Mohammad Abuhaiba, PE
 Chapter 3 The structure of crystalline solids 1 2 Why study the structure of crystalline solids? Properties of some materials are directly related to their crystal structure. Significant property differences
Strengthening Mechanisms
 Strengthening Mechanisms The ability of a metal/ alloy to plastically deform depends on the ability of dislocations to move. Strengthening techniques rely on restricting dislocation motion to render a
LaboTex Version 3.0. Texture Analysis Software for Windows. Texture Analysis on the Basis of EBSD Data
 LaboTex Version 3.0 Texture Analysis Software for Windows Texture Analysis on the Basis of EBSD Data LaboSoft s.c. Telephone: +48 502 311 838 Fax: +48 12 3953 891 E-mail: office@labosoft.com.pl LaboSoft
ORIENTATION DETERMINATION BY EBSP IN AN ENVIRONMENTAL SCANNING ELECTRON MICROSCOPE
 Pergamon PII S1359-6462(99)00086-X Scripta Materialia, Vol. 41, No. 1, pp. 47 53, 1999 Elsevier Science Ltd Copyright 1999 Acta Metallurgica Inc. Printed in the USA. All rights reserved. 1359-6462/99/$
A Combined Discrete-dislocation/Scaledependent Crystal Plasticity Analysis of Deformation and Fracture in Nanomaterials. Presented by: Derek Columbus
 MS Thesis Defense A Combined Discrete-dislocation/Scaledependent Crystal Plasticity Analysis of Deformation and Fracture in Nanomaterials Presented by: Derek Columbus Advisor: Dr. Mica Grujicic Department
Effect of strain path on deformation texture of superconducting niobium sheet
 Effect of strain path on deformation texture of superconducting niobium sheet A. Zamiri Mechanical Engineering Department, Michigan State University, East Lansing, MI 48824-1226 Abstract The texture of
A MODEL FOR THE ORIGIN OF ANISOTROPIC GRAIN BOUNDARY CHARACTER DISTRIBUTIONS IN POLYCRYSTALLINE MATERIALS
 A MODEL FOR THE ORIGIN OF ANISOTROPIC GRAIN BOUNDARY CHARACTER DISTRIBUTIONS IN POLYCRYSTALLINE MATERIALS Gregory S. Rohrer, Jason Gruber, and Anthony D. Rollett. Department of Materials Science and Engineering,
Static Recrystallization Phase-Field Simulation Coupled with Crystal Plasticity Finite Element Method
 tatic Recrystallization Phase-Field imulation Coupled with Crystal Plasticity Finite Element Method T. Takaki 1, A. Yamanaka, Y. Tomita 2 ummary We have proposed a simulation model for static recrystallization
Application of ASTAR/precession electron diffraction technique to quantitatively study defects in nanocrystalline metallic materials
 Graduate Theses and Dissertations Iowa State University Capstones, Theses and Dissertations 2017 Application of ASTAR/precession electron diffraction technique to quantitatively study defects in nanocrystalline
Evolution of Microstructure and Texture Associated with Ridging in Ferritic Stainless Steels
 , pp. 100 105 Evolution of Microstructure and Texture Associated with Ridging in Ferritic Stainless Steels SooHo PARK, KwangYuk KIM, YongDeuk LEE and ChanGyung PARK 1) Stainless Steel Research Group, Technical
EBSD Electron BackScatter Diffraction Principle and Applications
 EBSD Electron BackScatter Diffraction Principle and Applications Dr. Emmanuelle Boehm-Courjault EPFL STI IMX Laboratoire de Simulation des Matériaux LSMX emmanuelle.boehm@epfl.ch 1 Outline! Introduction!
EBSD Basics EBSD. Marco Cantoni 021/ Centre Interdisciplinaire de Microscopie Electronique CIME. Phosphor Screen. Pole piece.
 EBSD Marco Cantoni 021/693.48.16 Centre Interdisciplinaire de Microscopie Electronique CIME EBSD Basics Quantitative, general microstructural characterization in the SEM Orientation measurements, phase
Interface Texture Development. During Grain Growth
 Interface Texture Development During Grain Growth Jason Gruber Department of Materials Science and Engineering Carnegie Mellon University Contents Abstract 3 List of Symbols 6 List of Figures 8 1 Introduction
Chapter One: The Structure of Metals
 Fourth Edition SI Version Chapter One: The Structure of Metals 2010. Cengage Learning, Engineering. All Rights Reserved. 1.1 Importance of the structure: Structures Processing Properties Applications Classification
3D reconstruction of microstructure in a commercial purity aluminum
 Scripta Materialia 55 (2006) 75 80 www.actamat-journals.com Viewpoint Paper 3D reconstruction of microstructure in a commercial purity aluminum A. Brahme, a, * M.H. Alvi, b D. Saylor, d J. Fridy c and
Analyses on Compression Twins in Magnesium
 aterials Transactions, Vol. 49, No. 4 (2008) pp. 710 to 714 #2008 The Japan Institute of etals Analyses on Compression Twins in agnesium L. eng 1, P. Yang 1; *, Q. Xie 1 and W. ao 1;2 1 School of aterials
Activation of deformation mechanism
 Activation of deformation mechanism The deformation mechanism activates when a critical amount of mechanical stress imposed to the crystal The dislocation glide through the slip systems when the required
Mambo is the perfect tool for viewing EBSD data in pole and inverse pole figures.
 Mambo Pole figure and inverse pole figure software The physical properties of many samples are dependent on the common alignment of particular crystallographic directions: one of the easiest ways to view
EBSD-Based Microscopy: Resolution of Dislocation Density
 Copyright 2009 Tech Science Press CMC, vol.14, no.3, pp.185-196, 2009 EBSD-Based Microscopy: Resolution of Dislocation Density Brent L. Adams and Joshua Kacher Abstract: Consideration is given to the resolution
Microstructure of Friction Stir Welded 6061 Aluminum Alloy
 Proceedings of the 9 th International Conference on Aluminium Alloys (2004) Edited by J.F. Nie, A.J. Morton and B.C. Muddle Institute of Materials Engineering Australasia Ltd 878 Microstructure of Friction
ELECTRON BACKSCATTER DIFFRACTION (EBSD) THE METHOD AND ITS APPLICATIONS IN MATERIALS SCIENCE AND ENGINEERING
 THE METHOD AND ITS APPLICATIONS IN MATERIALS SCIENCE AND ENGINEERING") ELECTRON BACKSCATTER DIFFRACTION (EBSD) THE METHOD AND ITS APPLICATIONS IN MATERIALS SCIENCE AND ENGINEERING P. Cizek UNIVERSITY OF OXFORD, Department of Materials, Parks Road, Oxford OX1 3PH, GB Abstract
ELECTRON BACKSCATTER DIFFRACTION (EBSD) THE METHOD AND ITS APPLICATIONS IN MATERIALS SCIENCE AND ENGINEERING P. Cizek UNIVERSITY OF OXFORD, Department of Materials, Parks Road, Oxford OX1 3PH, GB Abstract
Fatigue Mechanisms of Aluminium Alloy Assemblies
 Proceedings of the 9 th International Conference on Aluminium Alloys (2004) Edited by J.F. Nie, A.J. Morton and B.C. Muddle Institute of Materials Engineering Australasia Ltd 628 Fatigue Mechanisms of
Problems to the lecture Physical Metallurgy ( Materialkunde ) Chapter 6: Mechanical Properties
 Chapter 6: Mechanical Properties") Institut für Metallkunde und Metallphysik Direktor: Prof. Dr. rer. nat. Günter Gottstein RWTH Aachen, D-52056 Aachen Internet: http://www.imm.rwth-aachen.de E-mail: imm@imm.rwth-aachen.de Tel.: +49 241
Institut für Metallkunde und Metallphysik Direktor: Prof. Dr. rer. nat. Günter Gottstein RWTH Aachen, D-52056 Aachen Internet: http://www.imm.rwth-aachen.de E-mail: imm@imm.rwth-aachen.de Tel.: +49 241
Texture Evolution during Deep drawing of Mo sheet Kwang Kyun Park 1, J.H. Cho 1, Heung Nam Han 2, Hui-Choon Lee 3 and Kyu Hwan Oh 1
 Key Engineering Materials Vols. 33-36 (003) pp.567-57 c 003 Trans Tech Publications, Switzerland Texture Evolution during Deep drawing of Mo sheet Kwang Kyun Park 1, J.H. Cho 1, Heung Nam Han, Hui-Choon
Dislocations and Plastic Deformation
 Dislocations and Plastic Deformation Edge and screw are the two fundamental dislocation types. In an edge dislocation, localized lattice distortion exists along the end of an extra half-plane of atoms,
Effects of Wavy Roll-Forming on Textures in AZ31B Magnesium Alloy
 Materials Transactions, Vol. 49, No. 5 (8) pp. 995 to 999 Special Issue on Platform Science and Technology for Advanced Magnesium Alloys, IV #8 The Japan Institute of Metals Effects of Wavy Roll-Forming
Metal working: Deformation processing II. Metal working: Deformation processing II
 Module 28 Metal working: Deformation processing II Lecture 28 Metal working: Deformation processing II 1 Keywords : Difference between cold & hot working, effect of macroscopic variables on deformation
Five-parameter grain boundary analysis by 3D EBSD of an ultra fine grained CuZr alloy processed by equal channel angular pressing
 Five-parameter grain boundary analysis by 3D EBSD of an ultra fine grained CuZr alloy processed by equal channel angular pressing 1 A. Khorashadizadeh 1, D. Raabe 1, S. Zaefferer 1, G.S. Rohrer 2, A.D.
Grain boundary mobility under a stored-energy driving force: a comparison to curvature-driven boundary migration
 M. L. Taheri a, D. Molodov b, G. Gottstein a, A. D. Rollett a a Materials Science & Engineering Department, Carnegie Mellon University b Institute of Physical Metallurgy and Metal Physics, RWTH Aachen
Texture development during processing
 Texture development during processing Course objectives: 1. To introduce the typical deformation textures in metals and alloys with FCC, BCC and HCP crystal structures 2. To explain the micro-mechanism
Department of Materials Science and Engineering Massachusetts Institute of Technology 3.14 Physical Metallurgy Fall 2003 Exam I
 Department of Materials Science and Engineering Massachusetts Institute of Technology 3.14 Physical Metallurgy Fall 2003 Exam I 3 2.5 2 Frequency 1.5 1 0.5 0 10 11 12 13 14 15 16 17 18 19 20 21 22 23 24
Effect of Stacking Fault Energy on Evolution of Recrystallization Textures in Drawn Wires and Rolled Sheets
 Materials Science Forum Vols. 495-497 (2005) pp. 1243-1248 online at http://www.scientific.net 2005 Trans Tech Publications, Switzerland 194 Effect of Stacking Fault Energy on Evolution of Recrystallization
Recrystallization textures in metals and alloys
 Recrystallization textures in metals and alloys Uniaxial deformation Aluminium wire F.C.C. Metals and alloys FCC wires retain deformation texture ([111]+[100]) upon recrystallisation Composition / Purity
Evidence for Solute Drag during Recrystallization of Aluminum Alloys
 Mater. Res. Soc. Symp. Proc. Vol. 882E 2005 Materials Research Society EE6.5.1/BB6.5.1 Evidence for Solute Drag during Recrystallization of Aluminum Alloys Mitra L. Taheri 1, Jason Sebastian 2, David Seidman
Strain. Two types of stresses: Usually:
 Stress and Texture Strain Two types of stresses: microstresses vary from one grain to another on a microscopic scale. macrostresses stress is uniform over large distances. Usually: macrostrain is uniform
Fundamentals of Plastic Deformation of Metals
 We have finished chapters 1 5 of Callister s book. Now we will discuss chapter 10 of Callister s book Fundamentals of Plastic Deformation of Metals Chapter 10 of Callister s book 1 Elastic Deformation
The Relationship between Crystal Rotation Axis Orientation and Active Slip System in Pure Aluminum Tricrystal Deformed in Compression
 Materials Transactions, Vol. 49, No. 3 (2008) pp. 419 to 423 #2008 The Japan Institute of Metals The Relationship between Crystal Rotation Axis Orientation and Active System in Pure Aluminum Tricrystal
The Influence of Sheet Metal Anisotropy on Laser Forming Process (101) ABSTRACT 1. INTRODUCTION 2. BACKGROUND 2.1 Deformation textures in BCC
 ABSTRACT 1. INTRODUCTION 2. BACKGROUND 2.1 Deformation textures in BCC") The Influence of Sheet Metal Anisotropy on Laser Forming Process (11) Peng Cheng and Y. Lawrence Yao, Department of Mechanical Engineering, Columbia University, New York, NY 17, USA ABSTRACT Cold rolled
The Influence of Sheet Metal Anisotropy on Laser Forming Process (11) Peng Cheng and Y. Lawrence Yao, Department of Mechanical Engineering, Columbia University, New York, NY 17, USA ABSTRACT Cold rolled
Chapter 8. Deformation and Strengthening Mechanisms
 Chapter 8 Deformation and Strengthening Mechanisms Chapter 8 Deformation Deformation and Strengthening Issues to Address... Why are dislocations observed primarily in metals and alloys? How are strength
Evolution of Recrystallization Texture in Aluminum Alloy Sheets by Asymmetric-Warm-Rolling
 技術論文 Evolution of Recrystallization Texture in Aluminum Alloy Sheets by Asymmetric-Warm-Rolling Yoshikazu Suzuki Osamu Noguchi Yoshiki Miki Yoichi Ueno Katsumi Koyama Toshio Komatsubara Abstract : Asymmetric-warm-rolling
Distribution of grain boundaries in magnesia as a function of five macroscopic parameters
 Acta Materialia 51 (2003) 3663 3674 www.actamat-journals.com Distribution of grain boundaries in magnesia as a function of five macroscopic parameters David M. Saylor 1, Adam Morawiec 2, Gregory S. Rohrer