Solidification: basics and beyond Equilibrium and nonequilibrium solidification
|
|
|
- Philip Daniels
- 5 years ago
- Views:
Transcription

1 Solidification: basics and beyond Equilibrium and nonequilibrium solidification Prof. Dmitry Eskin BCAST NETCENG,
2 Types of solidification reactions Equilibrium solidification 2
 Degrees of freedom the number of independent parameters (temperature, composition, pressure) that can change preserving the same phase state.")
3 Gibbs phase rule Gibbs phase rule defines the degrees of freedom F for the system as F = Components Phases + 2 or F = Components Phases + 1 in condensed systems. Josiah Willard Gibbs ( ) Degrees of freedom the number of independent parameters (temperature, composition, pressure) that can change preserving the same phase state. In binary metallic alloys (condensed systems) The boundary separating regions with two phases degree of freedom is 1 (line). In a three-phase equilibrium region degree of freedom is 0 (point)

4 Phase equilibrium Prof. Roozeboom (Uni. Amsterdam) studied the equilibrium of multiple-phase systems. The theoretical foundations for this were laid by J. W. Gibbs with his phase rule, but Roozeboom would be the one to apply the theory and demonstrate its usefulness. He is mainly remembered for his melting phase diagrams of metal alloys. Hendrik Willem Bakhuis Roozeboom ( ) Roozeboom also was the first to plot ternary phase equilibria in two-dimensional plots that were taken as vertical or horizontal slices from the three-dimensional solid diagrams. These are termed, respectively, isopleths and isotherms.
5 Phase diagram; alloys Partition coefficient C xs /C xl = k Solute conservation M S C xs + M L C xl = C 0 M L = 1 M S 5
6 Equilibrium solidification: lever rule C C M C C L S x 0 L S x x L C 1 C 1 f (1 k) 0 s 6
7 Phase diagram; alloys Lever rule for mass fraction C C M C C L S x 0 L S x x g S S S L M S M M Volume fraction expressed from the mass fraction S L f S 1 Tx T Liquidus(C 0) 1 k T T (A) x m Solid fraction in the two-phase solidification range 7

8 Partitioning of solute during solidification
9 L S ( ) Solidification
10 Types of solidification reactions in alloys L S ( ) Full solubility Ag-Au; Au-Cu; Mn-Al; Fe-V; Ni-Cu; Ni-Pt; Ni-Pd; Ni-Au; Ti-V
11 Types of solidification reactions in alloys L S ( ) + S ( ) EUTECTIC Al-Cu; Al-Fe; Al-Ge; Al-Li; Al-Mg; Al-Mn; Al-Ni; Al-Si; Al-Zn ;Mg-Ca; Mg-Al; Mg-La; Mg-Nd; Mg-Li; Cu-Mg; Cu-Sb; Cu-P; Fe-C; Fe-Ti; Ni-Ti
12 Types of solidification reactions in alloys L + S ( ) S ( ) PERITECTIC Al-Cr; Al-Ti; Al-V; Al-Zr; Mg-Sc; Mg-Mn; Mg-Zr; Cu-Fe; Cu-Zn; Cu-Sn; Fe-Al; Fe-C; Fe-Mn; Fe-Ni; Ni-Re
13 Types of solidification reactions in alloys L L + L" MISCIBILITY L S ( ) + L" MONOTECTIC Ag-Co; Al-Bi; Al-Cd; Al-In; Al-Pb; Al-S; Mg-V; Mg-Na; Cu-Pb; Fe-O; Fe-Sn; Ti-Y
14 Types of solidification reactions in alloys S ( ) L + S ( ) METATECTIC Gd-Cu; Hf-Cu; Fe-Sc; Fe-S; Fe-Zr; Y-Ti
15 Types of solidification reactions in alloys L + L" S ( ) SYNTECTIC K-Zn; Na-Zn; Cg-Rb; Cd-Cs

16 Reality is more complex
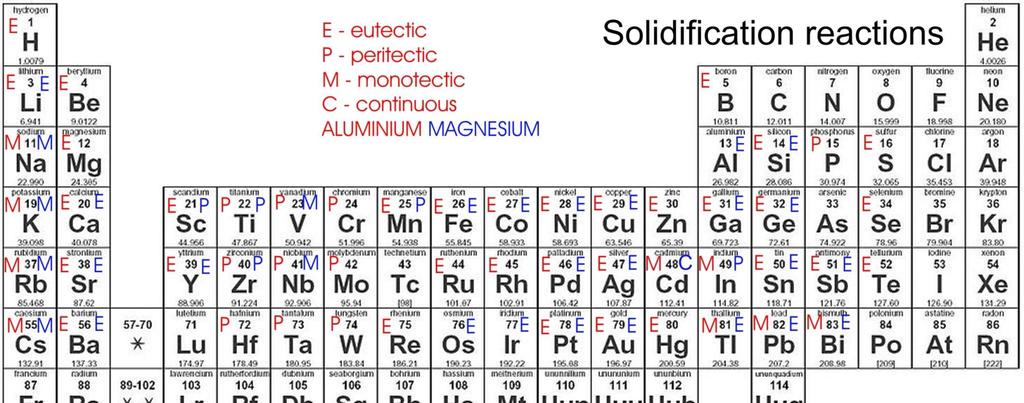
17 Types of solidification reactions in Al and Mg alloys

18 Reality is even more complex
19 Eutectic and peritectic reactions
20 Eutectic solidification L S ( ) + S ( ) MS
: last liquid to solidify Cooperative")

21 Main features of eutectic solidification Low temperature of solidification (and melting): last liquid to solidify Cooperative growth of at least two solid phases, each as a single crystal within the colony Coupled growth facilitated by lateral diffusion between lamellae 21
22 Peritectic solidification L + S ( ) S ( ) 22


23 Main features of peritectic solidification High temperature of solidification Controlled by diffusion though solid Does not complete at high cooling rates Offers natural solidification site for the second phase, hence grain refinement L + 23
24 Nonequilibrium solidification 24
25 Equilibrium solidification C C M C C L S x 0 L S x x L C 1 C 1 f (1 k) 0 s 25

26 Eq. vs Neq. solidification 26
![Non-equilibrium solidification C C L 0 [1 f (1 2 k)] s k 1 1 2 k Erich Scheil Dsts L Fourier number: dimensionless diffusion time =0.](/docs-images/81/84253806/images/27-1.jpg "5 then lever rule =0 then Gulliver-Scheil rule (no solid diffusion) C C L 0 (1 f ) s (k 1) G.H. Gulliver, J. Inst. Met., 9:120, 1913; E. Scheil, Z.")
27 Non-equilibrium solidification C C L 0 [1 f (1 2 k)] s k k Erich Scheil Dsts L Fourier number: dimensionless diffusion time =0.5 then lever rule =0 then Gulliver-Scheil rule (no solid diffusion) C C L 0 (1 f ) s (k 1) G.H. Gulliver, J. Inst. Met., 9:120, 1913; E. Scheil, Z. Metallk., 34:70,
28 Non-equilibrium solidification 28
29 Nonequilibrium solidification L L+B L+AB2 L+A L+AB1 A+AB1 AB1+AB2 B+AB2 A AB1 AB2 B 29
30 Nonequilibrium solidification L L+B L+AB2 L+A L+AB1+AB2 A+AB1+AB2 AB1+AB2 B+AB2 A AB1 AB2 B 30
31 Nonequilibrium solidification L L+B L+AB2 L+A L+AB2 A+AB2 A+AB2 B+AB2 A AB1 AB2 B 31
32 Metastable phases Al 32
33 Cooling curve and its analysis 33

34 Cooling curve C 0 TEMPERATURE T L T Cs C L T S CONCENTRATION 34
35 Cooling rate: local solidification time 35
36 Undercooling L. Backerud, G. Chai, J. Tamminen, Solidification Characteristics of Aluminum Alloys, vol. 2, AFS/Skanaluminium,
37 Transformations T, C dt/dt, C/s t, s A.H. Ahmad, S. Naher and D. Brabazon: Key Engineering Materials, 2013, vol , p. 582 t, s 37

38 Transformations C p is the heat capacity and L is the latent heat T, C A.H. Ahmad, S. Naher and D. Brabazon: Key Engineering Materials, 2013, vol , p. 582 Fraction solid 38
39 Structure evolution: coherency TCc TCw H.Jiang, W.T. Kierkus, J.H. Sokolowski, AFS Trans., 1999, 99-68, pp
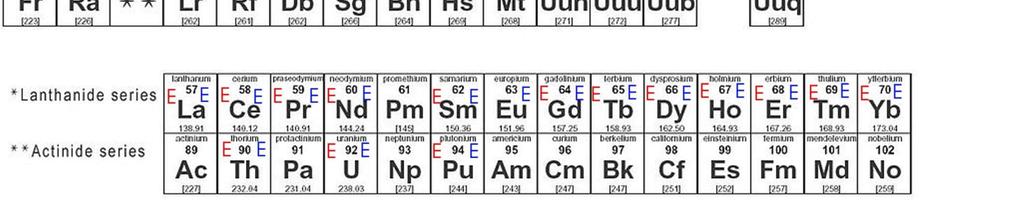
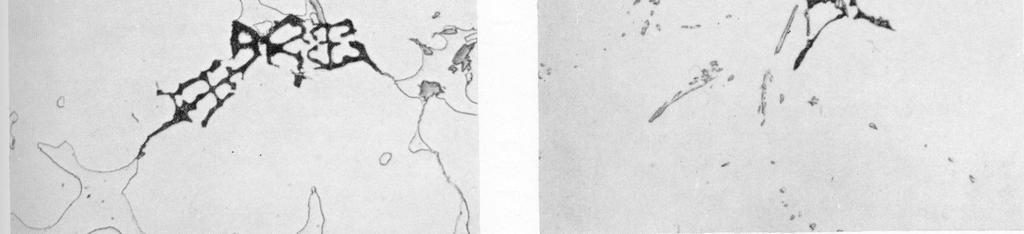
40 Microsegregation 40
41 Microsegregation 41
42 Microsegregation 42
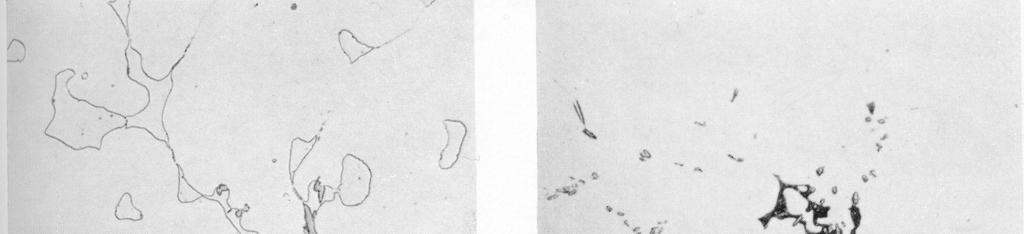
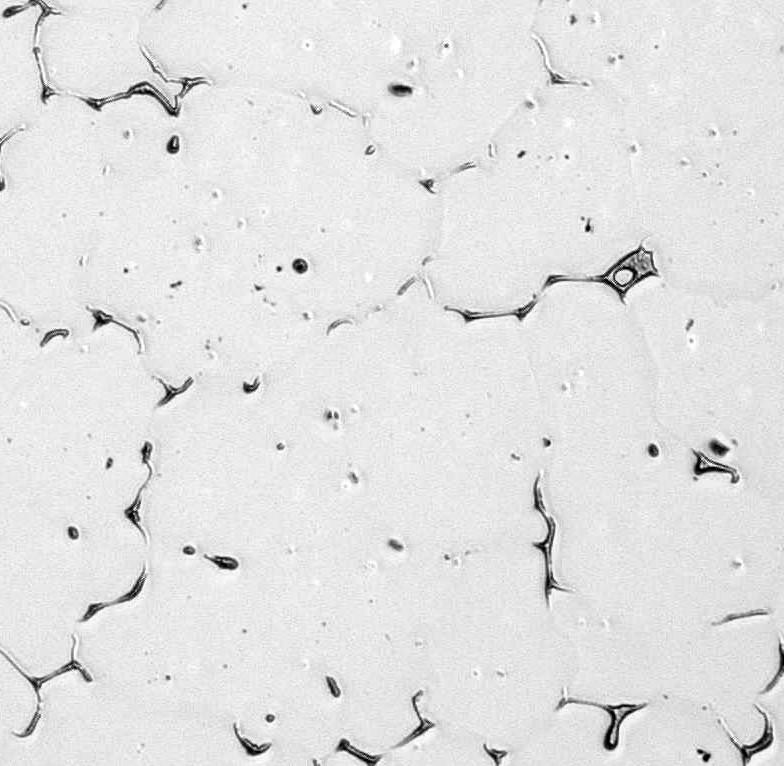
43 Homogenization As-cast Homogenized 43
Two Components System
 Two Components System Three independent variables: T, P, compositions In general, constant pressure (fixed parameter). P+F=C+1 Simple Eutectic System The binary eutectic phase diagram explains the chemical
PanAluminum. Thermodynamic database for multi-component Aluminum-rich casting and wrought alloys. Copyright CompuTherm LLC B C Y.
 PanAluminum Thermodynamic database for multi-component Aluminum-rich casting and wrought alloys Zn Zr Ag B C Y Co V Cr Ti Cu Sr Sn Si Al Ge Fe Gd Sc Hf Sb Ni Nb Mn Mg Li Copyright CompuTherm LLC 1 Components
Phase Diagrams of Pure Substances Predicts the stable phase as a function of P total and T. Example: water can exist in solid, liquid and vapor
 PHASE DIAGRAMS Phase a chemically and structurally homogenous region of a material. Region of uniform physical and chemical characteristics. Phase boundaries separate two distinct phases. A single phase
Database. Sept , 2014, Aachen, Germany. Thermo-Calc Anwendertreffen
 Database Sept. 11-12, 2014, Aachen, Germany Thermo-Calc Anwendertreffen Thermodynamic and kinetic databases New Databases, June 2014 TCAL3 TCMG3 TCSLD2 TCSI1 TCNI7 MOBNI3 TCAL3.0 TCAL3.0 TCAL1.0 2011.05
Phase diagrams wt% of carbon in Fe microstructure of a lead tin alloy of eutectic composition
 Phase diagrams 0.44 wt% of carbon in Fe microstructure of a lead tin alloy of eutectic composition Primer Materials For Science Teaching Spring 2018 28.6.2018 What is a phase? A phase may be defined as
CHAPTER 9 PHASE DIAGRAMS
 CHAPTER 9 PHASE DIAGRAMS PROBLEM SOLUTIONS 9.14 Determine the relative amounts (in terms of mass fractions) of the phases for the alloys and temperatures given in Problem 9.8. 9.8. This problem asks that
Phase Diagrams. Phases
 Phase Diagrams Reading: Callister Ch. 10 What is a phase? What is the equilibrium i state t when different elements are mixed? What phase diagrams tell us. How phases evolve with temperature and composition
TALAT Lecture Phase Diagrams. 14 pages, 13 Figures. Basic Level
 TALAT Lecture 1203 Phase Diagrams 14 pages, 13 Figures Basic Level prepared by M H Jacobs * Interdisciplinary Research Centre in Materials The University of Birmingham, UK (Based on approach adopted by
but T m (Sn0.62Pb0.38) = 183 C, so this is a common soldering alloy.
 = 183 C, so this is a common soldering alloy.") T m (Sn) = 232 C, T m (Pb) = 327 C but T m (Sn0.62Pb0.38) = 183 C, so this is a common soldering alloy. T m (Au) = 1064 C, T m (Si) = 2550 C but T m (Au0.97Si0.03) = 363 C, so thin layer of gold is used
T m (Sn) = 232 C, T m (Pb) = 327 C but T m (Sn0.62Pb0.38) = 183 C, so this is a common soldering alloy. T m (Au) = 1064 C, T m (Si) = 2550 C but T m (Au0.97Si0.03) = 363 C, so thin layer of gold is used
Components The elements or compounds which are mixed initially. (e.g. Al & Cu)
") Why Study Phase Diagrams? The purpose of this lecture is to develop an understanding of the phase transformations which occur under conditions of slow cooling; Under such conditions equilibrium is approached,
Why Study Phase Diagrams? The purpose of this lecture is to develop an understanding of the phase transformations which occur under conditions of slow cooling; Under such conditions equilibrium is approached,
12/3/ :12 PM. Chapter 9. Phase Diagrams. Dr. Mohammad Abuhaiba, PE
 Chapter 9 Phase Diagrams 1 2 Learning Objectives 1. Isomorphous and eutectic phase diagrams: a. label various phase regions b. Label liquidus, solidus, and solvus lines 2. Given a binary phase diagram
Chapter 9: Phase Diagrams
 Chapter 9: Phase Diagrams When we combine two elements... what equilibrium state do we get? In particular, if we specify... --a composition (e.g., wt% Cu - wt% Ni), and --a temperature (T ) then... How
CHAPTER 10 PHASE DIAGRAMS PROBLEM SOLUTIONS
 CHAPTER 10 PHASE DIAGRAMS PROBLEM SOLUTIONS Solubility Limit 10.1 Consider the sugar water phase diagram of Figure 10.1. (a) How much sugar will dissolve in 1000 g of water at 80 C (176 F)? (b) If the
Introduction to the phase diagram Uses and limitations of phase diagrams Classification of phase diagrams Construction of phase diagrams
 Prof. A.K.M.B. Rashid Department of MME BUET, Dhaka Concept of alloying Classification of alloys Introduction to the phase diagram Uses and limitations of phase diagrams Classification of phase diagrams
Chapter 9 Phase Diagrams. Dr. Feras Fraige
 Chapter 9 Phase Diagrams Dr. Feras Fraige Chapter Outline Definitions and basic concepts Phases and microstructure Binary isomorphous systems (complete solid solubility) Binary eutectic systems (limited
Atomic Transport & Phase Transformations Lecture 7
 Atomic Transport & Phase Transformations Lecture 7 PD Dr. Nikolay Zotov zotov@imw.uni-stuttgart.de Lecture I-7 Outline Limited solubility in the solid state Effect of the maximum temperature of the miscibility
www-materials.eng.cam.ac.uk/typd
 Part IB Paper 3: MATERIALS Examples Paper 3/1: TEACH YOURSELF PHASE DIAGRAMS This examples paper forms part of an interactive online resource Teach Yourself Phase Diagrams which is available at: www-materials.eng.cam.ac.uk/typd
the Phase Diagrams Today s Topics
 MME 291: Lecture 03 Introduction to the Phase Diagrams Prof. A.K.M.B. Rashid Department of MME BUET, Dhaka Today s Topics Concept of alloying Classification of alloys Introduction to the phase diagram
MSE 513 Homework #1 Due Jan. 21, 2013
 Reading: My class notes, pgs. 22-27. http://www1.asminternational.org/asmenterprise/apd/help/help.aspx Introduction to Phase diagrams, particularly: o Common terms o Binary diagrams o Features of phase
Li Mass = 7 amu Melting point C Density 0.53 g/cm 3 Color: silvery
 Blackline Master B02: Mendeleev s Element Cards H Mass = 1 amu Melting point -259 0 C Density 0.0909 g/cm 3 Color: colorless Li Mass = 7 amu Melting point 180.5 0 C Density 0.53 g/cm 3 Be Mass = 9 amu
Release Notes: Thermo-Calc Software Package Version 2018b
 : Thermo-Calc Software Package Version 2018b 2018 Foundation of Computational Thermodynamics: Solna, Sweden Contents Release Notes Software Development Kits (SDKs) 2 TC-Python API 2 New Features: Scheil
CHAPTER 9: PHASE DIAGRAMS
 CHAPTER 9: PHASE DIAGRAMS ISSUES TO ADDRESS... When we combine two elements... what equilibrium state do we get? In particular, if we specify... --a composition (e.g., wt%cu - wt%ni), and --a temperature
PHASE EQUILIBRIUM P + F = C + 2
 PHASE EQUILIBRIUM Component: is either pure metal and/or compound of which an alloy is composed. They refer to the independent chemical species that comprise the system. Solid Solution: It consists of
Recent Developments of Software and Databases
 Recent Developments of Software and Databases Aachen, Sept 1-2, 2016 Introduction 2015 Introduction 1000 Introduction 64 Introduction 46 Introduction Introduction 35 Outline - What we do About the company
Development of Microstructure in Eutectic Alloys
 CHAPTER 10 PHASE DIAGRAMS PROBLEM SOLUTIONS Development of Microstructure in Eutectic Alloys 10.16 Briefly explain why, upon solidification, an alloy of eutectic composition forms a microstructure consisting
Cu-Ag phase diagram Brazil s map
 Phase Diagrams [9] Cu-Ag phase diagram Brazil s map 1> Some important definitions Component - chemically recognizable species (Fe and C in carbon steel, H2O and NaCl in salted water). A binary alloy contains
STUDY OF ELEMENT FINGERPRINTING IN GOLD DORÉ BY GLOW DISCHARGE MASS SPECTROMETRY
 STUDY OF ELEMENT FINGERPRINTING IN GOLD DORÉ BY GLOW DISCHARGE MASS SPECTROMETRY MICHAEL W. HINDS, Ph.D. 1 ELEMENT FINGERPRINTING In 1994, John Whatling* used laser ablation inductively coupled mass spectrometry
Lecture 7: Solid State Reactions Phase Diagrams and Mixing
 Lecture 7: Solid State Reactions Phase Diagrams and Mixing Prof Ken Durose, Univ of Liverpool Text book for this lecture: Callister Materials Science and Engineering Learning objectives 1.Solid state reactions
The Solubility Limit
 Phase Diagrams When we combine two elements... what equilibrium state do we get? In particular, if we specify... --a composition (e.g., wt%cu - wt%ni), and --a temperature (T) then... How many phases do
Introduction to phase diagrams
 ASM Phase Diagram Database Diagram No. 901229 Department of Physics and Astronomy Introduction to phase diagrams William Meier Physics 590B Fall 2018 Outline Part 1 Introduction and basics Part 2 Fundamental
PHASE DIAGRAMS UNDERSTANDING BASICS THE. Edited. F.C. Campbell. Materials Park, Ohio The Materials Information Society.
 PHASE DIAGRAMS UNDERSTANDING THE BASICS Edited by F.C. Campbell The Materials Information Society ASM International Materials Park, Ohio 44073-0002 www.asm i nternational.org Phase Diagrams Understanding
Chapter 11: Phase Diagrams
 Chapter 11: Phase Diagrams ISSUES TO ADDRESS... When we combine two elements... what is the resulting equilibrium state? In particular, if we specify... -- the composition (e.g., wt% Cu - wt% Ni), and
Partition coeff. at constant temp. and press. if ml < 0 k < 1. İf ml > 0 k >1
 Microsegregation Partition coeff. k=cs/cl at constant temp. and press. if ml < 0 k < 1 İf ml > 0 k >1 Models for Microsegregation 1 no mixing in liquid no diffusion in solid no coarsening 2. partial
Fe-Fe 3 C phase diagram is given on the last page of the exam. Multiple choices (2.5 points each):
:") Materials Science and Engineering Department MSE 200, Exam #3 ID number First letter of your last name: Name: No notes, books, or information stored in calculator memories may be used. Cheating will be
Materials Science and Engineering Department MSE 200, Exam #3 ID number First letter of your last name: Name: No notes, books, or information stored in calculator memories may be used. Cheating will be
Simulation of Solute Redistribution during Casting and Solutionizing of Multi-phase, Multi-component Aluminum Alloys
 Simulation of Solute Redistribution during Casting and Solutionizing of Multi-phase, Multi-component Aluminum Alloys F. Yi,* H. D. Brody* and J. E. Morral** * University of Connecticut, Storrs, CT 6269-336
ThermoCalc Application for the Assessment of Binary Alloys Non-Equilibrium Solidification
 A R C H I V E S of F O U N D R Y E N G I N E E R I N G Published quarterly as the organ of the Foundry Commission of the Polish Academy of Sciences ISSN (1897-331) Volume 17 Issue 1/217 163 168 3/1 ThermoCalc
Mohammad Anwar Karim Id :
 Department of Mechanical and Industrial Engineering ME 8109 Casting and Solidification of Materials EFFECTS OF RAPID SOLIDIFICATION ON MICROSTRUCTURE AND PROPERTIES OF AL, MG & TI ALLOYS Winter 2012 Presented
Keywords: List the keywords covered in your paper. These keywords will also be used by the publisher to produce a keyword index.
 1-4 1-5 PHASES AND STRUCTURE CHARACTERISTICS OF THE NEAR EUTECTIC AL-SI-CU ALLOY USING DERIVATIVE THERMO ANALYSIS L.A. Dobrzanski 1, a, M. Krupinski 2,b, K. Labisz 3,c, B. Krupinska 4,d and A. Grajcar
Effects in Ductile Iron
 Summary of Element Effects in Ductile Iron Rick Gundlach Element Materials Technology Wixom Insert Company Logo Here DIS Annual Meeting, June 7, 2012 Muskegon, Michigan Types of Alloying Elements Substitutional
Phase Equilibria. Reading: West 7
 Phase Equilibria Reading: West 7 430 PHASE DIAGRAMS Also called equilibrium or constitutional diagrams Plots of temperature vs. pressure, or T or P vs. composition, showing relative quantities of phases
Why do cocktail ice served in expensive restaurants are clear whereas the ice formed in your refrigerator is cloudy?
 Phase Diagrams Why do cocktail ice served in expensive restaurants are clear whereas the ice formed in your refrigerator is cloudy? What is a solder alloy? What is the best composition for solder? How
Metallic Materials-Phase Diagrams
 Engineering Alloys Metals and alloys have many useful engineering properties and so have wide spread application in engineering designs. Iron and its alloys (principally steel) account for about 90 percent
Chapter 10: Phase Diagrams
 hapter 10: Phase Diagrams Show figures 10-1 and 10-3, and discuss the difference between a component and a phase. A component is a distinct chemical entity, such as u, Ni, NiO or MgO. A phase is a chemically
ENGR 151: Materials of Engineering LECTURE #15: PHASE DIAGRAMS
 ENGR 151: Materials of Engineering LECTURE #15: PHASE DIAGRAMS TENSILE TESTING VIDEO https://www.youtube.com/watch?v=-qukvzo2jse PROPERTIES OF ISOMORPHOUS ALLOYS Solid solution strengthening For Ni-Cu
Cu/Ag Eutectic System
 Eutectic Systems The simplest kind of system with two solid phases is called a eutectic system. A eutectic system contains two solid phases at low temperature. These phases may have different crystal structures,
Introduction of Materials Materials Science SScience
 材料科學導論 Introduction of Materials Science 許正興國立聯合大學電機工程學系 1. Introduction of Materials Science and Engineering 2. Atomic Structure and Bonding 3. Crystal Structures and Crystal Geometry 4. Solidification,
the Phase Diagrams Today s Topics
 MME 291: Lecture 04 Interpretation of the Phase Diagrams Prof. A.K.M.B. Rashid Department of MME BUET, Dhaka Today s Topics Interpretation of phase diagrams Development of microstructures during equilibrium
CompuTherm LLC Thermodynamic Databases. PanMolybdenum. Thermodynamic database for multi-component Mo-rich alloys. Al B. Copyright CompuTherm LLC
 PanMolybdenum Thermodynamic database for multi-component Mo-rich alloys Zr Al B Si Ti Mo Cr Fe Re O Mn Hf Copyright CompuTherm LLC 1 Components Total of 12 components are included in the database as listed
Binary Phase Diagrams - II
 Binary Phase Diagrams - II Note the alternating one phase / two phase pattern at any given temperature Binary Phase Diagrams - Cu-Al Can you spot the eutectoids? The peritectic points? How many eutectic
Phase Equilibria in Materials
 2017 Fall Phase Equilibria in Materials 10.25.2017 Eun Soo Park Office: 33-313 Telephone: 880-7221 Email: espark@snu.ac.kr Office hours: by an appointment Contents for previous class Positive ΔH m Syntectic
Copyright The McGraw-Hill Companies, Inc. Permission required for reproduction or display. Phase Diagram
 SE104 Structural Materials Phase Diagram Dr. Yu Qiao Department of Structural Engineering, UCSD Introduction Phase: A region in a material that differs in structure and function from other regions. Phase
Metallurgy of Aluminum Die Casting Alloys EC 305 Dave Neff
 Metallurgy of Aluminum Die Casting Alloys EC 305 Dave Neff Dave Neff OUTLINE Where aluminum comes from Why alloys are useful Alloy designation and nomenclature Specific roles of alloy elements Properties
Thermal Analysis phase diagrams
 Thermal Analysis phase diagrams R W McCallum Ames Laboratory And Materials Science and Engineering Why Phase Diagrams Thermal analysis gives us information about phase transitions which are the lines on
From sand to silicon wafer
 From sand to silicon wafer 25% of Earth surface is silicon Metallurgical grade silicon (MGS) Electronic grade silicon (EGS) Polycrystalline silicon (polysilicon) Single crystal Czochralski drawing Single
ADAMIS. Alloy Database for Micro-Solders. Ag Al Sn. ADAMIS Solder. Materials Design Technology Co.,Ltd. 2-5 Odenmacho, Nihonbashi, Chuo-ku
 ADAMIS Alloy Database for Micro-Solders Zn Ag Al Sn Sb ADAMIS Solder Au Bi Pb Ni In Cu Materials Design Technology Co.,Ltd. 2-5 Odenmacho, Nihonbashi, Chuo-ku Tokyo 103-0011 JAPAN Copyright Materials Design
Materials Engineering. Phase transformation Phase diagrams
 Materials Engineering Phase transformation Phase diagrams Phase Transformation Why is it important for us? o Temperature, chemical composition and pressure can change the properties of materials o Understanding
Chapter 10. Phase Diagrams
 Chapter 10 Phase Diagrams Chapter 10 Terminology and Unary System Phase Diagrams Issues to Address... When we combine two elements... what equilibrium state do we get? In particular, if we specify... --a
The Effect of Si Content on the Size of β-al 5 FeSi Intermetallics in Al-Si- Cu-Mg Casting Alloys
 Proceedings of the 9 th International Conference on Aluminium Alloys (2004) 1216 Edited by J.F. Nie, A.J. Morton and B.C. Muddle Institute of Materials Engineering Australasia Ltd The Effect of Si Content
Thermodynamics and Microstructure: Recent Examples for Coupling of Thermodynamic and Mobility Data to the Software MICRESS
 12.09.08 Aachen Thermodynamics and Microstructure: Recent Examples for Coupling of Thermodynamic and Mobility Data to the Software MICRESS Dr. Bernd Böttger ACCESS e.v. Aachen Outline Microstructure Simulation
E3 Redox: Transferring electrons. Session one of two First hour: Discussion (E1) 2nd and 3rd hour: Lab (E3, Parts 1 and 2A)
 2nd and 3rd hour: Lab (E3, Parts 1 and 2A)") E3 Redox: Transferring electrons Session one of two First hour: Discussion (E) 2nd and 3rd hour: Lab (E3, Parts and 2A) Oxidation-Reduction (Redox) Reactions involve electron transfer. Change in charge
E3 Redox: Transferring electrons Session one of two First hour: Discussion (E) 2nd and 3rd hour: Lab (E3, Parts and 2A) Oxidation-Reduction (Redox) Reactions involve electron transfer. Change in charge
Pre-Course Reading for ESI s Solidification Course
 Pre-Course Reading for ESI s Solidification Course A. B. Phillion, J. Dantzig The primary goal of ESI s Solidification Course is to relate material properties and solidification processing conditions to
Effect of strontium and cooling rate upon eutectic temperatures of A319 aluminum alloy
 Effect of strontium and cooling rate upon eutectic temperatures of A319 aluminum alloy E.J. Martínez D, M.A. Cisneros G, S. Valtierra and J. Lacaze Instituto Tecnológico de Zacatecas, Depto. Metal-Mecánica,
Solidification & Binary Phase Diagrams II. Solidification & Binary Phase Diagrams II
 Module 19 Solidification & inary Phase Diagrams II ecture 19 Solidification & inary Phase Diagrams II 1 NPTE Phase II : IIT Kharagpur : Prof. R. N. hosh, Dept of Metallurgical and Materials Engineering
Phase diagrams. R.D.Makwana,IT,NU. R.D.Makwana,IT,NU
 Phase diagrams Phase?? Phase is region throughout which all properties of material are essentially uniform Uniform region of a system which has uniform physical and chemical characteristics Phase diagram?
Thermo-Calc Graphical Mode Examples
 Thermo-Calc Graphical Mode Examples 1 1 Introduction These examples are for the graphical mode of Thermo-Calc; there is a separate set of examples for the console mode. The examples are stored without
The Stabilities of phase
 The Stabilities of phase What is a phase? A phase is a form of matter that is uniform throughout in chemical composition and physical state Example Fig 1. White phosphorus Fig 2.Black phosphorus Fig 3.
Materials and Minerals Science Course C: Microstructure. Eutectic Systems. A single-component melt solidifies directly to a single-component solid:
 Eutectic Systems 1.1 Eutectic Reactions A single-component melt solidifies directly to a single-component solid: Pure Liquid Pure Solid In the last practical we saw that a liquid solution solidifies into
(a) Put names on the phases and show what phases that are in equilibrium in the different areas of the phase diagram.
 Put names on the phases and show what phases that are in equilibrium in the different areas of the phase diagram.") Sett 5 Theme: Phase diagrams The tasks are cut from earlier exams. Task 1 Assume that the phases in the binary diagram under in Fig. 1. has such a minor solid solubility that they can be represented by
Sett 5 Theme: Phase diagrams The tasks are cut from earlier exams. Task 1 Assume that the phases in the binary diagram under in Fig. 1. has such a minor solid solubility that they can be represented by
MME292 Metallic Materials Sessional
 Department of Materials and Metallurgical Engineering angladesh University of Engineering and Technology, Dhaka MME292 Metallic Materials Sessional July 2016 Term Experiment 2 Construction and Interpretation
The Science and Engineering of Materials, 4 th ed Donald R. Askeland Pradeep P. Phulé. Chapter 8 Solid Solutions and Phase Equilibrium
 The Science and Engineering of Materials, 4 th ed Donald R. Askeland Pradeep P. Phulé Chapter 8 Solid Solutions and Phase Equilibrium Objectives of Chapter 8 The goal of this chapter is to describe the
Slide 1. Slide 2. Slide 3. Chapter 10: Solid Solutions and Phase Equilibrium. Learning Objectives. Introduction
 Slide 1 Chapter 10: Solid Solutions and Phase Equilibrium 10-1 Slide 2 Learning Objectives 1. Phases and the phase diagram 2. Solubility and solid solutions 3. Conditions for unlimited solid solubility
Modeling of Casting and Solidification Processes - MCSP 2017 Vol.14 No.5 September (b)
") https://doi.org/10.1007/s41230-017-7144-5 MCSP 2017 - Modeling of Casting and Solidification Processes Vol.14 No.5 September 2017 CHINA FOUNDRY Development of thermophysical calculator for stainless steel
https://doi.org/10.1007/s41230-017-7144-5 MCSP 2017 - Modeling of Casting and Solidification Processes Vol.14 No.5 September 2017 CHINA FOUNDRY Development of thermophysical calculator for stainless steel
Material Science. Prof. Satish V. Kailas Associate Professor Dept. of Mechanical Engineering, Indian Institute of Science, Bangalore India
 Material Science Prof. Satish V. Kailas Associate Professor Dept. of Mechanical Engineering, Indian Institute of Science, Bangalore 560012 India Chapter 6. Phase Diagrams Learning objectives: - To understand
ENGR 151: Materials of Engineering LECTURE #14: PHASE DIAGRAMS
 ENGR 151: Materials of Engineering LECTURE #14: PHASE DIAGRAMS ANNOUNCEMENTS Midterm #2 Monday, May 1. Review on Wednesday, April 26. Chapters 4, 6, 7, 8 TERMINOLOGY Phase: Homogeneous portion of a system
Phase diagrams are diagrammatic representations of the phases present in a
 Chapter 4 What is a binary phase diagram? Phase diagrams are diagrammatic representations of the phases present in a system under specified equilibrium conditions, most often composition, temperature and
Material Properties and Phase Diagrams
 PY2M20 Material Properties and Phase Diagrams ecture 5 P. Stamenov, PhD School of Physics, TCD PY2M20-5 Phase Diagrams - Introduction How much can be done with pure elemental compounds? How many combinations
Chapter 10: Phase Transformations
 Chapter 10: Phase Transformations ISSUES TO ADDRESS... Transforming one phase into another takes time. Fe C FCC (Austenite) Eutectoid transformation Fe 3 C (cementite) + (ferrite) (BCC) How does the rate
ElvaX ProSpector in Exploration & Mining
 ElvaX ProSpector in Exploration & Mining Introduction ElvaX ProSpector is a fast, accurate and easy tool for different mining applications. It provides onsite analysis of ore samples with minimal sample
The contemporary Nickel Cycle
 Center for Industrial Ecology Yale School of Forestry & Environmental Studies The contemporary Nickel Cycle (selection only) Barbara Reck April 24, 2006 Note The slides shown hereafter only include a selection
Chem : Oct. 1 - Oct. 7
 Chem. 125-126: Oct. 1 - Oct. 7 Preparation Pre-lab Report (p.90) for E3 completed Discussion Presentation for E2 completed Pre-lab reading and studies for E3 completed Agenda One hour discussion of E2(Questions,
Chapter 10: Phase Transformations
 Chapter 10: Phase Transformations ISSUES TO ADDRESS... Transforming one phase into another takes time. Fe (Austenite) Eutectoid transformation Fe 3 C (cementite) + C FCC (ferrite) (BCC) How does the rate
Modeling Diffusion: Flux
 Modeling Diffusion: Flux Flux (#/area/time): J = 1 A dm dt Directional Quantity y Jy kg atoms m 2 or s m 2 s Jx Jz x z Flux can be measured for: --vacancies and interstitials --host (A) atoms --impurity
ROLE OF SOLUTE AND TRANSITION METALS IN GRAIN REFINEMENT OF ALUMINUM ALLOYS UNDER ULTRASONIC MELT TREATMENT
 13 th International Conference on Aluminum Alloys (ICAA13) Edited by: Hasso Weiland, Anthony D. Rollett, William A. Cassada TMS (The Minerals, Metals & Materials Society), 2012 ROLE OF SOLUTE AND TRANSITION
Modification of Ohnaka back diffusion equation
 IOP Conference Series: Materials Science and Engineering PAPER OPEN ACCESS Modification of Ohnaka back diffusion equation To cite this article: A Turkeli 2016 IOP Conf. Ser.: Mater. Sci. Eng. 117 012021
MAE 212: Spring 2001 Lecture 14 PHASE DIAGRAMS AND EQUILIBRIUM MICROSTRUCTURES N. Zabaras
 ME 212: Spring 2001 Lecture 14 PHSE DIGRMS ND EQUILIRIUM MICROSTRUCTURES N. Zabaras For more details on the topic read Chapter 9 of the Materials Science for Engineers by J. Shackelford, pp. 304 353. lso
Numerical modelling of the solidification of ductile iron
 Journal of Crystal Growth 191 (1998) 261 267 Numerical modelling of the solidification of ductile iron J. Liu*, R. Elliott Manchester Materials Science Centre, University of Manchester, Grosvenor Street,
Performing Scheil-Gulliver (SG) analysis in MatCalc
 analysis in MatCalc") Performing Scheil-Gulliver (SG) analysis in MatCalc (MatCalc 6.00.0200) P. Warczok Outline Solid phase composition after alloy solidification Back-diffusion effect Primary precipitates Modeling of solid-solid
Performing Scheil-Gulliver (SG) analysis in MatCalc (MatCalc 6.00.0200) P. Warczok Outline Solid phase composition after alloy solidification Back-diffusion effect Primary precipitates Modeling of solid-solid
MODELLING OF THE THERMO-PHYSICAL AND PHYSICAL PROPERTIES FOR SOLIDIFICATION OF AL-ALLOYS
 Light Metals 23 Edited by P. Crepeau (Warrendale, PA: TMS, 23), 999. MODELLING OF THE THERMO-PHYSICAL AND PHYSICAL PROPERTIES FOR SOLIDIFICATION OF AL-ALLOYS N.Saunders 1, X.Li 2, A.P.Miodownik 1 and J.-P.Schillé
Certificate of Analysis
 Brammer Standard Company, Inc. Certificate of Analysis BS 625A Certified Reference Material for Inconel 625 - UNS Number N06625 1 Certified Estimate of Certified Estimate of 2 3 2 Value Uncertainty Value
Chem : Feb.12-17
 Chem. 25-26: Feb.2-7 Preparation Pre-lab Report (p.90) for E3 completed Discussion Presentation for E2 completed Pre-lab reading and studies for E3 completed Lab Agenda One hour discussion of E 2(Questions,
MODELLING OF THE THERMO-PHYSICAL AND PHYSICAL PROPERTIES FOR SOLIDIFICATION OF AL-ALLOYS
 Light Metals 23 Edited by P. Crepeau TMS (The Minerals, Metals & Materials Society), 23 MODELLING OF THE THERMO-PHYSICAL AND PHYSICAL PROPERTIES FOR SOLIDIFICATION OF AL-ALLOYS N.Saunders 1, X.Li 2, A.P.Miodownik
This is an author-deposited version published in : Eprints ID : 16715
 Open Archive TOULOUSE Archive Ouverte (OATAO) OATAO is an open access repository that collects the work of Toulouse researchers and makes it freely available over the web where possible. This is an author-deposited
New Materials from Mathematics Real and Imagined
 New Materials from Mathematics Real and Imagined Richard James University of Minnesota Thanks: John Ball, Kaushik Bhattacharya, Jun Cui, Traian Dumitrica, Stefan Müller, Ichiro Takeuchi, Rob Tickle, Manfred
MS524 Phase Equilibria and Phase Diagrams DMSE, KAIST December 19, Problem 1 (35 Points) Problem 2 (40 Points)
 Problem 2 (40 Points)") MS524 Phase Equilibria and Phase Diagrams DMSE, KAIST December 19, 2005 Final Exam 19:00~midnight Prof. Hyuck Mo Lee Problem 1 (35 Points) Problem 2 (40 Points) Problem 3 (25 Points) 3 Fig. 1 Fig. 2 Fig.
MS524 Phase Equilibria and Phase Diagrams DMSE, KAIST December 19, 2005 Final Exam 19:00~midnight Prof. Hyuck Mo Lee Problem 1 (35 Points) Problem 2 (40 Points) Problem 3 (25 Points) 3 Fig. 1 Fig. 2 Fig.
J = D C A C B x A x B + D C A C. = x A kg /m 2
 1. (a) Compare interstitial and vacancy atomic mechanisms for diffusion. (b) Cite two reasons why interstitial diffusion is normally more rapid than vacancy diffusion. (a) With vacancy diffusion, atomic
Phase diagrams (cont.) and the Fe-C system
 and the Fe-C system") Phase diagrams (cont.) and the Fe-C system Solidification: Pro-eutectic vs Eutectic Pro-eutectic solidification Ideal liquid, uniform distribution Solid Pb(Sn) () nucleates Solubility limit leads to Sn
Phase diagrams (cont.) and the Fe-C system Solidification: Pro-eutectic vs Eutectic Pro-eutectic solidification Ideal liquid, uniform distribution Solid Pb(Sn) () nucleates Solubility limit leads to Sn
CHAPTER 9 PHASE DIAGRAMS PROBLEM SOLUTIONS
 CHAPTER 9 PHASE DIAGRAMS PROBLEM SOLUTIONS Solubility Limit 9.1 Consider the sugar water phase diagram of Figure 9.1. (a) How much sugar will dissolve in 1500 g water at 90 C (194 F)? (b) If the saturated
C β = W β = = = C β' W γ = = 0.22
 9-15 9.13 This problem asks us to determine the phases present and their concentrations at several temperatures, as an alloy of composition 52 wt% Zn-48 wt% Cu is cooled. From Figure 9.19: At 1000 C, a
Chemistry*120* * Name:! Rio*Hondo*College* * * EXAMPLE*EXAM*1*!
 Chemistry*120* * Name: EXAMPLE*EXAM*1* Exam)#1 100)points) Directions:)Answereachquestionbelowtothebestofyourability.Showallworkwherecalculations arerequired.aninformationsheetwithaperiodictableisattachedtothebackoftheexam;youmay
Engineering materials
 1 Engineering materials Lecture 6 Metal and Alloys Phase Diagrams 2 Metals and alloys Some metals may have more than one crystal structure, a phenomenon known as polymorphism ( 同質異性 ), when found in elemental