Supplemental Information. Lithocholic Acid Hydroxyamide Destabilizes. Cyclin D1 and Induces G 0 /G 1 Arrest by Inhibiting. Deubiquitinase USP2a
|
|
|
- Brice Willis
- 6 years ago
- Views:
Transcription
1 Cell Chemical Biology, Volume 24 Supplemental Information Lithocholic Acid Hydroxyamide Destabilizes Cyclin D1 and Induces G 0 /G 1 Arrest by Inhibiting Deubiquitinase USP2a Katarzyna Magiera, Marcin Tomala, Katarzyna Kubica, Virginia De Cesare, Matthias Trost, Bartosz J. Zieba, Neli Kachamakova-Trojanowska, Marcin Les, Grzegorz Dubin, Tad A. Holak, and Lukasz Skalniak
2 Supplemental Figures Figure S1. The impact of LCA and its derivatives on the growth and survival of HCT116 p53 wt and HCT116 p53 -/- cell lines. Related to Figure 1 and Table 2. For MTT assay, the cells were seeded at low confluence and treated with indicated concentrations of the compounds for six days. The graphs show representative results from three experiments.
3 Figure S2. PI-BrdU pulse-chase labeling of HCT116 cells for the evaluation of cell cycle progression following LCAHA treatment. Related to Figure 1. wt HCT116 p53 cells were seeded on culture dishes in growth medium containing 3.3% FBS and treated with LCAHA in a concentration of 1 µm or 5 µm for 48 hours, or with DMSO as a control. One hour before the end of the treatment half of the medium was collected in a falcon tube, and the other half was supplemented with BrdU in a final concentration of 10 µm. After one hour, the medium containing BrdU was removed and the cells were trypsinized and fixed (time t0 ) or cultured in the medium previously collected in the falcon tube for additional 3, 6 or 9 hours. After that time the cells were trypsinized, fixed and stained with FITC conjugated anti-brdu antibody and propidium iodide (PI). The cells were analyzed by flow cytometry using BD Fortessa cell analyzer and BD FACSDIVA software. All cells, as well as FITC positive (BrdU+, top panel) and FITC negative (BrdU-, bottom panel) counts were exported to separate files and analyzed separately using ModFit LT Software. The graphs show mean ± SD values from three independent experiments. The statistical significance was evaluated using one-way ANOVA with Tukey s post-hoc test: * p<0.05, ** p<0.01, *** p<0.001.


4 Figure S3. The analysis of the expression of cyclin D3 and p27 and the activation of p53 pathway by LCA, LCAE and LCAHA. Related to Figure 2. (A) The graphs present densitometry analysis of cyclin D3 and p27 expression form western blot results presented in the Figure 2A of the manuscript. The graphs show mean ± SEM from three independent experiments. The statistical significance was evaluated using one-way ANOVA with Tukey s post-hoc test: ** p<0.01, *** p< wt -/(B) HCT116 p53 (left panels) or HCT116 p53 (right panels) cells were treated with the indicated concentrations of the compounds for 24 (top) or 48 (bottom) hours. Western blot analysis was performed with the indicated antibodies. The figure shows western blot images representative of three independent experiments.
5 Figure S4. The analysis of the progression of MCF-7 and SAOS-2 cells through the cell cycle following serum starvation and release by the addition of serum. Related to Figure 3. For the experiment, cyclin D1-dependent MCF-7 and cyclin D1-negative SAOS-2 cell lines were used. The cells were synchronized in G0/G1 by the removal of FBS for 2 days of the culture in the presence of LCAHA compound. After this time, the cells were released by the addition of the medium supplemented with 10% FBS for 24 hours (still in the presence of the compound). The cells were fixed, stained with PI and analysed for cell cycle distribution with ModFit LT Software. The graphs show mean ± SD values from three independent experiments. The statistical significance was evaluated using t-test: * p<0.05, ** p<0.01.
6
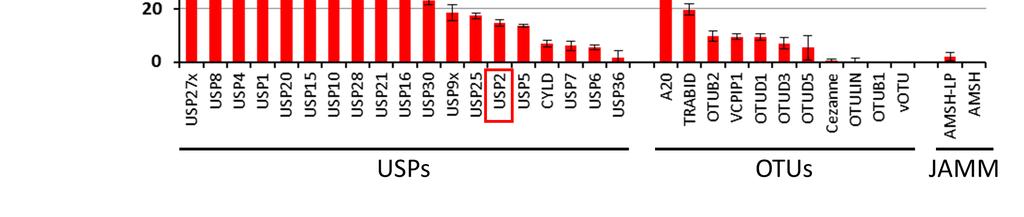
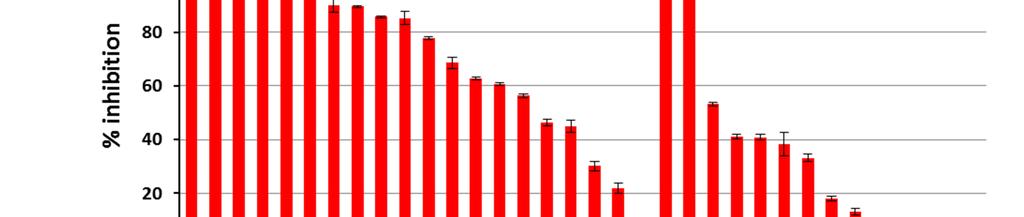
7 Figure S5. The analysis of the activity of NSC and the selectivity of LCAHA and LCAE compounds. Related to Figure 5. (A) The effects of the NSC compound (inhibitor control) on the USP2a activity tested using the Ub-AMC hydrolysis assay. Left panel: The Ub-AMC hydrolysis assay demonstrates that 25 μm NSC inhibits the USP2a enzymatic activity at a similar level as 5 μm LCAHA compound. The graph shows representative data of multiple repeats. Right panel: A dose-response inhibition of USP2a activity measured in the Ub-AMC hydrolysis assay, in the presence of various concentrations of the NSC compound. The graph shows the mean ± SD values from the 3 experiments. (B-D) High throughput MS-based enzyme activity assay was performed on a panel of DUB enzymes in a presence of 100 µm LCAHA (B) or LCAE (C) compounds. The graphs present mean ± SD values from duplicates. (D) The comparison of the inhibitory potential of the tested compounds towards USP proteins and other DUB enzymes. The box charts present 25/75th percentiles ± SD values. All data points are also presented on the chart. The statistical significance was calculated with U Mann-Whitney test: ** p<0.01, *** p<0.001.
8 Supplemental Tables Kinetic constants USP2a Lineweaver-Burk equation USP2a USP2a + 2 μm LCAHA + 5 μm LCAHA K m [μm] 12.2 ± ± ± 3.0 V max [μms -1 ] ± ± ± Table S1. The kinetic constants for USP2a in the presence of the LCAHA compound. Related to Figure 5. Values are determined based on the kinetic analysis of USP2a-catalyzed Ub-AMC hydrolysis. Presented data are determined by fitting the Lineweaver-Burk equation.
Lithocholic Acid Hydroxyamide Destabilizes Cyclin D1 and Induces G 0 /G 1 Arrest by Inhibiting Deubiquitinase USP2a
 Article Lithocholic Acid Hydroxyamide Destabilizes Cyclin D1 and Induces G 0 /G 1 Arrest by Inhibiting Deubiquitinase USP2a Graphical Abstract Authors Katarzyna Magiera, Marcin Tomala, Katarzyna Kubica,...,
Supplementary Table 1. Sequences for BTG2 and BRCA1 sirnas.
 Supplementary Table 1. Sequences for BTG2 and BRCA1 sirnas. Target Gene Non-target / Control BTG2 BRCA1 NFE2L2 Target Sequence ON-TARGET plus Non-targeting sirna # 1 (Cat# D-001810-01-05) sirna1: GAACCGACAUGCUCCCGGA
Apoptosis And Anti-tumor Effect Induced By Mtor Inhibitor And Autophagy Inhibitor In Human Osteosarcoma Cells
 Apoptosis And Anti-tumor Effect Induced By Mtor Inhibitor And Autophagy Inhibitor In Human Osteosarcoma Cells Ryosuke Horie. Kagawa University of medecine, Kita-gun, Japan. Disclosures: R. Horie: None.
Supplemental Material
 Supplemental Material Figure S1.(A) Immuno-staining of freshly isolated Myf5-Cre:ROSA-YFP fiber (B) Satellite cell enumeration in WT and cko mice from resting hind limb muscles. Bulk hind limb muscles
Supplementary Figure S1 Purification of deubiquitinases HEK293 cells were transfected with the indicated DUB-expressing plasmids.
 Supplementary Figure S1 Purification of deubiquitinases HEK293 cells were transfected with the indicated DUB-expressing plasmids. The cells were harvested 72 h after transfection. FLAG-tagged deubiquitinases
Supplementary Material
 Supplementary Material Supplementary Methods Cell synchronization. For synchronized cell growth, thymidine was added to 30% confluent U2OS cells to a final concentration of 2.5mM. Cells were incubated
Technical Bulletin. Multiple Methods for Detecting Apoptosis on the BD Accuri C6 Flow Cytometer. Introduction
 March 212 Multiple Methods for Detecting Apoptosis on the BD Accuri C6 Flow Cytometer Contents 1 Introduction 2 Annexin V 4 JC-1 5 Caspase-3 6 APO-BrdU and APO-Direct Introduction Apoptosis (programmed
SUPPLEMENTARY INFORMATION Figures. Supplementary Figure 1 a. Page 1 of 30. Nature Chemical Biology: doi: /nchembio.2528
 SUPPLEMENTARY INFORMATION Figures Supplementary Figure 1 a b c Page 1 of 0 11 Supplementary Figure 1: Biochemical characterisation and binding validation of the reversible USP inhibitor 1. a, Biochemical
Agarikon.1 and Agarikon Plus Affect Cell Cycle and Induce Apoptosis in Human Tumor Cell Lines
 Agarikon.1 and Agarikon Plus Affect Cell Cycle and Induce Apoptosis in Human Tumor Cell Lines Boris Jakopovich, Ivan Jakopovich, Neven Jakopovich Dr Myko San Health from Mushrooms Miramarska c. 109, Zagreb,
Supplementary Figure 1. RAD51 and RAD51 paralogs are enriched spontaneously onto
 Supplementary Figure legends Supplementary Figure 1. and paralogs are enriched spontaneously onto the S-phase chromatin during DN replication. () Chromatin fractionation was carried out as described in
Supplementary Figure Legend
 Supplementary Figure Legend Supplementary Figure S1. Effects of MMP-1 silencing on HEp3-hi/diss cell proliferation in 2D and 3D culture conditions. (A) Downregulation of MMP-1 expression in HEp3-hi/diss
Supplementary Fig. 1 Proteomic analysis of ATR-interacting proteins. ATR, ARID1A and
 Supplementary Figure Legend: Supplementary Fig. 1 Proteomic analysis of ATR-interacting proteins. ATR, ARID1A and ATRIP protein peptides identified from our mass spectrum analysis were shown. Supplementary
Title: The cleaved FAS ligand activates the Na + /H + exchanger NHE1 through. Akt/ROCK1 to stimulate cell motility.
 Title: The cleaved FAS ligand activates the Na + /H + exchanger NHE through Akt/ROCK to stimulate cell motility. Authors : Monet Michael, Poët Mallorie, Tauzin Sébastien 2,#, Fouqué Amélie 3, Cophignon
This Document Contains:
 This Document Contains: 1. In-Cell Western Protocol II. Cell Seeding and Stimulation Supplemental Protocol III. Complete Assay Example: Detailing the Seeding, Stimulation and Detection of the A431 Cellular
T H E J O U R N A L O F C E L L B I O L O G Y
 T H E J O U R N A L O F C E L L B I O L O G Y Supplemental material Rainero et al., http://www.jcb.org/cgi/content/full/jcb.201109112/dc1 Figure S1. The expression of DGK- is reduced upon transfection
Supplementary Figure 1. Additional RNAi screen data
 Supplementary Figure 1. Additional RNAi screen data A. Cisplatin induced ATR autophosphorylation. Western blot illustrating ATR and phospho-atr (T1989) in cells exposed to 1 µm cisplatin for 24 hours prior
Supplementary Figure 1. Antigens generated for mab development (a) K9M1P1-mIgG and hgh-k9m1p1 antigen (~37 kda) expression verified by western blot
 K9M1P1-mIgG and hgh-k9m1p1 antigen (~37 kda) expression verified by western blot") Supplementary Figure 1. Antigens generated for mab development (a) K9M1P1-mIgG and hgh-k9m1p1 antigen (~37 kda) expression verified by western blot (vector: ~25 kda). (b) Silver staining was used to assess
Supplementary Figure 1. Antigens generated for mab development (a) K9M1P1-mIgG and hgh-k9m1p1 antigen (~37 kda) expression verified by western blot (vector: ~25 kda). (b) Silver staining was used to assess
Supplemental Materials and Methods
 Supplemental Materials and Methods Antibodies: Anti-SRF (cat# Sc-335) and anti-igf1r (sc-712) (Santa Cruz Biotech), and anti- ADAM-10 (14-6211) were from e-bioscience, anti-ku70 (cat# MS-329-P) (Labvision),
Supplementary methods Shoc2 In Vitro Ubiquitination Assay
 Supplementary methods Shoc2 In Vitro Ubiquitination Assay 35 S-labelled Shoc2 was prepared using a TNT quick Coupled transcription/ translation System (Promega) as recommended by manufacturer. For the
Stabilization of the Transcription Factor Foxp3 by the Deubiquitinase USP7 Increases Treg-Cell-Suppressive Capacity
 Immunity, Volume 39 Supplemental Information Stabilization of the Transcription Factor Foxp3 by the Deubiquitinase USP7 Increases Treg-Cell-Suppressive Capacity Jorg van Loosdregt, Veerle Fleskens, Juan
 DOI: 10.1038/ncb3259 A Ismail et al. Supplementary Figure 1 B 60000 45000 SSC 30000 15000 Live cells 0 0 15000 30000 45000 60000 FSC- PARR 60000 45000 PARR Width 30000 FSC- 15000 Single cells 0 0 15000
SUPPLEMENTARY INFORMATION
 SUPPLEMENTARY INFORMATION Legends for Supplementary Tables. Supplementary Table 1. An excel file containing primary screen data. Worksheet 1, Normalized quantification data from a duplicated screen: valid
INOS. Colorimetric Cell-Based ELISA Kit. Catalog #: OKAG00807
 INOS Colorimetric Cell-Based ELISA Kit Catalog #: OKAG00807 Please read the provided manual entirely prior to use as suggested experimental protocols may have changed. Research Purposes Only. Not Intended
Figure S1. USP-46 is expressed in several tissues including the nervous system
 Supplemental Figure legends Figure S1. USP-46 is expressed in several tissues including the nervous system Transgenic animals expressing a transcriptional reporter (P::GFP) were imaged using epifluorescence
Supplementary Methods
 Supplementary Methods Antibodies For immunocytochemistry, the following antibodies were used: mouse anti-γ-h2ax (Upstate), rabbit anti-γ-h2ax (Abcam), rabbit anti-53bp1 (Novus), mouse anti-atm-phosphoserine1981
Promotion of HDF Cell Attachment and Proliferation
 Promotion of HDF Cell Attachment and Proliferation Objectives To qualitatively assess the effect of fibronectin (Fn) on HDF cell attachment Fn Attachment Assay To observe HDF cell proliferation and position
T H E J O U R N A L O F C E L L B I O L O G Y
 T H E J O U R N A L O F C E L L B I O L O G Y Supplemental material Han et al., http://www.jcb.org/cgi/content/full/jcb.201311007/dc1 Figure S1. SIVA1 interacts with PCNA. (A) HEK293T cells were transiently
Androgen Receptor (Phospho-Tyr363) Colorimetric Cell-Based ELISA Kit. Catalog #: OKAG02138
 Colorimetric Cell-Based ELISA Kit. Catalog #: OKAG02138") Androgen Receptor (Phospho-Tyr363) Colorimetric Cell-Based ELISA Kit Catalog #: OKAG02138 Please read the provided manual entirely prior to use as suggested experimental protocols may have changed. Research
Androgen Receptor (Phospho-Tyr363) Colorimetric Cell-Based ELISA Kit Catalog #: OKAG02138 Please read the provided manual entirely prior to use as suggested experimental protocols may have changed. Research
Fig. S1 TGF RI inhibitor SB effectively blocks phosphorylation of Smad2 induced by TGF. FET cells were treated with TGF in the presence of
 Fig. S1 TGF RI inhibitor SB525334 effectively blocks phosphorylation of Smad2 induced by TGF. FET cells were treated with TGF in the presence of different concentrations of SB525334. Cells were lysed and
6 Enzymes II W. H. Freeman and Company
 6 Enzymes II 2017 W. H. Freeman and Company The role of an enzyme in an enzyme-catalyzed reaction is to: A. bind a transition state intermediate, such that it cannot be converted back to substrate. B.
< Supporting Information >
 SUPPORTING INFORMATION 1 < Supporting Information > Discovery of autophagy modulators through the construction of high-content screening platform via monitoring of lipid droplets Sanghee Lee, Eunha Kim,
Focus Application. Cell Migration. Featured Study: Inhibition of Cell Migration by Gene Silencing. xcelligence System Real-Time Cell Analyzer
 xcelligence System Real-Time Cell Analyzer Focus Application Cell Migration Featured Study: Inhibition of Cell Migration by Gene Silencing Markus Greiner and Richard Zimmermann Department of Medical Biochemistry
of Medicine, Zhejiang University, Hangzhou, Zhejiang , China Michigan, 4424B MS-1, 1301 Catherine Street, Ann Arbor, MI 48109, USA.
 Supplemental figure legends: Neddylation inhibitor MLN4924 suppresses growth and migration of human gastric cancer cells Huiyin Lan 1,2#, Zaiming Tang 1#, Hongchuan Jin 2, and Yi Sun 1,3,4* 1 Institute
Engineering tumors with 3D scaffolds
 Engineering tumors with 3D scaffolds Claudia Fischbach, Ruth Chen, Takuya Matsumoto, Tobias Schmelzle, Joan S Brugge, Peter J Polverini & David J Mooney Supplementary figures and text: Supplementary Figure
EGFR (Phospho-Ser695)
") Assay Biotechnology Company www.assaybiotech.com Tel: 1-877-883-7988 Fax: 1-877-610-9758 EGFR (Phospho-Ser695) Colorimetric Cell-Based ELISA Kit Catalog #: OKAG02090 Please read the provided manual entirely
Assay Biotechnology Company www.assaybiotech.com Tel: 1-877-883-7988 Fax: 1-877-610-9758 EGFR (Phospho-Ser695) Colorimetric Cell-Based ELISA Kit Catalog #: OKAG02090 Please read the provided manual entirely
Supplementary Figure 1. Intracellular distribution of the EPE peptide. HeLa cells were serum-starved (16 h, 0.1%), and treated with EPE peptide,
, and treated with EPE peptide,") Supplementary Figure 1. Intracellular distribution of the EPE peptide. HeLa cells were serum-starved (16 h, 0.1%), and treated with EPE peptide, conjugated with either TAT or Myristic acid and biotin for
Supplementary Figure 1. Intracellular distribution of the EPE peptide. HeLa cells were serum-starved (16 h, 0.1%), and treated with EPE peptide, conjugated with either TAT or Myristic acid and biotin for
Supplementary Fig. 1. Schematic structure of TRAIP and RAP80. The prey line below TRAIP indicates bait and the two lines above RAP80 highlight the
 Supplementary Fig. 1. Schematic structure of TRAIP and RAP80. The prey line below TRAIP indicates bait and the two lines above RAP80 highlight the prey clones identified in the yeast two hybrid screen.
ASPP1 Fw GGTTGGGAATCCACGTGTTG ASPP1 Rv GCCATATCTTGGAGCTCTGAGAG
 Supplemental Materials and Methods Plasmids: the following plasmids were used in the supplementary data: pwzl-myc- Lats2 (Aylon et al, 2006), pretrosuper-vector and pretrosuper-shp53 (generous gift of
Cell death analysis using the high content bioimager BD PathwayTM 855 instrument (BD
 Supplemental information Materials and Methods: Cell lines, reagents and antibodies: Wild type (A3) and caspase-8 -/- (I9.2) Jurkat cells were cultured in RPMI 164 medium (Life Technologies) supplemented
Supplementary Figure 1. IFN-γ induces TRC dormancy. a, IFN-γ induced dormancy
 Supplementary Figure 1. IFN-γ induces TRC dormancy. a, IFN-γ induced dormancy of various tumor type TRCs, including H22 (murine hepatocarcinoma) and CT26 (murine colon cancer). Bar, 50 µm. b, B16 cells
Supplementary Figure 1. Gating strategy for flow cytometry analysis of mouse aorta. Cell suspensions from mouse aorta digested with enzyme cocktail
 Supplementary Figure 1. Gating strategy for flow cytometry analysis of mouse aorta. Cell suspensions from mouse aorta digested with enzyme cocktail were stained with propidium iodide (PI), anti-cd45 (FITC),
Primers used for PCR of conductin, SGK1 and GAPDH have been described in (Dehner et al,
 Supplementary METHODS Flow Cytometry (FACS) For FACS analysis, trypsinized cells were fixed in ethanol, rehydrated in PBS and treated with 40μg/ml propidium iodide and 10μ/ml RNase for 30 min at room temperature.
CytoGLOW. IKK-α/β. Colorimetric Cell-Based ELISA Kit. Catalog #: CB5358
 CytoGLOW IKK-α/β Colorimetric Cell-Based ELISA Kit Catalog #: CB5358 Please read the provided manual entirely prior to use as suggested experimental protocols may have changed. Research Purposes Only.
Supporting Information
 Supporting Information Chakrabarty et al. 10.1073/pnas.1018001108 SI Materials and Methods Cell Lines. All cell lines were purchased from the American Type Culture Collection. Media and FBS were purchased
SUPPLEMENTARY INFORMATION
 doi:10.1038/nature09732 Supplementary Figure 1: Depletion of Fbw7 results in elevated Mcl-1 abundance. a, Total thymocytes from 8-wk-old Lck-Cre/Fbw7 +/fl (Control) or Lck-Cre/Fbw7 fl/fl (Fbw7 KO) mice
Stargazin regulates AMPA receptor trafficking through adaptor protein. complexes during long term depression
 Supplementary Information Stargazin regulates AMPA receptor trafficking through adaptor protein complexes during long term depression Shinji Matsuda, Wataru Kakegawa, Timotheus Budisantoso, Toshihiro Nomura,
Data Sheet. TDO Cell-Based Assay Kit Catalog #72033
 Data Sheet TDO Cell-Based Assay Kit Catalog #72033 6044 Cornerstone Court W, Ste E Background L-tryptophan (L-Trp) is an essential amino acid necessary for protein synthesis in mammalian cells and the
Cell were phenotyped using FITC-conjugated anti-human CD3 (Pharmingen, UK)
") SUPPLEMENTAL MATERIAL Supplemental Methods Flow cytometry Cell were phenotyped using FITC-conjugated anti-human CD3 (Pharmingen, UK) and anti-human CD68 (Dako, Denmark), anti-human smooth muscle cell α-actin
SUPPLEMENTAL MATERIAL Supplemental Methods Flow cytometry Cell were phenotyped using FITC-conjugated anti-human CD3 (Pharmingen, UK) and anti-human CD68 (Dako, Denmark), anti-human smooth muscle cell α-actin
Supplementary Information. ATM and MET kinases are synthetic lethal with. non-genotoxic activation of p53
 Supplementary Information ATM and MET kinases are synthetic lethal with non-genotoxic activation of p53 Kelly D. Sullivan 1, Nuria Padilla-Just 1, Ryan E. Henry 1, Christopher C. Porter 2, Jihye Kim 3,
Online Supporting Material for. The Bisecting GlcNAc on N-Glycans Inhibits Growth. Factor Signaling and Retards Mammary Tumor
 Online Supporting Material for The Bisecting GlcNAc on N-Glycans Inhibits Growth Factor Signaling and Retards Mammary Tumor Progression Yinghui Song 1, Jason A. Aglipay 1, Joshua D. Bernstein 2, Sumanta
Supporting Information
 Supporting Information Su et al. 10.1073/pnas.1211604110 SI Materials and Methods Cell Culture and Plasmids. Tera-1 and Tera-2 cells (ATCC: HTB- 105/106) were maintained in McCoy s 5A medium with 15% FBS
Farnesoid X Receptor and its ligands inhibit the function of platelets
 Farnesoid X Receptor and its ligands inhibit the function of platelets Article Accepted Version Figures and Legends Moraes, L. A., Unsworth, A. J., Vaiyapuri, S., Ali, M. S., Sasikumar, P., Sage, T., Flora,
Supplementary Information: Materials and Methods. GST and GST-p53 were purified according to standard protocol after
 Supplementary Information: Materials and Methods Recombinant protein expression and in vitro kinase assay. GST and GST-p53 were purified according to standard protocol after induction with.5mm IPTG for
Supplementary Fig S1 Nutlin-3a treatment does not affect cell cycle progression in the absence
 Supplementary Figure Legends Supplementary Fig S1 Nutlin-3a treatment does not affect cell cycle progression in the absence of p53 or p21. HCT116 cells which were null for either p53 (A) or p21 (B) were
Single cell resolution in vivo imaging of DNA damage following PARP inhibition. Supplementary Data
 Single cell resolution in vivo imaging of DNA damage following PARP inhibition Katherine S. Yang, Rainer H. Kohler, Matthieu Landon, Randy Giedt, and Ralph Weissleder Supplementary Data Supplementary Figures
B. ADM: C. D. Apoptosis: 1.68% 2.99% 1.31% Figure.S1,Li et al. number. invaded cells. HuH7 BxPC-3 DLD-1.
 A. - Figure.S1,Li et al. B. : - + - + - + E-cadherin CK19 α-sma vimentin β -actin C. D. Apoptosis: 1.68% 2.99% 1.31% - : - + - + - + Apoptosis: 48.33% 45.32% 44.59% E. invaded cells number 400 300 200
Supplementary Figure 1. TSA (10 nmol/l), non-class-selective HDAC inhibitor, potentiates
, non-class-selective HDAC inhibitor, potentiates") Supplementary Figure 1. TSA (10 nmol/l), non-class-selective HDAC inhibitor, potentiates vascular calcification (VC). (a) Von Kossa staining shows that TSA potentiated the Pi-induced VC. Scale bar, 100
Supplementary Figure 1. TSA (10 nmol/l), non-class-selective HDAC inhibitor, potentiates vascular calcification (VC). (a) Von Kossa staining shows that TSA potentiated the Pi-induced VC. Scale bar, 100
Biotin Labeling Kit-SH
 Biotin Labeling Kit-SH Catalog Number KA0004 1 Kit Version: 02 Intended for research use only www.abnova.com Table of Contents Introduction... 3 Background... 3 Principle of the Assay... 3 General Information...
Supplementary Figure 1: Sequence alignment of partial stem region of flaviviruses
 Supplementary Figure 1: Sequence alignment of partial stem region of flaviviruses E prtoeins. Polyprotein sequences of viruses were downloaded from GenBank and aligned by CLC Sequence Viewer software.
Supplementary Material: Peroxisomes protect lymphoma cells from HDAC inhibitor-mediated apoptosis
 Supplementary Material: Peroxisomes protect lymphoma cells from HDAC inhibitor-mediated apoptosis Michael S Dahabieh 1,2, ZongYi Ha 1,5, Erminia Di Pietro 3,5, Jessica N Nichol 1, Alicia M Bolt 1,4, Christophe
Supplementary Materials. Enhancing Endosomal Escape for Intracellular Delivery. of Macromolecular Biologic Therapeutics
 Supplementary Materials Enhancing Endosomal Escape for Intracellular Delivery of Macromolecular Biologic Therapeutics Peter Lönn 1,2, Apollo D. Kacsinta 1, Xian-Shu Cui 1, Alexander S. Hamil 1, Manuel
PKA α/β CAT (Phospho-Thr197)
") Assay Biotechnology Company www.assaybiotech.com Tel: 1-877-883-7988 Fax: 1-877-610-9758 PKA α/β CAT (Phospho-Thr197) Colorimetric Cell-Based ELISA Kit Catalog #: OKAG01634 Please read the provided manual
Assay Biotechnology Company www.assaybiotech.com Tel: 1-877-883-7988 Fax: 1-877-610-9758 PKA α/β CAT (Phospho-Thr197) Colorimetric Cell-Based ELISA Kit Catalog #: OKAG01634 Please read the provided manual
EdU Click FC ROTI kit for Flow Cytometry
 USER MANUAL EdU Click FC EdU Click FC Introduction and product description: The detection of cell proliferation is of utmost importance for assessing cell health, determining genotoxicity or evaluating
EdU Flow Cytometry Kit. User Manual
 User Manual Ordering information: (for detailed kit content see Table 2) EdU Flow Cytometry Kits for 50 assays: Product number EdU Used fluorescent dye BCK-FC488-50 10 mg 6-FAM Azide BCK-FC555-50 10 mg
Mechanism Of Action Study
 Mechanism Of Action Study Sample Project Study Report Task Order: #DEMO Applicable to all LabChip assays, including: Protein kinases Lipid kinases Phosphatases Proteases Phosphodiesterases (PDEs) HistoneDeACetylases
Supplementary Materials
 Supplementary Materials Supplementary Figure 1. PKM2 interacts with MLC2 in cytokinesis. a, U87, U87/EGFRvIII, and HeLa cells in cytokinesis were immunostained with DAPI and an anti-pkm2 antibody. Thirty
Development of a General Aza-Cope Reaction Trigger Applied to Fluorescence Imaging of Formaldehyde in Living Cells
 Supporting Information for Development of a General Aza-Cope Reaction Trigger Applied to Fluorescence Imaging of Formaldehyde in Living Cells Kevin J. Bruemmer,, Ryan R. Walvoord,,, Thomas F. Brewer, Guillermo
Transcriptional regulation of BRCA1 expression by a metabolic switch: Di, Fernandez, De Siervi, Longo, and Gardner. H3K4Me3
 ChIP H3K4Me3 enrichment.25.2.15.1.5 H3K4Me3 H3K4Me3 ctrl H3K4Me3 + E2 NS + E2 1. kb kb +82 kb Figure S1. Estrogen promotes entry of MCF-7 into the cell cycle but does not significantly change activation-associated
Multiplex Fluorescence Assays for Adherence Cells without Trypsinization
 Multiplex Fluorescence Assays for Adherence Cells without Trypsinization The combination of a bright field and three fluorescent channels allows the Celigo to perform many multiplexed assays. A gating
Supplementary Fig. 1 Identification of Nedd4 as an IRS-2-associated protein in camp-treated FRTL-5 cells.
 Supplementary Fig. 1 Supplementary Fig. 1 Identification of Nedd4 as an IRS-2-associated protein in camp-treated FRTL-5 cells. (a) FRTL-5 cells were treated with 1 mm dibutyryl camp for 24 h, and the lysates
VEGFR2 (Phospho-Tyr1175)
") Assay Biotechnology Company www.assaybiotech.com Tel: 1-877-883-7988 Fax: 1-877-610-9758 VEGFR2 (Phospho-Tyr1175) Colorimetric Cell-Based ELISA Kit Catalog #: OKAG02081 Please read the provided manual
Assay Biotechnology Company www.assaybiotech.com Tel: 1-877-883-7988 Fax: 1-877-610-9758 VEGFR2 (Phospho-Tyr1175) Colorimetric Cell-Based ELISA Kit Catalog #: OKAG02081 Please read the provided manual
MLN8237 induces proliferation arrest, expression of differentiation markers and
 Supplementary Figure Legends Supplementary Figure 1 827 induces proliferation arrest, expression of differentiation markers and polyploidization of a human erythroleukemia cell line with the activating
Add Live, Dead and Total Dyes. Overnight Variable 30 min. 10 min 5 min. 30 min
 Cell Viability Analysis using Calcein AM, Propidium Iodide and Hoechst Application Description Celigo Application Plate Type Major Steps Cell viability analysis using Calcein AM, Propidium Iodide and Hoechst
THE JOURNAL OF CELL BIOLOGY
 Supplemental Material THE JOURNAL OF CELL BIOLOGY Yeung et al., http://www.jcb.org/cgi/content/full/jcb.200903020/dc1 Figure S1. Assessment of the surface charge of maturing phagosomes. (A C and F H) RAW
Supplemental Information Inventory
 Cell Stem Cell, Volume 6 Supplemental Information Distinct Hematopoietic Stem Cell Subtypes Are Differentially Regulated by TGF-β1 Grant A. Challen, Nathan C. Boles, Stuart M. Chambers, and Margaret A.
Data Sheet PD-1 / NFAT - Reporter - Jurkat Recombinant Cell Line Catalog #: 60535
 Data Sheet PD-1 / NFAT - Reporter - Jurkat Recombinant Cell Line Catalog #: 60535 Product Description Recombinant Jurkat T cell expressing firefly luciferase gene under the control of NFAT response elements
Data Sheet IDO2 - HEK293 Recombinant Cell Line Cat #: 60533
 Data Sheet IDO2 - HEK293 Recombinant Cell Line Cat #: 60533 Description Recombinant HEK293 cell line expressing tetracycline-inducible human indoleamine 2,3- dioxygenase (IDO2), Genbank accession number
Supplemental Fig. 1: PEA-15 knockdown efficiency assessed by immunohistochemistry and qpcr
 Supplemental figure legends Supplemental Fig. 1: PEA-15 knockdown efficiency assessed by immunohistochemistry and qpcr A, LβT2 cells were transfected with either scrambled or PEA-15 sirna. Cells were then
In vivo BrdU Incorporation Assay for Murine Hematopioetic Stem Cells Ningfei An, Yubin Kang *
 In vivo BrdU Incorporation Assay for Murine Hematopioetic Stem Cells Ningfei An, Yubin Kang * Division of Hematology-Oncology, Department of Medicine, Medical University of South Carolina, Charleston,
Nature Medicine: doi: /nm.4464
 Supplementary Fig. 1. Amino acid transporters and substrates used for selectivity screening. (A) Common transporters and amino acid substrates shown. Amino acids designated by one-letter codes. Transporters
Thanasoula et al. - Fig. S1
 S HK1si G1 Thanasoula et al. - Fig. S1 G2/M HK2si 1 3 5 7 9 11 13 hours after double thymidine block release Figure S1. U2OS synchronous cell cycle progression. U2OS cells transfected with, POT1, HK1,
Supplementary Figure 1 a
 3 min PMA 45 min PMA AnnexinV-FITC Supplementary Figure 1 5 min PMA 15 min PMA a 9 min PMA 12 min PMA 5 min FGF7 15 min FGF7 3 min FGF7 6 min FGF7 9 min FGF7 12 min FGF7 5 min control 3 min control 6 min
Supplementary Figure 1. Related to Figure 1. Characterization of centrosome fragmentation in mitotically delayed RPE1 cells. (a) Cells transiently
 Cells transiently") Supplementary Figure 1. Related to Figure 1. Characterization of centrosome fragmentation in mitotically delayed RPE1 cells. (a) Cells transiently transfected with EGFP centrin-2 (Green), synchronized
Supplementary Figure 1. Related to Figure 1. Characterization of centrosome fragmentation in mitotically delayed RPE1 cells. (a) Cells transiently transfected with EGFP centrin-2 (Green), synchronized
Proteasome Activity Fluorometric Assay Kit II (Cat. # J4120)
") Proteasome Activity Fluorometric Assay Kit II (Cat. # J4120) Each supplied substrate is sufficient for use in 250 X 100 µl reactions to monitor the chymotrypsin-like (Suc-LLVY- AMC), trypsin-like (Boc-LRR-AMC)
Proteasome Activity Fluorometric Assay Kit II (Cat. # J4120) Each supplied substrate is sufficient for use in 250 X 100 µl reactions to monitor the chymotrypsin-like (Suc-LLVY- AMC), trypsin-like (Boc-LRR-AMC)
Single cell imaging of Bruton's Tyrosine Kinase using an irreversible inhibitor
 SUPPLEMENTARY INFORMATION Single cell imaging of Bruton's Tyrosine Kinase using an irreversible inhibitor Anna Turetsky 1,a, Eunha Kim 1,a, Rainer H. Kohler 1, Miles A. Miller 1, Ralph Weissleder 1,2,
Isolation of mouse monocytes: Mouse monocytes were isolated using a modified
 Supplemental Material Extended Methods Isolation of mouse monocytes: Mouse monocytes were isolated using a modified method described (1). Citrated mouse whole blood was mixed with equal volume of PBS,
SUPPLEMENTARY INFORMATION
 SUPPLEMENTARY INFORMATION doi:10.1038/nature12138 Supplementary Figure 1. Knockdown of KRAS leads to a reduction in macropinocytosis. (a) KRAS knockdown in MIA PaCa-2 cells expressing KRASspecific shrnas
Supplementary Figure 1. GST pull-down analysis of the interaction of GST-cIAP1 (A, B), GSTcIAP1
, GSTcIAP1") Legends Supplementary Figure 1. GST pull-down analysis of the interaction of GST- (A, B), GST mutants (B) or GST- (C) with indicated proteins. A, B, Cell lysate from untransfected HeLa cells were loaded
Legends Supplementary Figure 1. GST pull-down analysis of the interaction of GST- (A, B), GST mutants (B) or GST- (C) with indicated proteins. A, B, Cell lysate from untransfected HeLa cells were loaded
Supplemental Data. Zhang et al. Plant Cell (2014) /tpc
 /tpc") Supplemental Data. Zhang et al. Plant Cell (214) 1.115/tpc.114.134163 55 - T C N SDIRIP1-GFP 35-25 - Psb 18 - Histone H3 Supplemental Figure 1. Detection of SDIRIP1-GFP in the nuclear fraction by Western
Supplemental Data. Zhang et al. Plant Cell (214) 1.115/tpc.114.134163 55 - T C N SDIRIP1-GFP 35-25 - Psb 18 - Histone H3 Supplemental Figure 1. Detection of SDIRIP1-GFP in the nuclear fraction by Western
DUB Activity Kit. StressXpress. Catalog# SKT-136 (96-Well Kit) Discovery through partnership Excellence through quality
 Discovery through partnership Excellence through quality") Discovery through partnership Excellence through quality StressXpress DUB Activity Kit Catalog# SKT-136 (96-Well Kit) Fluorometric detection of DUB activity TABLE OF CONTENTS GENERAL INFORMATION 3 Materials
Discovery through partnership Excellence through quality StressXpress DUB Activity Kit Catalog# SKT-136 (96-Well Kit) Fluorometric detection of DUB activity TABLE OF CONTENTS GENERAL INFORMATION 3 Materials
SUPPLEMENTARY INFORMATION
 VOLUME: 1 ARTICLE NUMBER: 0011 In the format provided by the authors and unedited. In situ Activation of Platelets with Checkpoint Inhibitors for Post-Surgical Cancer Immunotherapy Chao Wang 1, 2, Wujin
This is the author's accepted version of the manuscript.
 This is the author's accepted version of the manuscript. The definitive version is published in Nature Communications Online Edition: 2015/4/16 (Japan time), doi:10.1038/ncomms7780. The final version published
Emanuela Tumini, Sonia Barroso, Carmen Pérez Calero and Andrés Aguilera
 SUPPLEMENTARY INFORMATION Roles of human POLD1 and POLD3 in genome stability Emanuela Tumini, Sonia Barroso, Carmen Pérez Calero and Andrés Aguilera SUPPLEMENTARY METHODS Cell proliferation After sirna
High throughput screening: Huh-7 cells were seeded into 96-well plate (2000
 1 SUPPLEMENTARY INFORMATION METHODS 6 7 8 9 1 11 1 1 1 1 16 17 18 19 High throughput screening: Huh-7 cells were seeded into 96-well plate ( cells/well) and infected with MOI of DENV-. One hour post-infection
Cell Cycle Phase Determination Kit
 Cell Cycle Phase Determination Kit Catalog Number KA1301 100 assays Version: 04 Intended for research use only www.abnova.com Table of Contents Introduction... 3 Intended Use... 3 Background... 3 General
Protocol for FACS analysis of HeLa cell transfectants
 Protocol for FACS analysis of HeLa cell transfectants You can refer to: Marks et al., 1995, J. Cell Biol. 131: 351-369; Voorhees et al., 1995, EMBO J. 14: 4961-4975; or Marks et al., 1996, J. Cell Biol.
Alpha or beta human chorionic gonadotropin knockdown decrease BeWo cell fusion by
 Alpha or beta human chorionic gonadotropin knockdown decrease BeWo cell fusion by down-regulating PKA and CREB activation Sudha Saryu Malhotra 1, Pankaj Suman 2 and Satish Kumar Gupta 1 * 1 Reproductive
Journal of Cell Science Supplementary Material
 1 2 3 4 5 6 7 8 9 10 11 12 13 14 15 16 17 18 19 20 21 22 23 24 25 26 27 28 29 30 31 32 33 SUPPLEMENTARY FIGURE LEGENDS Figure S1: Eps8 is localized at focal adhesions and binds directly to FAK (A) Focal
Notes on experimental technique: 1. Enzyme activity was measured by noting the increase in absorbance at 341 nm, as NADPH +
 Case 2 Glucose-6-phosphate dehydrogenase activity and cell growth Focus concept The activity of the pentose phosphate pathway enzyme glucose-6-phosphate dehydrogenase has been found to be important in