Guidance Document on Achievement Determination. Canada-wide Standards for Particulate Matter and Ozone
|
|
|
- Marybeth April Small
- 6 years ago
- Views:
Transcription

1 Guidance Document on Achievement Determination Canada-wide Standards for Particulate Matter and Ozone Revised PN PDF Canadian Council of Ministers of the Environment, 2007
2 The Canadian Council of Ministers of the Environment (CCME) is the major intergovernmental forum in Canada for discussion and joint action on environmental issues of national, international and global concern. The 14 member governments work as partners in developing nationally consistent environmental standards, practices and legislation. Canadian Council of Ministers of the Environment 123 Main St., Suite 360 Winnipeg, Manitoba R3C 1A3 Telephone: (204) Fax: (204) ISBN: PDF PN 1391 Ce document est également publié en français.
3 Foreword This Guidance Document responds to the commitment by the Canadian Council of Ministers of the Environment (CCME) in the Canada-wide Standards (CWS) for Particulate Matter (PM) and Ozone to develop a Guidance Document on Achievement Determination. It takes into account the direction given in the CWS Reporting Protocol and the important direction on principles, commitments, and roles and responsibilities of the federal, provincial and territorial governments (hereinafter referred to as jurisdictions ) contained in the CWS themselves, and in the Canada-wide Accord on Environmental Harmonization and its Canada-wide Environmental Standards Sub- Agreement. This Guidance Document is intended as a reference tool for jurisdictions and the public, providing information, methodologies, criteria and procedures for reporting on achievement of the CWS for PM and ozone. It also provides the guidelines for ensuring consistency and comparability of data when meeting other CWS reporting requirements. This document was prepared through an open and transparent process by the Working Group on Monitoring and Reporting, established by the PM and Ozone CWS Joint Action Implementation Coordinating Committee (JAICC). The Working Group included representatives from federal, provincial and regional governments as well as participants from health and environmental groups and industry. This Guidance Document has been endorsed by CCME. It will be updated periodically as directed by CCME. The Guidance Document on Achievement Determination was originally published in October During its development, jurisdictions agreed that it may be necessary in the future to review the suitability, effectiveness and resource needs of some of the methodologies and procedures outlined in the GDAD. Appropriate changes would be implemented as warranted in collaboration with the jurisdictions. Four regional projects (from Alberta, Quebec, Atlantic Region and Ontario) were undertaken to test the methodologies, criteria and procedures contained in the Guidance Document. Following their completion, a national meeting was held in February Representatives of appropriate federal and provincial government jurisdictions, industry and NGOs reviewed the results of the four demonstration projects to determine the effectiveness of the GDAD and, where necessary, develop recommendations for modifications to the GDAD for consideration by CCME. The document, in general, was considered to be providing adequate guidance at this point in time. However, the group believed that enhancements were necessary to increase its usability and effectiveness as a guidance tool. The meeting resulted in 27 recommendations for modifications to the Guidance Document and 6 recommendations concerning CWS documents or process. Cornus Environmental was awarded a contract to incorporate the recommendations from the 2005 Workshop into this revised version of the Guidance Document on Achievement Determination. i
4 Table of Contents Foreword...i List of Tables... iv List of Figures... iv 1. INTRODUCTION Purpose and Application Background to the CWS for PM and Ozone IDENTIFYING COMMUNITIES FOR ACHIEVEMENT DETERMINATION Context Delineating Reporting Areas CWS Reporting Communities Subdividing Larger CMAs DESIGNATING MONITORING SITES FOR ACHIEVEMENT DETERMINATION Context Designating Monitoring Sites for PM Designating Monitoring Sites for Ozone DETERMINING CWS ACHIEVEMENT Context Calculation Methodologies and Criteria for PM Sampling Frequency Data Completeness Calculating the 24-hour Average Concentration Spatial Averaging of Daily Values Calculating the Annual 98 th Percentile Value Calculating the 3-Year Average Calculation Methodologies and Criteria for Ozone Sampling Frequency Data Completeness Calculating 8-hour Averages Calculating Daily Maximum 8-hour Average Concentration Calculating the Annual 4 th Highest Daily 8-hour Ozone Value Calculating the 3-Year Average ACCOUNTING FOR TRANSBOUNDARY FLOW Context Application Demonstrating the Influence of Transboundary Flow Step 1: Determining the Origin of the Air Parcel on CWS Exceedance Days Step 2: Analyzing the Transboundary Contribution on Exceedance Days Step 3: Modeling Events Demonstrating Best Efforts ACCOUNTING FOR BACKGROUND LEVELS AND NATURAL EVENTS Context ii
5 6.2 Application Demonstrating the Influence of Background Levels Step 1: Determining the Origin of the Air Parcel on CWS Exceedance Days Step 2: Analyzing the Contribution of High Background Levels on Exceedance Days Step 3: Modeling Events Demonstrating the Influence of Natural Events Demonstrating the Influence of Stratospheric Intrusion on Levels of Ozone Demonstrating the Influence of Forest Fires on Levels of PM 2.5 and Ozone Demonstrating the Influence of Extreme Wind Events on Levels of PM Demonstrating Best Efforts CWS Exceedances Attributed to Background Levels CWS Exceedances Attributed to Natural Events APPENDIX A Canada-wide Standards for Particulate Matter and Ozone...43 APPENDIX B Canadian Census Metropolitan Areas and Census Agglomerations 53 APPENDIX C Maps Showing CMAs and CAs...58 APPENDIX D Number Handling and Rounding Conventions, and Data Completeness Criteria...66 APPENDIX E Monitoring and Reporting Working Group Members...71 References and Bibiliography...73 iii
6 List of Tables Table 1: CMA/CA size and corresponding population coverage (based on 2001 Census)5 Table 2: CMA/CAs with Population > 100,000 by Province/Territory (based on 2001Census)...7 Table 3: Urban Centres with Populations > 500,000 (based on 2001 Census)...9 Table 4: Ozone Levels at Selected Sites in Canada, List of Figures Figure 1: CMA/CA population/size as a percentage of Canada's total population...6 Figure 2: Examples for establishing RSA....9 Figure 3: The Three-Step Approach to Demonstrating Significant Transboundary Influence for Each Exceedance Day...23 Figure 4: Step 2 Analysis for Demonstrating Significant Transboundary Influence for Each Exceedance Day...25 Figure 5: Step 3 Analysis for Demonstrating Significant Transboundary Influence for Each Exceedance Day iv
7 Acronyms and abbreviations 7 Be Beryllium CA Census Agglomeration CAPMoN Canadian Air and Precipitation Monitoring Network CCME Canadian Council of Ministers of the Environment CEC Commission on Environmental Cooperation (under NAFTA) CMA Census Metropolitan Area CSD Census Subdivision CT Census Tract CWS Canada-wide Standard EPA Environmental Protection Agency (U.S.) km kilometre NAPS National Air Pollution Surveillance (Network) NARSTO Originally the North American Research Study on Tropospheric Ozone, rechartered in 1999 to include airborne particulate matter; its name is no longer an acronym NH 3 Ammonia NO Nitric Oxide NO X Nitrogen Oxides NO Y All oxidized nitrogen compounds (NO, NO2, peroxyacetyl nitrate {PAN}, etc.) PEMA Pollution Emission Management Area (Ozone Annex, Canada U.S. Air Quality Agreement) PM Particulate Matter PM 2.5 Particulate Matter less than or equal to 2.5 microns in diameter PM 10 Particulate Matter less than or equal to 10 microns in diameter ppb parts per billion RSA Reporting Sub-Area SO 2 Sulphur Dioxide μg/m 3 microgram per cubic metre VOCs Volatile Organic Compounds v
8 1. INTRODUCTION 1.1 Purpose and Application This Guidance Document on Achievement Determination is a tool to help federal, provincial and territorial governments (hereinafter referred to as jurisdictions ) ensure consistent treatment of comparable data within their various regimes for reporting on the Canada-wide Standards (CWS) for particulate matter (PM) and ozone. Jurisdictions should use this document in conjunction with the CWS Monitoring Protocol, which provides technical details on monitoring procedures and methodology. This document is intended primarily as a reference tool for jurisdictions and the public, providing information, methodologies, criteria and procedures for annual reporting on achievement of the CWS target levels for PM and ozone, beginning in Applying achievement determination methodologies for the CWS for PM and ozone involves some ground-breaking work, especially with respect to accounting for transboundary flow, background levels and natural events. As jurisdictions gain experience applying these methodologies, it will be necessary to review their applicability and effectiveness, and to make appropriate changes to ensure that accounting is carried out and reported in a fair, consistent and efficient manner. Jurisdictions recognize that achievement determination will take a significant amount of expertise and effort, especially in the early stages. The federal government, together with the provinces and territories, will continue to support this effort. Where applicable, the methodologies and direction provided in this document should also be followed for the other CWS reporting requirements. This will ensure consistency in reporting parameters and will allow direct comparison of data and results of analyses. Providing all information in a form consistent with the guidance in this document will help the public gauge jurisdictions progress toward meeting their CWS commitments. It is recommended that jurisdictions follow the guidance in this document when: reporting on progress to their respective publics on a regular basis, the timing and scope of reporting to be determined by each jurisdiction; preparing the 5-year comprehensive reports; maintaining data on ambient measurements and making it available to the public; reporting on other communities (i.e. population less than 100,000); reporting on progress for the CWS provisions on Continuous Improvement and Keeping Clean Areas Clean. It is recommended that jurisdictions begin some form of annual reporting on progress as soon as possible, including, for example, ambient levels in the statistical forms recommended in this document, progress toward identifying communities for reporting, and other findings that are relevant to the criteria and methodologies in this document. Such reporting should begin well in advance of the 2010 target date for achieving the CWS target levels. This will allow jurisdictions to gain experience in applying the methodologies described below. 1
9 In accordance with direction provided in the CWS Reporting Protocol, this Guidance Document gives jurisdictions general and specific direction on the information, methodologies, criteria and procedures they need to address the basic elements of reporting on achievement of the CWS for PM and ozone: Chapter 2 explains the concepts used to identify CWS reporting areas and gives recommendations and the rationale on who should report on progress toward meeting CWS for PM and ozone. Chapter 3 gives recommendations and the rationale for where PM and ozone monitoring sites should be located within CWS reporting communities. Chapter 4 defines the PM and ozone data requirements and recommended calculation methodologies for determining achievement. Chapters 5 and 6 give recommendations for methodologies to take into account the influence of two significant regional circumstances recognized in the CWS for PM and ozone: first, that some areas of Canada are highly affected by transboundary air pollution; and second, that high background levels of PM and ozone may sometimes occur through natural events in some parts of the country. 1.2 Background to the CWS for PM and Ozone On June 5, 2000, in accordance with the 1998 Canada-wide Accord on Environmental Harmonization and its Canada-wide Environmental Standards Sub-Agreement, the Canadian Council of Ministers of the Environment (CCME), except Quebec, endorsed CWS for PM and ozone. The CWS Agreement confirms that PM and ozone negatively affect human health and the environment, and establishes the need for nationally coordinated, long-term management aimed at minimizing risk from these pollutants. In agreeing to the CWS, federal, provincial and territorial jurisdictions across Canada have made strong commitments to implement the CWS, to share information respecting implementation, and to be accountable to their respective publics. The CWS Agreement consists of several parts: Part 1 establishes numerical targets and timeframes for achieving the goals within each jurisdiction. Part 2 establishes the steps each jurisdiction will take toward implementing plans, programs and actions to meet the standards within agreed-to timeframes; sets out provisions for subsequent reviews of the standards; and prescribes the scope of content and timing for jurisdictions to report on their progress toward meeting the standards. Annex A acknowledges the need to take preventative action in many areas of the country, with provisions for developing strategies such as Continuous Improvement and Keeping Clean Areas Clean. Annex B provides direction for jurisdictional reporting on all aspects of the CWS, from management plans and actions to achievement of the numerical targets. 2
10 The numerical targets and timeframes for the CWS are: For fine particulate matter (PM 2.5 ): 30 μg/m 3, 24-hour averaging time, achievement to be based on the 98th percentile annual ambient measurement, averaged over 3 consecutive years, by 2010 For ozone: 65 ppb, 8-hour averaging time, achievement to be based on the 4th highest annual ambient measurement, averaged over 3 consecutive years, by 2010 The reporting provisions in Part 2 of the CWS Agreement commit jurisdictions to report on progress toward meeting the numerical targets and timeframes, implementation of emission reduction plans and programs, and review of the standards as follows: (a) to the respective publics of each jurisdiction on a regular basis, the timing and scope of reporting to be determined by each jurisdiction; (b) to Ministers and the public, with comprehensive reports at 5-year intervals beginning in 2006 and reports on achievement and maintenance of the CWS annually beginning in 2011, in accordance with guidance provided in Annex B. Annex B to the CWS for PM and ozone (the Reporting Protocol) contains provisions designed to help jurisdictions ensure consistency and comparability in their reporting, and to help the public better understand how jurisdictions plan to track and report on their progress. To help meet these objectives, the CCME committed in the Reporting Protocol to cooperate in the preparation and periodic update as required, of a Guidance Document on Achievement Determination for the PM and ozone CWS. The Reporting Protocol also commits jurisdictions to maintain their own data on ambient measurements of PM 2.5, PM 10 and ozone and to make it accessible to the public. To ensure the coordination of such monitoring data, jurisdictions will develop a Monitoring Protocol (2002) to help maintain consistent and comparable national monitoring procedures and methodologies. For further reference, the CWS Agreement is included as Appendix A of this document. 3
11 2. IDENTIFYING COMMUNITIES FOR ACHIEVEMENT DETERMINATION 2.1 Context Section B.3.2 of the Reporting Protocol contains the following provisions: Jurisdictions will use a community-oriented approach for reporting on achievement of the PM and ozone CWS. Jurisdictions will report on CWS achievement for population centres over 100,000. Jurisdictions may also report on CWS achievement for communities with populations less than 100,000 based on such considerations as regional population density, proximity to sources, local air quality, etc. The geographic units for grouping of municipalities (census metropolitan areas or CMAs, census agglomerations or CAs, census subdivisions or CSDs) established by Statistics Canada will be used as guidance for community identification. Larger CMAs may be subdivided into smaller sub-areas to better capture variation within the CMA. The Guidance Document will contain a listing of CMAs and CAs in Canada and suggested criteria for subdividing larger CMAs. 2.2 Delineating Reporting Areas Reporting areas for the PM and ozone CWS serve several purposes: to help the public understand the air quality conditions in their local area; to identify the areas where emission reductions are necessary to improve air quality; to indicate the extent of the air quality problem in a province/territory and across the entire country, and identify trends as air quality improves. Most of Canada s vast land area is sparsely populated and, with each passing decade, a greater proportion of the total population is found in urban settings. Nearly 80% of Canadians now live in urban centres with a population of 10,000 or greater, comprising only 4% of Canada s total land mass (6% excluding the territories). As a result, Statistics Canada has developed a metropolitan (urban) hierarchy of geographical units to statistically define Canada s political core communities. The census boundary concepts used to define these geographical units are as follows: Census Metropolitan Areas / Census Agglomerations Statistics Canada has created groupings of municipalities that are closely interconnected because urban-focused economies tend to expand beyond official municipal or county boundaries in terms of shopping trips and commuter travel. The resulting geographic units are called census metropolitan areas (CMAs) for larger urban centres (100,000 or more in their urban core in the previous census) and census agglomerations (CAs) for smaller urban centres (with an urban core of at least 10,000 but less than 100,000 in the previous census). According to the 2001 Census, there were 27 CMAs and 113 CAs in Canada. See Appendix B for a complete listing of the CMAs/CAs in Canada and Appendix C for maps showing the locations of the CMAs/CAs. 4
12 Census Subdivision Census subdivision (CSD) is the general term applied to municipalities (as determined by provincial legislation) or their equivalent. Adjacent CSDs are used as building blocks for CMAs/CAs if they meet certain criteria. Because most provinces have established their own CSDs, the number and size of CSDs can vary considerably from one province to another. Also, there has been a steady decrease in the number of municipalities, caused by an increasing number of dissolutions and amalgamations. Census Tracts Smaller-scale census tracts (CTs) that represent neighbourhood-like areas of 2,500 to 8,000 people have been established within all CMAs and CAs that contain an urban core with a population of 50,000 or more in the previous census. The CT boundaries generally follow permanent physical features such as major streets and railway tracks and attempt to approximate cohesive socio-economic areas. Table 1 provides a breakdown of CMA/CA size and number and corresponding population coverage. In 2001, there were 34 CMAs/CAs in Canada with populations greater than 100,000, representing more than 20 million people or about two thirds of Canada s total population. In 2001, four out of five Canadians (23.8 million) lived in an urban area with a population greater than 10,000. Table 1: CMA/CA size and corresponding population coverage (based on 2001 Census) CMA/CA Size 2001 Population Number of CMAs/CAs Percentage of Total Population > 4,000,000 4,682, > 2,000,000 8,109, > 1,000,000 11,159,876 4* 37.2 > 500,000 15,065, > 100,000 20,147, > 50,000 21,720, > 10,000 23,842, ** 79.4 Total 30,007, * Includes the interprovincial Ottawa Gatineau CMA ** Labrador City CA was not included because its population has fallen below 10,000. Figure 1 illustrates the population distribution in Canada as a percentage of the total population by CMA/CA size. Various CMA/CA population thresholds are indicated by the red vertical dashed lines. Figure 1 shows the high percentage of Canadians living in our most populated urban centres. 5


13 Figure 1: CMA/CA population/size as a percentage of Canada's total population 6
14 2.3 CWS Reporting Communities The CWS Agreement stipulates that as a basic requirement, jurisdictions will report on CWS achievement for population centres over 100,000. In identifying communities for reporting, jurisdictions should use the latest available census data. See Appendix B for 2001 census data. For CMAs with populations greater than 500,000, jurisdictions should subdivide the CMA into reporting sub-areas (RSAs) according to the recommendations in Section 2.4. Table 2 summarizes the minimum number of reporting communities for each province and territory. Table 2: CMA/CAs with Population > 100,000 by Province/Territory (based on 2001Census) Province 2001 Population CMA/CAs >100K CMA/CA >100K Population % of Total Newfoundland & Labrador 512, , Prince Edward Island 135, Nova Scotia 908, , New Brunswick 729, , Quebec 7,237, ,812, Ontario 11,410, ,879, Manitoba 1,119, , Saskatchewan 978, , Alberta 2,974, ,889, British Columbia 3,907, ,593, Yukon 28, Northwest Territories 37, Nunavut 26, Canada 30,007, ,147, Includes province portion of Ottawa Gatineau CMA Jurisdictions may also report on CWS achievement for communities with populations less than 100,000 based on such considerations as regional population density, proximity to sources, and local air quality. In reviewing Table 2, it should be noted that Prince Edward Island and the territories do not meet minimum reporting requirements (i.e. they do not have population centres over 100,000). However, the intent behind the principles, concepts and commitments to reporting and accountability in the CWS Agreement would support the need for at least one monitoring station for each of P.E.I., Yukon, the Northwest Territories and Nunavut. 7
15 2.4 Subdividing Larger CMAs CMAs often extend over several municipalities (i.e. CSDs) and cover an area much larger than the urban cores they contain. To ensure adequate representation of ambient air concentrations across highly populated metropolitan areas, jurisdictions should review CMAs with populations greater than 500,000 to determine if there is a need to subdivide the CMA into RSAs. In particular, jurisdictions should examine the spatial uniformity of PM and ozone concentrations across the CMA. The spatial uniformity of PM and ozone concentrations across the CMA may be determined by analyzing existing air quality and meteorological data and by modelling. Short-term passive and mobile monitoring may be useful in providing supplemental data for such analyses. Jurisdictions may also use RSAs as means to describe communities within a CMA in order to better inform the public of their local air quality. While the size and number of RSAs would vary according to these considerations, generally, RSAs should have a population of approximately 500,000 or less. In establishing RSAs, jurisdictions should: Use existing census boundaries (CSDs or CTs) that the public recognizes (e.g. municipalities, neighbourhoods, physical features such as rivers, or major roadways). Ensure that the RSAs represent a combined total of at least 90% of the CMA population. Ensure that, for PM 2.5, ambient concentrations are spatially uniform across the RSA. Jurisdictions should also consider such other factors as variations in topography, meteorology, land-use and settlement patterns. Table 3 lists the nine CMAs in Canada that had populations greater than 500,000 in
 Toronto 4,682,897 5,903 24 7 (87) Montreal 3,426,350 4,047 109 3 (44) Vancouver 1,986,965 2,879 39 5 (69) Calgary 951,395 5,083 9 1 (92) Edmonton 937,845 9,419 40 1 (71) Ottawa 806,096 5,318 13 2")
16 Table 3: Urban Centres with Populations > 500,000 (based on 2001 Census) CMA 2001 Population Area (km 2 ) Number of CSDs No. of CSDs population > 100k (% of CMA pop.) Toronto 4,682,897 5, (87) Montreal 3,426,350 4, (44) Vancouver 1,986,965 2, (69) Calgary 951,395 5, (92) Edmonton 937,845 9, (71) Ottawa 806,096 5, (82) Quebec City 682,757 3, (25) Winnipeg 671,274 4, (92) Hamilton 662,401 1, (97) Ontario part of the Ottawa Gatineau CMA. Total 2001 population of this CMA is 1,063,664. In reviewing Table 3, establishing RSAs may not be straightforward because the number and size of CSDs can vary considerably from one urban centre to another. Figure 2 shows two possible approaches for establishing RSAs in large CMAs. In the example to the left, a CMA with a population between 500,000 and 1,000,000 has one large census subdivision where 90% of the CMA population resides. In this scenario, two RSAs are established by partitioning the CSD along a major roadway. RSA A is made up of the western part of the CSD and RSA B is made up of the eastern part of the CSD plus three adjacent CSDs. Figure 2: Examples for establishing RSA. In the example to the right, a CMA with a population greater than 2,000,000 contains several CSDs with populations greater than 100,000. In this scenario, five RSAs have been established using the CSDs with population greater than 100,000 and adjacent CSDs. Together, the five RSAs account for more than 90% of the CMA population. Not all CSDs must necessarily be covered by the RSAs. 9
17 Jurisdictions may also choose to establish more than the suggested minimum number of RSAs for large CMAs or to establish RSAs for CMAs with populations less than 500,000. For example, jurisdictions may want to establish RSAs for CMAs that contain more than one urban core within the CMA boundary or that may be subject to variations in ambient particle concentrations due to such factors such as topography, meteorology and landuse. 10
18 3. DESIGNATING MONITORING SITES FOR ACHIEVEMENT DETERMINATION 3.1 Context Section B.3.3 of the Reporting Protocol contains the following provisions: i. CWS achievement will be based on community-oriented monitoring (i.e. sites located where people live, work and play rather than at expected maximum impact points for specific emission sources). ii. Rural (or background) sites will not be included for CWS achievement determination. iii. The Guidance Document will contain guidance on selecting community-oriented monitoring sites. The stated long-term air quality management goal for PM and ozone is to minimize the risks of these pollutants to human health and the environment. The CWS for PM and ozone were derived from observed human health effects associated with ambient air concentrations measured at central fixed ambient monitoring stations. Ambient concentration measurements from these stations are used to represent the exposure of the people in a community. The primary monitoring objective for PM and ozone CWS achievement determination is to determine representative concentrations in populated areas and (principally for ozone) the highest representative concentrations in a metropolitan area. Community-oriented monitoring sites are intended to characterize area-wide public exposure in populated areas. Monitors should be located in residential, commercial, industrial or other areas where people spend a significant part of their time. Jurisdictions will review the current monitoring network to determine what modifications and additional monitors are needed to meet the monitoring requirements for CWS achievement determination. Measurements for achievement determination are taken at fixed monitoring sites at specified time intervals. To satisfy different monitoring objectives, stations are sited by location and varying spatial scales of representativeness. The spatial scale of representativeness is described in terms of the physical dimensions of the air parcel sampled by the monitoring station throughout which actual pollutant concentrations are reasonably similar. Refer to the CWS Monitoring Protocol for probe siting criteria for the various spatial scales, the appropriate spatial scales to be used for the different monitoring objectives, and guidance for locating stations. 11
19 The U.S. Environmental Protection Agency (EPA) defines five categories of spatial scales in its guidelines for siting State and Local Air Monitoring Stations and National Air Monitoring Stations 7, 16 : Microscale. Localized areas such as downtown street canyons, traffic corridors or a major stationary source such as a power plant where the general public would be exposed to maximum concentrations. Middle Scale. Downtown areas that people typically pass through, areas near major roadways, areas such as parking lots, and feeder streets generally with dimensions of a few hundred metres. Neighbourhood Scale. Reasonably homogeneous urban sub-regions with dimensions of a few kilometres and of generally more regular shape than the middle scale. Urban Scale. Entire metropolitan or rural area ranging in size from 4 to 50 kilometres. Regional Scale. Dimensions of as much as 100s of kilometres with some degree of homogeneity. 3.2 Designating Monitoring Sites for PM 2.5 PM 2.5 monitoring stations should satisfy neighbourhood or urban scale requirements as defined in Section 3.1. Measurements at a neighbourhood or urban scale represent appropriate conditions for PM 2.5 achievement determination purposes because they are reasonably homogeneous sub-regions (i.e. homogeneous in PM 2.5 concentrations, as well as land-use and land-surface characteristics) with dimensions from a few kilometres up to 10s of kilometres. Community- or population-oriented measurements are best suited to characterize areawide exposure levels and the associated population health impacts. Monitors should be located in residential, commercial, industrial or other areas where people live, work and play. Community-oriented monitoring sites should not, however, be unduly influenced by a nearby emission source; for example, they should not be on the fence line of an industrial facility or beside a roadway. The highest ambient measurements of PM in a community are likely to be in areas closest to large emitting sources; however, these measurements are not necessarily representative of the concentration to which the majority of the population is exposed. Community-oriented measurements will promote the design of control strategies that will reduce broader community-wide exposure to PM. Monitors should be designated for CWS achievement reporting purposes. 12
20 3.3 Designating Monitoring Sites for Ozone As with PM 2.5, ozone monitoring stations should satisfy neighbourhood or urban scale requirements, as defined in Section 3.1 above. Measurements at a neighbourhood or urban scale represent appropriate conditions for ozone achievement determination purposes because they are reasonably homogeneous sub-regions with dimensions from a few kilometres up to 10s of kilometres. These scales are appropriate for assessing health effects because they represent conditions in areas where people spend a large part of their time. Monitors should be located in residential, commercial, industrial or other areas where people live, work and play. In metropolitan areas urban scale monitoring stations should also be located in areas of expected maximum ozone concentrations. Commonly in large metropolitan areas, maximum ozone concentrations will occur beyond the urban fringe immediately downwind of the most densely populated areas. However, there is also the potential for higher ozone concentrations at upwind sites when regional concentrations are greater than urban concentrations. Similarly, greater up-wind concentrations may occur at higher elevation sites and in areas where topography and synoptic meteorological conditions are conducive to intrusion of stratospheric ozone into the troposphere. Given the complexities of ozone distribution in metropolitan areas, there is a need to determine areas of maximum ozone concentrations by conducting an ozone analysis that considers local sources of ozone precursors, ozone sinks, regional ozone concentrations and meteorology, site elevation and topography. The lowest ozone concentrations in a metropolitan area typically occur in the urban centre and in locations near ozone precursor sources. Mid-range concentrations typically occur in neighbourhoods and locations surrounding the urban centre. Community-oriented measurements are best suited to characterize area-wide exposure levels and the associated population health impacts. Ozone monitoring sites identified for CWS reporting purposes should be established in locations that are both representative of the neighbourhood or urban scale and not impacted by emissions from local combustion sources. Problematic impacts from local sources may be avoided by seeking out and using local knowledge of NO X sources and local meteorology when selecting monitoring sites. Passive and mobile monitoring may also be useful additions to local knowledge and data from established monitoring networks for determining optimal locations for ozone monitoring sites. Static monitors and long-term monitoring sites should be designated for CWS achievement reporting purposes. It is desirable to co-locate ozone and PM 2.5 monitors providing that the representativeness of the monitoring data is not compromised. 13
21 4. DETERMINING CWS ACHIEVEMENT This sections provides information for calculating the required 3-year averages. Appendix D provides a more comprehensive step-by-step instructions on the number handling convention, rounding convention, and data completeness criteria to be used for calculating the 3-year averages. In case of conflict between the information presented in Appendix D and this section, the methods described in Appendix D will take precedence. 4.1 Context Section B.3.4 of the Reporting Protocol contains the following provisions: For PM CWS achievement determination, measurements from each multiple continuous (or daily) population-oriented monitoring station within a CMA/CA or RSA will be spatially averaged for each year (up to three) for which measurement is available. For ozone CWS achievement determination, the monitoring station with the highest average ozone concentration within a CMA/CA or RSA will be used. The Guidance Document will contain methodology for determining the 98 th percentile annual ambient levels for PM 2.5 and the 4 th highest annual ambient levels for ozone from monitors that measure at various frequencies or for which there are fewer than 365 measurements per year. It will also contain methodologies for determining spatial averages. 4.2 Calculation Methodologies and Criteria for PM 2.5 The level and form of the achievement statistic specified for PM 2.5 in the CWS is: 30 μg/m 3, 24-hour averaging time, achievement to be based on the 98 th percentile annual ambient measurement, averaged over 3 consecutive years, by For determining achievement of the CWS for PM 2.5, jurisdictions should use the following calculation methodologies, which are listed in sequence Sampling Frequency Daily sampling is required for determining achievement of the CWS for PM Data Completeness Valid Daily Value A daily value for PM 2.5 refers to the 24-hour average concentration of PM 2.5 in μg/m 3 measured from midnight to midnight (local time). For continuous monitors, at least 18 hourly measurements are required to calculate a valid daily value. For manual samplers, the sampler must run for at least 18 hours during the day. 14
22 Annual Data Completeness An annual data set should be considered complete if at least 75% of the scheduled sampling days in each quarter have valid data. Years with less than 75% data in any quarter and a 98 th percentile value greater than or equal to the CWS (30 µg/m³) should be flagged and included in the 3-year average calculation Calculating the 24-hour Average Concentration A daily value for PM 2.5 refers to the 24-hour average concentration of PM 2.5 in μg/m 3 covering the period from midnight to midnight (local time). The 24-hour PM 2.5 is to be reported to one decimal place based on the rounding procedures in Appendix D. It is calculated from: where, Χ d = (x 1 + x x n ) / n Χ d is 24-hour average concentration x is hourly PM 2.5 concentration for hours 1 to n n is the number of valid hourly measurements in the day ( 18) Spatial Averaging of Daily Values If there is more than one qualifying monitoring site in the reporting area, the arithmetic average of the valid daily values for all qualifying monitors should be calculated to provide the representative daily PM 2.5 concentrations in μg/m 3 for the community for each day. The arithmetic average value should be rounded to the nearest 0.1 μg/m 3. The example below shows several scenarios for determining the spatial average for an RSA with three CWS designated monitors. EXAMPLE: Spatial Averaging of Daily Values Date Monitor 1 Monitor 2 Monitor 3 Spatial Average (μg/m 3 ) [( ) 3] = (31.9 rounded) N/A 26.3 [( ) 2] = (26.0 rounded) N/A N/A (10.3 1) = Calculating the Annual 98 th Percentile Value Use of percentiles is a means of adjusting for differences in sample sizes and ensuring that the values used for achievement determination are not unduly affected by extreme 15
23 events. The 98 th percentile is the daily value out of a year of monitoring data below which 98 percent of all values fall. Annual 98 th percentiles are to be reported to one decimal place. For the purpose of the PM 2.5 CWS, the annual 98 th percentile (98P) is determined and defined as follows: Sort all the daily 24-hour PM 2.5 concentration values for the given year into an array of numbers ordered from lowest to highest (x 1, x 2, x 3,..x n ). Repeat equal values as many times as they occur. Then Calculate the number "id" defined as, where, id = 0.98*n (the product of 0.98 and n), i = the integer part of the number d = the decimal part of the number n = total number of the daily 24-hour concentration values The annual 98P is then defined to be the (i + 1) th largest value in the ordered array (x 1, x 2, x 3,..x n ) For the daily 24-hour PM 2.5 concentrations that satisfy the data completeness criteria, the above steps yield a 98P that correspond to the following based on the total number of available daily concentration values. EXAMPLE: 98 th Percentiles Number of Samples per Year (n) with % data completeness 98 th Percentile (μg/m 3 ) th highest concentration th highest concentration th highest concentration For areas with more than one qualifying monitor, the daily values to use are the daily spatial averages of the daily PM 2.5 concentrations from each qualifying monitor. Spatial averages are rounded to the nearest 0.1 μg/m 3. The above definition of percentiles differs somewhat from the common statistical definition of percentiles. As such, the use of commercial statistical software may yield a 98P that differs from a 98P calculated using the methods prescribed above. Consequently, jurisdictions should ensure that any statistical software used to calculate the annual 98 th percentile does so in a manner that is consistent with the method delineated in this section. 16
24 4.2.6 Calculating the 3-Year Average Jurisdictions should calculate the 3-year average of the annual 98 th percentile values for each reporting area using the three most recent consecutive calendar years of monitoring data that meet annual data completeness criteria. If only two of the three years data are available, then jurisdictions should base the value for comparison with the CWS on the average of the two years. The 3-year averages of annual 98 th percentile value should be reported as integers by rounding based on the procedures in Appendix D. 4.3 Calculation Methodologies and Criteria for Ozone The level and form of the achievement statistic specified for ozone in the CWS is: 65 ppb, 8-hour averaging time, achievement to be based on the 4 th highest annual ambient measurement, averaged over 3 consecutive years, by For determining achievement of the CWS for ozone, jurisdictions should use the following calculation methodologies, which are listed in sequence Sampling Frequency Jurisdictions should record ozone concentrations as hourly averages continuously over a calendar year. One-hour averages are the integration of continuous ozone readings taken over a 1-hour time period, with the result stored in the end hour of the period (e.g. the hourly average for hour 02:00 is the average concentration from 01:00 hours to 02:00 hours). Hourly ozone values are to be reported as integers by rounding based on the procedures in Appendix D Data Completeness Valid Daily Value Jurisdictions should count an ozone monitoring day as a valid day if valid 8-hour averages are available for at least 75% of the possible hours in the day (i.e. 18 of the 24 averages). If less than 75% of the 8-hour averages are available, jurisdictions should count a day as a valid day if the computed daily maximum 8-hour average ozone concentration is greater than 65 ppb. Annual Data Completeness Jurisdictions may consider an annual data set complete if daily maximum 8-hour average concentrations are available for at least 75% of the days during the combined 2nd and 3rd quarters of the year (April to September). Years with incomplete data should be flagged and included in the 3-year average calculation only if the annual 4 th highest daily maximum 8-hour ozone concentration is greater than 65 ppb. 17
25 4.3.3 Calculating 8-hour Averages Jurisdictions should compute running 8-hour averages for each hour of the year, with the result reported for the end hour of each 8-hour period. They should compute an 8-hour average if at least 6 (i.e. 75%) of the hourly averages are available for the 8-hour period. If only 6 or 7 hours are available, they should compute the average using the sum of values divided by 6 or 7. Because the 8-hour averages are reported by end hour, there will be some overlap with the previous day s hourly data. The 8-hour averages are to be reported to one decimal place based on the rounding procedures in Appendix D. The running 8-hour average reported for hour 01 on a given day is the average of hourly values reported for the hours of 18:00 of the previous day through to and including hour 01:00 of the current day. The running 8-hour average reported for hour 24 in a given day is the average of hourly values reported for the hours of 17:00 of the current day through to and including hour 24:00 of the current day. Given a set of consecutive hourly values y 1, y 2, y 3 the running 8-hour averages are defined by the sequence of arithmetic means, y 1 + y y 8, y 2 + y y (8+1), y 3 + y y (8+2), Calculating Daily Maximum 8-hour Average Concentration Twenty-four possible running 8-hour averages can be calculated for each day (except the first day). The daily maximum 8-hour average concentration for a given calendar day is the highest of the 24 possible 8-hour averages computed for that day. Jurisdictions should compute these values for each day with ambient ozone monitoring data Calculating the Annual 4 th Highest Daily 8-hour Ozone Value The annual 4 th highest daily 8-hour ozone value for a given monitor is the 4 th highest value in the array of daily maximum 8-hour average concentrations for the year. If there is more than one qualifying monitor in a reporting area, the value to choose for the purpose of CWS achievement determination is the highest, annual 4 th highest daily 8-hour ozone of all qualifying monitors. Year Percentage of Valid 2 nd and 3 rd Quarter Data 8-hour Daily Maximum Concentrations (ppb) 1 st Highest 2 nd Highest 3 rd Highest 4 th Highest % % %
26 4.3.6 Calculating the 3-Year Average Jurisdictions should compute the 3-year average of the annual 4 th highest daily 8-hour average ozone value for each reporting area using the three most recent consecutive calendar years of monitoring data that meet the annual data completeness criteria. If only two of the three years data are available, then jurisdictions should base the value for comparison with the CWS on the average of the two years. The computed 3-year or 2- year averages should be rounded to an integer based on the rounding procedures in Appendix D. The 3-year average of the annual 4 th highest daily maximum 8-hour average for the tabular data in above is: Avg 4 th highest = ( )/3 = ppb which is rounded to 72 ppb for CWS reporting purposes. 19
27 5. ACCOUNTING FOR TRANSBOUNDARY FLOW 5.1 Context Section B.3.5 of the Reporting Protocol contains the following provisions: Communities will be identified in reporting as transboundary influenced communities that are unable to achieve the CWS until further reduction in transboundary flow occurs if jurisdictions demonstrate (i) that continued exceedance of the CWS is due primarily to transboundary flow of PM, ozone or their precursor pollutants from the United States or from another province/territory, and (ii) that they have made best efforts to reduce contributions to the excess levels from pollutant sources within the jurisdiction. For the province of Ontario, a 45% reduction in NO X and volatile organic compound (VOC) emissions from 1990 levels by 2010 or earlier, subject to successful negotiations this fall [2002] with the U.S. for equivalent reductions, will be considered the province s appropriate level of effort toward achieving the ozone CWS. Any remaining ambient ozone levels above the CWS in Ontario will be considered attributable to the transboundary flow from the U.S. of ozone and its precursor pollutants. Demonstration of the influence of transboundary flow will be a shared responsibility of the federal government and the affected province/territory. Demonstration of best efforts will include measures in both provincial/territorial and federal implementation plans. The Guidance Document will contain methodologies for demonstrating the influence of transboundary flow and criteria on what would constitute best efforts. The existence of regional transport of pollutants such as PM and ozone and their precursors, especially in eastern North America, has been well documented. Scientific literature includes a number of assessments dating as far back as the 1980s, and, most recently, the 1997 Canadian Acid Rain Assessment, 4 the 1996 NO X /VOC Assessments, 3 the 2000 North American Research Study on Tropospheric Ozone (NARSTO) Assessment of Tropospheric Ozone Pollution, 2 the 1997 Commission for Environmental Cooperation (CEC) Report on Long-Range Transport of Ground-Level Ozone and its Precursors, 9 and the final report of the Ozone Transport Assessment Group in the United States. 11 Indeed, it is now accepted that tropospheric ozone and PM 2.5 reside in the atmosphere for several days, and thus, that a given source area can affect a receptor 100s to 1,000s of kilometres downwind. The Ozone Annex of the Canada U.S. Air Quality Agreement, for example, includes in its Pollution Emission Management Area (PEMA) for ozone all the states in the eastern United States within 500 kilometres of the Canada U.S. border. It also requires biennial reports containing ambient air quality information for all relevant ozone monitors within 500 kilometres of the entire border. 10 This is not to say that the impact of transboundary transport from the United States does not extend beyond 500 kilometres of the border, either for ozone or PM. Because the atmospheric lifetime of 20
28 PM 2.5 is typically 8 to 10 days, about twice that for ozone (3 to 5 days), transboundary transport of PM 2.5 could penetrate considerably deeper into southern Canada than ozone. 6 Significant interprovincial transport of ozone and its precursors has also been demonstrated. 3 In the United States, assessment of transboundary contributions, at least for ozone, is based largely on modeling using various types of deterministic photochemical transport models that are specified by the U.S. EPA, with a focus on air pollution episodes. However, evaluation of these models has shown that they can often be in error by 10 to 20 ppb or even more when predicting hourly ozone concentrations. For these reasons, the recommendations for demonstrating the influence of transboundary flow on CWS achievement contained in the following sections are based on a combination of measurements and modeling. 5.2 Application Section B.3.5 of the Reporting Protocol requires that before a community can be designated as a transboundary influenced community, jurisdictions must demonstrate both the influence of transboundary flow and best efforts to reduce emissions. For CWS purposes, primarily due to transboundary flow is defined as evidence that the air flow came from a transboundary source region and that the pollutant concentration of the transboundary air parcel, as measured at a designated upwind monitor, is 90% of the CWS ( 27 μg/m 3 for PM 2.5 and 59 ppb for ozone). In some circumstances, modeling will be required to remove the ambient portion attributable to sources within the province/territory. It is important that jurisdictions determine the transboundary influence and best efforts in sequence because both steps are likely to require considerable effort and resources. In demonstrating the influence of transboundary flow, they can rely to some degree on available ambient data, but they may also have to perform atmospheric modeling if a community may be affected by transport from a variety of source regions both within and outside of the province/territory in which it is located. To demonstrate best efforts, jurisdictions would have to analyze control measures that have actually been put in place and perform modeling analysis based on estimates of the emission reductions achieved. Estimating the extent of implementation of controls and emission reductions achieved has proven to be a difficult task in the past. In addition, demonstrating best efforts, in most cases, would build upon the findings of demonstrating transboundary flow influence. Furthermore, if jurisdictions cannot demonstrate that the CWS exceedance is primarily due to transboundary flow, then they do not need to demonstrate best efforts. For the province of Ontario, a 45% reduction in NOx and volatile organic compound (VOC) emissions from 1990 by 2010 or earlier, subject to successful negotiations this fall [2002] with the U.S. for equivalent reductions, will be considered for the province s appropriate level of effort towards achieving the ozone CWS. Any remaining ambient ozone levels above the CWS in Ontario will be considered attributable to the transboundary flow from the U.S. of ozone and its precursor pollutants. 21
29 In some cases, it may take jurisdictions several years to collect supporting data and to perform analyses and modeling for demonstrating the influence of transboundary flow and best efforts. This should not, however, delay their annual reporting of measured values and calculated statistics for CWS achievement determination. When reporting on CWS achievement in these cases, jurisdictions should flag the information as potentially influenced by transboundary flow until the appropriate analyses have been completed. 5.3 Demonstrating the Influence of Transboundary Flow To demonstrate that transboundary flow is the main reason for exceedance of the CWS, jurisdictions will need to recalculate the 3-year averages after discounting the contribution attributed to transboundary flow. If the recalculated values show that the CWS is achieved, the jurisdiction has demonstrated a significant transboundary influence; that is, the jurisdiction would have met the CWS if there had not been significant influence from transboundary transport. To do this, jurisdictions should follow the threestep approach illustrated in Figure 4. Jurisdictions should carry out these three steps for each year that the annual ozone or PM value exceeds the CWS. To reduce unnecessary work and analyses, the three steps should be carried out in sequence for a single exceedance day (starting with the highest) before proceeding to analyze the next highest exceedance day. In addition, performing each subsequent step is dependent on whether a positive result was achieved in the previous step; for example, jurisdictions need not proceed to Step 2 for that exceedance day if Step 1 did not show a transboundary influence. It should be noted that where an upwind monitor is not affected by other anthropogenic sources from within its province or territory that is, it is clear that transboundary sources are the only influence on the upwind monitor jurisdictions may only need to carry out Steps 1 and 2 to demonstrate the influence of transboundary flow. In other cases for example, where anthropogenic emission sources in the province may be affecting the upwind monitor jurisdictions will also need to carry out the modeling in Step 3 to identify the sole contribution of the transboundary flow. 22
30 Figure 3: The Three-Step Approach to Demonstrating Significant Transboundary Influence for Each Exceedance Day Step 1: Determine if air parcel originates from a transboundary source region No No Yes Step 2: Analyze exceedance days Ambient level at upwind monitor 90% of CWS? Yes, from transboundary source regions only NOT INFLUENCED BY TRANSBOUNDARY FLOW No Yes, but from source regions both within jurisdiction and outside Step 3: Model events with emissions within jurisdiction shut off Ambient level 90% of CWS? INFLUENCED BY TRANSBOUNDARY FLOW Yes Jurisdictions should carry out the three steps until: four daily ozone values, or 7 or 8 daily PM 2.5 values exceeding the CWS level that are not transboundary influenced are identified (using the 4 th highest value as the readjusted annual 4 th highest daily 8-hour ozone value, or the 7 th or 8 th value as the readjusted 24-hour average concentration for PM 2.5 ); or a daily value falls below the CWS (using this number as the readjusted daily value for either PM 2.5 or ozone). Jurisdictions should use the adjusted values to recalculate the 3-year average. If this figure falls below the CWS, then the jurisdiction has demonstrated transboundary influence for this community. See the example of Community A in Figure 6 of Section for a further explanation of this. The next step would be for jurisdictions to determine whether best efforts have indeed been made to reduce contributions to the excess levels from pollution sources within the jurisdiction or whether further controls are necessary. 23
31 5.3.1 Step 1: Determining the Origin of the Air Parcel on CWS Exceedance Days An aerometric analysis should be carried out to establish the origin of the air parcel for each exceedance day. Various aerometric data analysis approaches are available, such as those carried out in the NO X /VOC Assessment Data Analysis Work Group report 3 and the CEC Report on Long-Range Transport of Ground-Level ozone and Its Precursors. 9 In any case, an aerometric analysis of CWS exceedance days preferably would include an air parcel trajectory analysis but may be adequately served using simpler qualitative or quantitative analyses as appropriate for the particular exceedance event. The only days that should be considered for further analysis are those where the air parcel traversed a transboundary source region, during the 2-3 days of travel prior to arriving at the area of interest. Transboundary source regions may be identified using any applicable combination of emissions inventory information, previous aerometric analyses, or regional modeling studies. When reporting transboundary influences jurisdictions should describe the analytical methods used and identify the aerometric parameters considered in the analysis Step 2: Analyzing the Transboundary Contribution on Exceedance Days Jurisdictions should identify one or more monitoring sites upwind of the non-compliant community in question, located between the community and the major source area that may be affecting the community. In the case of a community adjacent to the Canada U.S. border or a border with another province/territory, the measurement site may have to be at a near-border location within the community, upwind from the community core. Similarly, for a community on the shores of a border water body, the measurement site may have to be sited within the community near the shoreline, upwind from the community core. Jurisdictions should measure PM 2.5 (including chemical speciation for major inorganic ions as a minimum), ozone and meteorological conditions at the upwind site using standard methods accepted by the National Air Pollution Surveillance (NAPS) Monitoring Network or the Canadian Air and Precipitation Monitoring Network (CAPMoN). Hourly wind speed and direction should be monitored as well as any other meteorological parameter that may be required by jurisdictions for the model selected for potential use in Step 3. If it is likely that precursor pollutants are being transported from the upwind jurisdiction and are contributing to PM 2.5 or ozone levels in the community, then jurisdictions should measure ambient concentrations of NO, all oxidized nitrogen compounds (NO Y ), ammonia (NH 3 ), sulphur dioxide (SO 2 ) and VOC (including speciation). For each exceedance day that was influenced by transboundary flow, as identified in Step 1, jurisdictions should determine the maximum concentration (24-hour concentration for PM 2.5 or the maximum 8-hour average concentration for ozone) at the upwind monitoring site on the exceedance day. If this measurement is within 10% of the CWS, then a significant transboundary influence has been demonstrated for that exceedance day. 24
32 Figure 5 illustrates Step 2 of the three-step approach to demonstrating significant transboundary influence for each exceedance day. Figure 4: Step 2 Analysis for Demonstrating Significant Transboundary Influence for Each Exceedance Day Ambient Concentration A 10% of CWS Ambient Concentration B Air Flow Transboundary Influenced Not Transboundary Influenced Transboundary Source Region Border Upwind Monitor Community above CWS An alternate method 1 for determining the influence of transboundary flow on exceedance events may be used when there are no reliable upwind monitors to support the analysis. This method seeks to determine whether or not a CWS exceedance within the jurisdiction is a part of a more spatially widespread episodic event. The approach requires a detailed examination of the data for each CWS exceedance event using meteorological data and trajectory analyses to aid in comparing local contaminant concentrations with concurring concentrations at other regional monitoring stations. A determination is made whether the CWS exceedance was part of a broader regional episodic event ( 90% of CWS) originating from outside of the jurisdiction. If so, the exceedance is considered to be subject to significant transboundary influence and is removed from the dataset for calculation of the CWS metric Step 3: Modeling Events A modeling analysis should be conducted when ambient concentrations at upwind monitors are 90% of the CWS and those concentrations might be influenced by sources 1 Ontario CWS Pilot Project: Preliminary Application and Evaluation of the Provisions of the Guidance Document on Achievement Determination for the PM 2.5 and Ozone Canada-wide Standards,
33 both within and outside the jurisdiction. This analysis is to determine the relative contribution of transboundary transported contaminants to each episodic event. A number of approaches, models and modeling scenarios may be used in this analysis as appropriate to the particular model domain and exceedance event. Jurisdictions should choose which approach to adopt on a case-by-case basis in consultation between the province/territory and the federal government. Whatever combination of modeling tools and approaches ultimately is used must be scientifically defensible. A modeling base case scenario should be established to serve as a point of reference for all subsequent modeling runs. The model then should be run for two source scenarios for each exceedance event: (i) actual emissions for all sources turned on, both within and outside of the jurisdiction; and (ii) actual emissions for all sources outside the jurisdiction turned on and all upwind anthropogenic sources within the jurisdiction shut off. Subtract the results of (b) from (a) to determine the incremental impact due to emission sources within the jurisdiction. Next, subtract the result from the actual PM 2.5 or ozone concentration measured at the upwind monitoring site to generate an adjusted value that represents an estimate of the concentration due solely to transboundary transport. If this adjusted value is 90% of the CWS, then a significant transboundary influence has been demonstrated for that exceedance day. Optionally an increment reduction modeling scenario may be used. The concentration increment from the community or upwind site is removed to generate an adjusted value that provides an estimate of concentrations due solely to transboundary transport. The model should be run with the local sources shut off where there is no appropriate up-wind monitor. If modeled concentrations are 90% of the CWS then it has been demonstrated that the modeled exceedance day is transboundary influenced. Figure 5 illustrates Step 3 of the three-step approach to demonstrating significant transboundary influence for each exceedance day. 26
34 Figure 5: Step 3 Analysis for Demonstrating Significant Transboundary Influence for Each Exceedance Day. Air Flow Ambient Concentration 10% of CWS Transboundary Influenced Not Transboundary Influenced Transboundary Source Region Border Upwind Source Region Upwind Monitor Community above CWS all sources ambient concentration due to transboundary sources only To demonstrate that continued exceedance of the CWS is due primarily to transboundary flow, jurisdictions should determine whether the 3-year average recalculated to remove the influence of transboundary flow would otherwise have achieved the CWS. Below are two examples, one for ozone and one for PM 2.5. Ozone Example In the example below for ozone, Community A has arranged, from highest to lowest, its maximum daily measurement data for each of the three years in the reporting period used to calculate the CWS. The 3-year average of the 4 th highest 8-hour ozone concentration for the 2010 reporting year is 70 ppb [( )/3 rounded], which exceeds the 65 ppb CWS numerical target for ozone. 27
35 Example Demonstrating Community A Transboundary Influence for Ozone Daily maximum 8-hour ozone concentration (ppb) year Average Highest nd rd th th th th th th th th Next, the meteorological information and the upwind monitoring data for the exceedance days in 2008 and 2009 are analyzed. The 2010 data do not require analysis because the 4 th highest measurement is below the CWS value. Beginning with the highest measurement from the 2008 data, each day is analyzed to determine if the transboundary influence criteria have been met; that is, if the air flow came from a transboundary source region and the concentration at the upwind site is 90% of CWS ( 59 ppb). If the criteria are met, the day is flagged and the next highest value is analyzed to determine transboundary influence, provided that it exceeds the CWS value. The procedure is repeated for each exceedance day until a 4 th highest 8-hour ozone concentration that is not transboundary influenced is determined. In the red scenario in this example, the 4 th highest ozone value not attributable to transboundary influence for 2008 is determined to be the 8 th highest; that is, the 1 st, 2 nd, 6 th and 8 th exceedances did not meet the transboundary influence criteria. The recalculated 3-year average of 67 ppb [( )/3 rounded] is still above the CWS, and because the community would have exceeded the CWS even after all transboundary influenced exceedance days were excluded, transboundary influence has not been demonstrated. In the blue scenario, the 2 nd, 3 rd and 6 th highest measurement values from 2009 are determined to be transboundary influenced. The next value falls to 63.3 ppb, making this the 4 th highest measurement. This value from 2009 is used with the 8 th highest from 2008 and the 4 th highest from 2010 to calculate the 3-year average. In this scenario, the recalculated 3-year average of 64 ppb [( )/3 rounded] is below the CWS and transboundary influence has therefore been demonstrated. 28
36 PM 2.5 Example In the example for PM 2.5, Community A has arranged, from highest to lowest, its daily maximum PM 2.5 data for each of the three years in the reporting period used to calculate the CWS. The red scenario shows that the 3-year average of the 98 th percentiles for the 2010 reporting year is 33 μg/m 3 [( )/3 rounded] and exceeds the 30 μg/m 3 CWS numerical target for PM 2.5. Example Demonstrating Community A Transboundary Influence for PM 2.5 Daily mean PM 2.5 concentration (μg/m 3 ) year Average Highest Rank th highest th highest 25.4 (25.4) th highest # of Valid Days th Percentile 7 th Highest 8 th Highest 6 th Highest Revised # of Valid Days Revised 98 th Percentile 7 th Highest 7 th Highest 6 th Highest Since the CWS is exceeded there is a need to identify and eliminate from the calculation daily values that are significantly influenced by transboundary flow. This analysis potentially would be applied to 2009 and 2010 data since the 98 th percentile in these years exceed the CWS value. The 2008 data do not require analysis because the 98 th percentile is below the CWS value. Beginning with the highest measurement from the 2009 data, each daily maximum value is analyzed to determine if the transboundary influence criteria have been met; that is, if the air flow came from a transboundary source region and the concentration at the upwind site is 90% of CWS ( 27 μg/m 3 ). If the criteria are met, the value is flagged and the next highest value is analyzed to determine transboundary influence, provided that it exceeds the CWS value. The procedure is repeated for each exceedance day until a 98 th percentile PM 2.5 concentration that is not transboundary influenced is determined. 29
37 The blue scenario demonstrates the 98 th percentiles after transboundary influences have been accounted for. Shaded cells in the table identify transboundary influenced values. Discarding the values influenced by transboundary flows reduces the number of valid days of data in the dataset and potentially changes the ranking of the 98 th percentile as seen in The 3-year average is recalculated after eliminating values from the 2009 dataset that are influenced by transboundary flow. The recalculated average now is 31 μg/m 3 [( )/3 rounded] and still exceeds the CWS. Consequently, transboundary influence has not been demonstrated since the community would have exceeded the CWS even after all transboundary influenced exceedance days were excluded. The analysis now is extended to identify and remove values from the 2010 dataset that are significantly influenced by transboundary flow. The revised 98 th percentile value is identified and the 3-year average recalculated after values influenced by transboundary flow are removed from the 2010 dataset. The new 3- year average of 27 μg/m 3 [( )/3 rounded] now is less than the CWS and, in this case, transboundary influence has been demonstrated for CWS reporting purposes. 5.4 Demonstrating Best Efforts Jurisdictions can be considered to have demonstrated best efforts if the level of domestic effort undertaken would have achieved the CWS if a reasonable and appropriate level of emission reductions had occurred at upwind sources in the United States or in another province/territory. There are three possible scenarios for transboundary flow of pollutants into a community: a) transboundary flow from the United States only; for example, flow from Michigan into southern Ontario, from the U.S. eastern seaboard into the Atlantic provinces, or from Washington State into the Fraser Valley of British Columbia; b) transboundary flow from an upwind province/territory only; for example, flow from the oil sands area of northern Alberta into northern Saskatchewan or from the Flin Flon area of Manitoba into northern Saskatchewan; c) transboundary flow from an upwind province/territory and from the United States; for example, flow from the United States passing through emission source areas in southern Ontario and then continuing on to affect communities in Quebec or the Atlantic provinces. Jurisdictions should carry out regional modeling where Best Efforts are to be demonstrated. Modeling will determine whether the CWS could have been achieved if the upwind jurisdictions in the applicable scenario had applied a reasonable and appropriate level of control. Jurisdictions should determine which of these scenarios best fits the situation for the exceedance events in question and which atmospheric models would be most suitable for this analysis based on the information gathered and the analysis and modeling they conducted in demonstrating the influence of transboundary flow. The 98th percentile annual ambient PM 2.5 events used in computing the CWS PM 2.5 metric should 30
38 be modeled for demonstrating fine particulate Best Efforts. The 4 th highest annual ambient ozone events used in computing the CWS ozone metric should be modeled for demonstrating ozone Best Efforts. For the appropriate scenario, best efforts should be deemed to have been made within the jurisdiction if the CWS would have been met had the upwind jurisdiction reduced emissions as follows: a) Transboundary flow from the United States only (i) the United States reduced emissions from 1990 levels in the contributing source areas by a percentage comparable with those actually achieved by the federal and provincial/territorial jurisdictions in the source region; or (ii) the United States reduced emissions sufficiently to achieve the CWS in U.S. border communities located in the path of transport into Canada. b) Transboundary flow from an upwind province/territory only (i) the upwind province/territory and the federal government reduced emissions sufficiently to achieve the CWS in all communities within the upwind jurisdiction located in the path of transport to the community in non-achievement. c) Transboundary flow from an upwind province/territory and from the United States (i) the upwind province/territory and the federal government reduced emissions sufficiently to achieve the CWS in accordance with (b) above, or would have achieved the CWS as in (b) above if contributing sources in the United States had been reduced in accordance with either condition in (a) above; and (ii) the United States reduced emissions from contributing sources in accordance with either condition in (a) above. If the jurisdiction meets the criteria for best efforts, the community will be classified as influenced by transboundary flow and unable to achieve the CWS until further reduction in transboundary air pollution flow occurs. If modeling shows the CWS is still being exceeded, then best efforts have not been made and additional reduction measures would be required to satisfy the best efforts criterion. 31
39 6. ACCOUNTING FOR BACKGROUND LEVELS AND NATURAL EVENTS 6.1 Context Section B.3.6 of the Reporting Protocol contains the following provisions: Communities will be identified in reporting as communities influenced by background or natural events if jurisdictions demonstrate (i) that continued exceedance of the CWS is due primarily to naturally occurring local or regional PM and/or ozone and (ii) that best efforts have been made to reduce contributions to the excess levels from pollution sources within the jurisdiction. Demonstration of background or natural influence is the responsibility of the affected jurisdiction. Demonstration of best efforts will include measures in both provincial/territorial and federal implementation plans. The Guidance Document will contain methodologies for demonstrating background or natural influence and criteria on what would constitute best efforts. Background concentrations generally refer to concentrations observed in remote areas that are relatively unaffected by local pollution sources 16 ; however, several definitions of background concentrations are possible. Two definitions chosen by the U.S. EPA for PM are: (i) the [ambient] concentration [of particulate] resulting from anthropogenic and natural emissions outside North America, and natural sources within North America; (ii) the [ambient] concentration [of particulate] resulting from natural sources only, both within and outside North America. In both definitions, background accounts for global concentrations due to emissions from natural sources both within and beyond North America. This is appropriate since there is evidence of PM transport into western Canada 8 from the deserts of Asia, and into the State of Maine from the Sahara Desert in North Africa, 12 the later inferring that ambient levels in Atlantic provinces would probably also be influenced. Definition (a) includes concentrations due to anthropogenic emissions from beyond North America in large part because of the difficulty in differentiating between concentrations due to intercontinental anthropogenic and natural sources. This definition may be constraining for CWS reporting in the long-term if Annex B of the Reporting Protocol for the CWS is ever modified to require consideration of transboundary flows from beyond North America. In the meantime this Guidance Document for practical purposes uses definition (i) above to define background PM
40 Similarly, background ozone is defined for CWS reporting purposes as the ambient concentration of ozone resulting from emissions of ozone precursors from anthropogenic and natural sources beyond North America and emissions of ozone precursors from natural sources within North America. Ozone concentrations vary by geographic location, altitude and season. The natural component of background ozone results from the synergies of three physical mechanisms: down-mixing of stratospheric ozone to the troposphere; photochemical oxidation of biogenic and geogenic methane and carbon monoxide (CO); photochemical initiated oxidation of biogenic VOC. It has been estimated that an annual ozone average of about 30 to 40 ppb in the Canadian setting could be attributed to naturally occurring ozone. 3 However, monitoring data show that annual 4 th highest, 8-hour ozone concentrations can reach or exceed 60 ppb in a number of locations across Canada that appear to be relatively unaffected by anthropogenic NO X or VOC emission sources or transboundary influences in areas where major NO X and VOC emission sources in adjacent U.S. states are a considerable distance from the border. Table 4 shows examples of ozone levels at six sites across Canada from 1997 to Table 4: Ozone Levels at Selected Sites in Canada, Community 4 th Highest, 8-hour Ozone Concentration (ppb) Year Average Brandon, Manitoba Experimental Lakes Area, Ontario Fort Francis, Ontario La Pêche, Quebec Violet Grove, Alberta Source: Environment Canada, 2001 It should be noted that the locations identified in Table 4 are not required to report on achievement of the CWS (i.e. they are either rural transport sites or communities with populations less than 100,000). The ambient data for these communities are provided only to illustrate that the levels being measured are in the range of the CWS target, that they are not that infrequent, and that they occur in different locations across Canada. 33
41 Natural background PM 2.5 arises from: physical processes of the atmosphere that entrain small particles (e.g. crustal material, sea salt spray); volcanic eruptions (e.g. sulphates); natural combustion such as forest fires (e.g. elemental and organic carbon, and inorganic and organic PM precursors); the activities of wild animals and plants (e.g. fine organic aerosols, inorganic and organic PM precursors). It is difficult to determine the actual magnitude of background PM 2.5 for a given location because of the influence of long-range transport of anthropogenic particles and precursors. Typically, in communities lacking significant PM 2.5 precursor emission sources, there is insufficient monitoring data to conclusively determine background PM 2.5 concentrations. However, limited data from some communities show 98th percentile, 24-hour PM 2.5 levels well below the CWS primary target level (e.g. 19 and 16 μg/m 3 in 1998 and 1999, respectively, in Kamloops, B.C.; 12 μg/m 3 at the Wildlife Sanctuary in Powell River, B.C., in 1999). This suggests that PM 2.5 background levels may not present the same concern as ozone background levels. 6.2 Application Section B.3.6 of the Reporting Protocol requires that before a community can be designated as a community influenced by background or natural events, jurisdictions must demonstrate both the influence of naturally occurring local or regional PM and/or ozone, and best efforts to reduce emissions. For CWS purposes, high background levels are divided into two categories: events likely caused by frequent or regular emissions from biogenic and geogenic sources; natural events, which are caused by more infrequent or rare occurrences. It is important that jurisdictions demonstrate the influence of background/natural events and best efforts in sequence because both steps are likely to require considerable effort and resources. For the first category, demonstrating the influence of high background levels, jurisdictions can rely to some degree on available ambient data, but they may also have to perform considerable atmospheric modeling if numerous exceedance events are involved. For CWS purposes, due primarily to high background levels is defined as evidence that the pollutant concentration of the air parcel, as measured at a designated upwind monitor (in some cases adjusted by modeling to remove the anthropogenic contribution), is 90% of the CWS. 34
42 For the second category, infrequent or rare natural events, jurisdictions may use specific analytical evidence to demonstrate their occurrence and contribution to community ambient concentrations. Demonstrating best efforts would require an analysis of control measures that have actually been put in place and modeling analysis based on estimates of the emission reductions achieved. In most cases, this would build upon the findings of demonstrating background or natural event influence. In some cases, it may take jurisdictions several years to collect supporting data and to perform analyses and modeling for demonstrating the influence of background levels or natural events and best efforts. This should not, however, delay their annual reporting of measured values and calculated statistics for CWS achievement determination. When reporting on CWS achievement in these cases, jurisdictions should flag the information as potentially influenced by either background levels or natural events until the appropriate analyses have been completed. 6.3 Demonstrating the Influence of Background Levels To demonstrate that continued exceedance of the CWS is primarily due to the influence of high background levels, jurisdictions will need to recalculate the 3-year averages after discounting the contribution attributed to background levels. This approach is similar to that recommended in Chapter 5 above. If the recalculated values show that the CWS has been achieved, the jurisdiction has demonstrated a significant influence due to background levels. To do this, jurisdictions should follow the three-step approach outlined below, based on both observations and the use of regional models. Jurisdictions should carry out these steps for each year that the annual value exceeds the CWS. To reduce unnecessary work and analyses, they should carry out the three steps in sequence for a single exceedance day (starting with the highest) before proceeding to analyze the next highest exceedance day. In addition, performing each subsequent step is dependent on whether a positive result was achieved in the previous step; for example, jurisdictions need not proceed to Step 2 for that exceedance day if Step 1 did not show an influence due to background levels. It should be noted that where an upwind monitor is not affected by anthropogenic sources from within its province or territory (i.e. it is clear that non-anthropogenic sources are the primary influence on the upwind monitor), jurisdictions may only need to carry out Steps 1 and 2 to demonstrate the influence of background levels. In other cases (e.g. where the primary source is not clearly non-anthropogenic), jurisdictions will also need to carry out the modeling in Step 3 to identify the sole contribution of the non-anthropogenic sources. 35
43 Jurisdictions should carry out these three steps until: a) four daily ozone values, or 7 or 8 daily PM 2.5 values exceeding the CWS level that are not influenced by high background levels are identified (using the 4 th highest value as the adjusted annual 4 th highest daily 8-hour ozone value, or the 7th or 8th value as the adjusted 24-hour average concentration for PM 2.5 ); or b) a daily value falls below the CWS (using this number as the readjusted daily value for either PM 2.5 or ozone). Jurisdictions should use the adjusted values to recalculate the 3-year average. If the recalculated 3-year average falls below the CWS, then the jurisdiction has demonstrated influence by high background levels for this community. The next step would be for jurisdictions to determine whether they have indeed made best efforts to reduce contributions to the excess levels from pollution sources within the jurisdiction, or whether further controls are necessary Step 1: Determining the Origin of the Air Parcel on CWS Exceedance Days To establish the origin of the air parcel for each exceedance day, jurisdictions should carry out an aerometric analysis. This should include air parcel trajectory analysis as a minimum Step 2: Analyzing the Contribution of High Background Levels on Exceedance Days Jurisdictions should identify one or more monitoring sites upwind of the non-compliant community in question and in a location that is not downwind of any major anthropogenic sources. It is assumed that it is possible to find such a site a community will not be under dominating natural impacts if it is surrounded by large anthropogenic sources. Depending on the pollutant in question, jurisdictions should measure PM 2.5 (including chemical speciation for major inorganic ions as a minimum), ozone and local winds at this site using standard methods accepted by NAPS or CAPMoN. They should also measure ambient concentrations of VOC, including isoprene and terpenes. Isoprene is a primary precursor of ozone, and terpenes are an important precursor for the organic component of PM 2.5. For each exceedance day that was influenced by background levels, as identified in Step 1, determine the concentration (24-hour concentration for PM 2.5 or the maximum 8-hour average concentration for ozone) at the upwind monitoring site on the exceedance day. If this measurement is 90% of the CWS and is associated only with air parcel trajectories that come from sectors having low population density and industrial sources (i.e. having low anthropogenic emissions), then a significant impact due to high background levels has been demonstrated for that exceedance day. High levels of isoprene or terpene can be used as additional evidence of significant biogenic contributions to ambient levels of ozone and PM
44 6.3.3 Step 3: Modeling Events Jurisdictions should carry out a modeling diagnosis for each exceedance day during the reporting period to determine the contribution to PM 2.5 or ozone levels at the monitoring station resulting from natural causes only. It is assumed that an acceptable inventory of natural emissions data is available (in addition to the anthropogenic emissions affecting the community in question); otherwise, this analysis cannot proceed further. A number of approaches and acceptable models may be used in this analysis, but whichever one is selected, it must be scientifically defensible. Jurisdictions should choose which approach to adopt on a case-by-case basis in consultation between the province/territory and the federal government. For each exceedance event, the model should be run for two cases: a) with the actual emissions at all sources (natural and anthropogenic), both within and outside of the jurisdiction; and b) with all the upwind anthropogenic sources within the range of possible significant pollutant transport shut off. For each exceedance event, subtract the results of (b) from (a) to determine the incremental impact due to anthropogenic emission sources within the jurisdiction. Next, subtract the result from the actual PM 2.5 or ozone concentration measured at the upwind monitoring site to generate an adjusted value that represents an estimate of the concentration due solely to background levels. If this recalculated value is 90% of the CWS then a significant impact due to background levels has been demonstrated for that exceedance day. 6.4 Demonstrating the Influence of Natural Events Ambient levels of PM 2.5 and ozone may be significantly increased by certain rare or infrequent natural events. Such events require specific analytical approaches to demonstrate that they did occur, that they had an influence on ambient levels in the community in question, and that their contribution relative to anthropogenic contributions was significant. Once jurisdictions demonstrate the significant influence of natural events, they should next determine whether best efforts have been made in reducing contributions to the excess levels from pollution sources within the jurisdiction or whether further controls are necessary (section 6.5.2). The following sections give recommendations for demonstrating influence from the most common events likely to be encountered (i.e. stratospheric intrusion of ozone, forest fires, and extreme wind events). It should be noted that some of these events are not infrequent occurrences on a national scale (e.g. there can be several thousand forest fires across Canada in a given year), but they are likely to be infrequent events in terms of their effect on any given community. 37
45 Other rarer events may also contribute to elevated ambient levels of PM 2.5 and ozone. These may include, for example, volcanic activity and periods of elevated ambient pollution levels generated by human response to extreme safety or life-threatening situations, such as the widespread use of wood burning for survival during the ice storm of Jurisdictions should choose the approach to account for these types of natural events on a case-by-case basis Demonstrating the Influence of Stratospheric Intrusion on Levels of Ozone At certain times of the year and in special geographical settings, there may be stratospheric intrusions of ozone, penetrating down to ground level. Generally, such intrusions are infrequent, of short duration, and typically associated with strong frontal passages or severe thunderstorms. They usually occur during the spring and fall. To determine if a community is influenced by stratospheric ozone intrusions, jurisdictions should provide evidence that: the meteorological conditions during an observed ozone 8-hour average in excess of 65 ppb are consistent with the high occurrence probability of a stratospheric intrusion for example, there has been strong frontal activity or a severe thunderstorm, the time of year (season) is not normally associated with high photochemical ozone (i.e. late winter or early spring) and the time of day when the most elevated ozone levels occur is atypical; and additional measurements near the monitoring station confirm that such an event is stratospheric in origin for example, persistence of vorticity structures determined from upper air soundings, relatively high 7 Be in PM samples, or vertical ozone profiles from an ozone sonde. Jurisdictions should then demonstrate, in a scientifically defensible way, that these events occurred sufficiently often during the 3-year period in question to have caused exceedance of the CWS Demonstrating the Influence of Forest Fires on Levels of PM 2.5 and Ozone Forest fires could lead to exceedances of the CWS for both PM 2.5 and ozone. To determine if a community is influenced by forest fires, jurisdictions should provide the following evidence: documentation that a fire did in fact occur upwind of the affected community when the CWS exceedance occurred (information on the occurrence of forest fires in Canada may be available from sources such as the Canadian Forest Service website); and aerial photographs or satellite images that show the plume from the fire did in fact pass over the community (information on the distribution of aerosols in the atmosphere may be available from sources such as the NASA Total Ozone Mapping Spectrometer website). 38
46 If such information is unavailable, jurisdictions should provide, at a minimum: trajectory modeling calculations showing that air parcels originating at the fire passed over the community at the time of the CWS exceedance. Jurisdictions should then demonstrate, in a scientifically defensible way, that the influx of PM 2.5 or ozone due to forest fires occurred sufficiently often during the 3-year period in question to have caused exceedance of the CWS Demonstrating the Influence of Extreme Wind Events on Levels of PM 2.5 While high levels of windblown crustal particles during wind events can constitute the major part of the coarse PM fraction in the atmosphere, they have also been shown to constitute a substantial fraction of the intermodal fine particles (PM ), at times contributing significantly to ambient levels of PM To determine if a community is influenced by extreme wind events, jurisdictions should provide the following evidence: documentation of wind data during the occurrence from a meteorological station within the community in question; and documentation showing that conditions were consistent with the potential for high windblown dust concentrations, including, but not necessarily limited to, evidence that there were no precipitation events that would have led to wet surfaces during the period in question, the ground was not snow covered, and there are large areas of sandy ground or bare soil in the vicinity of the community; and if samples collected on a filter medium are available, time-series analysis of the PM 2.5 samples taken during the exceedance event showing an increase in soilrelated constituents such as selenium, calcium, magnesium and aluminum. Jurisdictions should then demonstrate, in a scientifically defensible way, that extreme wind events occurred sufficiently often during the 3-year period in question to have caused exceedance of the CWS. 6.5 Demonstrating Best Efforts A jurisdiction can be considered to have demonstrated best efforts if the level of domestic effort undertaken would have achieved the CWS if an infrequent natural event or high background levels were not a dominant factor. 39
47 6.5.1 CWS Exceedances Attributed to Background Levels Jurisdictions should proceed with a best efforts demonstration only if they had demonstrated that natural background levels are 90% of the CWS primary target level. In such cases, the CWS primary target level may be exceeded no matter what the level of effort undertaken to reduce anthropogenic emissions, short of cutting them off entirely. This means that control efforts may be aimed at reducing the magnitude of exceedance of the CWS rather than achieving it, and a certain amount of interpretation of what constitutes best efforts would need to apply. In addition, the analysis in support of claims of best efforts may not be as straightforward as for a case of transboundary influence, because it would not make much sense to attempt to model certain levels of natural emission reductions. Jurisdictions should choose methods for demonstrating best efforts when CWS exceedances are due primarily to high natural background levels on a case-by-case basis. They may encounter various situations that call for different levels of analysis. Measures that would qualify as best efforts would depend on such things as the size of the community, the types and magnitude of existing emission sources, which CWS (PM 2.5 or ozone) has been exceeded and by how much. For example, if the community in non-achievement of the ozone CWS is relatively small (e.g. population less than 50,000) and has few significant stationary source emissions, it may be sufficient to conclude that best efforts have been made based on national measures that reduce emissions from, for example, vehicles and fuels and products containing solvents, possibly combined with some uptake of available national codes and guidelines and some community-oriented episode management programs. If one or more major industrial emission source (e.g. power plant, pulp mill) or residential wood burning is shown to be significantly affecting ambient levels, some level of emission reduction from these sources might also be expected for the emission reduction measures to qualify as best efforts. For larger communities where numerous emission sources within the region are contributing to the CWS exceedance, a solid program of emission reduction measures for major new and existing sources in the region, in addition to national measures for vehicles and fuels and products containing solvents, would be needed to meet the best efforts criteria. Those measures should be directed at achieving the CWS or, where achievement of the CWS is unlikely because of natural background influence, minimizing the magnitude of the exceedance as much as possible. Measures comparable with those required to meet the CWS in the worst air quality regions of the country may be an appropriate yardstick. This is because there would be similar concerns with protection of public health regardless of whether the elevated PM 2.5 or ozone levels are caused by anthropogenic emissions. 40
48 6.5.2 CWS Exceedances Attributed to Natural Events When a CWS exceedance has been demonstrated to be caused primarily by an infrequent natural event, various scenarios could exist. Two possible scenarios are: The natural event has been shown clearly to be the dominant cause of the high daily maximum ozone level or high daily PM 2.5 level causing the exceedance for example, very high PM 2.5 levels in the vicinity of a forest fire, high ozone levels in late winter or spring due to stratospheric ozone intrusion when anthropogenic sources can be shown to not be making a significant contribution. The natural event is less of a dominant factor but is responsible for pushing ambient levels over the top for example, a significant but not dominant increase in ambient levels of PM 2.5 in a community due to a forest fire some distance away, but where anthropogenic emissions are still identified as the larger contributor to the elevated ambient levels. To determine the appropriate scenario, jurisdictions should use ambient levels upwind of the community in non-achievement of the CWS and other evidence from the demonstration of significant influence. If jurisdictions demonstrate that the natural event is the primary cause of ambient levels upwind of the community and ambient levels are 90% of the CWS, then the dominant cause scenario applies. If they demonstrate that the natural event is the primary cause of ambient levels upwind of the community and ambient levels fall between natural background levels and 10% of the CWS, then the pushing over the top scenario would apply. Jurisdictions should carry out the appropriate analysis, described below. Natural events that are the dominant cause To demonstrate best efforts when natural events are the dominant cause, jurisdictions should recalculate the 4 th highest annual value for ozone or the 98th percentile annual value for PM 2.5, respectively, for the community in non-achievement by ignoring the daily maximum 8-hour ozone value or the daily 24-hour PM 2.5 value associated with the event. They should instead use the next highest value measured for that year. They should then recalculate the 3-year (consecutive) average required for comparison with the CWS using the adjusted value. If the 3-year average recalculated in this manner no longer exceeds the CWS, then jurisdictions have demonstrated best efforts and the community will be classified as influenced by natural events. If the CWS is still being exceeded, then best efforts have not been made and additional reduction measures would be required to satisfy the best efforts criteria. Natural events that push levels over the top When natural events push levels over the top, jurisdictions can demonstrate best efforts if the level of domestic effort undertaken would have achieved the CWS if the event had not occurred. 41
49 To demonstrate best efforts in these cases, jurisdictions should carry out regional atmospheric modeling with emissions from the event set to zero. If the model results show the CWS being met, then jurisdictions have demonstrated best efforts and the community will be classified as influenced by natural events. If the results show that the CWS is still being exceeded, then best efforts have not been made and additional reduction measures would be required to satisfy the best efforts criteria. 42
50 APPENDIX A Canada-wide Standards for Particulate Matter and Ozone Canadian Council of Ministers of the Environment CANADA-WIDE STANDARDS for PARTICULATE MATTER (PM) and OZONE 43
51 CANADA-WIDE STANDARDS for PARTICULATE MATTER (PM) and OZONE These Canada-Wide Standards (CWSs) for particulate matter (PM) and ozone are established pursuant to the 1998 Canada-wide Accord on Environmental Harmonization of the Canadian Council of Ministers of the Environment (CCME) and its Canada-wide Environmental Standards Sub-Agreement. RATIONALE Significant adverse effects have been demonstrated for the air pollutants PM and ozone on human health and the environment. DEFINITIONS PM 10 refers to airborne particles that are 10 microns or less in diameter PM 2.5 refers to airborne particles that are 2.5 microns or less in diameter PM refers to airborne particles in the size range 2.5 to 10 microns in diameter, known as the coarse fraction of PM 10 Ozone refers to an oxygen compound (O 3 ) occurring in the form of a gas in the atmosphere at ground-level CONTEXT The long-term air quality management goal for PM and ozone is to minimize the risks of these pollutants to human health and the environment. However, recent scientific evidence indicates that there is no apparent lower threshold for the effects of these two pollutants on human health. These CWSs for PM and ozone are an important step towards the long-term goal of minimizing the risks they impose to human health and the environment. They represent a balance between the desire to achieve the best health and environmental protection possible in the relative nearterm and the feasibility and costs of reducing the pollutant emissions that contribute to elevated levels of PM and ozone in ambient air. As such, while they will significantly reduce the effect of PM and ozone on human health and the environment, they may not be fully protective and may need to be re-visited at some future date. There are also additional benefits to reducing and maintaining ambient levels below the CWSs where possible. Uncertainty and gaps exist and new data/information that becomes available will be acknowledged. However, Ministers are confident that taking action now to reduce PM and ozone levels 44
52 will improve ambient air quality and result in benefits to the environment and to human health. Jurisdictions will have considerable flexibility in the detailed design of implementation plans and sectoral emission reduction strategies over the next few years, and an opportunity to reduce information gaps and uncertainties. In jurisdictions highly impacted by transboundary air pollution from the United States, achieving the CWSs will be strongly dependent on reductions of this transboundary contribution. Also, high background levels of PM and ozone that may occur through natural events (such as forest fires, natural formation and stratospheric intrusion) will need to be considered in assessing achievement of the CWSs. The CWS for PM established here is for the fraction of PM recognized as having the greatest effect on human health, the fine fraction or PM 2.5. The PM 2.5 CWS has been established for the interim period prior to the planned review of the standard to be completed by 2005, which will incorporate advancements in scientific, technical and economic information and analysis. The PM 2.5 CWS will ensure that PM management efforts are focused on the sources of PM and PM precursor emissions that provide the greatest health benefit. It is acknowledged that health effects are also associated with the coarser fraction of PM, or PM , and that actions to reduce the concentrations of these coarser fractions in the atmosphere are needed. Reductions in ambient PM 10 levels will occur as ancillary benefits from reducing PM 2.5. In addition, some jurisdictions currently have ambient air quality objectives, guidelines or standards related to the coarser fraction of PM. These should continue to be used to design air quality management programs for PM 10. CWSs related to the coarser fraction may be a useful addition at a later date. There are other aspects that should be considered in any future update of these PM and ozone CWSs. Forms of the PM and ozone CWSs other than the relatively short term exposure forms established here, such as seasonal or annual average targets, may also be useful additions at a later date. Since the current CWSs are related primarily to protection of human health, their adequacy for the protection of vegetation, visibility impairment, material damage or other adverse effects may need to be assessed. 45
53 PART 1: NUMERICAL TARGETS and TIMEFRAMES The CWS and related provisions for PM are: A CWS for PM 2.5 of 30 µg/m 3, 24 hour averaging time, by year 2010 Achievement to be based on the 98th percentile ambient measurement annually, averaged over 3 consecutive years The CWS and related provisions for ozone are: A CWS of 65 ppb, 8-hour averaging time, by 2010 Achievement to be based on the 4 th highest measurement annually, averaged over 3 consecutive years Specific provisions related to transboundary flow of ozone are contained in Section B.3.5, Accounting for Transboundary Flow, of Annex B. PART 2: IMPLEMENTATION Jurisdictions will undertake the following implementation actions: Development and implementation of jurisdictional implementation plans to achieve the CWSs. Implementation of continuous improvement, pollution prevention, and keeping-clean-areas-clean programs in areas with ambient concentrations below the CWS levels, in accordance with the guidance provided in Annex A. In areas where jurisdictional implementation plans need to be augmented by reductions in transboundary flow of pollution from the United States or from other countries to achieve the CWSs, the federal government, with support from the provinces and territories, will aggressively pursue further reductions in the transboundary flow into Canada of PM and ozone and their precursor pollutants. 46
54 Establishment and maintenance of the PM and ozone monitoring networks needed to characterize the PM and ozone air quality problems across Canada, design management programs, and track progress. REVIEW The CWSs will be reviewed as follows: (a) by the end of year 2005, complete additional scientific, technical and economic analysis to reduce information gaps and uncertainties and revise or supplement the PM and ozone CWSs as appropriate for year 2015; and report to Ministers in 2003 on the findings of the PM and ozone environmental and health science, including a recommendation on a PM CWS. (b) by the end of year 2010, assess the need, and if appropriate, revise the CWSs for PM and ozone for target years beyond REPORTING on PROGRESS Progress towards meeting the above provisions will be reported as follows: (a) to the respective publics of each jurisdiction on a regular basis, the timing and scope of reporting to be determined by each jurisdiction (b) to Ministers and the public, with comprehensive reports at five year intervals beginning in year 2006 and reports on achievement and maintenance of the CWSs annually beginning in 2011, in accordance with guidance provided in Annex ADMINISTRATION Jurisdictions will review and renew Part 2 and Annexes A and B five years from coming into effect. Any party may withdraw from these Canada-Wide Standards upon three month's notice. These Canada-Wide Standards come into effect for each jurisdiction on the date of signature by the jurisdiction. 47
55 ANNEX A GUIDANCE FOR CONTINUOUS IMPROVEMENT AND KEEPING-CLEAN-AREAS-CLEAN PROGRAMS FOR PM AND OZONE In most areas of Canada, ambient levels are lower than the CWSs for PM and ozone established here. Ministers have agreed to include in the CWSs a provision on environmental management in areas where ambient air quality is better than the levels set out in the standards. (a) Continuous Improvement There are numerous locations across Canada that have ambient levels of PM and/or ozone below the CWS levels but still above the levels associated with observable health effects. There is a need to ensure that the public recognizes that the CWS levels are only a first step to subsequent reductions towards the lowest observable effects levels. It would be wrong to convey the impression that no action is required in these areas or that it would be acceptable to allow pollutant levels to rise to the CWS levels. Jurisdictions should take remedial and preventative actions to reduce emissions from anthropogenic sources in these areas to the extent practicable. (b) Keeping Clean Areas Clean Jurisdictions recognize that polluting up to a limit is not acceptable and that the best strategy to avoid future problems is keeping clean areas clean. Jurisdictions should work with their stakeholders and the public to establish programs that apply pollution prevention and best management practices, by, for example: developing and implementing strategies consistent with the CCME commitment to pollution prevention ensuring that new facilities and activities incorporate the best available economically feasible technologies to reduce PM and ozone levels requiring that upgrades carried out in the course of normal capital stock turnover incorporate the best available economically feasible technologies to reduce PM and ozone levels reviewing new activities that could contribute to an increase in PM and ozone levels with stakeholders and the public in terms of their social, economic and environmental merits 48
56 ANNEX B REPORTING PROTOCOL FOR CANADA-WIDE STANDARDS FOR PARTICULATE AND OZONE B.1 Introduction It is intended under the Harmonization Accord and its Standards Sub-Agreement that all jurisdictions will report on a regular basis to their publics and to Ministers of the Canadian Council of Ministers of the Environment on their progress towards achieving the CWSs for particulate matter (PM) and ozone. This reporting protocol is intended to provide guidance for reporting on all provisions of the CWSs for PM and ozone. Its provisions are designed to help ensure consistency and comparability in the reporting by jurisdictions, and better understanding by the public on how jurisdictions plan to track and report on progress. B.2 Frequency, Timing and Scope of Reporting There will be two types of reporting by jurisdictions: 1) Annual Reporting on Achievement of the CWSs These reports will be completed by each jurisdiction in a standardized report card format, the format to be developed and agreed to by all jurisdictions, and provided to Ministers and the public by 30 September of each year, beginning in These annual reports will be limited in scope containing mainly summary information on levels and trends in ambient PM and ozone concentrations in communities within each jurisdiction, identifying communities where ambient levels are exceeding or approaching the CWS levels. They may also note the reason for any significant change in ambient levels or trends from previous years. 2) Five-Year Reports These reports will be completed for the year 2005 and for every fifth year thereafter and provided to Ministers and the public by 30 September of the following year. The report for 2005 will be an interim report on progress towards meeting the CWSs, and subsequent reports will focus on achievement of the CWSs applicable at that time. Five-year reports will be comprehensive, assessing progress on all provisions of the CWSs. The format and general content will be determined and agreed to by all jurisdictions 2 years in advance of the reporting year. They will include, assessment of ambient levels and trends in communities within each jurisdiction, identifying communities where ambient levels are exceeding or approaching the CWS levels, 49
57 information on PM and ozone precursor emissions and trends, comprehensive descriptions of smog management efforts, progress with implementation of measures in implementation plans, actions to ensure continuous improvement in areas with ambient levels below the CWS levels but within the effects range, actions to ensure that clean areas are kept clean, actions on cooperation in monitoring and science, and any other provision of the CWSs. The federal government will include in its reports an assessment of trends in U.S. emissions and ambient levels in border regions affecting ambient PM and ozone levels in Canada, and of the effectiveness of U.S. control programs in reducing those emissions and of Canadian efforts to secure such reductions. The CCME will co-ordinate the collation of the information from the various jurisdictional reports in (1) and (2) above into a national overview report for the public, CCME Ministers and international audiences. In addition to the reporting in (1) and (2) above, individual jurisdictions may report to their publics on a more frequent basis. The scope and timing of any such reporting would be determined by the jurisdiction. B.3 Reporting on Achievement of the CWSs B.3.1 Guidance Document on Achievement Determination Jurisdictions will co-operate in the preparation and periodic update as required, of a Guidance Document on Achievement Determination for the PM and ozone CWSs. This document will elaborate on information, methodologies, criteria and procedures related to each of the basic elements of achievement reporting identified below. B.3.2 Communities for CWS Achievement Determination Jurisdictions will use a community-oriented approach for reporting on achievement of the PM and ozone CWSs. As a basic requirement, jurisdictions will report on CWS achievement for population centres over 100,000. As well, jurisdictions may also report on CWS achievement for communities with population less than 100,000 based on considerations such as regional population density, proximity to sources, local air quality, etc. To provide consistency and comparability in reporting across jurisdictions, the geographic units for grouping of municipalities (Census Metropolitan Areas (CMAs)/Census Agglomerations (CAs)/Census Subdivisions) established by Statistics Canada will be used as guidance for community identification. Larger CMAs may be subdivided into smaller sub-areas to better capture geographic variation within the CMA. [refer to the Guidance Document for a listing of CMAs and CAs in Canada and suggested criteria for subdividing larger CMAs]. 50
58 B.3.3 Monitoring Sites for Determining Achievement CWS achievement will be based on community-oriented monitoring sites i.e. sites located where people live, work and play rather than at the expected maximum impact point for specific emission sources. Rural (or background) and source specific sites will not be included for CWS achievement determination. [See the Guidance Document for guidance on selection of community-oriented monitoring sites]. B.3.4 Calculation Methodologies for Determining Achievement It is important that common statistical parameters be used by all jurisdictions in reporting on CWS achievement so that there will be consistency and comparability in assessing progress in achieving the CWSs. These parameters stem initially from the basic form and achievement statistics specified for the CWSs. That is: For PM 2.5 : For Ozone: 24-hour averaging time, achievement to be based on 98 th percentile annual value, averaged over three consecutive years 8-hour averaging time, achievement to be based on 4 th highest annual measurement, averaged over three consecutive years For PM CWS achievement determination, measurements from each multiple continuous (or daily) population-oriented monitoring station within a CMA/CA or CMA reporting sub-area will be spatially averaged for each year (up to three) for which measurements are available. For ozone CWS achievement determination, the monitoring station with the highest average ozone concentration within a CMA/CA or CMA reporting sub-area will be used. [See the Guidance Document for methodology for determination of 98 th percentile annual levels for PM 2.5 and 4 th highest annual levels for ozone from monitors that measure at various frequencies or for which there are less than 365 measurements per year, and methodologies for determining spatial averages] B.3.5 Accounting for Transboundary Pollution Communities for which jurisdictions demonstrate (i) that continued exceedance of the CWS levels is primarily due to transboundary flow of PM and ozone or their precursor pollutants from the U.S. or from another province/territory, and (ii) that best efforts have been made to reduce contributions to the excess levels from pollution sources within the jurisdiction, will be identified in reporting as transboundary influenced communities that are unable to reach attainment of the CWSs until further reduction in transboundary air pollution flow occurs. Demonstration of transboundary flow influence will be a shared responsibility of the federal government and the affected province/territory, and demonstration of best efforts will include measures in both provincial/territorial and federal implementation plans. [See the Guidance 51
59 Document for methodologies for demonstrating the influence of transboundary and criteria on what would constitute best efforts ] For the province of Ontario, a 45% reduction in NO X and VOC emissions from 1990 levels by 2010 or earlier, subject to successful negotiations this fall with the U.S. for equivalent reductions, will be considered the province s appropriate level of effort towards achieving the ozone CWS. Any remaining ambient ozone levels above the CWS in Ontario will be considered attributable to the transboundary flow from the U.S. of ozone and its precursor pollutants. B.3.6 Accounting for Background and Natural Events Communities for which jurisdictions demonstrate (i) that continued exceedance of the CWS levels is primarily due to naturally occurring local or regional PM and/or ozone and (ii) that best efforts have been made to reduce contributions to the excess levels from pollution sources within the jurisdiction, will be identified in reporting as communities influenced by background or natural events. Demonstration of background or natural influence is the responsibility of the affected jurisdiction, and demonstration of best efforts will include measures in both provincial/territorial and federal implementation plans. [See the Guidance Document for methodologies for demonstrating background or natural influence and criteria on what would constitute best efforts ] B.3.7 Maintenance and Provision of Monitoring Information It is important to have up-to-date PM and ozone monitoring data. Jurisdictions will maintain their own data on ambient measurements of PM 2.5, PM 10 and ozone and make it publicly accessible. Accessibility may be accomplished by posting on Internet Sites, which would be linked to the CCME Website. Jurisdictions will also co-operate in establishing and maintaining a Monitoring Protocol, which will ensure the coordination of monitoring data. This will allow for better co-ordination of monitoring program design and operation, ambient air quality trends analyses, regional source-receptor assessments, transboundary air quality analyses and implementation plan design. 52
60 APPENDIX B Canadian Census Metropolitan Areas and Census Agglomerations The Metropolitan Hierarchy of Geography Most of Canada s vast land area is sparsely populated and, with each passing decade, a greater proportion of the total population is found in urban settings. Canada is one of the most urbanized nations, according to the Organisation for Economic Cooperation and Development (OECD). In 2001, 79.4% of Canadians lived in an urban centre of 10,000 people or more. Urban-focused economies tend to expand beyond official municipal or even county boundaries in terms of shopping trips and commuter travel. As a result, Statistics Canada has created groupings of municipalities, or census subdivisions (CSDs), to encompass the area under the influence of a major urban centre. Specific guidelines are used to group municipalities that are closely interconnected due to people working in one municipality and living in another. The resulting geographic units are called census metropolitan areas (CMAs) for larger urban centres (100,000 or more in their urban core in the previous census) and census agglomerations (CAs) for smaller urban centres (with an urban core of at least 10,000 but less than 100,000 in the previous census). In the 2001 Census, there are 27 CMAs and 113 CAs in Canada. While the criteria for CMAs and CAs have changed slightly over time, the key element has always been the notion of the commuter shed. The internal structure of the CMA has also reflected the relative differences between urban and rural areas; the three major distinctions within the CMA are the urbanized core, the urbanized fringe and the rural fringe. The urban core is a large urban area around which a CMA or CA is delineated. The urban fringe is the urban area within a CMA or CA that is not contiguous to the urban core. The rural fringe encompasses all remaining territory. Adjacent CSDs are used as building blocks if they meet certain criteria. Census subdivision is the general term applied to municipalities (as determined by provincial legislation) or their equivalent (e.g. Indian reserves, Indian settlements and unorganized territories). In Newfoundland, Nova Scotia and British Columbia, the term also describes geographic areas that have been created by Statistics Canada in cooperation with the provinces as equivalents for municipalities for the dissemination of statistical data. Users often need data for areas that are smaller than a municipality. As a result, Statistics Canada created census tracts (CTs) to equal neighbourhood-like areas of 2,500 to 8,000 people (preferably close to 4,000) within all CMAs and CAs that contain an urban core with a population of 50,000 or more in the previous census. The CT boundaries generally follow permanent physical features such as major streets and railway tracks and attempt to approximate cohesive socio-economic areas. CTs are generally held constant from one census to the next, so that they are comparable over time. CTs do not necessarily follow CSD or CD boundaries. In practice, however, there are few cases of CTs not nesting perfectly within CSDs and CDs. The definitions of geographic terms and census concepts are presented here in summary form only. Users should refer to the 2001 Census Dictionary (Catalogue No XIE01000, ISBN ) for the full definitions and additional remarks related to these concepts and definitions. Please note that several CMAs and CAs have undergone name changes since the 2001 census; the new names are reflected in the following table. The changes include the following: Chicoutimi Jonquière has become Saguenay; Ottawa - Hull has become Ottawa - Gatineau; Port Hope and 53
61 Hope has become Port Hope; Greater Sudbury has become Greater Sudbury/Grand Sudbury; and Haileybury has become Temiskaming Shores. Table 1. Current CMAs and CAs in Canada (based on 2001 Census) Num. Name Type Population Area CMA/CAs (2001) (km²) > 100,000 1 St. John's CMA 172, Grand Falls Windsor CA 18,981 4, Gander CA 11,254 2, Corner Brook CA 25, Labrador City CA 9, Total for Newfoundland 512, , Charlottetown CA 58, Summerside CA 16, Total for Prince Edward Island 135,294 5, Halifax CMA 359,183 5, Kentville CA 25, Truro CA 44,276 2, New Glasgow CA 36,735 2, Cape Breton CA 109,330 2,471 1 Total for Nova Scotia 908,007 52, Moncton CA 117,727 2, Saint John CMA 122,678 3, Fredericton CA 81,346 4, Bathurst CA 23,935 1, Campbellton CA 16,265 1, Edmundston CA 22, Total for New Brunswick 729,498 71, Matane CA 16, Rimouski CA 47, Rivière-du-Loup CA 22, Baie-Comeau CA 28,940 1, Saguenay CMA 154,938 1, Alma CA 30, Dolbeau CA 14, Sept-Îles CA 26,952 1, Québec CMA 682,757 3, Saint-Georges CA 28, Thetford Mines CA 26, Sherbrooke CMA 153,811 1, Magog CA 22, Cowansville CA 12, Victoriaville CA 41, Trois-Rivières CMA 137, Shawinigan CA 57, La Tuque CA 12,376 1, Drummondville CA 68, Granby CA 60,
62 Num. Name Type Population Area CMA/CAs (2001) (km²) > 100, Saint-Hyacinthe CA 49, Sorel CA 40, Joliette CA 35, Saint-Jean-sur-Richelieu CA 79, Montréal CMA 3,426,350 4, Salaberry-de-Valleyfield CA 39, Lachute CA 11, Val-d'Or CA 32,423 3, Amos CA 21,749 3, Rouyn Noranda CA 36,038 2, Ottawa-Gatineau* CMA 257,568 2,044 1 Total for Quebec 7,237,479 1,357, Cornwall CA 57, Hawkesbury CA 11, Ottawa Gatineau* CMA 806,096 3, Brockville CA 44,741 1, Pembroke CA 23, Petawawa CA 14, Kingston CMA 146,838 1, Belleville CA 87, Cobourg CA 17, Port Hope CA 15, Peterborough CA 102,423 1, Kawartha Lakes CA 69,179 3, Oshawa CMA 296, Toronto CMA 4,682,897 5, Hamilton CMA 662,401 1, St. Catharines - Niagara CMA 377,009 1, Kitchener CMA 414, Brantford CA 86, Woodstock CA 33, Tillsonburg CA 14, Norfolk CA 60,847 1, Guelph CA 117, Stratford CA 29, London CMA 432,451 2, Chatham Kent CA 107,709 2, Leamington CA 46, Windsor CMA 307,877 1, Sarnia CA 88, Owen Sound CA 31, Collingwood CA 16, Barrie CA 148, Orillia CA 40, Midland CA 33, North Bay CA 63,681 1, Greater Sudbury/Grand Sudbury CMA 155,601 3, Elliot Lake CA 11, Temiskaming Shores CA 12,
63 Num. Name Type Population Area CMA/CAs (2001) (km²) > 100, Timmins CA 43,686 2, Sault Ste. Marie CA 78, Thunder Bay CMA 121,986 2, Kenora CA 15, Total for Ontario 11,410, , Winnipeg CMA 671,274 4, Portage la Prairie CA 20,617 2, Brandon CA 41, Thompson CA 13, Total for Manitoba 1,119, , Regina CMA 192,800 3, Yorkton CA 17, Moose Jaw CA 33, Swift Current CA 16,527 1, Saskatoon CMA 225,927 5, North Battleford CA 17, Prince Albert CA 41,460 1, Estevan CA 12, Total for Saskatchewan 978, , Medicine Hat CA 61,735 13, Brooks CA 11, Lethbridge CA 67, Calgary CMA 951,395 5, Red Deer CA 67, Camrose CA 14, Edmonton CMA 937, Lloydminster CA 20, Cold Lake CA 27,935 6, Grande Prairie CA 36, Wood Buffalo CA 46,602 63, Wetaskiwin CA 11, Total for Alberta 2,974, , Cranbrook CA 24,275 4, Penticton CA 41,574 2, Kelowna CMA 147,739 2, Vernon CA 51,530 1, Kamloops CA 86,491 5, Chilliwack CA 69,776 1, Abbotsford CMA 147, Vancouver CMA 1,986,965 2, Squamish CA 14, Victoria CMA 311, Duncan CA 38, Nanaimo CA 85,664 1, Parksville CA 24, Port Alberni CA 25,396 1, Courtenay CA 47, Campbell River CA 33,872 1,748 56
64 Num. Name Type Population Area CMA/CAs (2001) (km²) > 100, Powell River CA 18,269 4, Williams Lake CA 25,122 12, Quesnel CA 24,426 21, Prince Rupert CA 15, Kitimat CA 10, Terrace CA 19,980 9, Prince George CA 84,035 17, Dawson Creek CA 17,444 11, Fort St. John CA 16, Total for British Columbia 3,907, , Whitehorse CA 21,405 8,488 Total for Yukon 28, , Yellowknife CA 16, Total for Northwest Territories and Nunavut 64,105 3,066,567 0 Total Number of CMAs/CAs 140 Total CMA/CA Population and Area 23,842, ,282 Total for Canada 30,007,094 9,012, Percentage of Population Residing in CMAs/CAs * Portion of Ottawa Gatineau CMA (1,063,664) population in that province. CMA CA Census Metropolitan Area Census Agglomeration 57


65 APPENDIX C Maps Showing CMAs and CAs 58
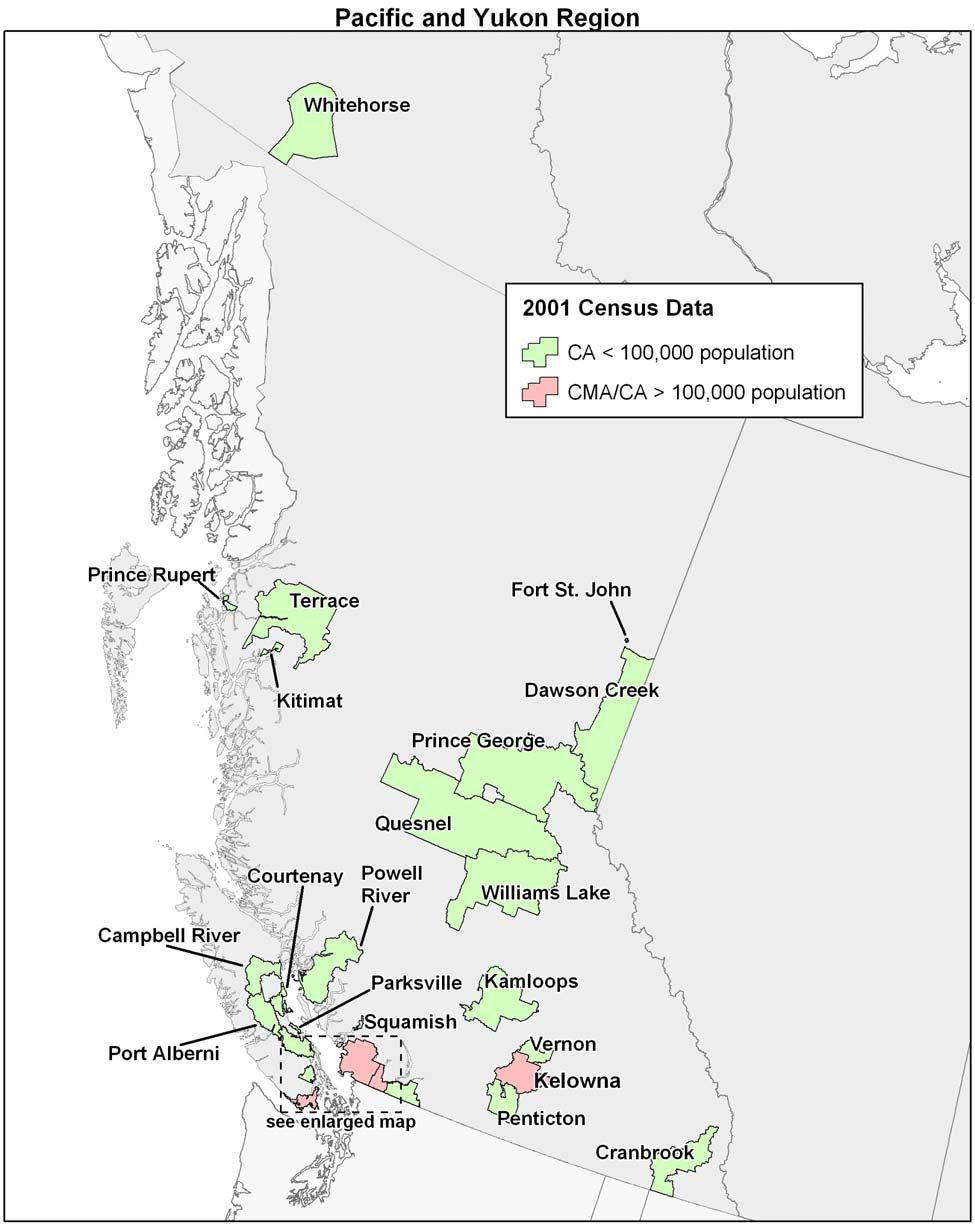
66 59
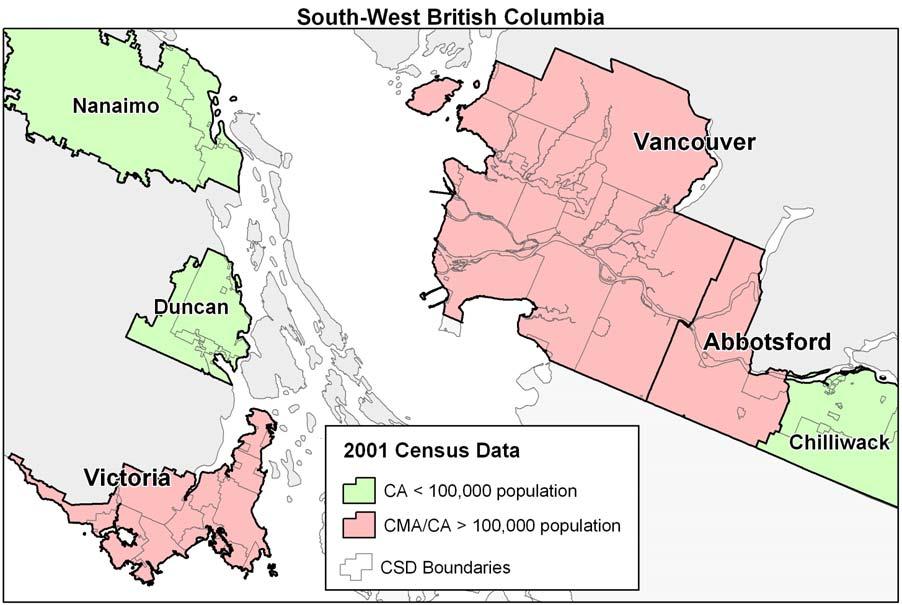

67 60
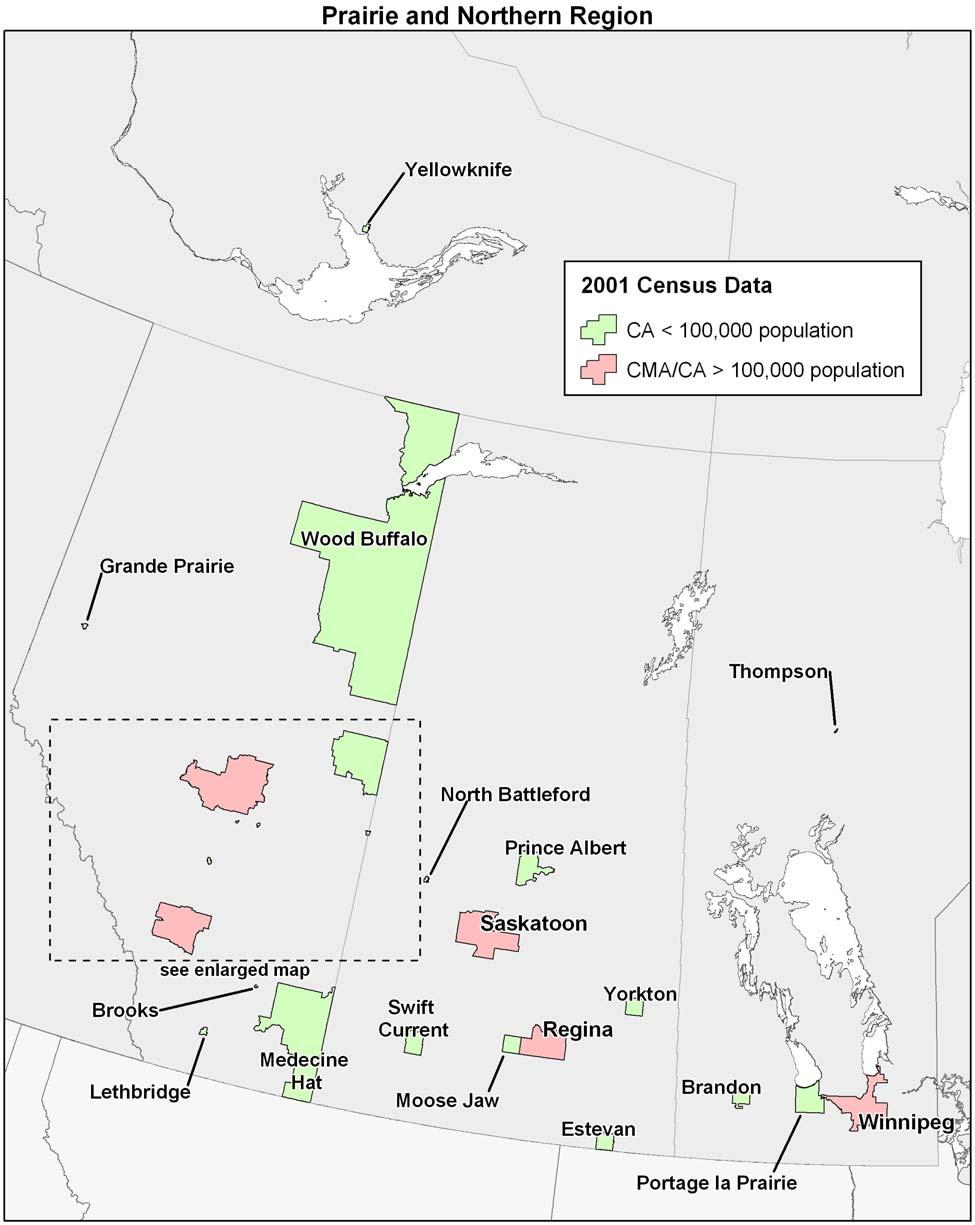
68 61
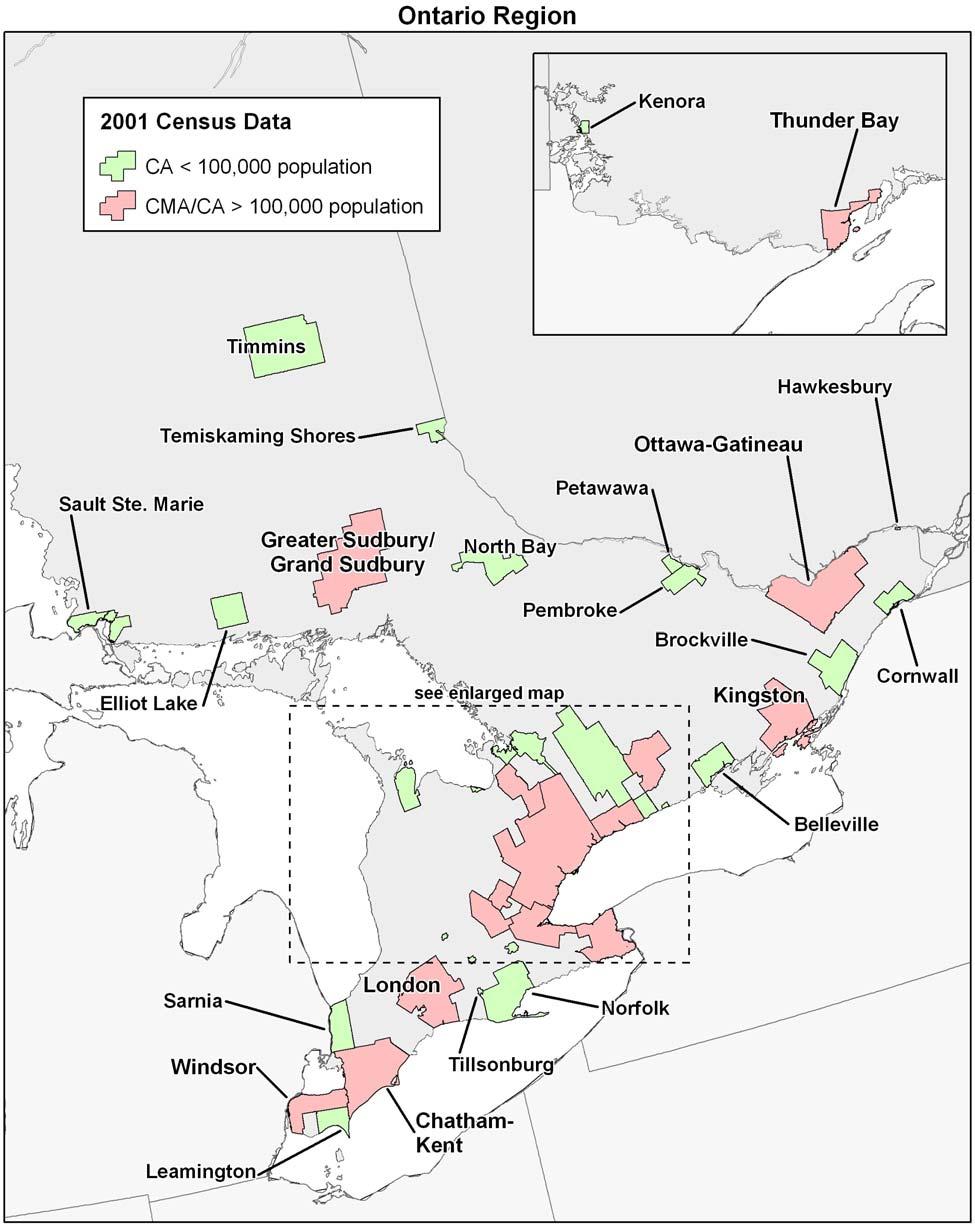
69 62
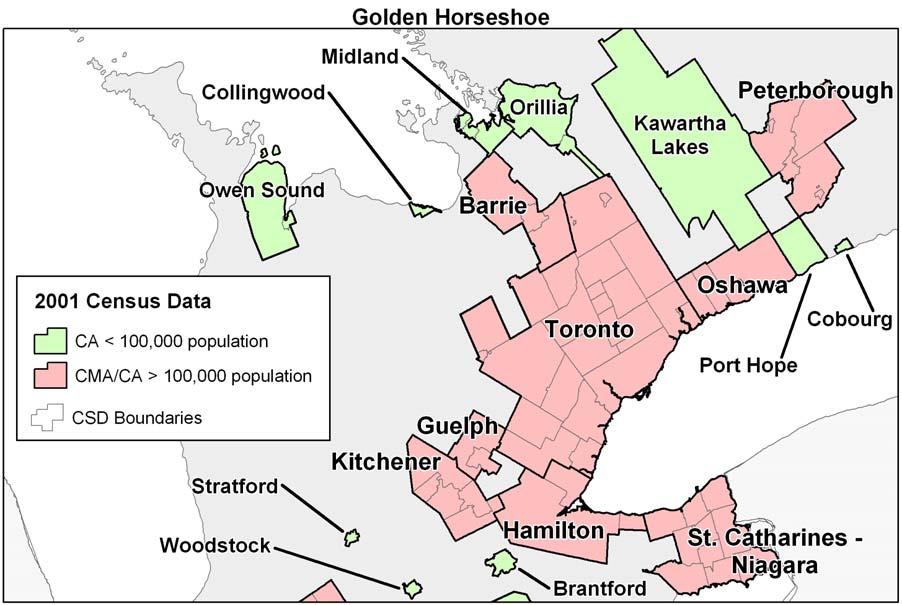

70 63
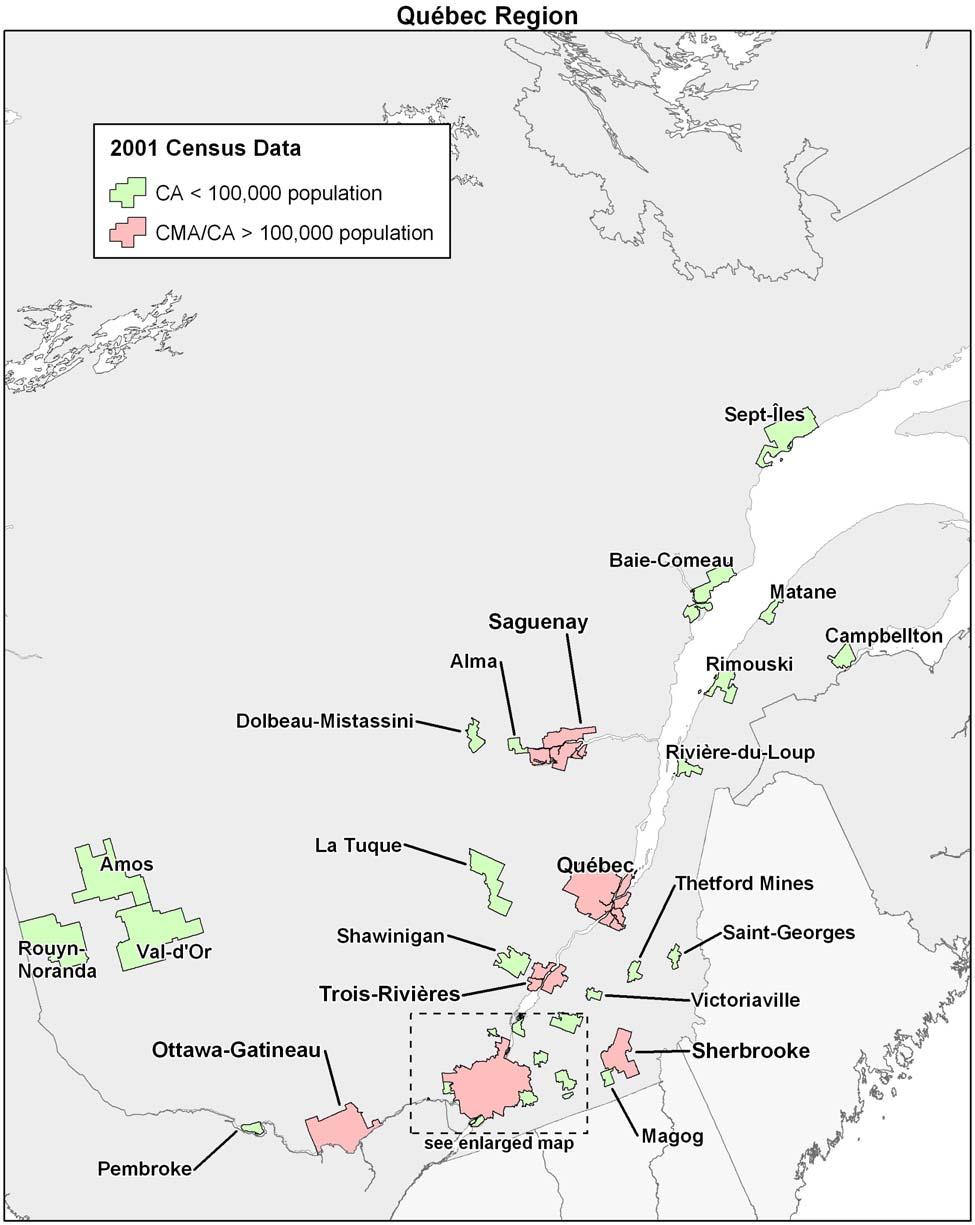
71 64
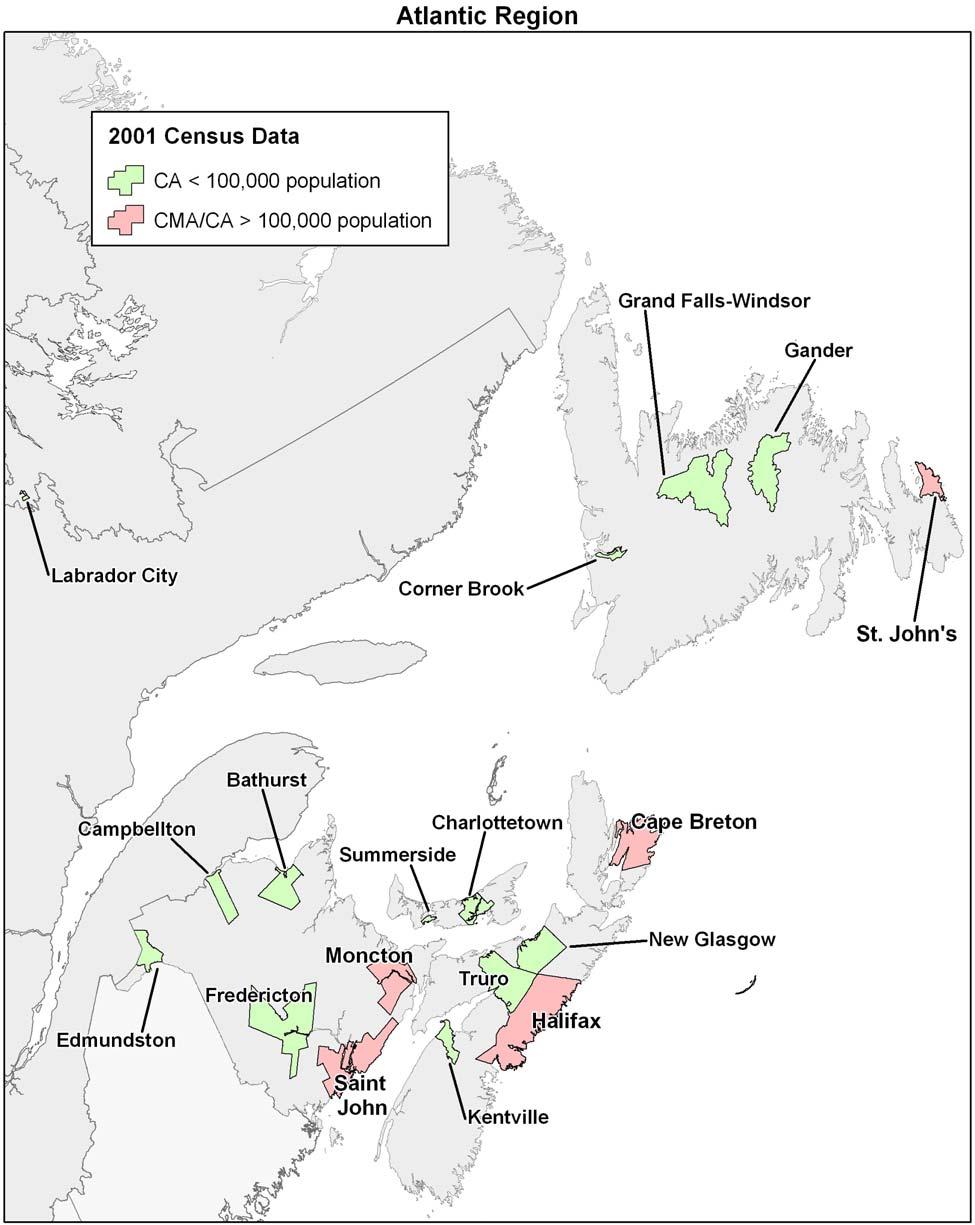
72 65
CANADA-WIDE STANDARDS
 Canadian Council of Ministers of the Environment CANADA-WIDE STANDARDS for PARTICULATE MATTER (PM) and OZONE Endorsed by CCME Council of Ministers, June 5-6, 2000, Quebec City 1 of 10 CANADA-WIDE STANDARDS
Report to the Canadian Council of Ministers of the Environment: An Update in Support of the Canada-wide Standards for Particulate Matter and Ozone
 Report to the Canadian Council of Ministers of the Environment: An Update in Support of the Canada-wide Standards for Particulate Matter and Ozone Prepared by the Joint Action Implementation Coordinating
GUIDANCE DOCUMENT on CONTINUOUS IMPROVEMENT (CI) and KEEPING-CLEAN-AREAS-CLEAN (KCAC)
 and KEEPING-CLEAN-AREAS-CLEAN (KCAC)") GUIDANCE DOCUMENT on CONTINUOUS IMPROVEMENT (CI) and KEEPING-CLEAN-AREAS-CLEAN (KCAC) Canada-wide Standards for Particulate Matter and Ozone PN 1389 ISBN 978-1-896997-72-8 PDF Canadian Council of Ministers
GUIDANCE DOCUMENT on CONTINUOUS IMPROVEMENT (CI) and KEEPING-CLEAN-AREAS-CLEAN (KCAC) Canada-wide Standards for Particulate Matter and Ozone PN 1389 ISBN 978-1-896997-72-8 PDF Canadian Council of Ministers
2015 Provincial Summary Report
 2015 Provincial Summary Report Achievement Status on the Canadian Ambient Air Quality Standards (CAAQS) for Fine Particulate Matter (PM 2.5 ) and Ozone January 2016 Page 1 of 16 Overview This is the first
Particulate Matter and Ozone Management Framework
 Particulate Matter and Ozone Management Framework Prepared by the Particulate Matter and Ozone Project Team for the Clean Air Strategic Alliance Board of Directors September 2003 Particulate Matter and
CANADA-WIDE STANDARDS FOR PM & OZONE STATUS OF JURISDICTIONAL IMPLEMENTATION ACTIVITIES MANITOBA
 CANADA-WIDE STANDARDS FOR PM & OZONE STATUS OF JURISDICTIONAL IMPLEMENTATION ACTIVITIES MANITOBA I. INTRODUCTION Manitoba has only one Census Metropolitan Area (CMA) (i.e., Winnipeg with 6% of Manitoba
PARTICULATE MATTER AND OZONE MANAGEMENT FACT SHEET ( )
") PARTICULATE MATTER AND OZONE MANAGEMENT FACT SHEET (2010 2012) April 2014 What is PM 2.5? Particulate matter can be emitted by any combustion source. PM 2.5 is fine particulate matter less than 2.5 micrometres
PARTICULATE MATTER AND OZONE MANAGEMENT FACT SHEET (2010 2012) April 2014 What is PM 2.5? Particulate matter can be emitted by any combustion source. PM 2.5 is fine particulate matter less than 2.5 micrometres
Particulate Matter and Ozone Management Fact Sheet ( )
") Particulate Matter Ozone Management Fact Sheet (2001-2003) FACTS AT YOUR FINGERTIPS ISBN: 0-7785-5089-3 (print) 0-7785-5090-7 (online) Particulate matter can be emitted by any combustion source. Ozone
Particulate Matter Ozone Management Fact Sheet (2001-2003) FACTS AT YOUR FINGERTIPS ISBN: 0-7785-5089-3 (print) 0-7785-5090-7 (online) Particulate matter can be emitted by any combustion source. Ozone
ALBERTA ENVIRONMENT SUMMARY REPORT ON 2004 NPRI AIR EMISSIONS
 ALBERTA ENVIRONMENT SUMMARY REPORT ON 2004 NPRI AIR EMISSIONS Disclaimer: The source of the industrial emissions data used in this report is the April 25, 2006 version of the 2004 National Pollutant Release
Fine Particles and Ozone in Canada. A Canada-wide Standards Perspective National Summary
 Fine Particles and Ozone in Canada A Canada-wide Standards Perspective 2003 National Summary An Environment Canada Staff Report in Support of the Canada-wide Standards for Particulate Matter and Ozone
Data Sources and Methods for the International Comparison of Urban Air Quality Indicators. January 2014
 Data Sources and Methods for the International Comparison of Urban Air Quality Indicators January 2014 ISBN: 978-1-100-23012-2 Cat. No.: En4-144/43-2013E-PDF Information contained in this publication may
Guidance on Application of. Provincial Air Quality Objectives for SO 2. B.C. Ministry of Environment
 Guidance on Application of Provincial Air Quality Objectives for SO 2 B.C. Ministry of Environment February 7, 2017 Guidance on Application of Provincial Air Quality Objectives for SO 2 1. Purpose To
Red Deer Region Air Zone Canadian Ambient Air Quality Standards Response Government of Alberta Action Plan
 Red Deer Region Air Zone Canadian Ambient Air Quality Standards Response Government of Alberta Action Plan September 2017 Any comments or questions regarding the content of this document may be directed
Nova Scotia Air Zone Report. Nova Scotia Air Quality Unit, 2015
 Nova Scotia Air Zone Report Nova Scotia Air Quality Unit, 2015 Acronyms AQHI Air Quality Health Index AQMS Air Quality Management System AQU Nova Scotia Environment s Air Quality Unit CAAQS Canadian Ambient
APPENDIX 10. Supplemental Air Quality Information
 APPENDIX 10 Supplemental Air Quality Information Environmental Assessment of Canadian Strategic Infrastructure Funded Upgrades to the City of Winnipeg Water Pollution Control Centres APPENDIX 10 Supplemental
CANADA-WIDE STANDARD FOR BENZENE 2010 FINAL REPORT JANUARY, 2012 PN 1467
 CANADA-WIDE STANDARD FOR BENZENE 2010 FINAL REPORT JANUARY, 2012 PN 1467 Canadian Council of Ministers of the Environment, 2012 The Canadian Council of Ministers of the Environment (CCME) is the primary,
Northwest Territories Air Quality Report 2012
 Northwest Territories Air Quality Report 212 TABLE OF CONTENTS Introduction...3 Operations (Network...4 Developments in 212...8 Future Plans...9 NWT Air Quality Standards...1 Yellowknife Air Quality...12
Esri Business Analyst (Canadian Edition) Map Your Way to Better Business Decisions
 Map Your Way to Better Business Decisions") Esri Business Analyst (Canadian Edition) Map Your Way to Better Business Decisions Esri Business Analyst (Canadian Edition) The Most Complete GIS and Data Solution for Geographic Business Analysis To
Esri Business Analyst (Canadian Edition) Map Your Way to Better Business Decisions Esri Business Analyst (Canadian Edition) The Most Complete GIS and Data Solution for Geographic Business Analysis To
Council of the Federation Founding Agreement
 Council of the Federation Founding Agreement Preamble Premiers agreed to create a Council of the Federation, as part of their plan to play a leadership role in revitalizing the Canadian federation and
Dublin Airport Air Quality Monitoring Q1 2017
 Dublin Airport Air Quality Monitoring Q1 2017 Environment May 2017 Dublin Airport Air Quality Monitoring Quarter 1 Report 2017 Contents 1.0 Introduction... 4 1.1 Background... 4 1.2 Purpose... 4 2.0 Monitoring
National Register of Electors. Updates: November 2017 Annual Lists
 National Register of Electors Updates: November 2017 Annual Lists Table of Contents Introduction...3 Overview...4 1. Background...5 2. Updating...5 3. Quality...7 3.1 Coverage...7 3.2 Currency...10 3.3
Query Manufacturer File
 Query Manufacturer File This chapter provides record formats needed to query a manufacturer identification (MID) code. RECORD DESCRIPTIONS Record Identifier $ (Input).........................QMF-3 A mandatory
Primary Environmental Indicators
 Primary Environmental Indicators 1 Air Quality Regulations designed to improve air quality target six main pollutants: sulphur dioxide (SO 2 ), nitrogen dioxide (NO 2 ), ground level ozone (O 3 ), carbon
Guidance on Application of. Provincial Air Quality Objectives for NO 2. B.C. Ministry of Environment
 Guidance on Application of Provincial Air Quality Objectives for NO 2 B.C. Ministry of Environment February 7, 2017 Guidance on Application of Provincial Interim Air Quality Objectives for NO 2 1. Purpose
Northwest Territories Air Quality Report
 Northwest Territories Air Quality Report 2014 Table of Contents Introduction... 1 Operations (Network)... 2 Developments in 2014... 6 Future Plans... 7 NWT Air Quality Standards... 8 Yellowknife Air Quality...
CANADA-WIDE STANDARD. for BENZENE PHASE 2
 Canadian Council of Ministers of the Environment CANADA-WIDE STANDARD for BENZENE PHASE 2 Endorsed by CCME Council of Ministers, September 22-23, 2001, The Pas MB 1 of 6 CANADA-WIDE STANDARD for BENZENE
Query Manufacturer File
 Query Manufacturer File RECORD DESCRIPTIONS This chapter provides record formats needed to query a manufacturer identification (MID) code. Record Identifier $ (Input)...... QMF-3 A mandatory query manufacturer
Goal To support and when required, facilitate, the timely implementation of the Alberta Particulate Matter and Ozone Management Framework (2003).
.") PM and Ozone Implementation Team Terms of Reference Preamble The Multi-stakeholder roup (MS) for PM and Ozone was established by CASA in 1998 to provide input to Alberta Environment on the development
PM and Ozone Implementation Team Terms of Reference Preamble The Multi-stakeholder roup (MS) for PM and Ozone was established by CASA in 1998 to provide input to Alberta Environment on the development
Pan-Canadian Approach to Carbon Pricing. High Level Regional Dialogue on Carbon Pricing January 22, 2018 Environment and Climate Change Canada
 Pan-Canadian Approach to Carbon Pricing High Level Regional Dialogue on Carbon Pricing January 22, 2018 Environment and Climate Change Canada Pan-Canadian Carbon Pricing Benchmark Timely introduction (in
CCME. Canadian Council of Ministers of the Environment. Le Conseil canadien des ministres de l environnement
 Canadian Council of Ministers of the Environment CCME Le Conseil canadien des ministres de l environnement A CANADA-WIDE ACCORD ON ENVIRONMENTAL HARMONIZATION VISION Governments working in partnership
Dublin Airport Air Quality Monitoring Q1, Q2 2017
 Dublin Airport Air Quality Monitoring Q1, Q2 2017 Environment August 2017 Dublin Airport Air Quality Monitoring Report Quarter 1&2 2017 Air Quality Monitoring Dublin Airport: Q1, Q2 2017 Contents 1.0 Introduction...
Progress Report on The Canada-Wide Acid Rain Strategy for Post-2000
 2006-2007 Progress Report on The Canada-Wide Acid Rain Strategy for Post-2000 Federal/Provincial/Territorial Ministers of Energy and Environment ISSN 1911-1541 PN 1410 2006-2007 Progress Report on The
COMMONWEALTH OF VIRGINIA STATE AIR POLLUTION CONTROL BOARD REGULATIONS FOR THE CONTROL AND ABATEMENT OF AIR POLLUTION
 COMMONWEALTH OF VIRGINIA STATE AIR POLLUTION CONTROL BOARD REGULATIONS FOR THE CONTROL AND ABATEMENT OF AIR POLLUTION 9VAC5 CHAPTER 30. AMBIENT AIR QUALITY STANDARDS. 9VAC5-30-10. General. 9VAC5-30-15.
Yukon Air Zone Report 2014
 Yukon Air Zone Report 2014 For the years 2012-2014 Summary This is the first air zone report for the Yukon Air Zone. Air zone reports are a commitment of the Government of Yukon under the national Air
Fiscal Federalism in Canada. Rupak Chattopadhyay
 Fiscal Federalism in Canada Rupak Chattopadhyay Web statistics Yukon (1898) 0.1% North-West Territories (1870) 0.1% Provinces and territories (date of entry into Confederation) and % share of 2013 population
CCME. Le Conseil canadien des ministres de l environnement. Canadian Council of Ministers of the Environment
 CCME Canadian Council of Ministers of the Environment Le Conseil canadien des ministres de l environnement CANADA-WIDE ENVIRONMENTAL STANDARDS SUB-AGREEMENT 1. OBJECTIVES 1.1 Consistent with the Canada-wide
Dublin Airport Air Quality Monitoring
 Dublin Airport Air Quality Monitoring Annual Report 2017 HSSE Environment Dublin Airport Air Quality Monitoring Annual Report 2017 Contents 1.0 Introduction... 4 1.1 Background... 4 1.2 Purpose... 4 2.0
A. INTRODUCTION B. POLLUTANTS FOR ANALYSIS
 Chapter 2, Section F: Air Quality A. INTRODUCTION This section examines the potential for air quality impacts due to the proposed operational and geometric changes in traffic conditions along Fulton Street
Evaluating government plans and actions to reduce GHG emissions in Canada: The state of play in 2016
 Evaluating government plans and actions to reduce GHG emissions in Canada: The state of play in 2016 Hadrian Mertins-Kirkwood, Canadian Centre for Policy Alternatives Bruce Campbell, CCPA & University
Data from the Waste Management Industry Survey and the Household Environment Survey
 Household participation in composting Data from the Waste Management Industry Survey and the Household Environment Survey Amanda Elliott October 1 st, 2009 Who am I? Why am I here? Amanda Elliott Analyst,
PRINCE EDWARD ISLAND Air Quality Report For the Years
 PRINCE EDWARD ISLAND 2014 Air Quality Report For the Years 2011-2013 September, 2016 1.0 INTRODUCTION The Air Quality Management System (AQMS) was endorsed by the Canadian Council of Ministers of the Environment
PROGRESS REPORT ON THE CANADA-WIDE ACID RAIN STRATEGY FOR POST-2000 PN 1458 ISSN PDF
 2008-2009 PROGRESS REPORT ON THE CANADA-WIDE ACID RAIN STRATEGY FOR POST-2000 PN 1458 ISSN 1911-1541 PDF Canadian Council of Ministers of the Environment 2011 The Canadian Council of Ministers of the Environment
LOWER FRASER VALLEY AIR ZONE REPORT ( )
") LOWER FRASER VALLEY AIR ZONE REPORT (2011-2013) OVERVIEW This is the first air quality report for the Lower Fraser Valley Air Zone, which covers Metro Vancouver and the Fraser Valley Regional District.
LOWER FRASER VALLEY AIR ZONE REPORT (2011-2013) OVERVIEW This is the first air quality report for the Lower Fraser Valley Air Zone, which covers Metro Vancouver and the Fraser Valley Regional District.
Lower Athabasca Region Air Zone Canadian Ambient Air Quality Standards Response Government of Alberta Action Plan
 Lower Athabasca Region Air Zone Canadian Ambient Air Quality Standards Response Government of Alberta Plan September 2017 Any comments or questions regarding the content of this document may be directed
Data Sources and Methods for the Air Health Indicator. May 2014
 Data Sources and Methods for the Air Health Indicator May 2014 ISBN : 978-1-100-23591-2 Cat. No.: En4-144/12-2014E-PDF Information contained in this publication may be reproduced, in part or in whole,
City of Saskatoon Air Quality Monitoring Survey
 City of Saskatoon Air Quality Monitoring Survey May 10, 2017 Chris Gray Environmental Protection Branch Saskatchewan Ministry of Environment Background Proposal was put forward in May 2014 for Monitoring
Northwest Territories Air Quality Report 2015
 Northwest Territories Air Quality Report 2015 OF CONTENTS TABLE OF CONTENTS TABLE Introduction...1 Operations (Network...2 Developments in 2015...6 Future Plans...7 NWT Air Quality Standards...8 Yellowknife
Upper Athabasca Region Air Zone Canadian Ambient Air Quality Standards Response Government of Alberta Action Plan
 Upper Athabasca Region Air Zone Canadian Ambient Air Quality Standards Response Government of Alberta Plan September 2017 Any comments or questions regarding the content of this document may be directed
AND ENVIRONMENT REPORT
 BESt ENERGY AND ENVIRONMENT REPORT The National Green Building Report SUMMARY REPORT Welcome to the fifth annual BESt Energy and Environment Report, the National Green Building Report. Canada and the eleven
IMPLEMENTING CANADA S PLAN TO ADDRESS CLIMATE CHANGE AND GROW THE ECONOMY
 IMPLEMENTING CANADA S PLAN TO ADDRESS CLIMATE CHANGE AND GROW THE ECONOMY PUTTING A PRICE ON CARBON POLLUTION Technical Briefing October 23, 2018 Addressing climate change and growing the economy Canada
Nova Scotia Air Zone Report
 Nova Scotia Air Zone Report 2016 Contents Introduction to Nova Scotia Environment s Ambient Air Programs... 1 Airsheds and Air Zones... 3 Airsheds... 3 Air Zones... 4 Canadian Ambient Air Quality Standards
2002 Annual Progress Report. The Canada-Wide Acid Rain Strategy for Post March 2004
 00 Annual Progress Report on The Canada-Wide Acid Rain Strategy for Post-000 March 004 National Library of Canada cataloguing in publication data Main entry under title: 00 annual progress report on the
Saskatchewan Labour Force Statistics
 Saskatchewan Labour Force Statistics March 2018 UNADJUSTED DATA According to the Statistics Canada Labour Force Survey during the week covering March 11 th to 17 th,, 2018, there were 562,700 persons employed
Canadian Environmental Sustainability Indicators. Air health trends
 Canadian Environmental Sustainability Indicators Air health trends Suggested citation for this document: Environment and Climate Change Canada (2018) Canadian Environmental Sustainability Indicators: Air
SUBJECT: Background Ambient Air Quality for Gardiner Expressway and Lakeshore Boulevard Reconfiguration
 MEMO TO: FROM: Jeffrey Dea Project Manager, City of Toronto Hong Liu, Ravi Mahabir CC: n/a DATE: August 22 nd, 2013 SUBJECT: Background Ambient Air Quality for Gardiner Expressway and Lakeshore Boulevard
Saskatchewan Labour Force Statistics
 Saskatchewan Labour Force Statistics April 2018 UNADJUSTED DATA According to the Statistics Canada Labour Force Survey during the week covering April 15 th to 21 st, 2018, there were 558,300 persons employed
Saskatchewan Labour Force Statistics
 Saskatchewan Labour Force Statistics February 2018 UNADJUSTED DATA According to the Statistics Canada Labour Force Survey during the week covering February 11 th to 17 th,, 2018, there were 555,800 persons
PROPOSED PERFORMANCE AGREEMENT APRIL Performance Agreement Concerning Air Pollutants from the Iron Ore Pellet Sector (Herein Agreement ) Between
 Between") Performance Agreement Concerning Air Pollutants from the Iron Ore Pellet Sector (Herein Agreement ) Between Her Majesty the Queen in Right of Canada, as represented by the Minister of the Environment (Herein
Performance Agreement Concerning Air Pollutants from the Iron Ore Pellet Sector (Herein Agreement ) Between Her Majesty the Queen in Right of Canada, as represented by the Minister of the Environment (Herein
PROVINCIAL-TERRITORIAL APPRENTICE MOBILITY GUIDELINES
 PROVINCIAL-TERRITORIAL APPRENTICE MOBILITY GUIDELINES SEPTEMBER 2017 1 TABLE OF CONTENTS About These Guidelines... 3 Provincial-Territorial Apprentice Mobility Transfer Guide... 3 1.0 Background... 3 2.0
PROGRESS REPORT ON THE CANADA-WIDE ACID RAIN STRATEGY FOR POST-2000 PN 1490 ISSN PDF
 2010-2011 PROGRESS REPORT ON THE CANADA-WIDE ACID RAIN STRATEGY FOR POST-2000 PN 1490 ISSN 1911-1541 PDF Canadian Council of Ministers of the Environment, 2013 The Canadian Council of Ministers of the
PRINCE EDWARD ISLAND Air Quality Report For the Years
 PRINCE EDWARD ISLAND 2014 Air Quality Report For the Years 2011-2013 September, 2016 PRINCE EDWARD ISLAND 2014 Air Quality Report For the Years 2011-2013 September 2016 Department of Communities, Land
Saskatchewan Labour Force Statistics
 Saskatchewan Labour Force Statistics June 2017 UNADJUSTED DATA According to the Statistics Canada Labour Force Survey during the week covering June 11 th to 17 th,, 2017, there were 579,800 persons employed
Saskatchewan Labour Force Statistics
 Saskatchewan Labour Force Statistics June 2018 UNADJUSTED DATA According to the Statistics Canada Labour Force Survey during the week covering June 10 th to 16 th, 2018, there were 583,700 persons employed
Results from the National Municipal Adaptation Survey
 Canada NMAP Results Results from the National Municipal Adaptation Survey Since the Intergovernmental Panel on Climate Change (IPCC) issued its consensus reports on climate change, the global science and
Developing a Sustainable Pavement Management Strategy for Resurfacing Low Volume Roads in New Brunswick
 Developing a Sustainable Pavement Management Strategy for Resurfacing Low Volume Roads in New Brunswick Shawn Landers, MSc.Eng., P.Eng. (Corresponding Author) Opus International Consultants Limited 80
Air Quality Monitoring at Dublin Airport: Annual Report for HSSE Department
 Air Quality Monitoring at Dublin Airport: Annual Report for 2013 Air Quality Monitoring at Dublin Airport: 2013 Table of Contents Glossary... 3 Executive Summary... 4 1. Introduction... 5 1.1. Background...
Canadian Guidelines for Establishing Posted Speed Limits
 Canadian Guidelines for Establishing Posted Speed Limits Sany R. Zein, M.Eng., P.Eng. Vivian Law, P.Eng. Opus International Consultants Presentation to the 2009 Quad Conference - Vancouver Canadian Guidelines
Investigation of Fine Particulate Matter Characteristics and Sources in Edmonton, Alberta
 Investigation of Fine Particulate Matter Characteristics and Sources in Edmonton, Alberta Executive Summary Warren B. Kindzierski, Ph.D., P.Eng. Md. Aynul Bari, Dr.-Ing. 19 November 2015 Executive Summary
New Westminster Air Quality Monitoring Study. November 2011
 2009-10 New Westminster Air Quality Monitoring Study November 2011 This report was prepared by the staff of the Air Quality Policy and Management Division of Metro Vancouver. The project was managed by
OCCUPATIONAL LANDSCAPE
 OCCUPATIONAL LANDSCAPE HYDROLOGIST & HYDROGEOLOGIST ECO Canada has developed the Occupational Landscape report to provide insight on twelve professions working with or in the Environmental sector. This
Delta Air Quality Monitoring Study June 2004 March 2006
 Delta Air Quality Monitoring Study June 2004 March 2006 Air Quality Policy and Management Division Policy and Planning Department Greater Vancouver Regional District: August, 2006 Table of Contents Executive
Special Areas and Improvement Districts
 Special Areas and Improvement Districts This technical document is part of a series of draft discussion papers created by Municipal Affairs staff and stakeholders to prepare for the Municipal Government
Payroll & Vacations: Is Your Organization Compliant?
 One of the biggest anxieties for payroll professionals is dealing with annual vacations. While it may seem like a simple and straightforward aspect of the employment relationship, it is can be quite complex.
5. Competitiveness. Seven Reports on the Identi cation of Rural Indicators for Rural Communities
 The Canadian Rural Revitalization Foundation Seven Reports on the Identi cation of Rural Indicators for Rural Communities 5. Competitiveness Prepared for the Rural Secretariat of Agriculture and Agri-Food
Cost Estimate for Bill S-209: An Act to amend the Official Languages Act (communications with and services to the public)
") Cost Estimate for Bill S-209: An Act to amend the Official Languages Act (communications with and services to the public) Ottawa, Canada 17 August 2016 www.pbo-dpb.gc.ca The mandate of the Parliamentary
Cost Estimate for Bill S-209: An Act to amend the Official Languages Act (communications with and services to the public) Ottawa, Canada 17 August 2016 www.pbo-dpb.gc.ca The mandate of the Parliamentary
ASSESSING OZONE AND FINE PARTICULATE MATTER CONCENTRATIONS AND TRENDS IN ONTARIO, CANADA, Cameron Hare. A Major Research Paper
 ASSESSING OZONE AND FINE PARTICULATE MATTER CONCENTRATIONS AND TRENDS IN ONTARIO, CANADA, 2003 2012 by Cameron Hare A Major Research Paper presented to Ryerson University in partial fulfillment of the
APPENDIX C: Bakersfield-Golden AMS Closure and Replacement
 APPENDIX C: Bakersfield-Golden AMS Closure and Replacement Appendix C: Bakersfield-Golden AMS Closure and Replacement This page is intentionally blank. Appendix C: Bakersfield-Golden AMS Closure and Replacement
Research Report Is Your Workforce Prepared to Drive Your Organization s Future?
 Research Report Is Your Workforce Prepared to Drive Your Organization s Future? From the Drake Research Centre Survey administered from June 9, 2011 to July 25, 2011 Drake International assists organizations
AN OVERVIEW OF EXTENDED PRODUCER RESPONSIBILITY IN CANADA: WHAT IS IT, AND WHERE S IT GOING DUNCAN BURY Yellowknife, April 17, 2013
 AN OVERVIEW OF EXTENDED PRODUCER RESPONSIBILITY IN CANADA: WHAT IS IT, AND WHERE S IT GOING DUNCAN BURY Yellowknife, April 17, 2013 PRESENTATION OUTLINE Canadian waste generation and diversion The move
AIR MANAGEMENT IN ALBERTA
 AIR MANAGEMENT IN ALBERTA Air Management In Alberta Alberta Environment January 2009 ISBN No. 978-0-7785-8088-1 (Printed) ISBN No. 978-0-7785-8089-8 (On-line) Web Site: http://www.environment.alberta.ca/
FIGURE ENVIRONMENTAL ASSESSMENT OF THE CAPITAL REGION RESOURCE RECOVERY CENTRE LEGEND NOTE REFERENCE
 Path: N:\Active\Spatial_IM\Miller_Paving_Ltd\CRRRC\\MXDs\12-1125-45\Reporting\Phase\Vol.1\12112545--Vol1-8.4.1-1.mxd LEGEND NOISE MONITORING LOCATIONS.! 2 SCALE 1:12, METRES POINT OF RECEPTION LOCATIONS
APPLICATION CHECKLIST VESSEL OPERATION RESTRICTION REGULATIONS
 APPLICATION CHECKLIST VESSEL OPERATION RESTRICTION REGULATIONS GENERAL INFORMATION This checklist will help local authorities prepare applications for Vessel Operation Restriction Regulations (VORR). Transport
GREENHOUSE GAS EMISSIONS REPORTING PROGRAM. Overview of 2008 Facility Data
 GREENHOUSE GAS EMISSIONS REPORTING PROGRAM Overview of 2008 Facility Data Photo credits: Cover page: Photocom Inside: Jim Moyes (p. 1); Photocom (p. 12) ISSN 1918-6150 Her Majesty the Queen in Right of
Local Air Quality Assessment Trafalgar Road from Steeles Avenue to Highway 7 Town of Halton Hills, Ontario
 Local Air Quality Assessment Trafalgar Road from Steeles Avenue to Highway 7 Town of Halton Hills, Ontario Novus Reference No. 13-0251 Version No. Final NOVUS PROJECT TEAM: Engineer: Project Manager: Jenny
Ambient air quality standards.
 3745-25-02 Ambient air quality standards. [Comment: For dates of non-regulatory government publications, publications of recognized organizations and associations, federal rules, and federal statutory
Jennings O Donovan & Partners Consulting Engineers Sligo
 8.0 AIR QUALITY 8.1 INTRODUCTION 8.1.1 Background Despite the ongoing deterioration in air quality on a national level due to the reliance on fossil fuel generated energy, Ireland as a whole is relatively
Cropland Values in Canada
 Cropland Values in Canada HIGHLIGHTS Using data from the Farm Financial Survey (FFS), this study provides an overview of trends in cropland values in Canada -. Cropland values were highest in British Columbia,
The Growth of Information Technology Enabled Services in Canada
 The Growth of Information Technology Enabled Services in Canada - 1996-2001 Richard Shearmur, INRS-Urbanisation, Culture et Société 3465 Durocher Montréal H2X 2C6 e-mail : richard.shearmur@inrs-ucs.uquebec.ca
MacAleese Lane Air Quality Report Monitoring Program
 MacAleese Lane Air Quality Report 2009 Monitoring Program Department of Environment April 2010 MacAleese Lane Air Quality Report 2009 Monitoring Program Introduction In February of 2009, the New Brunswick
12. EMISSIONS OF SULPHUR DIOXIDE
 Air Air quality is to a great extent influenced by combustion of fossil fuels, evaporation of volatile organic compounds and their photochemical reaction with other pollutants in the atmosphere. Pollutants
AMO Background Paper and Survey on Municipal Council Term and Related Matters
 AMO Background Paper and Survey on Municipal Council Term and Related Matters February 2005 (Survey is attached as a separate Word document) Association of Municipalities of Ontario 393 University Avenue,
Ambient Air Monitoring
 Ambient Air Monitoring At Shannon, Co. Clare 15 th March 2011 18 th July 2012 Contents Summary........ 3 Introduction........ 4 Time Period........ 5 Siting......... 5 Monitoring Methods....... 6 Results.........
GRADE NINE CANADA S FEDERAL POLITICAL SYSTEM CANADA PASSPORT
 GRADE NINE CANADA S FEDERAL POLITICAL SYSTEM CANADA PASSPORT CHAPTER ONE How effectively does Canada s federal political system govern canada for all canadians? LEGISLATIVE BRANCH The Queen Canada is a
Collective Agreement Libraries by Canadian Jurisdiction
 Collective Agreement Libraries by Canadian Jurisdiction Government of Canada (An incomplete source of Federally and provincially regulated CA s across Canada) Collective bargaining information can be found
Changes to Federal Ambient Air Quality Standards and the Affect on Industry in BC
 Changes to Federal Ambient Air Quality Standards and the Affect on Industry in BC EMA of BC - 2017 Workshop February 16, 2017 Anna Henolson Outline Background New SO2 CAAQS CAAQS Implementation in British
Peter Smith P.Eng and Guy Van Uytven, M. Eng., MBA, P.Eng., FCSSE
 Peter Smith P.Eng and Guy Van Uytven, M. Eng., MBA, P.Eng., FCSSE Warming of the climate system is unequivocal, human influence on the climate system is clear, and limiting climate change will require
Operating revenue for the employment services industry rose 9.5% in 2012, increasing to $11.5 billion.
 Catalogue no. 63-252-X. Service bulletin Employment Services 2012. Highlights Employment services, 2012 Operating revenue for the employment services industry rose 9.5% in 2012, increasing to $11.5 billion.
Cannabis Duty and Information Return
 Protected B when completed Cannabis Duty and Information Return under the Excise Act, 2001 If you are a licenced cultivator, producer, or packager of cannabis or cannabis products, complete this form for
Alberta Land Use Framework. Jurisdictional Review of Land Use and Land Management Policy
 Alberta Land Use Framework Jurisdictional Review of Land Use and Land Management Policy Final Report Executive Summary Prepared for: Alberta Sustainable Resource Development Prepared by: UMA AECOM 2540
An Overview of Air Quality Management in Canada
 An Overview of Air Quality Management in Canada Glen Okrainetz, Director, Air Quality BC Ministry of Healthy Living & Sport Victoria, British Columbia International: United Nations, European Union, Commission