Energy security indices
|
|
|
- Dorcas McKinney
- 6 years ago
- Views:
Transcription


1 Energy security indices in Europe Economic Challenges for Energy Workshop Beatriz Muñoz Delgado UNED 1
2 Contents 1. Energy security: Conceptual review 2. Energy security quantification 3. REACCESS project & UNED s role 4. Energy risk assessment process 5. Socioeconomic Energy Risk Index scores 6. REACCESS energy risk assessment 7. Energy corridors description 8. Final remarks 2 2
3 1. Energy security: Conceptual review Security of energy supply (importer) Quantities & Prices [Energy security is] the continuous availability of energy in varied forms, in sufficient quantities and at affordable prices (UNDP, 2001). Energy security, defined in general terms, means adequate and reliable supplies of energy at affordable prices (IEA, 2007). Security of energy demand (exporter) Income Risk to the energy supply exists if there is the possibility of a partial or total interruption of physical energy flow (physical risk) or a major shift in energy prices (economic risk). 3 3
4 1.1. Energy security: Types of energy risks Primary energy risk (causes) Physical Economic Disruptions Prices volatility Technical Geopolitical Socio-political Accidents Natural disasters Power politics States competition International conflicts Domestic conditions Secondary energy risk (consequences) Social Environmental Social demands Conflicts of interest Accidents Pollution 4 4
5 2.1. Energy security quantification: Simple or disaggregated indicators 1. Dependence 1.1. Import dependence indicators 1.2. Total self-sufficiency 2. Vulnerability 2.1. Concentration/diversity Herfindahl-Hirschman Index Shannon Index Market/Mix shares 2.2. Energy intensity 2.3. Energy efficiency 2.4. Energy consumption p.c Minimum security reserves 2.6. Storage capacity 2.7. Geoeconomic Vulnerability Index 3. Connectivity 3.1. Volumes of gas/electricity imported with regard to total production/imports 3.2. Capacities (gas/electricity) 4. Resources availability 4.1. Resource estimates 4.2. Reserves to production ratios 5. Sustainability 5.1. Share of zero-carbon fuels 6. Market related 6.1. Energy Affinity Index 6.2. Market liquidity 6.3. Energy prices Market power 5
6 2.2. Energy security quantification: Composite or aggregated indicators 1. Shannon Index based (Jansen et al., 2004) 2. Geopolitical Energy Security Measure (Blyth & Lefevre, 2004) 3. Energy Security Indexes: ESIprice + ESIvolume (IEA, 2007) 4. Supply/Demand Index for long-term security of supply (Scheepers et al., 2007) 5. Willingness to Pay Function for Security of Supply (Bollen,2008) 6. Oil Vulnerability Index (Gupta, 2008) 7. Risky External Energy Supply (Le Coq & Paltseva, 2009) 8. Socioeconomic Energy Risk Index (Marín, et al.,2009) 6 6
7 Energy security quantification: Composite or aggregated indicators factors 1. Shannon Index based: (1)+(2)+(3)+(4) 2. Geopolitical Energy Security Measure: (2)+(3)+(5) 3. ESIprice: (1)+(2)+(3) & ESIvolume: (7) 4. Supply/Demand Index: all 5. Willingness to Pay Function for SoS: (1)+(6)+(9) 6. Oil Vulnerability Index: (1)+(2)+(3)+(4)+(5)+(6)+(8)+(9) 7. Risky External Energy Supply: (1)+(3)+(7)+(9)+(10) 8. Socioeconomic Energy Risk Index: all Energy system risk factors Energy sources diversification (1) Energy resources (4) Energy intensity (6) Energy dependence (9) Political stability (3) Energy transport (7) Energy suppliers diversification (2) Market liquidity (5) GDP (8) Energy sources fungibility (10) 7 7
8 3. REACCESS project & UNED s role 1. Risk of Energy Availability: Common Corridors for Europe Supply Security ( 2. Funded by 7th Framework Programme of the EC (4.09 million ) 3. Partners: 11 EU + 3 extra-eu (Norway, Russia & Kazak.) 4. Objective: to analyze the European energy corridors with a partial equilibrium techno-economic model (TIMES) which minimizes the total cost of the energy system taking into account technical, environmental and socio-economic risks. 5. Goal: To search for the most efficient cost/risk combination. 6. UNED Research group on "International political economy - Energy" ( Leader of the WP4. To analyze the socio-economic risks and reliability of European energy supply to provide inputs for the stochastic modelling. 8 8


9 4. Energy risk assessment process 1. Nr. Countries: Nr. Collected data: 1,026, Nr. identified variables: 839 Key variables defined: st level categories: nd level categories: Main risk factors: 4 Economic factor Energy factor Political factor Social factor 9 9
10 4.1. Risk assessment: Dimensions of energy security risk 1. Economic-driven risk: a country s energy risk derived from its economic characteristics, including its energy trade patterns (ie. energy intensity, income from energy, ) 2. Intrinsic energy risk: energy risk emerging from a given energy resource base and energy imports concentration (ie. reserves-to-production ratios, HHI, ) 3. Political-institutional risk: energy risk derived from institutional and political factors that may imply both internal and/or external political frictions (ie. institutional quality, political stability, prevalence of the rule of law ) 4. Social risk: risk emerging from social factors that usually imply internal turmoil (ie. social equity, social & labour conflict ) 10 10
11 Risk assessment: Economic factor Economic factors A.1 Energy internal consumption of exporting countries A.4 Size of energy revenues A.1.1 Economic growth A.4.1 % of GDP A.1.2 Population growth A.4.2 % of goverment budget A.1.3 Industrial Gross Value Added A.4.3 % of exports A.1.4 Energy intensity A.4.4 % of trade balance A.1.5 Energy intensity per capita A.5 Trade relation with EU A.1.6 Fiscality to internal energy consumption A.5.1 Trade agreements A.2 Energy internal consumption of importing countries A.5.2 EU share of trade balance A.2.1 Economic growth A.5.3 Trade volume with EU A.2.2 Population growth A.5.4 Trade intensity with EU A.2.3 Energy intensity A.6 Investment A.2.4 Energy intensity per capita A.6.1 Foreign Direct Investment of the EU abroad A.2.5 Energy dependence and vulnerability A.6.2 Foreign Direct Investment in the EU A.2.6 Relative energy taxation A.6.3 Sovereign wealth funds A.2.7 Real relative energy prices A.3 Competition between major importers A.3.1 Political affinity A.3.2 Relative trade balance A.3.3 Foreign Direct Investment A.3.4 Relative index of geographical energy imports dependence 11 11
12 Risk assessment: Intrinsic energy factor Energy factors B.1 Dependence & vulnerability B.1.1 Energy dependence B.1.2 Energy vulnerability B.2 Energy reserves of producing countries B.2.1 Proved reserves B.2.2 Undiscovered reserves B.2.3 Known oil B.2.4 Reserves/production ratio B.2.5 Reserves reliability B.3 Emergency stocks in importing countries B.2.1 Days forward demand covered by OECD stocks B.2.2 Total stocks on lands in OECD countries 12 12
13 Risk assessment: Political-institutional factor Political factors C.1 EU external relations C.6 Democracy index C.1.1 Political affinity C.6.1 Political regime C.1.2 EU delegations C.6.2 Democracy indicators C.1.3 Official Development Aid C.7 Institutional quality C.1.4 Inmigration to the EU C.7.1 Gobernance C.1.5 Agreements with the EU C7.2 Membership in International C.2 Country risk assessment C.8 Political violence C.2.1 Country risk rating C.8.1 Risk of international conflicts C.2.2 Public debt rating C.8.2 Risk of internal conflicts C.2.3 General economic risk C.8.3 Risk of coup d'etat C.3 OPEC membership C.8.4 Terrorism C.3.1 OPEC countries C.9 Rule of law C.4 Ownership of Energy Companies C.9.1 Corruption C.4.1 Countries with NOC s C.9.2 Ease of doing business C.4.2 Countries with IOC s operations C.5 Energy reputation C.5.1 Use of energy as a weapon C.5.2 Participation in multilateral energy agreements 13 13
14 Risk assessment: Social factor Social factors D.1 Cultural proximity D.1.1 Common language D.1.2 Common values D.2 Social equity D.2.1 Social inequity D.2.2 Migrations D.2.3 Unemployment D.2.4 Human Development D.2.5 Poverty D.2.6 Per Capita Income D.2.7 Per Capita Income (Power purchasing parity) D.3 Social conflicts D.3.1 Crime D.3.2 Ethnic fractionalization D.3.3 Religious fractionalization D.4 Laboral conflicts D.4.1 Strikes D.4.2 Absenteeism 14 14
15 4.2. Risk assessment: Computation of the overall risk FINAL RESULT: FACTOR SCORES COMPUTATION SOCIAL RISK Factor Score ENERGY RISK Factor Score POLITICAL RISK Factor Score ECONOMIC RISK Factor Score SOCIAL RISK Index ENERGY RISK Index POLITICAL RISK Index ECONOMIC RISK Index OVERALL RISK INDEX 15 15
16 5. Socioeconomic Energy Risk Index scores Ranking Country Scores 1 Norway United States Denmark Burundi Sudan Afghanistan 79.4 Socioeconomic Energy Risk Index 16 16
17 5.1. Socioeconomic Energy Risk Index scores in the EU Socioeconomic Energy Risk Index EU-25 Average Denmark United Kingdom Netherlands Germany Italy Sweden Austria France Poland Romania Finland Spain Czech Republic Hungary Belgium Ireland Luxembourg Portugal Slovenia Slovakia Greece Bulgaria Estonia Lithuania Latvia EU
18 5.2. Socioeconomic Energy Risk Index in the EU-25: rankings by factors Economic risk Energy risk Political risk Social risk United Kingdom 8.1 United Kingdom 17.7 Denmark 0.0 Luxembourg 4.1 Netherlands 12.1 Romania 18.1 Finland 0.8 Netherlands 4.8 Germany 13.5 Denmark 22.1 Sweden 1.1 Sweden 6.6 Hungary 13.6 Italy 33.7 Luxembourg 3.4 Germany 7.4 Italy 14.1 Germany 38.2 Ireland 5.5 Belgium 7.6 Denmark 14.6 Poland 38.8 Netherlands 6.0 Denmark 7.6 Finland 16.1 Netherlands 39.1 Austria 6.8 Finland 7.8 Belgium 16.2 Czech Republic 58.7 United Kingdom 9.7 Ireland 9.2 Slovakia 16.7 Bulgaria 60.5 Germany 9.9 United Kingdom 10.3 Poland 16.7 Spain 60.9 Belgium 10.5 France 10.9 Portugal 16.8 Hungary 61.1 Slovenia 15.8 Austria 11.5 France 17.3 Greece 64.7 France 16.9 Spain 13.1 Czech Republic 17.8 France 66.8 Portugal 17.5 Portugal 15.1 Austria 18.1 Austria 71.7 Spain 19.0 Italy 18.5 Sweden 18.4 Slovakia 77.1 Estonia 21.2 Slovenia 18.7 Latvia 19.7 Sweden 78.3 Czech Republic 22.4 Hungary 20.9 Slovenia 19.7 Slovenia 80.5 Slovakia 22.6 Czech Republic 21.0 Greece 21.0 Ireland 82.8 Italy 23.8 Slovakia 22.2 Lithuania 21.1 Estonia 83.8 Lithuania 23.8 Estonia 25.0 Estonia 22.6 Portugal 84.2 Hungary 24.7 Lithuania 26.6 Romania 22.7 Latvia 88.2 Latvia 25.3 Greece 27.2 Bulgaria 22.9 Belgium 89.0 Greece 27.7 Poland 27.5 Luxembourg 23.3 Finland 89.9 Poland 29.1 Latvia 30.6 Spain 23.4 Lithuania 91.8 Bulgaria 35.4 Bulgaria 33.2 Ireland 28.7 Luxembourg 98.3 Romania 37.7 Romania 36.1 EU EU EU EU
19 5.3. Socioeconomic Energy Risk Index in the EU-25: risk scores breakdown Socioeconomic Energy Risk Index scores 100% Breakdown of the risk scores 80% 60% 40% 20% 0% Denmark United Kingdom Netherlands Germany Italy Sweden Austria France Poland Romania Finland Spain Czech Republic Hungary Belgium Ireland Economic risk Energy risk Political risk Social risk Luxembourg Portugal Slovenia Slovakia Greece Bulgaria Estonia Lithuania Latvia 19 19
20 6. REACCESS energy risk assessment 1. The Socioeconomic Energy Risk has been addressed on a country basis, but risks is also allocated: At corridor level By type of fuel 2. Each corridor is divided in the same number of segments than the number of countries crossed & the chokepoints in transit. 3. A risk value is assigned to each segment of the corridor. 4. The index allows the construction of a risk index for the whole corridor. 5. Chokepoints risk assessment: Chokepoints inside a country >> bear the risk of the country Chokepoints between various countries >> assign a risk index equal to the average of the indexes of the countries which border them 20 20
21 7. Alternatives for socioeconomic risk aggregation a) The highest r se (n) value of the corridor countries and chokepoints is used as R(c) b) The average of the r se (n) values of the corridor countries and chokepoints is used as R(c) R = a ( c) Max rse( n) R( c) b = n r se( n) n c) A modified value of the r se (n) average is used as R(c), bearing the highest value in mind R( c) c = R( c) a + R( c) 2 b d) The sum of the r se (n) values of the countries and chokepoints forming the corridor is used as R(c) d R ( c) rse( n) = n 21 21

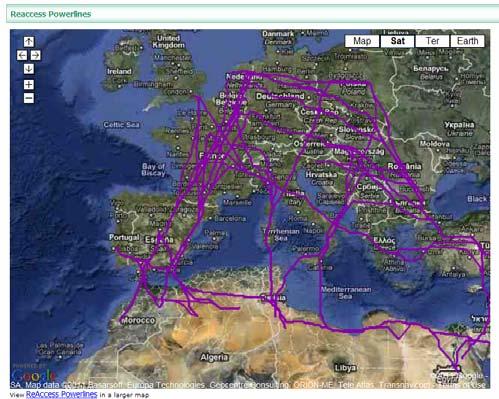
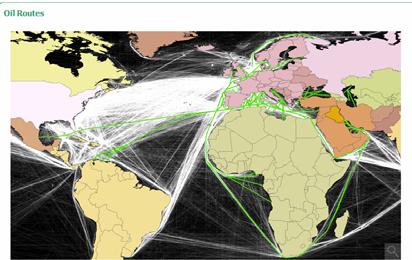
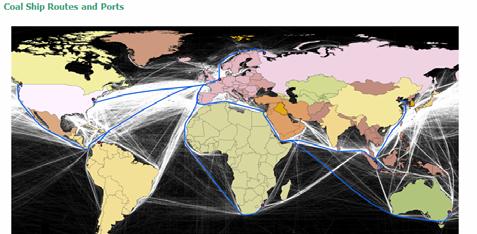
22 8. Energy corridors description 22 22
23 9. Final remarks 1. Further development in the energy security field is needed. 2. There are some difficulties in measuring the socioeconomic energy risk. 3. The quantification of the socioeconomic energy risk is not a probability. 4. There is no obvious best way to aggregate the risks by corridor. 5. Technical risks have been estimated and aggregated separately. 6. Modelling scenarios with a horizon 2050 have been considered. 7. Currently: Waiting for the models outputs. Final meeting: March The results will be presented as the search for the most efficient cost/risk combination and published by the EC. 9. Conclusions for the EU-25: One of the most secure regions in the world for the energy supply. The riskiest countries in the EU-25 are the eastern ones. The most secure EU members are in the north and the centre. Energy-intrinsic factor involves the highest risk values and disparity
24 Thank you for your attention Comments and suggestions: 24 24
CAP CONTEXT INDICATORS
 CAP CONTEXT INDICATORS 2014-2020 24. AGRICULTURAL TRAINING OF FARM MANAGERS 2017 update CONTEXT INDICATOR 24: AGRICULTURAL TRAINING OF FARM MANAGERS Learning by doing is still the main form of for the
Emissions Trading System (ETS): The UK needs to deliver its share of the total EU ETS emissions reduction of 21% by 2020, compared to 2005;
: The UK needs to deliver its share of the total EU ETS emissions reduction of 21% by 2020, compared to 2005;") Emissions Trading System (ETS): The UK needs to deliver its share of the total EU ETS emissions reduction of 21% by 2020, compared to 2005; Non-ETS emissions: The Effort Sharing Decision sets a target
Emissions Trading System (ETS): The UK needs to deliver its share of the total EU ETS emissions reduction of 21% by 2020, compared to 2005; Non-ETS emissions: The Effort Sharing Decision sets a target
ENERGY PRIORITIES FOR EUROPE
 ENERGY PRIORITIES FOR EUROPE Presentation of J.M. Barroso, President of the European Commission, to the European Council of 4 February 2011 Contents 1 I. Why energy policy matters II. Why we need to act
Energy demand dynamics and infrastructure development plans in the EU. October 10 th, 2012 Jonas Akelis, Managing Partner - Baltics
 Energy demand dynamics and infrastructure development plans in the EU October 10 th, 2012 Jonas Akelis, Managing Partner - Baltics Forecasted energy demand dynamics of EU-11 will be significantly higher
.eu brand awareness. Domain names have a high awareness. About 81% of the European Internet population has heard of domain names.
 .eu brand awareness Domain names have a high awareness. About 81% of the European Internet population has heard of domain names. More than half of the European Internet population knows of the existence
Over the whole year 2011, GDP increased by 1.4% in the euro area and by 1.5% in the EU27, compared with +1.9% and +2.0% respectively in 2010.
 35/2012-6 March 2012 Second estimates for the fourth quarter of Euro area and EU27 down by 0.3% +0.7% and +0.9% respectively compared with the fourth quarter of 2010 decreased by 0.3% in both the euro
Eurostat current work on resource-efficient circular economy Renato Marra Campanale
 Eurostat current work on resource-efficient circular economy Renato Marra Campanale Renato.Marra-Campanale@ec.europa.eu Eurostat Unit E2 'Environmental statistics and accounts; sustainable development'
The need for better statistics for climate change policies
 The need for better statistics for climate change policies Jacqueline McGlade Greenhouse gas emission data: more timely and more spatial data needed EEA annual report on GHG trends and projections in Europe
FRAMEWORK CONVENTION ON CLIMATE CHANGE - Secretariat CONVENTION - CADRE SUR LES CHANGEMENTS CLIMATIQUES - Secrétariat KEY GHG DATA
 UNITED NATIONS NATIONS UNIES FRAMEWORK CONVENTION ON CLIMATE CHANGE - Secretariat CONVENTION - CADRE SUR LES CHANGEMENTS CLIMATIQUES - Secrétariat KEY GHG DATA Greenhouse Gas Emissions Data for 1990 2003
EU Climate and Energy Policy Framework: EU Renewable Energy Policies
 EU Climate and Energy Policy Framework: EU Renewable Energy Policies Buenos Aires 26-27 May 2015 Dr Stefan Agne European Commission DG Climate Action Energy 1 EU Climate and Energy Policy Framework 2 Agreed
How effective will the EU s largest post-2020 climate tool be?
 Understanding the Climate Action Regulation How effective will the EU s largest post-2020 climate tool be? Carbon Market Watch Policy Brief, April 2018 Introduction The Climate Action Regulation (CAR),
10. Demand (light road freight veh shares)
") . Demand (light road freight veh shares) Overview Target The view is intended to calculate the share of light vehicles in total road freight vehicles. The light road freight vehicles are those belonging
. Demand (light road freight veh shares) Overview Target The view is intended to calculate the share of light vehicles in total road freight vehicles. The light road freight vehicles are those belonging
CROATIA. Risk Assessment Exercise
 CROATIA Risk Assessment Exercise JRC Institute for Energy Enlargement and Integration Workshop, 5-7 October 211 Hotel Valamar Lacroma, Dubrovnik, Croatia Robert Bošnjak, Energy Institute Hrvoje Požar BASIC
3. Future wood demand for energy
 UNECE/FAO Workshop on wood resource balances Part II: Future wood resource availability and demands presented by Sebastian Hetsch University of Hamburg Centre of Wood Science Udo Mantau Florian Steierer
Wind energy in Europe markets
 Wind energy in Europe markets Turkish Wind Energy Congress (TWEC 2012), 7 November 2012, Istanbul Christian Kjaer CEO European Wind Energy Association (EWEA) More than 600 members from almost 60 countries
Sea freight data indicate weak import demand both in US and EU27. Data on inland road and rail freight indicate weak domestic activity
 Statistics Brief Global Trade and Transport July 2013 Global Freight Volumes Indicate Increasing Dependency on -led Growth The latest update of global freight data collected by the International Transport
ODYSSEE-MURE, a decision support tool for energy efficiency policy evaluation. Recent energy efficiency trends in the EU
 ODYSSEE-MURE, a decision support tool for energy efficiency policy evaluation Recent energy efficiency trends in the EU Didier Bosseboeuf, ADEME, project coordinator Bruno Lapillonne, Karine Pollier; Enerdata
Photo: Thinkstock. Wind in power 2010 European statistics. February The European Wind energy association
 Photo: Thinkstock Wind in power 21 European statistics February 211 1 WIND IN POWER: 21 EUROPEAN STATISTICS Contents Executive summary 21 annual installations Wind map 21 Wind power capacity installations
Joint owner of the research company Profu Research leader of the waste management group at Chalmers University of Technology , Ph.D
 Joint owner of the research company Profu Research leader of the waste management group at Chalmers University of Technology 1993-2005, Ph.D. 1993. Profu Profu was established 1987 and has since then been
AMBITION OF RENEWABLE ENERGY TARGETS FOR THE EU IN 2030
 AMBITION OF RENEWABLE ENERGY TARGETS FOR THE EU IN CONCLUSIONS FROM THE REPORT BENCHMARKS FOR A MORE AMBITIOUS EU RENEWABLES TARGET COMMISSIONED BY EREF CORINNA KLESSMANN 17 OCTOBER 2017 1 / ECOFYS, A
International Indexes of Consumer Prices,
 International Indexes of Consumer Prices, July International Labor Comparisons Table of Contents Highlights... 1 Monthly Charts.. Monthly Tables... Annual Charts..... 5 Annual Tables.. 7 Technical Notes..
Pre-Commercial Procurement (PCP)
") Pre-Commercial Procurement (PCP) Lieve Bos DG CONNECT F2 unit ( Innovation ) 1 Rationale Health care Climate Change Energy Efficiency Transport Security Public sector is faced with important societal challenges.
Pre-Commercial Procurement (PCP) Lieve Bos DG CONNECT F2 unit ( Innovation ) 1 Rationale Health care Climate Change Energy Efficiency Transport Security Public sector is faced with important societal challenges.
The Innovation Union Scoreboard: Monitoring the innovation performance of the 27 EU Member States
 MEMO/12/74 Brussels, 7 February 2012 The Innovation Union Scoreboard: Monitoring the innovation performance of the 27 EU Member States This MEMO provides an overview of the research and innovation performance
CAP CONTEXT INDICATORS
 CAP CONTEXT INDICATORS 2014-2020 44. ENERGY USE IN AGRICULTURE, FORESTRY AND THE FOOD INDUSTRY 2017 update BE BG CZ DK DE EE IE EL ES FR HR IT CY LV LT LU HU MT NL AT PL PT RO SI SK FI SE UK CONTEXT INDICATOR
PRICE SETTING IN THE ELECTRICITY MARKETS WITHIN THE EU SINGLE MARKET
 PRICE SETTING IN THE ELECTRICITY MARKETS WITHIN THE EU SINGLE MARKET A report to the Committee on Industry, Research and Energy of the European Parliament February, 2006 Outline Characteristics of the
Graph showing current EU member states and candidate countries population and GDP per capita.
 Annex 1 Graph showing current EU member states and candidate countries population and GDP per capita. Source: Kaihsu Tai, University of Oxford (2004). (Country abbreviations are shown in the list of abbreviations
Figures of Catalonia Generalitat de Catalunya Government of Catalonia
 www.idescat.cat Figures of Generalitat de Catalunya Government of POPULATION POPULATION STRUCTURE 5-9 % 0-4 % 5 4 3 2 1 0 0 1 2 3 4 5 Population (1 000) (1) 7 434 46 508 507 417 men 49.1 49.3 48.8 women
UTILITIES: HOW THE EU DIRECTIVE IS IMPLEMENTED AND HOW IT WORKS IN EU MEMBER STATES
 A joint initiative of the OECD and the European Union, principally financed by the EU VIth IPA REGIONAL PUBLIC PROCUREMENT CONFERENCE UTILITIES: HOW THE EU DIRECTIVE IS IMPLEMENTED AND HOW IT WORKS IN
Eurofound Social monitoring and reporting activities
 Eurofound Social monitoring and reporting activities Tadas Leoncikas, Research manager, Living conditions and quality of life unit 8 th conference on Social Monitoring and Reporting in Europe e-frame workshop
Options for structural measures in the EU ETS
 CEPS Carbon Market Forum 23 April 2013, Brussels Options for structural measures in the EU ETS Stefan P. Schleicher Wegener Center for Climate and Global Change University of Graz A B B C C D E F F G G
Correlations between energy economy and housing market prices in the EU-impacts on future sustainability
 Correlations between energy economy and housing market prices in the EU-impacts on future sustainability Maria Alexandra MAASSEN The Bucharest University of Economic Studies, Bucharest, Romania maria.nichifor@fabiz.ase.ro
EVALUATING SLOVAKIA S COMPETITIVENESS IN THE EU
 2 EVALUATING SLOVAKIA S COMPETITIVENESS IN THE EU Ing. Tibor Lalinský, National Bank of Slovakia At present a range of approaches are available to us in evaluating a country s competitiveness. In order
The European Approach to Decrease Energy Consumption in Buildings Towards ZEB (Zero Energy Buildings)
") The European Approach to Decrease Energy Consumption in Buildings Towards ZEB (Zero Energy Buildings) Professor Bjarne W. Olesen, Ph.d., Dr.h.c., R. Centre for Indoor Environment and Energy Technical University
The European Approach to Decrease Energy Consumption in Buildings Towards ZEB (Zero Energy Buildings) Professor Bjarne W. Olesen, Ph.d., Dr.h.c., R. Centre for Indoor Environment and Energy Technical University
EUROPEAN COUNCIL Brussels, 31 May 2013 (OR. en)
") EUROPEAN COUNCIL Brussels, 31 May 2013 (OR. en) Interinstitutional File: 2013/0900 (NLE) EUCO 110/13 INST 234 POLG 69 OC 295 LEGAL ACTS Subject: DRAFT EUROPEAN COUNCIL DECISION establishing the composition
EUROPEAN COUNCIL Brussels, 31 May 2013 (OR. en) Interinstitutional File: 2013/0900 (NLE) EUCO 110/13 INST 234 POLG 69 OC 295 LEGAL ACTS Subject: DRAFT EUROPEAN COUNCIL DECISION establishing the composition
To what extent will climate and land use change affect EU-28 agriculture? A computable general equilibrium analysis
 To what extent will climate and land use change affect EU-28 agriculture? A computable general equilibrium analysis Martina Sartori Ca Foscari University, Venice Joint study with Davide Geneletti, Stefano
(c) The terms of the agreement are set out in the Annex to this Note Verbale.
 The terms of the agreement are set out in the Annex to this Note Verbale.") Note Verbale No EDD/2018/001 Her Britannic Majesty's Foreign and Commonwealth Office presents its compliments to the Secretariat of the United Nations Framework Convention on Climate Change and has the
Note Verbale No EDD/2018/001 Her Britannic Majesty's Foreign and Commonwealth Office presents its compliments to the Secretariat of the United Nations Framework Convention on Climate Change and has the
High-Level Public Administration Conference For a Business-Friendly Public Administration Brussels, 29 October 2013
 European Institute of Public Administration - Institut européen d administration publique High-Level Public Administration Conference For a Business-Friendly Public Administration Brussels, 29 October
to ensure that the public is properly informed about the state of the environment.
 Contribution ID: 3d857566-b12a-41a3-b91d-7d9a03167ba4 Date: 20/10/2017 16:24:00 Public consultation to support the evaluation of the European Environment Agency (EEA) and its European Environment Information
Council of the European Union Brussels, 10 November 2016 (OR. en)
") Conseil UE Council of the European Union Brussels, 10 November 2016 (OR. en) Interinstitutional File: 2016/0186 (COD) 13660/16 LIMITE NOTE CULT 101 AELE 77 EEE 41 CODEC 1506 From: Permanent Representatives
Conseil UE Council of the European Union Brussels, 10 November 2016 (OR. en) Interinstitutional File: 2016/0186 (COD) 13660/16 LIMITE NOTE CULT 101 AELE 77 EEE 41 CODEC 1506 From: Permanent Representatives
Approaches towards a framework and a long-term target of the post-kyoto period. Christian Egenhofer
 ERSI International Collaboration projects 2009 International Forum Approaches towards a framework and a long-term target of the post-kyoto period Christian Egenhofer Senior Fellow, Centre for European
Phasing out nuclear power in Europe Rolf Golombek, Finn Roar Aune and Hilde Hallre Le Tissier 39th IAEE International Conference Bergen, June 2016
 Oslo Centre of Research on Environmentally friendly Energy Phasing out nuclear power in Europe Rolf Golombek, Finn Roar Aune and Hilde Hallre Le Tissier 39th IAEE International Conference Bergen, June
Cross border interconnections and inter-european cooperation. Cross border interconnections and inter- European cooperation
 Cross border interconnections and inter- European cooperation Disclaimer The information on which this presentation is based derives from our own experience, knowledge, data and research. The opinions
International trade related air freight volumes move back above the precrisis level of June 2008 both in the EU area and in the Unites States;
 Statistics Brief Global Trade and Transport October 2017 Air freight volumes increase since the second quarter of 2016 The latest update of global freight data collected by the International Transport
Environmental statistics in Europe Facts and figures on the environment: from environmental taxes to water resources
 STAT/10/189 10 December 2010 Environmental statistics in Europe Facts and figures on the environment: from environmental taxes to water resources What share of fresh water resources is being abstracted
The EU ETS: Over-allocation or Abatement?
 The EU ETS: Over-allocation or Abatement? A. Denny Ellerman & Barbara Buchner MIT and IEA Workshop on the Evaluation of the EU ETS, 19-20 April 2007, Paris Caisse des Dépôts OECD/IEA 2007 Some background
Flash Eurobarometer 426. SMEs, Resource Efficiency and Green Markets
 SMEs, Resource Efficiency and Green Markets Fieldwork Publication December 2015 Survey requested by the European Commission, Directorate-General for Internal Market, Industry, Entrepreneurship and SMEs
Performance of Rural Development Programmes of the period - Your Voice
 Performance of Rural Development Programmes of the 2007-2013 period - Your Voice Fields marked with * are mandatory. Introduction The Commission will use the information gathered through this survey together
Stakeholder consultation on the mid-term review of the 2011 White Paper on transport
 1 von 11 01.06.2015 14:57 Case Id: 25d75e1b-6c50-4ec3-a704-189176957ecf Stakeholder consultation on the mid-term review of the 2011 White Paper on transport Fields marked with are mandatory. Please provide
ESF Ex-Post evaluation
 ESF 2007-2013 Ex-Post evaluation Fields marked with * are mandatory. Open public consultation Questionnaire Please consult the background document as it provides useful information on the European Social
3 rd ACER Gas Target Model Workshop. 3 rd ACER TITRE GTM workshop, Brussels, 15 May 2014
 3 rd ACER Gas Target Model Workshop 3 rd ACER TITRE GTM workshop, Brussels, 15 May 2014 1 3. Functioning wholesale gas markets Objective and criteria Walter Boltz ACER BoR Vice-Chair and ACER Gas Working
Relating to the transnational hiring-out of workers in the framework of the provision of services
 FORM FOR USE (OPTIONAL) BY THE REQUESTING ADMINISTRATION I. REQUEST FOR INFORMATION Relating to the transnational hiring-out of workers in the framework of the provision of services Pursuant to Article
Data, tables, statistics and maps ENERGY IN DENMARK
 Data, tables, statistics and maps ENERGY IN DENMARK 215 1 1 GENERAL INFORMATION ON DENMARK Energy in Denmark, 215 Contents General information on Denmark 3 Energy production 4 Imports and exports of energy
Even implementation of the EU Timber Regulation Harmonizing and improving the implementation of the EUTR in the EUTR countries
 Even implementation of the EU Timber Regulation Harmonizing and improving the implementation of the EUTR in the EUTR countries Thünen Institute, 09 October 2018, Hamburg EUTR EU MS obligations for application
Session 13: Prequalification Within the Context of Global Fund Procurements
 Session 13: Prequalification Within the Context of Global Fund Procurements Established in 2002 Global Fund Attracts and disburses additional resources to prevent and treat AIDS, tuberculosis (TB), and
Crop production - Coarse grains
 PART 1 Crop production - Coarse grains Coarse grains are cereal grains other than wheat and rice that include maize (corn in the United States), barley, sorghum, rye, and oats. The global demand for these
Data, tables, statistics and maps ENERGY IN DENMARK
 Data, tables, statistics and maps ENERGY IN DENMARK 216 Energy in Denmark, 216 Contents General information on Denmark 3 Energy production 4 Imports and exports of energy 8 Electricity and heat 9 Danish
Trends in waste generation and management in Europe. Özgür Saki European Environment Agency
 Trends in waste generation and management in Europe Özgür Saki European Environment Agency The European Environment Agency An EU institution situated in Copenhagen since 1994 Provides the information necessary
Photo: Karpov. Wind in power 2009 European statistics. February 2010 THE EUROPEAN WIND ENERGY ASSOCIATION
 Photo: Karpov Wind in power 29 European statistics February 21 1 WIND IN POWER: 29 EUROPEAN STATISTICS Contents Executive summary 29 annual installations Wind map 29 Wind installations 29 Power capacity
CAP CONTEXT INDICATORS
 CAP CONTEXT INDICATORS 2014-2020 40. WATER QUALITY 2017 update CONTEXT INDICATOR 40: WATER QUALITY Water quality is assessed through the Gross Nutrient Balance and nitrates in freshwater The nitrogen surplus
How to secure Europe s competitiveness in terms of energy and raw materials? The answer, my friend, is blowing in the wind
 How to secure Europe s competitiveness in terms of energy and raw materials? The answer, my friend, is blowing in the wind Iván Pineda Head of Policy Analysis, EWEA PolyTalk 2014, Brussels Around 600 members
REVIEW OF ECONOMIC GROWTH FACTORS OF RURAL AREAS IN THE EUROPEAN UNION
 244 REVIEW OF ECONOMIC GROWTH FACTORS OF RURAL AREAS IN THE EUROPEAN UNION Mirela Adriana Rusali PhD, Scientific Researcher II, Institute of Agricultural Economics The Romanian Academy Abstract: Growth
Mechanisms of good governance for sustainable development. Dr. Kristiina Tõnnisson
 Mechanisms of good governance for sustainable development Dr. Kristiina Tõnnisson 05.04.2014 Three doctrines in Public Administra4on Governing Serving Managing 4/6/14 2 Two approaches to ethics management
Can this industry still be saved? Paul Overdijk Director Strategy Royal TNT Post WIK Conference November 2008
 Can this industry still be saved? Paul Overdijk Director Strategy Royal TNT Post WIK Conference 24-26 November 2008 The postal industry in transformation market Mail market volumes declining at gradually
Sectoral Profile - Industry
 Sectoral Profile - Industry Energy consumption Energy consumption trends in EU There is a regular decrease in energy consumption since 2003, although there was growth in industrial activity from 2003 to
EUROPE S ENERGY PORTAL
 EUROPE S ENERGY PORTAL METHODOLOGY GAS & ELECTRICTY PRICES Collect Analyze Report EUROPEAN UNION END-USERS Description of the process leading to the determination of end-user prices for natural gas and
Gas Target Model. Electricity and Gas Interactions Workshop. Keelin O Brien 3 rd July 2014
 Gas Target Model Electricity and Gas Interactions Workshop Keelin O Brien 3 rd July 2014 Madrid Forum Observations Review of work on revision of GTM noted Welcomed considerations of closer coordination
Trends and drivers in greenhouse gas emissions in the EU in 2016
 EU greenhouse gas inventory Trends and drivers in greenhouse gas emissions in the EU in 2016 Official data for 2016 confirm the longterm reduction in greenhouse gas emissions across Europe. This briefing
European Energy Security Challenges The Transatlantic Dimension Laurentiu Pachiu Energy Policy Group
 European Energy Security Challenges The Transatlantic Dimension Laurentiu Pachiu Energy Policy Group Hudson Institute Washington DC May 18, 2017 Despite Climate Change Policies, Oil & Gas will still have
Context The Purpose of Labour Laws. Professor Peter Turnbull Cardiff University, UK
 Context The Purpose of Labour Laws Professor Peter Turnbull Cardiff University, UK Key Features of European Industrial Relations High degree of interest representation Legal intervention on behalf of the
12. Waste and material flows
 1 Environmental signals 22 12. Waste and material flows policy issue indicator assessment decoupling resource use from economic activity decoupling waste generation from economic activity reducing generation
Potential Sustainable Wood Supply in Europe
 by Sebastian Hetsch UNECE/FAO Timber Section Potential Sustainable Wood Supply in Europe Policy Dialogue on Potential Sustainable Wood Supply in Europe 22 October 2008 Rome Content 1. Background 2. Methodology
The new Energy Policy. Jean-Arnold Vinois Head of Unit Energy Policy and Security of Supply Directorate General for Energy and Transport
 The new Energy Policy Jean-Arnold Vinois Head of Unit Energy Policy and Security of Supply Directorate General for Energy and Transport 1 The 3 challenges Sustainable Development Competitiveness FULLY
Vulnerable Customers CEER Status Review of Customer and Retail Market Provisions from the 3rd Package as of 1 January 2012
 Vulnerable Customers CEER Status Review of Customer and Retail Market Provisions from the 3rd Package as of 1 January 2012 Sarin Abado (CEER) EC Working Group on Vulnerable Customers October 2012 Outline
Table 1. Labour productivity indicators * EU EU ,1 106,0 105,
 LABOUR PRODUCTIVITY DISPARITIES IN THE EUROPEAN UNION Goschin Zizi Academy of Economic Studies, 15-17 Calea Dorobantilor, Bucharest, Phone: 0765505869, E-mail: zizigoschin@yahoo.com Danciu Aniela Academy
Quality of life indicators - natural and living environment
 Quality of life indicators - natural and living environment Statistics Explained Data from January 2018. Most recent data: Further Eurostat information, Main tables and Database. Planned update: January
The Fourth Community Innovation Survey (CIS IV)
") The Fourth Community Innovation Survey (CIS IV) THE HARMONISED SURVEY QUESTIONNAIRE The Fourth Community Innovation Survey (Final Version: October 20 2004) This survey collects information about product
The Fourth Community Innovation Survey (CIS IV) THE HARMONISED SURVEY QUESTIONNAIRE The Fourth Community Innovation Survey (Final Version: October 20 2004) This survey collects information about product
Wholesale market functioning: GTM1 criteria. 2 nd ACER Workshop on Gas Target Model review and update 19 March 2014
 Wholesale market functioning: GTM1 criteria 2 nd ACER Workshop on Gas Target Model review and update 19 March 2014 Agenda GTM1 criteria Results on member state level Discussion 2 GTM1 criteria Results
From Tradition to Innovation. Skill Needs in the Agri-Food Sector Skillsnet conference February 21-22, 2008 Cedefop, Thessaloniki, Greece
 From Tradition to Innovation. Skill Needs in the Agri-Food Sector Skillsnet conference February 21-22, 2008 Cedefop, Thessaloniki, Greece Prof. dr. Martin Mulder Head chair group of Education and Competence
energy in figures Energy
 EU energy in figures Statistical pocketbook 2015 Energy This publication does not involve the European Commission in liability of any kind. Europe Direct is a service to help you find answers to your questions
Wind energy and Climate policy Fixing the Emission Trading System
 Wind energy and Climate policy Fixing the Emission Trading System Rémi Gruet Senior Advisor - Climate Change & Environment European Wind Energy Association 1st February 2012 EWEA Members Across entire
The Ethics dimension of PA Civil Servants
 The Ethics dimension of PA Civil Servants Civil servants mobility in Europe The PATENT Project Public Administration Training European Network for the Harmonisation ation of Training Approach Leszek Mellibruda,
4 Strategic Directions for Czech Economic Policy
 4 Strategic Directions for Czech Economic Policy Executive Summary The objective of this document is to start a discussion of how the Czech Republic can set a strategy (allocate its current economic and
ECC-Net statistics 1 regarding e-commerce
 ECC-Net statistics 1 regarding e-commerce 2012-2013 The European Consumer Centre Network The European Consumer Centre Network (ECC-Net) consists of 30 centres based in each EU Member State, Norway and
Annex D consumer survey Assessment B: Study on the application of rules on mandatory origin labelling of meat ingredients (MCOOL)
") European Commission Directorate General for Health and Consumers Study on the application of rules on voluntary origin labelling of foods and on the mandatory indication of country of origin or place of
European Commission Directorate General for Health and Consumers Study on the application of rules on voluntary origin labelling of foods and on the mandatory indication of country of origin or place of
Public consultation on enhanced cooperation between Public Employment Services (PES)
") Public consultation on enhanced cooperation between Public Employment Services (PES) Fields marked with * are mandatory. Introduction The European Network of Public Employment Services (PES Network) was
Public consultation on enhanced cooperation between Public Employment Services (PES) Fields marked with * are mandatory. Introduction The European Network of Public Employment Services (PES Network) was
Antitrust: Car price report shows price differentials for new cars in EU narrowing in 2010
 EUROPEAN COMMISSION - PRESS RELEASE Antitrust: Car price report shows price differentials for new cars in EU narrowing in 2010 Brussels, 26 July 2011 - The European Commission s latest car price report
FORECASTING LABOUR PRODUCTIVITY IN THE EUROPEAN UNION MEMBER STATES: IS LABOUR PRODUCTIVITY CHANGING AS EXPECTED?
 Interdisciplinary Description of Complex Systems 16(3-B), 504-523, 2018 FORECASTING LABOUR PRODUCTIVITY IN THE EUROPEAN UNION MEMBER STATES: IS LABOUR PRODUCTIVITY CHANGING AS EXPECTED? Berislav Žmuk*,
Energy policy choices of Poland. Marek Wąsiński The Polish Institute of International Affairs Paris, 27 September 2016
 Energy policy choices of Poland Marek Wąsiński The Polish Institute of International Affairs Paris, 27 September 2016 Main Principles of Polish Energy Policy Energy independence Stable and price-efficient
PPI Training. MODULE 2 The need to innovate in municipal waste management. PPI training Location of the training Date of the training.
 PPI Training MODULE 2 The need to innovate in municipal waste management PPI training Location of the training Date of the training Contents Status quo Waste management in Europe Drivers for innovation
Wassenaar Arrangement. What is it all about? India s entry: What it means for us? What critics have to say?
 Wassenaar Arrangement What is it all about? India s entry: What it means for us? What critics have to say? Roots Cold War-era Coordinating Committee for Multilateral Export Controls (COCOM) COCOM existed
The European Commission s strategy on Corporate Social Responsibility (CSR) : achievements, shortcomings and future challenges
 : achievements, shortcomings and future challenges") The European Commission s strategy on Corporate Social Responsibility (CSR) 2011-2014: achievements, shortcomings and future challenges Fields marked with * are mandatory. 1 Introduction - Background and
The European Commission s strategy on Corporate Social Responsibility (CSR) 2011-2014: achievements, shortcomings and future challenges Fields marked with * are mandatory. 1 Introduction - Background and
RENEWABLE H&C: BREAK-THROUGH NEEDS?
 RENEWABLE H&C: BREAK-THROUGH NEEDS? Tobias Fleiter, Jan Steinbach, Fraunhofer ISI Brussels, 2017/10/17, EUFORES Based on 3 EU H&C projects Mapping and analyses of the H/C fuel deployment EC tender study
ANNEXES. to the. Proposal for a REGULATION OF THE EUROPEAN PARLIAMENT AND OF THE COUNCIL
 EUROPEAN COMMISSION Brussels, 20.7.2016 COM(2016) 479 final ANNEXES 1 to 6 ANNEXES to the Proposal for a REGULATION OF THE EUROPEAN PARLIAMENT AND OF THE COUNCIL on the inclusion of greenhouse gas emissions
Circular Economy and Energy Union
 Circular Economy and Energy Union Dr. Ella Stengler CEWEP Managing Director 16 June 2016, Rotterdam 8 th CEWEP Waste-to-Energy Congress 2016 1 Members CEWEP Confederation of European Waste-to-Energy Plants
Energy Efficiency Perspectives and Priorities Vleva EUSEW, 24 June 2014
 Efficiency Perspectives and Priorities Vleva EUSEW, 24 June 2014 Eva Hoos European Commission Directorate-General for Efficiency Unit 1. Implementation 2. Financing 3. Next steps: 2030 Outline 1. Implementation
Response charts for 'Quality Framework for Traineeships'
 Response charts for 'Quality Framework for Traineeships' Current search: Query definition All data requested Result pages There are 694 responses matching your criteria of a total of 694 records in the
European Label Industry Continues Dynamic Track Record in 2017
 European Label Industry Continues Dynamic Track Record in 2017 Total consumption of self-adhesive label materials in Europe amounted to 7.45 million m 2 in 2017, corresponding with a growth rate of 4.7%
Example of using detailed statistics: The case of poplar markets in EU
 Example of using detailed statistics: The case of poplar markets in EU Arvydas Lebedys FAO Forestry Officer (Statistics) Eurostat Forestry Statistics Working Group Meeting, Luxembourg, 16-17 November 2011
Energy Innovation Scoreboard A Pilot Framework with a Focus on Renewables
 Energy Innovation Scoreboard A Pilot Framework with a Focus on Renewables Claudia Kettner, Angela Köppl IEA Workshop on "Modelling and Analyses in R&D Priority-Setting and Innovation" IEA, 24 April 2014
ISSN energy. in figures. Energy
 ISSN 1977-4559 EU energy in figures STATISTICAL POCKETBOOK 2014 Energy EU ENERGY IN FIGURES POCKETBOOK 2014 1 This publication does not involve the European Commission in liability of any kind. Europe