201 FACILITIES PLAN EXECUTIVE SUMMARY
|
|
|
- Pamela Whitehead
- 6 years ago
- Views:
Transcription
1 201 FACILITIES PLAN EXECUTIVE SUMMARY This Executive Summary presents the objectives of the 201 Facilities Plan Update, provides a project background, describes the approaches used to evaluate the wastewater collection and treatment systems, and presents a brief summary of conclusions and recommendations. The 201 Facilities Plan Update also presents a comprehensive sewerage master plan designed to address the City s wastewater infrastructure needs in the most cost effective manner. The objectives of the 201 Facilities Plan Update are: Prepare a comprehensive digital map of the City s sewage collection system based on existing sewer system plans. Through a desktop evaluation, identify collection system and wastewater treatment plant infrastructure problems and develop a comprehensive sewerage master plan to systematically and cost-effectively address the problems. Develop a master plan for sewerage improvements at the Pease International Tradeport in anticipation of development of available business, commercial, and industrial zoned areas. Establish a funding strategy which maximizes the use of grants, low interest loans, and other contributions to finance capital improvements. The City of uth, New Hampshire, is a well established seacoast community situated along the Piscataqua River. As with many older cities and towns throughout New England, uth s sewers serve as a combined sanitary and stormwater conveyance system. In periods of heavy rain fall, the excess flow discharges to surface water via combined sewer overflows (CSOs). Coupled with the CSOs, many areas within the collection system backup and flood the streets and basements with sewage and stormwater. At the wastewater treatment plant, the City has experienced difficulties for several years in consistently meeting the facility s NPDES discharge permit limits. At the Pease International Tradeport, an aging and deteriorating Underwood Engineers, Inc ES Facilities Plan Update C:\Program Files\Adobe\Acrobat 4.0\Acrobat\plug_ins\OpenAll\Transform\temp\Execsum.doc
2 201 FACILITIES PLAN UPDATE PORTSMOUTH, NEW HAMPSHIRE S.R.F. PROJECT NO. CS PREPARED FOR: CITY OF PORTSMOUTH, NEW HAMPSHIRE DRAFT FINAL NOVEMBER 19, 1999 DRAFT JUNE 30, 1999 PREPARED BY: UNDERWOOD ENGINEERS, INC. 25 VAUGHAN MALL PORTSMOUTH, NEW HAMPSHIRE
3 TABLE OF CONTENT SECTION DESCRIPTION PAGE ES 201 FACILITIES PLAN EXECUTIVE SUMMARY ES.1 COLLECTION SYSTEM...ES-2 ES.2 PEIRCE ISLAND WASTEWATER TREATMENT PLANT...ES-4 ES.3 PEASE INTERNATIONAL TRADEPORT COLLECTION SYSTEM...ES-7 ES.4 RECOMMENDED PLAN...ES INTRODUCTION 1.1 BACKGROUND PURPOSE PAST REPORTS AND REGULATORY ACTIONS Facilities Plan Value Engineering Report EPA Consent Decree Combined Sewer Overflow Abatement Program SCOPE OF WORK EFFLUENT STANDARDS AND REGULATORY ISSUES 2.1 BACKGROUND CONSENT DECREE RECEIVING WATER QUALITY CURRENT NPDES PERMIT FUTURE NPDES PERMIT SLUDGE DISPOSAL REGULATIONS FUTURE SLUDGE DISPOSAL REGULATIONS PRESENT AND FUTURE POPULATIONS, WASTEWATER FLOWS AND POLLUTANT LOADS 3.1 INTRODUCTION METHODOLOGY Population Projections Wastewater Flows and Load Projections Existing Flows Future Flows Wastewater Flows from Surrounding Towns Inflow and Infiltration POPULATION PROJECTION EXISTING AND FUTURE FLOW PROJECTIONS PRESENT AND FUTURE ORGANIC LOADS SUMMARY Underwood Engineers, Inc i 201 Facilities Plan Update C:\Program Files\Adobe\Acrobat 4.0\Acrobat\plug_ins\OpenAll\Transform\temp\785TOC2.doc Ports
4 TABLE OF CONTENT (CON T) SECTION DESCRIPTION PAGE 4.0 EVALUATION OF COLLECTION SYSTEM - EXISTING AND FUTURE FLOWS 4.1 GENERAL COLLECTION SYSTEM EVALUATION Methodology Hydraulic Modeling Modeling Results Lafayette Basin Box Sewer Basin Maplewood Ave Sewer Basin Southern Portion of the Mechanic Street Sewer Basin Leslie Drive Sewer Basin Known Collection System Problem Areas Tidal Inflow and By-pass Structures Combined Sewer Overflows Deer Street Tide Chamber Burkitt and Dennett State and Marcy Mechanic Street Pumping Station PUMPING STATION EVALUATION General Mechanic Street Deer Street Pumping Station Marsh Lane (formerly Dearborn Place) North West Street Pumping Station Mill Pond Way (formerly Dearborn Extension) Atlantic Heights Pumping Station Leslie Drive Pumping Station Marcy Street Pumping Station Gosling Road Pumping Station Griffin Park Pumping Station Lafayette Pumping Station West Road Pumping Station Constitution Avenue Pumping Station Rye Line Heritage Avenue Pumping Station Woodlands I Pumping Station Woodlands II Pumping Station Tuckers Cove Pumping Station Pumping Station Operational Recommendations COLLECTION SYSTEM SUMMARY (Exclusive of Pease) Underwood Engineers, Inc ii 201 Facilities Plan Update C:\Program Files\Adobe\Acrobat 4.0\Acrobat\plug_ins\OpenAll\Transform\temp\785TOC2.doc Ports
5 TABLE OF CONTENT (CON T) SECTION DESCRIPTION PAGE 5.0 EVALUATION OF PEIRCE ISLAND WASTEWATER TREATMENT PLANT AT EXISTING AND FUTURE FLOWS AND LOADS 5.1 GENERAL METHODOLOGY PERFORMANCE EVALUATION HYDRAULIC EVALUATION UNIT PROCESS EVALUATION Preliminary Treatment Screening Grit Removal Preliminary Treatment Summary Primary Treatment Primary Clarifiers Primary Waste Sludge Pumps Primary Treatment Summary Advanced Primary Treatment (Primary Effluent Filters) Effluent Flow Meter Disinfection System Chemical Storage Chemical Metering Pumps Chlorine Contact Tanks Disinfection System Recommendations Solids Handling and Dewatering System Gravity Thickener Thickened Sludge Pumps Sludge Storage Tanks Belt Filter Press Original Design Criteria Factors that Affect Belt Press Performance Projected Dewatering Time Required Solids Handling and Dewatering System Summary and Recommendations Septage Receiving Odor Control PROCESS MODIFICATIONS Preliminary Treatment Process Modifications Primary Treatment Process Modifications CCT s Process Modifications Solids Handling and Dewatering System Plant Wide Operation and Maintenance POTENTIAL PROJECTS Underwood Engineers, Inc iii 201 Facilities Plan Update C:\Program Files\Adobe\Acrobat 4.0\Acrobat\plug_ins\OpenAll\Transform\temp\785TOC2.doc Ports
6 TABLE OF CONTENT (CON T) SECTION DESCRIPTION PAGE 6.0 RECOMMEDED PROJECTS 6.1 INTRODUCTION PROJECT SELECTION METHODOLOGY REVIEW OF PROPOSED COLLECTION SYSTEM PROJECTS Treatment Versus Sewer Separation Priority Sewer Projects Additional Sewer Projects PRIORITY PUMPING STATION PROJECTS Mechanic Street Pumping Station Deer Street Pumping Station Rye Line Pumping Station Gosling Road Pumping Station Excess Pumping Station Run Times Lafayette Road Pumping Station Additional Pumping Station Projects Mechanic Street Pumping Station Deer Street Pumping Station PEIRCE ISLAND WWTP Advanced Primary Treatment Options Disinfection Reliability Solids Handling Septage Receiving Additional Projects PEASE SEWER EVALUATION 7.1 INTRODUCTION General Physical Condition of Sewers REVIEW OF PREVIOUS INVESTIGATIONS AND STUDIES HTA, Sewer Evaluation Family Housing Area/Pease Air Force Base Rist Frost, Pease Air Force Base Inflow/ Infiltration Study HTA, Pease Headworks Loading Analysis CDM, Pease Wastewater Collection and Treatment System Evaluation Underwood Engineers, Pease WWTP Baseline Evaluation Report Summary of Previous Investigations and Studies METHODOLOGY Existing Pipe Capacity Existing Flows Underwood Engineers, Inc iv 201 Facilities Plan Update C:\Program Files\Adobe\Acrobat 4.0\Acrobat\plug_ins\OpenAll\Transform\temp\785TOC2.doc Ports
7 TABLE OF CONTENT (CON T) Existing Average Daily Flow Peak Hour Flow SECTION DESCRIPTION PAGE Future Flows ASSESSMENT OF EXISTING CONDITIONS Interceptor Sewers Pumping Stations SEWER PROBLEM AREAS General Repairs and Upgrades Existing Capacity Limitations Future Capacity Limitations RECOMMENDED SEWER PROJECTS SSES Projects Upgrade/Rehabilitation Projects Sewer Project Costs RECOMMENDED PROGRAM HEADWORKS LOADING ANALYSIS FUNDING 8.1 INTRODUCTION RECOMMENDED PROGRAM LIST OF FIGURES FIGURE NO. DESCRIPTION PAGE ES-1 Sewerage Improvement Loans, uth, NH... ES Location Map Population Projections Lafayette Basin Box Sewer Basin Deer Street Sewer Basin Maplewood Ave Sewer Basin Southern Portion of the Mechanic Street Sewer Basin (Lincoln Ave. Neighborhood) Leslie Drive Sewer Basin Process Flow Diagram Existing Sewer Layout Study Plan Sewerage Improvement Loans, uth, NH Underwood Engineers, Inc v 201 Facilities Plan Update C:\Program Files\Adobe\Acrobat 4.0\Acrobat\plug_ins\OpenAll\Transform\temp\785TOC2.doc Ports
8 TABLE OF CONTENT (CON T) LIST OF TABLES TABLE NO. DESCRIPTION PAGE ES-1 Wastewater Facilities Improvements Recommendations City of uth, NH.. ES NPDES Effluent Limitations and Monitoring Requirements Average Wastewater per User Type Office of State Planning Population Projections Existing and Future Flows Buildout Flow Projections Current Average Influent BOD and TSS to Pierce Island WWTP Future Organic Load Summary of Known Sewage Collection System Problem Areas Existing Pumping Stations Existing Pumping Stations Average and Peak Run Times Pumping Stations Projects Summary of Present and Future Projected Flows and Loads Summary of NPDES and 301 (H) Waiver Requirement Violations Unit Process Capacity Wastewater Treatment Plant Projects Summary of General Collection System Problems Summary of General WWTP Problems Additional Capital Projects Service Area/Sewer Basin Correlation Summary of Rist Frost Inflow/Infiltration (I/I) Average and Peak Flows at the Pease WWTP Summary of Pumping Station Conditions Summary of Sewer Evaluation Recommended Sewer Projects Cost Summary of Basin 6 Sewer Upgrade Cost Summary of Basin 4,5,6 Relief/Upgrade Sewer Project Pease Collection System Program Cost Summary Wastewater Facilities Improvements Recommendations City of uth, NH City of uth, NH, Sewer Fund Underwood Engineers, Inc vi 201 Facilities Plan Update C:\Program Files\Adobe\Acrobat 4.0\Acrobat\plug_ins\OpenAll\Transform\temp\785TOC2.doc Ports
9 TABLE OF CONTENT (CON T) LIST OF PLATES PLATE NO. DESCRIPTION 1 Sewer System Overview 2 Collection System Problem Areas 3 10 Year Collection System Improvements Plan LIST OF APPENDICES APPENDIX NO. DESCRIPTION 2-1 NPDES Permit 2-2 Consent Decree 3-2 Draft Flow and Load Projections Memo 3-3 Sludge Production Projections 4-1 Hydraulic Model Output 4-2 Summary of Flow Allocation for Hydraulic Model 4-3 Pumping Stations Problem List 4-4 Mechanic Street and Deer Street Pumping Station Odor Control Memo 5-1 Peirce Island Wastewater Treatment Plant Projects List 5-2 Selected Process Calculation 5-3 Solids Handling Memo 5-4 Alternative Primary Effluent Filter Pilot Results and Equipment Cut Sheets 5-5 Chlorine Contact Tank Evaluation 5-6 National Shellfish Sanitation Program Manual 5-7 General Odor Control Memo 6-1 Collection System Projects Cost Backup 6-2 Pumping Station Projects Cost Backup 6-3 Advanced Primary Treatment Alternatives Evaluation and Opinion of Cost 6-4 Disinfection System Projects 6-5 Solids Handling Projects 6-6 Septage Receiving Facility Alternatives Evaluation 6-7 Wastewater Treatment Plant Projects Opinions of Costs 6-8 Separation Vs Treatment Opinion of Cost 7-1 Sanitary Sewer Evaluation Study for Family Housing Area Pease Air Force Base 7-2 Excerpts from: Infiltration/Inflow Study Underwood Engineers, Inc vii 201 Facilities Plan Update C:\Program Files\Adobe\Acrobat 4.0\Acrobat\plug_ins\OpenAll\Transform\temp\785TOC2.doc Ports
10 TABLE OF CONTENT (CON T) Pease Air Force Base LIST OF APPENDICES (continued) APPENDIX NO. DESCRIPTION 7-3 Evaluation of Pease Tradeport Wastewater Collection and Treatment System Report 7-4 Sewer Capacity Calculations and Ranking Tables 8-1 State Revolving Fund State Aid Grant Eligibility Criteria 8-2 Senate Bill S State Revolving Fund State Aid Grant Pre-applications Underwood Engineers, Inc viii 201 Facilities Plan Update C:\Program Files\Adobe\Acrobat 4.0\Acrobat\plug_ins\OpenAll\Transform\temp\785TOC2.doc Ports
11 collection system contributes significant infiltration and inflow to the wastewater treatment plant and, without repairs or rehabilitation, may inhibit future development as a commercial/industrial business park. To address these issues, the City authorized the preparation of a comprehensive update to the wastewater infrastructure master plan (i.e. 201 Facilities Plan). The last facilities plan prepared for the City s collection system was the Wastewater Facilities Planning Study prepared by Wright, Pierce, Barnes, Wyman Engineers in ES.1 COLLECTION SYSTEM Through meetings and discussions with City Planning and Public Works staff, as well as review of pumping station records and collection system observations, a comprehensive sewer system map was prepared which illustrates the identified collection system problems. In general, the following problem categories were identified: 1. Tidal inflow at two pumping stations and at CSO 10B at the South Mill Pond were identified to be significant contributors to system backups during wet weather and high tide situations. This tidal inflow limits the collection system s and pumping stations capacity to convey sewage to the treatment plant. City staff have corrected these sources of inflow since the 201 Facilities Plan Update was started. 2. Approximately 60% of the collection system consists of combined sewers conveying both stormwater and sewage. The pipe capacities are inadequate during heavy rain events resulting in sewage backups/flooding and CSO events. 3. The condition of many of the interceptor sewers is unknown as they have never been inspected by current City staff nor are there records of existing conditions. Collapsed sections of pipe, root intrusion, infiltration through cracks and joints and inflow through illegal connections (i.e. roof leaders and sump pumps) contribute to system capacity limitations and are common causes of system backups during wet weather. Underwood Engineers, Inc ES Facilities Plan Update C:\Program Files\Adobe\Acrobat 4.0\Acrobat\plug_ins\OpenAll\Transform\temp\Execsum.doc
12 4. Pumping station capacities are inadequate to convey peak combined flows during wet weather, resulting in system backups/flooding and CSO events. 5. Much of the collection system in problem areas is aging. Some of the sewers were constructed in the 1800s. Infiltration, root intrusion, deteriorated or collapsing pipe contribute to flow restrictions and backups within the system. 6. Due to the combined nature of much of the collection system, there is no excess capacity during wet weather for future development. There are also several dry weather interceptor capacity restrictions which will need to be addressed to accommodate future development in the City. The City is under an EPA Administrative Order which, among other compliance conditions, requires the City to develop and implement a Long Term Control Plan for CSO abatement. The CSOs are a direct result of the City s collection system not having sufficient capacity to convey sewage and stormwater to the wastewater treatment plant during wet weather. Historical records indicate the CSOs discharge to South Mill Pond with as little as a 1/2-inch rain storm. Coupled with this, the City must also address the sewage backups and flooding in the collection system. The most logical approach involves a series of steps (projects) which systematically address the most prevalent problems. This in turn will reduce system inflow and CSO volume, frequency and duration and their associated water quality impacts. The major collection system issues identified include widespread sewer backups/flooding during wet weather as well as several licensed and non-licensed combined sewer overflows which adversely impact surface water quality. The correction of collection system capacity limitations prior to addressing the licensed CSOs is consistent with EPAs recommended approach of implementing the Nine Minimum Controls for Combined Sewer Overflows. This approach is intended to optimize the collection system in terms of conveyance and storage capacity prior to implementing a Long Term Control Plan for the CSOs. This will also provide some additional capacity for future growth and sewering of future development areas as the need arises. The non-licensed CSOs that have been identified as part of this evaluation should be eliminated immediately with the exception of the Deer Street CSO which is being monitored to determine the frequency and duration of overflow events. This Underwood Engineers, Inc ES Facilities Plan Update C:\Program Files\Adobe\Acrobat 4.0\Acrobat\plug_ins\OpenAll\Transform\temp\Execsum.doc
13 flow information will be used to determine if this CSO can be eliminated or must be licensed and treated. A flow monitor was installed on November 4, 1999 in the Deer Street tide chamber to measure CSO events. This monitor will stay in place for at least six months. The recommended approach to addressing the collection system needs is as follows: Address tidal inflow (completed), prioritize I/I removal projects and, immediate pumping station needs at a cost of $3,500,000 (Phase I SRF Loan). Perform sewer system evaluation survey (SSES) of the major interceptors and major problem areas within the collection system, perform targeted I/I removal projects in areas evaluated in the SSES work, prepare a Long Term Control Plan for CSO Abatement, and address pumping station improvement needs at a cost of $4,242,500 (Phase II SRF Loan). Address lower priority pumping station upgrades, CSO Long Term Control Plan implementation and future sewer needs over the long term at a cost of $8,231,000 (Phase III SRF Loan). Address future capacity issues and sewer extensions at a cost of $4,600,000 (Phase IV SRF Loan). ES.2 PEIRCE ISLAND WASTEWATER TREATMENT PLANT A comprehensive evaluation of the Peirce Island Wastewater Treatment Plant (WWTP) was performed which included wastewater treatment plant tours, review of plant design criteria, unit process evaluations, review of operational data for the plant since the 1991 upgrades were completed, and an evaluation of the causes of frequent discharge permit violations. A comprehensive list of plant maintenance and equipment replacement needs was also developed through discussions with plant operators. This list will aid the City in budgeting for annual operation and maintenance needs. The WWTP is an advanced primary plant consisting of the following treatment trains: Preliminary treatment Underwood Engineers, Inc ES Facilities Plan Update C:\Program Files\Adobe\Acrobat 4.0\Acrobat\plug_ins\OpenAll\Transform\temp\Execsum.doc
14 Primary clarification Primary effluent filtration Effluent disinfection Solids handling and disposal The WWTP must comply with a National Pollutant Discharge Elimination System (NPDES) permit and a 301(h) waiver, which allows primary treatment only prior to discharging treated effluent to marine waters. Over the past several years, the City has had numerous permit violations of their total coliform limit and the Biochemical Oxygen Demand (BOD 5 ) removal efficiency requirement. These permit violations have been caused, in general, by operational difficulties with the primary effluent filters and the chlorine contact tank. Oil and grease and ground solids have been identified by plant staff, the filter system designer, and the filter manufacturer as significant problems with the operation of the filters. Additionally, the 30% BOD 5 removal efficiency requirement of the 301(h) waiver was not required until 1994, after the plant upgrades were completed. The filters were not selected or designed with the specific intent to achieve a minimum 30% BOD 5 removal across the plant. Rather, they were selected to improve solids removal to enhance the disinfection process. The City has undertaken a number of evaluations at the WWTP to find alternatives to the existing filtration system which may be more reliable at achieving the treatment efficiency necessary to maintain permit compliance. These evaluations have included piloting of alternative filtration processes, piloting of chemically enhanced primary clarification, and additional plant sampling and analysis. The City has also engaged the services of the design engineer that performed the 1991 plant upgrades to provide additional analysis and recommendations regarding the performance of the filter system. This evaluation was inconclusive due to the limited availability of actual filter performance data on plants with similar unit processes and wastewater characteristics. In an effort to meet BOD 5 removal efficiency requirements, the City has been conducting a full scale chemically enhanced primary clarification pilot since February The data generated over the past ten months have shown that this system can consistently achieve a 40% BOD 5 removal efficiency on average with the exception of August 1999 and is expected to enable the Underwood Engineers, Inc ES Facilities Plan Update C:\Program Files\Adobe\Acrobat 4.0\Acrobat\plug_ins\OpenAll\Transform\temp\Execsum.doc
15 City to meet its NPDES permit requirements in the future. In August of 1999, dry weather flows increased the influent concentration of BOD 5 to around 300 mg/l. Jar tests showed that the chemical dosage needed to be higher (~30 ppm) to obtain the removal efficiency required. However, the chemical metering pumps were not large enough to deliver the required dosage and new pumps were not installed until mid-september, after the August permit violations. It appears that the increased dosage would have worked to remove the BOD 5, but the incident shows that additional treatment may be necessary to meet BOD 5 limits in the future. The City is working with Underwood Engineers, Inc. to pilot the existing PEFs in conjunction with the chemically enhanced primary clarifiers. This pilot will help determine the need for additional treatment to meet the City s NPDES and 301 (h) permit waiver requirements during periods of high strength influent and as organic loads to the plant increase over time. In addition, this pilot will define the actual sizing required for a new chemically enhanced primary clarification system. Based on the evaluations conducted to date, it appears that the use of the filters may not be necessary to achieve compliance with the NPDES permit. However, use of the primary effluent filters in conjunction with the chemically enhanced primary clarifiers could help reduce chemical costs during periods of high strength wastewater and provide additional flexibility and reliability for the plant operation. Regarding the total coliform effluent violations, comparison sampling since March 1999 of fecal and total coliform show that fecal coliform exceedance of the shellfish standard has not occurred when the total coliform standard has been exceeded. If results remain consistent, a modification of the NPDES permit limit to fecal coliform would eliminate the coliform violations. Assuming that a permit modification to the fecal coliform standard is approved, necessary capital improvements to the WWTP include Chemically Enhanced Primary Clarification, sludge holding and processing upgrades, relocation of the septage receiving station to the Pease WWTP, and minor disinfection system upgrades. If the permit modification is not approved or fecal coliform violations occur, then improvements to the disinfection system will be necessary including additional sodium hypochlorite storage, a disinfection chemical feed flow pacing system, additional chlorine contact tank volume, and improvements to the existing chlorine contact tank. Underwood Engineers, Inc ES Facilities Plan Update C:\Program Files\Adobe\Acrobat 4.0\Acrobat\plug_ins\OpenAll\Transform\temp\Execsum.doc
16 Depending upon the outcome of the request for permit modification, the total cost for these improvements in 1999 dollars will range from approximately $1,100,000 to $2,200,000 (Table ES-1). Additional capital projects have also been identified which, although not directly related to permit non-compliance, will improve operations, replace worn or failing equipment, reduce operation and maintenance costs and extend the life of existing equipment. The total cost of these projects is approximately $3,430,000. These recommended improvements are based on the assumption that the flow to the plant will not be increased beyond its current design capacity. As discussed above, the City s permit violations can be addressed with modifications to the existing advanced primary treatment system to improve treatment efficiency and reliability and maintain the City s 301 (h) waiver. The operational difficulties and process modifications should be addressed in a timely manner to enable the City to maintain their 301 (h) waiver NPDES permit modification. If the City does not demonstrate to EPA that it can consistently meet its current permit limits, the EPA will require the City build a secondary treatment plant. If this occurs the City will have to upgrade the Peirce Island Wastewater Treatment Plant to a secondary treatment plant at a cost of $20 to $30 million. This would increase the average sewer user bill by approximately $700 to $1,000 per year. As stated above this plan assumes the City will retain its 301 (h) waiver into the future. ES.3 PEASE INTERNATIONAL TRADEPORT COLLECTION SYSTEM The Pease sewer system was installed in the mid-1950 s with the development of the Pease Air Force Base. The collection system was constructed of vitrified clay (VC) pipe and consists of approximately 15 miles of sewers, the majority of which are below the water table. Based on a review of the available records and reports, it appears that very little maintenance or upgrades have been conducted over the 40+ years since the system was installed. Currently the City of uth maintains and operates the collection system and treatment plant through an intermunicipal service agreement with the Pease Development Authority. Underwood Engineers, Inc ES Facilities Plan Update C:\Program Files\Adobe\Acrobat 4.0\Acrobat\plug_ins\OpenAll\Transform\temp\Execsum.doc
17 Typical of this type and age of system, there is significant groundwater infiltration and some inflow into the system, as much as 70% of current flows to the wastewater treatment plant at Pease. Limited video inspection and flow monitoring conducted over the past 25 years revealed a collection system riddled with leaking and broken joints, root intrusion, significant sags and debris accumulation, crushed or collapsed sections of pipe, and shallow pipe slopes. These conditions allow for significant (infiltration/inflow) clean water to be treated at the WWTP as well as contribute to flow restrictions or blockages which can cause surcharging. Presently, there is significantly less wastewater being generated at the Pease International Tradeport than when it was an Air Force Base, therefore, sewage backups have not been an issue. However, as commercial, business, and industrial development progresses, these problems will manifest themselves as sewage backups and treatment capacity limitations. Underwood Engineers, Inc. has completed the design and upgrade of the Pease WWTP and design of the new outfall into the Piscataqua River that will be constructed in the winter of These activities have corrected the major shortcomings at the WWTP, however, there are minor capital projects and maintenance projects that will be necessary over the next 5 to 10 years. Camp Dresser & McKee (CDM) performed an evaluation of the Pease WWTP and sewer collection system in At that time a limited buildout scenario was evaluated and concluded that in general, the sewer system had adequate capacity for future buildout. However, based on a limited amount of sewer system investigation which was then assumed representative of the entire collection system, CDM recommended a $1.5 million rehabilitation program to eliminate 75% of the infiltration and inflow. The recommendations of this report were not fully implemented and were limited to some manhole repairs. Underwood Engineers reviewed the available information and previous investigations and studies and evaluated the long term buildout potential at the base and the associated collection system needs. Consistent with previous studies findings, the collection system appears to be seriously deteriorated, however, limited inspection has been performed. Based on the potential Underwood Engineers, Inc ES Facilities Plan Update C:\Program Files\Adobe\Acrobat 4.0\Acrobat\plug_ins\OpenAll\Transform\temp\Execsum.doc
18 buildout of the Tradeport, sections of the interceptor sewers have current and/or future capacity limitations. A phased approach of evaluation and rehabilitation is recommended, making successive decisions based on thorough investigation and alternatives evaluation. The first priority is to perform video inspection and cleaning of the major interceptor sewers, replace existing capacity limited sections of the interceptors, and replace interceptors known at this time to be in poor condition. The cost associated with this work is $1,354,000. The second priority is to rehabilitate or replace existing interceptor sewers in poor condition to restore flow capacity and minimize infiltration. The majority of the interceptors were originally constructed along topographic low points so major rerouting of interceptor sewers is not expected. Pumping stations generally served small areas and consideration should be given to abandoning those not in use or privatizing them to future developers of these areas. The costs for rehabilitation or replacement of the major interceptor sewers, will be based on the cleaning and inspection findings and additional cost effective evaluations. Based on available information the current opinion of cost to perform this work ranges from $500,000 to $2,000,000. The remainder of the collection system consists of 8-inch pipe and some 6-inch sections. It is suspected, based on previous evaluations that a significant amount of groundwater infiltration occurs in these pipes. Although collection system and WWTP capacity is generally adequate today, a sewer system evaluation survey (SSES) including cleaning, video inspection, and flow monitoring should be conducted in these areas to identify rehabilitation and infiltration reduction needs. The rehabilitation can then be phased in as problems arise or as additional capacity for sanitary flows is needed as development progresses. The estimated cost for SSES work and system rehabilitation of the collector sewers is $900,000. ES.4 RECOMMENDED PLAN Table ES-1 provides a cost breakdown of the wastewater infrastructure improvements needs identified. A large portion of the projects should be implemented over the next twenty years and Underwood Engineers, Inc ES Facilities Plan Update C:\Program Files\Adobe\Acrobat 4.0\Acrobat\plug_ins\OpenAll\Transform\temp\Execsum.doc
19 their need should be reevaluated as priority projects are implemented and their results are assessed. A recommended loan structuring involving four consecutive funding stages is provided in Figure ES-1. The City received a 5.2 million State Revolving Fund (SRF) loan in 1996 to fund a number of sewerage improvements, many of which are underway or completed as of the date of this report. The City has also received approval for a $6.7 million SRF loan to continue with the recommended sewerage improvements over the next five years. This plan has been presented to the City Council and the Citizens of uth and implementation of its recommendations has been approved by the City Council. Underwood Engineers, Inc ES Facilities Plan Update C:\Program Files\Adobe\Acrobat 4.0\Acrobat\plug_ins\OpenAll\Transform\temp\Execsum.doc
20 SECTION 1 INTRODUCTION 1.1 BACKGROUND The City of uth (City) is located in Rockingham County at the mouth of the Piscataqua River in the seacoast area of New Hampshire (Figure 1-1). The City of uth s sewerage system consists of approximately 115 miles of sewers (excluding the Pease International Tradeport), 18 pumping stations, and a 4.8 million gallon per day (mgd) primary wastewater treatment plant (WWTP) located on Peirce Island (EER, 1997). The City has an inter-municipal agreement with the Town of New Castle, an island to the northeast of uth, to treat their wastewater at the City s Peirce Island WWTP. Additionally, the City has entered into a long-term Municipal Services Agreement (MSA) with the Pease Development Authority (PDA) to maintain and operate the wastewater collection and treatment facilities at the Pease International Tradeport (Pease), the former Pease Air Force Base, and has other agreements with Rye, New Hampshire on behalf of Adams Mobil Home Park and with a private entity located in Greenland, New Hampshire. The Pease facilities include approximately 15 miles of sewers, eight pumping stations, and a secondary WWTP (CDM, 1995). Approximately 60% of the City s collection system (exclusive of Pease) consists of combined sewers which carry both wastewater and stormwater, portions of which are over 100 years old. These combined areas generally occur in the older urbanized portions of the City (See Plate 1). In the 1970s, there were fourteen (14) major discharges of combined and/or raw wastewater to the Piscataqua River and the North or South Mill Ponds. Since the 1970s, the City has undertaken numerous separation, facility expansion, and repair projects aimed at eliminating the majority of the discharges to the Piscataqua River. Currently, there remain two permitted combined sewer overflows (CSOs) which discharge to South Mill Pond as well as the WWTP discharge to the Piscataqua River. Underwood Engineers, Inc Facilities Plan Update C:\Program Files\Adobe\Acrobat 4.0\Acrobat\plug_ins\OpenAll\Transform\temp\Sec1.doc
21 Several previous facilities planning reports have recommended complete separation of the combined sewer areas as the most cost-effective means of collecting and treating the City s wastewater. However, the City s efforts to provide additional treatment and pumping station Insert Figure 1-1 Underwood Engineers, Inc Facilities Plan Update C:\Program Files\Adobe\Acrobat 4.0\Acrobat\plug_ins\OpenAll\Transform\temp\Sec1.doc
22 capacity and to eliminate combined sewer overflows and raw wastewater discharges (to comply with an Environmental Protection Agency Consent Decree) have meant that the City s separation efforts have not been able to keep pace with addressing the CSOs. As a result of eliminating the majority of the overflows which acted as relief valves in the collection system, surcharging and flooding due to sewer backups has become more prevalent during wet weather. Historically, rain events as small as 0.57 inches (approximately a ½-year storm frequency), resulted in combined sewer overflows at South Mill Pond (Whitman and Howard, 1991). Larger storm events cause surcharging of sewers, flooding, and sewage backups into homes and onto City Streets at numerous locations throughout the City. Additionally, wet weather combined sewer overflows have been identified at locations other than the licensed CSOs at South Mill Pond. These include tide chambers at Deer Street and Mechanic Street Pumping Stations and cross connections at Burkitt, Marcy and Ceres Street. In 1990 the City entered into a Consent Decree with the EPA and the State of New Hampshire for violations of the City s National Pollutant Discharge Elimination System (NPDES) Permit issued for the Peirce Island WWTP. This permit sets limits on treated wastewater effluent that can be discharged to the Piscataqua River. As a result of this Consent Decree, the City performed a number of capital projects to increase capacity at the Peirce Island WWTP and to improve treatment efficiency and increase capacity at the Deer Street and Mechanic Street pumping stations. However, over the past several years, the City has been unable to consistently meet its permit limits, resulting in non-compliance with the permit as well as non-compliance with the Consent Decree. The remaining requirement that has not been completely addressed is the abatement of the licensed CSOs located at the South Mill Pond (CSO 10A and 10B). In 1991 Whitman and Howard, Inc. prepared a CSO abatement program, which recommended a swirl concentrator to treat these CSOs. This report was submitted to the EPA and NHDES, however, until recently no comments or approval have been received. Since 1998, a series of meetings have been held with the EPA, NHDES, and the City to discuss the CSOs. During these meetings, NHDES indicated the swirl concentrator alone would not meet water quality standards. In addition, the EPA has required that the City must complete a Long Term Control Plan (LTCP) Underwood Engineers, Inc Facilities Plan Update C:\Program Files\Adobe\Acrobat 4.0\Acrobat\plug_ins\OpenAll\Transform\temp\Sec1.doc
23 to address the CSOs. The tentative schedule for completion of the LTCP is within the next two to three years. Prior to initiating the design and construction of a CSO treatment system, and in light of WWTP permit non-compliance and the prevalence of sewer backups and widespread flooding during heavy rains, the City contracted with Underwood Engineers, Inc. to update their City-wide sewerage system master plan (201 Facilities Plan). The conclusions and recommendations of this updated Facilities Plan, when implemented, will impact the need for or extent of CSO controls. 1.2 PURPOSE The purpose of this report is to update the City s most recent wastewater Facilities Plan, which was prepared in 1977 by Wright, Pierce, Barnes, and Wyman Engineers (Wastewater Facilities Planning Study). This updated Facilities Plan will be used as a basis for scheduling and budgeting the implementation of wastewater facilities capital improvements for the next twenty years. These improvements will be aimed at correcting existing problems, providing adequate capacity for future needs, and bringing the City into compliance with their 301(h) waiver modified NPDES permit and State licensing requirements. Additionally, this plan will provide the mechanism for the City to bring the WWTP into compliance with their NPDES permit and Consent Decree provisions. This will provide the opportunity for the City to renegotiate their Consent Decree to eliminate provisions complied with and revisit time frames for CSO long-term control planning. This Facilities Plan addresses the needs of the City s collection and treatment system as well as the Pease collection system. In addition, this document will be submitted to the State of New Hampshire and will be used as a supporting documentation for state-sponsored loans and grants. The updating of the Facilities Plan and the implementation of recommended improvements also compliments the City s long-term plans for addressing combined sewer overflows. In 1997, the City submitted the Nine Minimum Controls Documentation to EPA. This document shows the City s efforts to implement minimum technology-based controls that address CSO problems Underwood Engineers, Inc Facilities Plan Update C:\Program Files\Adobe\Acrobat 4.0\Acrobat\plug_ins\OpenAll\Transform\temp\Sec1.doc
24 without significant engineering or construction costs prior to the implementation of long-term control measures. Much of the collection system evaluation and recommended projects have focused on addressing sewage backups and flooding during wet weather by optimizing the capacity of the collection system. This in turn will further reduce the volume and frequency of CSO events as well as their impacts on surface water quality and will positively impact the level of long-term CSO abatement required. 1.3 PAST REPORTS AND REGULATORY ACTIONS Since the 1977 Report, a number of studies, reports and regulatory actions have been completed. These past reports and studies were used as a starting point for this Facilities Plan Update. In particular, the reports, studies and regulatory actions summarized below were most relevant to this update. A complete list of references is provided at the end of this report Wastewater Facilities Planning Study (201 Facilities Plan) In 1977 a Wastewater Facilities Planning Study was prepared by Wright, Pierce, Barnes and Wyman Engineers. This report recommended the City conduct a ten-year sewer separation program to eliminate the combined sections of the City s sewerage collection system. At the time this report was written, there were twelve (12) combined sewer overflows. The report recommended 10 separation projects, which are listed below. 1. Market St. P.S. (Deer St.), Cutts Ave.-Leslie Drive, B&M Interceptor 2. Atlantic Heights, Woodbury Ave. 3. New Castle Ave./Pickering Ave. Mechanic St. Areas 4. Dennett St., Islington St. South 5. Islington St. Deer St. 6. Lafayette Rd. to Broad St. (Lincoln Street Neighborhood) 7. Broad St. to Parrot Ave. (Richards Ave.) 8. Parrot Ave. to Mechanic St. 9. Wentworth Acres 10. McDonough St. Underwood Engineers, Inc Facilities Plan Update C:\Program Files\Adobe\Acrobat 4.0\Acrobat\plug_ins\OpenAll\Transform\temp\Sec1.doc
25 From this list, projects 3 and 9 were completed. In addition, portions of projects 1, 2, 5 and 10 were completed. Plate 1 shows the portions of the City sewers that are believed to remain combined. There remain two (2) permitted CSOs in the City at South Mill Pond. The 1977 Report recommended three rehabilitation projects to reduce inflow and infiltration from the separated portions of the collection system. These areas include the Elwyn Park area, the collection system from Panaway Manor to Route 1 and the area included from Echo Ave. to Rockingham Ave. None of these rehabilitation projects were performed. The 1977 Report also recommended that a new secondary wastewater treatment facility be constructed at the City s Peirce Island primary treatment plant. In 1982 the City applied for and received a 301 (h) waiver of secondary treatment requirements for marine discharges, eliminating the need for secondary treatment. The City s NPDES Permit issued in 1985 (under which the City is still operating) established the effluent limits the City s Peirce Island WWTP must meet with the 301(h) waiver, specifically 150 mg/l BOD 5 and 125 mg/l TSS. Revisions to the 301(h) waiver requirements which became effective for uth on September 8, 1994 (59FR 40658, August 9, 1994) include providing primary or equivalent treatment of wastewater and providing a minimum of 30 percent BOD 5 and TSS removal on a monthly average Value Engineering Report In 1983, Whitman and Howard, Inc. (now Earth Tech) performed a value engineering (VE) on the secondary treatment plant designed by Wright Pierce Barnes and Wyman. Included were three options for primary treatment in lieu of secondary. The VE report did not change any of the collection system recommendations made in the 1977 Report. The design criteria (flows and loads) used in the VE Report were slightly greater than those used in the 1977 Report and these criteria was used to size the primary treatment upgrades on Peirce Island EPA Consent Decree Underwood Engineers, Inc Facilities Plan Update C:\Program Files\Adobe\Acrobat 4.0\Acrobat\plug_ins\OpenAll\Transform\temp\Sec1.doc
26 In 1990 the City of uth entered into a Consent Decree (Civil No D) with the United States Environmental Protection Agency (EPA) and The State of New Hampshire concerning violations to the City s NPDES permit. A copy of the Order of Consent is included in Appendix 1-1. The Consent Decree was to have the objectives of causing uth to come into and remain in full compliance with the Clean Water Act, including compliance with the terms and conditions of its NPDES Permit, renewals or amendments to that Permit, and the provisions of applicable Federal and State laws and regulations governing discharges from uth s wastewater treatment plant. In general, the Consent Decree required the City to upgrade their Peirce Island treatment facility to meet their 301(h) waiver modified NPDES requirements by February 25, The Consent Decree also addressed the remaining CSOs 10A and 10B at South Mill Pond. The Consent Decree required the City to develop and submit a CSO abatement program to the EPA and the State by January 1, Section 2 of this report covers the regulatory requirements in more depth Combined Sewer Overflow Abatement Program In 1991 Whitman and Howard completed a CSO Abatement Program which was submitted to the EPA and the State for approval. This Abatement Program recommended treating the remaining CSOs with a swirl concentrator versus the previously recommended City wide sewer separation. However, since this Abatement Program was submitted for approval, areas within the combined portions of the City have experienced frequent sewage flooding and surcharging. Since the recommended swirl concentrator would not eliminate these problems and could in fact contribute to them due to limited available head to operate a swirl concentrator, the City has decided to revisit the recommended solution after first optimizing the collection system capacity. 1.4 SCOPE OF WORK In order to achieve the stated purpose of this Facilities Plan Update, a detailed evaluation of the City s wastewater collection and treatment systems was conducted. For the Pease facility, Underwood Engineers, Inc Facilities Plan Update C:\Program Files\Adobe\Acrobat 4.0\Acrobat\plug_ins\OpenAll\Transform\temp\Sec1.doc
27 however, only the collection system was evaluated since the WWTP was recently upgraded in The Scope of Work was conducted in general accordance with the following scope: TASK 1 Task 1a Task 1b Task 1c Task 1d Task 1e Task 1f Task 1g Task 1h Task 1i Task 1j Task 1k Task 1l Task 1m Task 1n Task 1o 201 FACILITIES PLAN UPDATE Review 1977 Wastewater Facilities Planning Study Review EPA & DES Requirements City-wide Assessment (Wastewater Flow and Load Projections) Extraneous Flows (Infiltration and Inflow) Inventory Problem Areas Collection System Project Listing Regulatory Review of Future Sewer Routing Needs Sludge/Septage Review Disinfection System Facilities Upgrade Screenings Building Selected Wastewater Treatment Plant Plan Regulatory Concerns Funding Programs Write-up Updated 201 Facilities Plan Public Participation TASK 2 Task 2a Task 2b ADDITIONAL RELATED TASKS Update Sewer Maps Pease International Tradeport Sewer Master Plan Underwood Engineers, Inc Facilities Plan Update C:\Program Files\Adobe\Acrobat 4.0\Acrobat\plug_ins\OpenAll\Transform\temp\Sec1.doc
28 Task 2c Task 2d Pease International Tradeport Local Limits/Pretreatment Program Peirce Island WWTP and City Pumping Station Evaluations NPDES Permit Task 2C is ongoing and will be submitted as a supplement to this Facilities Plan upon completion. Underwood Engineers, Inc Facilities Plan Update C:\Program Files\Adobe\Acrobat 4.0\Acrobat\plug_ins\OpenAll\Transform\temp\Sec1.doc
29
30 SECTION 2 EFFLUENT STANDARDS AND REGULATORY ISSUES 2.1 BACKGROUND The City of uth is required to meet water quality limits established by State and Federal water quality legislation. This Section of the Facilities Plan Update covers the regulatory requirements for the Peirce Island WWTP only. In accordance with Section 402 of the Clean Water Act, the Peirce Island WWTP s effluent requirements are listed in its NPDES permit which was issued to the City of uth in 1985 by the EPA with NHDES concurrence. The City must also comply with effluent requirements established for their two remaining CSOs at the South Mill Pond and the Pease WWTP. The requirements for the CSOs will be covered in a separate CSO LTCP update and the requirements for the Pease wastewater treatment plant will be covered in Section 7 of this report. A copy of the current NPDES permit is contained in Appendix CONSENT DECREE In addition to requirements listed in the City s NPDES permit, the City is also under a Consent Decree. In 1990 the City of uth entered into a Consent Decree (Civil No D) with the EPA and the State of New Hampshire concerning violations to the City s NPDES permit. A copy of the Consent Decree is included in Appendix 2-2. As discussed in Section 1 the Consent Decree was to have the objectives of causing uth to come into and remain in full compliance with the Clean Water Act, including compliance with the terms and conditions of its NPDES Permit, renewals or amendments to that Permit, and the provisions of applicable Federal and State laws and regulations governing discharges from the Peirce Island WWTP. In general, the Consent Decree required the City to upgrade their Peirce Island treatment facility to meet their NPDES requirements by February 25, The Consent Decree also addressed the remaining CSOs 10A and 10B. The Consent Decree required the City to develop and submit a CSO abatement program to the EPA and State by Underwood Engineers, Inc Facilities Plan Update C:\Program Files\Adobe\Acrobat 4.0\Acrobat\plug_ins\OpenAll\Transform\temp\Sec2.doc
31 January 1, Additional discussion concerning requirements for the two licensed CSOs will be included in an update to the City s CSO LTCP. 2.3 RECEIVING WATER QUALITY The State of New Hampshire has established a water quality classification system for the receiving waters of New Hampshire. The two classes of waters are Class A and Class B as established by RSA 485-A:8, I, II and III and outlined in the States Surface Water Quality Regulations (Env-Ws 430). The Peirce Island WWTP discharges to the Piscataqua River which is a Class B water. In general, Class B waters must maintain dissolved oxygen concentrations of not less than 75% of saturation unless naturally occurring at lower levels, and shall have total coliform bacteria concentration of 70 per 100 ml or less. 2.4 CURRENT NPDES PERMIT The effluent limitations contained in the City s NPDES Permit are summarized in Table 2-1. The City s NPDES permit is modified by a 301 (h) waiver. The 301 (h) waiver allows for a waiving of secondary treatment requirements for certain marine discharges. The 301 (h) requires a minimum of 30 % removal of BOD 5 and TSS be obtained through primary or equivalent treatment. The 30% removal requirements of the 301 (h) wavier were first proposed on January 24, 1991 based on the requirements of the Water Quality Act of This requirement became effective on September 8, 1994 after significant public comment and several EPA clarifications and revisions. The City of uth was also subject to a grandfather provision in 40 CFR (j) allowing the City until August 1996 to comply with the 30% removal requirements. However, comments from EPA on a March (h) waiver renewal application based on an improved discharge were not received until August 5, Since the WWTP upgrade in 1992 were not based on a 30% removal regulatory requirement under the 301 (h) wavier, compliance with this requirement will likely require some process modifications at the WWTP. The history of Peirce Island WWTP violation of NPDES and 301 (h) waiver requirements are shown in Table 5-2 (in Section 5). Current exceedances in permit requirements such as flows Underwood Engineers, Inc Facilities Plan Update C:\Program Files\Adobe\Acrobat 4.0\Acrobat\plug_ins\OpenAll\Transform\temp\Sec2.doc
32 greater than 4.5 mgd may require permit modification. Other violations such as total coliform, and BOD 5 require process modifications to meet permit limits or permit modifications. TABLE 2-1 NPDES EFFLUENT LIMITATIONS AND MONITORING REQUIREMENTS Average Average Monthly Monthly Maximum Measurement Sample (lbs/day) (mg/l) Daily Frequency Type Flow 4.5 mgd Continuous BOD 5 5, Weekly Comp. TSS 4, Weekly Comp. Settable Solids 0.5 ml/l Daily Grab PH Daily Grab Chlorine 1.0 mg/l Daily Grab Residual Total Coliform 70/100ml Weekly Grab 2.5 FUTURE NPDES PERMIT As a part of the preparation of this report, meetings were held with the EPA and the NHDES to determine the potential for additional permit requirements in the future. Due to noncompliance with their NPDES permit, the EPA and NHDES have indicated that the City is at risk of losing their 301 (h) waiver unless they can demonstrate that they can consistently meet the Permit requirements. Assuming the City retains their 301 (h) waiver, the additional future requirements will be likely limited to increased frequency of sampling for BOD 5 and TSS. In addition, a permit modification from total coliform to Fecal Coliform may be necessary to meet disinfection requirements. If the 301 (h) waiver status is changed the treatment requirements will be significantly changed and the City will be required to meet secondary treatment requirements. Underwood Engineers, Inc Facilities Plan Update C:\Program Files\Adobe\Acrobat 4.0\Acrobat\plug_ins\OpenAll\Transform\temp\Sec2.doc
33 In addition, any future violations in permit or waiver limits may require process modification or permit revisions to address these violations. Additional discussion concerning future effluent flows and loads and how they will affect the plant s ability to meet permit requirements will be presented in Section 5 of this report. 2.6 SLUDGE DISPOSAL REGULATIONS Requirements pertaining to the City s wastewater sludge are covered in the EPA sludge regulations (503 Regs). These requirements are included within the City s NPDES permit and vary depending upon what method of sludge disposal is pursued by the City. Currently, the City disposes of their dewatered sludge at the Turnkey Landfill in Rochester, New Hampshire. 2.7 FUTURE SLUDGE DISPOSAL REGULATIONS Based on conversations with NHDES and EPA, regulators do not currently anticipate any significant sludge disposal changes for landfill disposal of dewatered sludge. Underwood Engineers, Inc Facilities Plan Update C:\Program Files\Adobe\Acrobat 4.0\Acrobat\plug_ins\OpenAll\Transform\temp\Sec2.doc
34 SECTION 3 PRESENT AND FUTURE POPULATIONS, WASTEWATER FLOWS AND POLLUTANT LOADS 3.1 INTRODUCTION This section presents the evaluation of current and projected wastewater flow for the City of uth. This evaluation is limited to existing data sources, including wastewater treatment plant, pumping station and CSO flow records, climatological data, previous engineering reports, and water sewer billing records, and population projections by the Office of State Planning and the City Planning Department. Field activities such as flow isolation and instantaneous flow measurement were not included in the scope of this study, however, targeted flow monitoring in some of the major combined sewer basins has been performed by the City to determine the most significant sources of inflow to the major trunk lines. These measurements have been used to better prioritize projects. The City purchased two in-line flow measuring devices and is continuing the flow monitoring efforts throughout the City. 3.2 METHODOLOGY Population Projections Population projections are used as a basis for estimating future wastewater flows, which in turn identifies future capacity needs. The 1977 Wastewater Facilities Planning Study evaluated a planning area that included uth, New Castle, Rye, and Greenland. For the purpose of this update, we have evaluated the same planning area. Unlike the 1977 Study, population projections for this update focus on the City of uth. Letters were sent to Rye, New Castle and Greenland informing them of the update. The letters also informed the towns that if they wanted to request sewerage capacity they must inform the City of uth. At this time no response has been received from these towns. However, the assumptions used in the plan are based on recent discussions the City has had with surrounding communities, past reports and Underwood Engineers, Inc Facilities Plan Update C:\Program Files\Adobe\Acrobat 4.0\Acrobat\plug_ins\OpenAll\Transform\temp\Sec3.doc
35 existing municipal service agreements to project these towns future wastewater needs which could be included in the City s system. uth population projections were performed using existing and past population projections, land use ordinances, present land use and reasonably expected changes, historical demographic data and ongoing local, regional and state planning efforts. In addition, input from City planning personnel was solicited during the data collection phase and a draft copy of this Section was submitted to the Department of Public Works for review and their comments have been incorporated into this document Wastewater Flow and Load Projections The City s wastewater comes from three general sources: sanitary flow from residential, commercial and industrial sources; inflow and infiltration (I/I) from indirect sources such as ground water, storm drains, cellar sump pumps, and broken pipes; and septage which is trucked to the plant. Existing wastewater flows were estimated using City water and sewer billing and Tax Assessor s records, Peirce Island treatment plant records and data from the two remaining licensed CSOs located at the South Mill Pond (see Plate 1). Future wastewater flow for the City was based on a review of available City topography, zoning, tax maps, City planning documents and Office of State Planning population projections. Infiltration and inflow values were estimated using water and sewer billing, treatment plant and CSO data. Septage flows were estimated using a year s worth of data provided by WWTP staff Existing Flows Water and sewer billing records (FY 1997), and Tax Assessor s records provided by the City were used to determine the average and peak sanitary sewage flows for residential homes (single family, mobile home and apartments), and commercial and industrial flows (Table 3-1). Total existing wastewater flow was estimated using treatment plant data and CSO data for the last three years (1995 to 1998). Underwood Engineers, Inc Facilities Plan Update C:\Program Files\Adobe\Acrobat 4.0\Acrobat\plug_ins\OpenAll\Transform\temp\Sec3.doc
36 TABLE 3-1 AVERAGE WASTEWATER PER USER TYPE Residential Home 1 Mobile Home 2 Apartment/Condo 2 Commercial 1 Industrial 1 Typical Average Daily Flow 250 gpd 100 gpd 150 gpd 900 gpd 6444 gpd 1. From City Water and Sewer Billing Account summary (Appendix 3-2, Attachment 1) 2. From City Water and Sewer Billing Records Future Flows Future wastewater flows for the planning area were determined using population projections and buildout projections. Population projections were based on the Office of State Planning s most recent projections. Build-out projections for this evaluation were based on the existing Zoning Ordinance and on the 1995 City Tax maps. Wetlands shown on the Tax maps were subtracted from the total lot areas to determine buildable land. The build-out flow projection assumed only buildable undeveloped land would be developed to its maximum allowable density. Existing residential, commercial and industrial flows from developed areas would remain constant. Once the total buildable acres were estimated, the number of units for each zone was determined using the minimum lot sizes from the current zoning ordinances. Once the number of buildable units per zone was determined, the average flows estimated from water use records (Table 3-1) were used to project future flows (Appendix 3-2 Attachment 2). Underwood Engineers, Inc Facilities Plan Update C:\Program Files\Adobe\Acrobat 4.0\Acrobat\plug_ins\OpenAll\Transform\temp\Sec3.doc
37 In addition to buildable land, some existing non-sewered homes were assumed to be sewered at some point in the future. The amount of potential flow from existing homes is presented in Appendix 3-2. Flow allocation of the projected flows to specific basins was done during the collection system evaluation phase of the 201 Facilities Plan Update. Flow allocation was based in part on the input from the planning department and review of existing or proposed subdivisions. Currently most of the septage disposed of at the Peirce Island WWTP is from uth or New Castle. For this reason and the fact that the number of existing homes on subsurface disposal system was assumed to be relatively constant, (some new development with septic systems and some older homes tying into the sewer system) septage flows were assumed to be constant in the future Wastewater Flows from Surrounding Towns Estimated future flow from the Town of Rye was obtained from the 1996 Route 1 Sewer Extension Study prepared by CMA Engineers (Appendix 3-2, Attachment 4). The current flow allocation listed in the municipal services agreement between the City of uth and the Town of New Castle was assumed to be constant for future flows since they are currently projected to remain below their allotted capacity of 180,000 gpd (Appendix 3-2) in the future. With the exception of the Exit 3 truck stop (Travel Port Of America) along Route 33, the Town of Greenland has not expressed interest in sewering any part of Greenland Inflow and Infiltration Inflow and infiltration (I/I) are excess flow that enters the collection system through direct connections such as storm drains (inflow) or through cracked pipes or leaking pipe joints (infiltration). As previously stated, much of the City s downtown area is comprised of combined stormwater/sewage collection, which contributes a significant portion of the peak flows within the collection system. Underwood Engineers, Inc Facilities Plan Update C:\Program Files\Adobe\Acrobat 4.0\Acrobat\plug_ins\OpenAll\Transform\temp\Sec3.doc
38 This evaluation builds off of existing reports and information to indirectly determine I/I. Indirect estimates of I/I were developed using the Peirce Island WWTP and CSO flow records and estimated sanitary flow determined from sewer billing records. Ongoing sewer system upgrades and upgrades that have been identified as a result of this 201 Facilities Plan update will reduce future I/I. However, for the purpose of this evaluation it has been assumed that average daily I/I will remain constant. 3.3 POPULATION PROJECTION Based on direction from the City s planning department personnel, the Office of State Planning (OSP) population projections were used to estimate the future population. Table 3-2 shows the OSP projected populations for the towns of Greenland, New Castle, and Rye, and the City of uth. TABLE 3-2 OFFICE OF STATE PLANNING POPULATION PROJECTIONS Census Est. Pop Greenland 2,768 2,993 3,282 3,590 3,825 4,172 4,532 New Castle ,026 1,112 1,176 1,269 1,363 uth 25,925 22,830* 25,182 27,637 29,472 32,163 34,817 Rye 4,612 4,672 5,150 5,598 5,903 6,329 6,787 Based on Office of State Planning s October 1997 Population Projection. * Per uth s City Planning the 1996 estimate should be 20,856. Figure 3-1 shows the previous population projections from the 1977 Wastewater Facilities Planning Study along with the current OSP projections. With the exception of uth, the recent population projections for Rye, Greenland and New Castle are significantly lower than the 1977 Wastewater Facilities Planning Study. The difference in projections is due in part to changes in land use, zoning and actual growth pattern within these towns. Underwood Engineers, Inc Facilities Plan Update C:\Program Files\Adobe\Acrobat 4.0\Acrobat\plug_ins\OpenAll\Transform\temp\Sec3.doc
39 Growth projections for the City of uth assume an increase in population density to allow for an additional 12,000 residents by the year However, based on an evaluation of existing Underwood Engineers, Inc Facilities Plan Update C:\Program Files\Adobe\Acrobat 4.0\Acrobat\plug_ins\OpenAll\Transform\temp\Sec3.doc
40 buildable land within the City s residential zones, the available land can handle approximately 3,500 additional residents. This number assumes current zoning, number of people per home (2.4 people per home 1990 Census) and existing housing density remains constant. Likely the actual population growth will be somewhere between the OSP projections and what current zoning and housing density will allow. In addition to full time residents, the City s population increases daily by people who work within the City and people vacationing or shopping. This transient population is difficult to determine exactly, however, City Planning personnel estimate that transient population is approximately twice the full time population. Since the wastewater flow contributed by this transient population is variable, indirect measures were used to estimate their flow. Current peak transient population is estimated at 44,000. Future transient population is assumed to continue to be twice the full time population or approximately a peak of 70,000 people per day. Flow from this population is included as part of non-residential flow (i.e. commercial industrial). 3.4 EXISTING AND FUTURE FLOW PROJECTIONS As explained above, existing sanitary wastewater flows were determined using Water Billing and Tax Assessor s records. Existing total wastewater flows, both average daily and peak hourly, were determined using WWTP and CSO flow records. Future flows were estimated using projected population and by estimating the buildout potential of the City. In addition, a modified population buildout flow projection was prepared. This modified population buildout projection assumes residential flows are based on population growth and non-residential flows to be based on buildable land available. Table 3-3 summarizes the estimates of existing and future flows for the three approaches. A more detailed description of the calculations of these projections is presented in Appendix 3-2. These projected flows do not include future growth within the Pease International Tradeport, which will be covered in Section 7. Underwood Engineers, Inc Facilities Plan Update C:\Program Files\Adobe\Acrobat 4.0\Acrobat\plug_ins\OpenAll\Transform\temp\Sec3.doc
41 Based on discussions with the City Planning Department it is our opinion that the build-out projection is the most representative of future growth for the City. Table 3-4 presents a more detailed breakdown of the buildout projection for the years 2010 and These values are what have been used for the remainder of this 201 Facilities Plan Update. Based on direction from City Staff it was assumed that future peak flow to Peirce Island would remain at 22 mgd. TABLE 3-3 EXISTING AND FUTURE FLOWS (Million gallons per day) Population Based Flow Projections Buildout Based Flow Projections Modified Population Buildout Based Flow Projections Total Sanitary Flow Estimated Average I/I Total Annual Average Daily Flow Peaking Factor for Sanitary Flow Peak Sanitary Flow Peak I/I Total Peak Hourly Flow (mgd) From Water Use and Tax Assessor s records. (includes New Castle and Rye). 2. Peaking factors were determined from M&E Wastewater Engineering Third Ed. Table 5-1 as required by NHDES.. 3. From 1996 Route 1 Sewer Extension Study (Appendix 3-2). 4. From Peirce Island Treatment Plant Records 5 From Exit 3 Truck Stop Projections 3.5 PRESENT AND FUTURE ORGANIC LOADS The Peirce Island WWTP is an advanced primary treatment system. Organic wastes present in the wastewater are removed by settling in the primary clarifiers and by filtration in the sand filter. An increase in the quantity of wastewater or a change in treatment process will increase the amount of organic waste that must be removed for the plant to meet EPA National Pollution Discharge Elimination System (NPDES) permit requirements. Treatment plant data from 1995 to 1999 was reviewed to determine the average strength of uth s wastewater. Table 3-5 Underwood Engineers, Inc Facilities Plan Update C:\Program Files\Adobe\Acrobat 4.0\Acrobat\plug_ins\OpenAll\Transform\temp\Sec3.doc
42 lists the annual average influent BOD 5, and TSS, peak week and peak month s average influent BOD 5, and TSS. Underwood Engineers, Inc Facilities Plan Update C:\Program Files\Adobe\Acrobat 4.0\Acrobat\plug_ins\OpenAll\Transform\temp\Sec3.doc
43 TABLE 3-4 BUILDOUT FLOW PROJECTIONS (Million gallons per day) Buildout Based Flow Projections (mgd) Residential uth Rye New Castle Greenland Homes on Septic to be Sewered Septage Non Residential uth Rye New Castle 1 Greenland Total Sanitary Flow Estimated Average I/I Total Annual Average Daily Flow Peaking Factor for Sanitary Flow Peak Sanitary Flow I/I 6 uth Rye New Castle Greenland Total Peak Hourly Flow generated (mgd) Total Peak Hourly Flow to WWTP (mgd) From Water Use and Tax Assessor s records. (Appendix 3-2, includes New Castle and Rye). 2. Peaking factors were determined from M&E Wastewater Engineering Third Ed. Table 5-1 as required by NHDES. (Appendix 3-2). 3. From 1996 Route 1 Sewer Extension Study (Appendix 3-2). 4. From Peirce Island Treatment Plant Records (Appendix 3-2) 5 From Exit 3 Truck Stop Projections. 6 It is the City of uth s intent to reduce I/I over the next 20 years therefore it is assumed that these flows will be worst case scenario. Underwood Engineers, Inc Facilities Plan Update C:\Program Files\Adobe\Acrobat 4.0\Acrobat\plug_ins\OpenAll\Transform\temp\Sec3.doc
44 TABLE 3-5 CURRENT AVERAGE INFLUENT BOD 5 AND TSS TO PEIRCE ISLAND WWTP 1 Pounds per Day Average Daily BOD 5 Annual 5,409 Peak Week 12,811 Peak Month 8,988 Average Daily TSS Annual 5,177 Peak Week 11,782 Peak Month 7, Appendix 3-3 Future Organic loads were estimated by performing a mass balance on existing flows and assuming I/I had a concentration of zero BOD 5, and TSS. Therefore, all of the organic load was from the 2.1 mgd sanitary flow. Using this approach an average BOD 5, and TSS concentration for the sanitary portion of the City s wastewater was determined to be 307 mg/l and 294 mg/l respectively. A percent ranking of current BOD 5 and TSS loading are shown in Appendix 3-3. These values were used along with projected future sanitary flows to project future organic loads to the Peirce Island WWTP. In addition, a pilot study using chemical addition to improve removal efficiency of the primary clarifiers is currently underway at the WWTP. This process will increase the total amount of suspended solids. It has been assumed for this evaluation that an average of 20 gallons ferric chloride polymer blend per million gallons of wastewater will be the dosage used. Actual dosage will vary depending upon the time of year and the influent BOD 5 Underwood Engineers, Inc Facilities Plan Update C:\Program Files\Adobe\Acrobat 4.0\Acrobat\plug_ins\OpenAll\Transform\temp\Sec3.doc
45 concentrations. Table 3-6 lists the projected future average annual, peak week and peak month BOD 5, and TSS loads as well as the loads with the addition of the ferric chloride polymer blend. TABLE 3-6 FUTURE ORGANIC LOAD (Pounds per Day) Average Daily BOD 5 5,410 7,630 9,880 Average Daily TSS 5,180 7,306 9,465 Average Daily TSS W/Chemical Addition 5,490 7,710 9,920 Max. Week BOD 5 12,810 18,080 23,420 Max. Week TSS 11,780 16,660 21,580 Max. Week TSS W/Chemical Addition 12,520 17,600 22,660 Max. Month BOD 5 8,990 12,670 16,400 Max. Month TSS 7,110 10,000 12,970 Max. Month TSS W/Chemical Addition 7,620 10,660 13, SUMMARY Because of its speculative nature, projection of future flows and loads vary greatly with the assumptions made. City planning has indicated that the Office of State Planning population projections were likely too high. Therefore, buildout projections using current zoning and assuming existing developed areas would remain constant were used to predict future flows. The data presented here is the starting point from which the entire collection system and Peirce Island WWTP has been evaluated. Existing flows and loads are based on the data provided by the City and have been assumed to reflect actual conditions. Future flows may vary significantly Underwood Engineers, Inc Facilities Plan Update C:\Program Files\Adobe\Acrobat 4.0\Acrobat\plug_ins\OpenAll\Transform\temp\Sec3.doc
46 depending upon the actual pattern of development and upon the success of the on-going efforts by the City to reduce extraneous flows from the City s collection system. As separation projects are completed the City should revisit flow projections to determine how actual flows are tracking. For the purpose of this 201 Facilities Plan Update we have used the values presented in Tables 3-4 and 3-6. Underwood Engineers, Inc Facilities Plan Update C:\Program Files\Adobe\Acrobat 4.0\Acrobat\plug_ins\OpenAll\Transform\temp\Sec3.doc
47
48 SECTION 4 EVALUATION OF COLLECTION SYSTEM EXISTING AND FUTURE FLOWS 4.1 GENERAL As part of the 201 Facilities Plan Update, the collection system including the pumping stations was evaluated to determine current and future capacity limitations. 4.2 COLLECTION SYSTEM EVALUATION Methodology As part of the evaluation of the City of uth s collection system, Underwood Engineers Inc. reviewed existing problem areas, performed site visits during storm events and tidal inflow events, and modeled the main interceptors within the collection system. In general, the approach used was a desktop analysis. The evaluation used available data collected by the wastewater treatment plant, collection system, and department of public works staff. A sewer system evaluation survey (SSES) was not performed as part of this update. However, as discussed below, and as part of the preliminary design, the City should perform an SSES in areas targeted for I/I removal Hydraulic Modeling The modeling effort looked at the major interceptors throughout the City as shown on Plate 2. For ease of modeling each area was considered a separate basin. Where basins combine, such as Maplewood Basin flowing into the Brick Box Basin (MH 1499), the additional flow was added as a point source into that basin. The model uses a hydrograph, which represents a typical diurnal curve with a selectable peaking factor. Because we were modeling main interceptors only, our modeling effort assumed a peaking factor of 3.0 on domestic wastewater flows. The modeling effort did not include scenarios with storm flows. Based on site visits during two 100-year storm events October 1996 and June 1998, it was determined that the combined areas of the collection systems are inadequate to handle these rain events. Flooding and sewage backups Underwood Engineers, Inc Facilities Plan Update C:\Program Files\Adobe\Acrobat 4.0\Acrobat\plug_ins\OpenAll\Transform\temp\785sec4.doc
49 resulted from these significant storm events. We assumed a long-term program of targeted sewer separation to reduce storm related flooding and backups and therefore focused on capacity of interceptors to handle peak sanitary and average infiltration flows which represent the typical dry weather conditions seen by the collection system. The input variables for the different types of pipe modeled are listed in the model run output in Appendix 4-1. The model flagged sections of pipe as a problem if the pipe was determined to be flowing greater than 90% full. Direct measurement of infiltration and inflow (I/I) were not done as a part of this evaluation. Indirect measurements were done by taking the annual average daily flow measured at the WWTP and CSO structures and subtracting the average sanitary flow based on wastewater billing records. This average I/I was distributed throughout the collection system based on the proportion of sanitary flow coming from each sub-sewer basin compared to the total City s sanitary flow. For example: The City s average daily sanitary flow is 2.1 mgd and average daily I/I is 3.4 mgd (See Section 3). If the sanitary flow from a sub-basin is 1 mgd then its I/I would be 1 mgd/2.1 mgd * 3.4 = 1.6 mgd. Appendix 4-2 shows the allocation of sanitary flow and I/I throughout the City. Existing sanitary flow was allocated throughout the City s collection system by house counts and review of water use records. Flows for each sub-basin were totaled and input at the head of each section of interceptor servicing that sub-basin. Future flows were input based on best engineering judgement. Limited verification of flow allocation was done using pump station flow and run times records Modeling Results The results of the modeling effort are presented below in a basin by basin approach. Based on the hydraulic evaluation a number of sections within each basin were identified as needing upgrades. The results are broken into existing sanitary with no I/I, existing sanitary with I/I, and future sanitary with I/I. Underwood Engineers, Inc Facilities Plan Update C:\Program Files\Adobe\Acrobat 4.0\Acrobat\plug_ins\OpenAll\Transform\temp\785sec4.doc
50 Lafayette Basin Figure 4-1 shows the extent of this sewer basin, which includes all areas south of the Sagamore Creek as well as areas south of Middle Road. The City owns and operates 7 pumping stations and a siphon structure which crosses the Sagamore Creek within this basin. In addition, there are a number of private pumping stations which discharge to the collection system. All of the flow from this basin is pumped by the Lafayette Street Pumping Station to a discharge manhole near the intersection of Lafayette Road and South Street. Based on the hydraulic evaluation performed as part of this 201 Facilities Plan Update a number of sections of the main interceptor were identified as needing capacity upgrades. The problems areas are broken into existing sanitary no I/I, existing sanitary with I/I, and future sanitary with I/I. Existing Sanitary no I/I Based on the modeling results there is one section of pipe that is near or at capacity at existing peak sanitary flows without I/I. This sections is: There is one 320 ft section of 14-inch AC pipe exceeds the 90% of pipe depth. This section of pipe is located along a cross-country run near Cedar Boulevard and Spring Brook Condominiums between manholes 155 and 156. Existing Sanitary with I/I Based on the modeling results there are a number of sections of pipe that are near or at capacity at existing peak sanitary flows with I/I. These sections are: A 3,850 ft section of 14 inch AC pipe. This section of pipe is located along a cross-country run near Cedar Boulevard and Spring Brook Condominiums between manholes 152 and 167. A 300 ft section of 14 inch AC pipe. This section of pipe is located between manholes 275 and 284 in Elwyin Park. Underwood Engineers, Inc Facilities Plan Update C:\Program Files\Adobe\Acrobat 4.0\Acrobat\plug_ins\OpenAll\Transform\temp\785sec4.doc
51 A 975 ft section of 14 inch AC pipe. This section of pipe is located between manholes 285 and 255 in Elwyin Park. A 225 ft section of 14 inch AC pipe. This section of pipe is located between manholes 224 and 221 in Elwyin Park. Insert Figure 4-1 Underwood Engineers, Inc Facilities Plan Update C:\Program Files\Adobe\Acrobat 4.0\Acrobat\plug_ins\OpenAll\Transform\temp\785sec4.doc
52 A 245 ft section of 18 inch AC pipe. This section of pipe is located between manholes 342 and 343 in the Urban Forestry Center. A 517 ft section of 18 inch AC pipe. This section of pipe is located between manholes 346 and 347 in the Urban Forestry Center. A 323 ft section of 18 inch AC pipe. This section of pipe is located between manholes 351 and 352 near Sagamore Creek on Route 1. A 170 ft section of 18 inch AC pipe. This section of pipe is located between manholes 354 and 355 on Route 1 just before the Lafayette pumping station. Future Sanitary with I/I Based on modeling results the main interceptor (17,000 feet) from the Rye Line pumping station discharge manhole to the Lafayette pumping station will require upgrading at future flows. A previous report (CMA 1996) has indicated that sections of this line were currently at capacity and would require upgrade to deal with future flows. In addition, significant I/I has been identified as coming from the Hillcrest Trailer Park. The area should be investigated to determine the source of this I/I. The additional flow from this area takes up needed capacity at the Rye Line Pumping Station and the interceptor through Elwyn Park area Box Sewer Basin Figures 4-2 and 4-3 shows the extent of this sewer basin. The Box Sewer Basin extends approximately 12,000 feet from the Deer Street pumping station to Panaway Manor. The City owns and operates one (1) pumping station that directly discharges to this basin. In addition, the Maplewood Sewer Basin and the Leslie Drive Sewer Basin discharge directly to the Box Sewer Basin. All of the flow from this basin is pumped by the Deer Street pumping station to a discharge manhole on Marcy Street. The hydraulic evaluation performed as part of this 201 Facilities Plan Update determined a number of sections of the box sewer interceptor which were identified as needing upgrades. The Underwood Engineers, Inc Facilities Plan Update C:\Program Files\Adobe\Acrobat 4.0\Acrobat\plug_ins\OpenAll\Transform\temp\785sec4.doc
53 problems areas are broken into existing sanitary with no I/I, existing sanitary with I/I, and future sanitary with I/I. Insert Figure 4-2 Underwood Engineers, Inc Facilities Plan Update C:\Program Files\Adobe\Acrobat 4.0\Acrobat\plug_ins\OpenAll\Transform\temp\785sec4.doc
54 Insert figure 4-3 Underwood Engineers, Inc Facilities Plan Update C:\Program Files\Adobe\Acrobat 4.0\Acrobat\plug_ins\OpenAll\Transform\temp\785sec4.doc
55 Existing Sanitary no I/I Based on the modeling results there are no capacity problems at current flows with out I/I. Existing Sanitary with I/I Based on the modeling results there are no capacity problems at current flows with a infiltration. Future Sanitary with I/I Based on the modeling results there is a future capacity problem from manhole 522 to Manhole This section of 12 - inch pipe runs from Bartlett Street to the Gray Medical Building off Borthwick Ave. A Previous report by Kimball Chase in 1984 indicated that this section of pipe was the source of approximately 300,000 gallons of infiltration and should be replaced Maplewood Ave Sewer Basin Figure 4-4 shows the extent of this sewer basin. The Maplewood Ave Sewer Basin extends approximately 14,000 feet from manhole 1499 at the intersection of Maplewood Ave and Deer Street to discharge of the Gosling Road pumping station at manhole 657. The City owns and operates 1 pumping station that directly discharges to this basin. The hydraulic evaluation performed as part of this 201 Facilities Plan Update determined a number of sections of the Maplewood Ave Sewer Basin interceptor which were identified as needing upgrades. Existing Sanitary no I/I Based on the modeling results there is one section of 220 foot length of pipe between manholes 786 and 787 on New Franklin Street that shows capacity problems at current peak sanitary flows without any I/I. Underwood Engineers, Inc Facilities Plan Update C:\Program Files\Adobe\Acrobat 4.0\Acrobat\plug_ins\OpenAll\Transform\temp\785sec4.doc
56 Insert Figure 4-4 Underwood Engineers, Inc Facilities Plan Update C:\Program Files\Adobe\Acrobat 4.0\Acrobat\plug_ins\OpenAll\Transform\temp\785sec4.doc
57 Existing Sanitary with I/I, Based on the modeling results there are two sections of pipe that are near or at capacity at existing peak sanitary flows with I/I. These sections are: A 600 foot section of 14-inch AC pipe from manhole 780 to manhole 787 on New Franklin Street. A 375 foot section of 24-inch RC pipe from manhole 1473 to manhole 1475 on Maplewood Avenue. Future Sanitary with I/I Based on the modeling results there are two sections of pipe that are near or at capacity at future peak sanitary flows with I/I. These sections are: A 900 foot section of 14-inch AC pipe from manhole 779 to manhole 787 on New Franklin Street. A 170 foot section of 14-inch AC pipe between manhole 789 and manhole 809 on Burkitt Street. A 210 foot section of 21-inch RC pipe between manhole 1461 and manhole 1463 on Maplewood Avenue. A 375 foot section of 24-inch RC pipe from manhole 1473 to manhole 1475 on Maplewood Avenue Southern Portion of the Mechanic Street Sewer Basin Figure 4-5 shows the extent of this sewer basin. This basin extends approximately 5,250 feet from manhole 844 near the intersection of South Street and Lafayette to the Lincoln vault on Richards Avenue. The hydraulic evaluation performed as part of this 201 Facilities Plan Update determined a number of sections of this Sewer Basin interceptor, which were identified as needing upgrades. Underwood Engineers, Inc Facilities Plan Update C:\Program Files\Adobe\Acrobat 4.0\Acrobat\plug_ins\OpenAll\Transform\temp\785sec4.doc
58 Existing Sanitary no I/I, Based on the modeling results there is one 280 foot section 15-inch VC pipe between manholes 850 and 855 on Willard Ave, Ash Street and Orchard Street that shows capacity problems at current peak sanitary flows without average I/I. Existing Sanitary with I/I, Based on the modeling results there is one 1,200 foot section 15-inch VC pipe between manholes 851 and 853 on Ash Street that shows capacity problems at current peak sanitary flows with any I/I. Underwood Engineers, Inc Facilities Plan Update C:\Program Files\Adobe\Acrobat 4.0\Acrobat\plug_ins\OpenAll\Transform\temp\785sec4.doc
59 Insert Figure 4-5 Underwood Engineers, Inc Facilities Plan Update C:\Program Files\Adobe\Acrobat 4.0\Acrobat\plug_ins\OpenAll\Transform\temp\785sec4.doc
60 Future Sanitary with I/I Based on the modeling results there are three sections of pipe that are near or at capacity at future peak sanitary flows with I/I. These sections are: A 1,700 foot section of 15-inch VC pipe from manhole 849 to manhole 550 on Willard Ave, Ash Street and Orchard Street.. A 265 foot section of 30-inch brick pipe between manhole 859 and manhole 860 off of Wibird Street A 200 foot section of 21-inch RC pipe between manhole 862 and manhole 863 between Broad and Union Street Leslie Drive Sewer Basin Figure 4-6 shows the extent of this sewer basin. This basin extends approximately 1,700 feet from Leslie Drive pumping station discharge manhole (MH 1531) to the Deer Street pumping station. The hydraulic evaluation performed as part of this 201 Facilities Plan Update determined a number of sections of this Sewer Basin interceptor which were identified as needing upgrades. Existing Sanitary no I/I Based on the modeling results there are no capacity problems at current flows with out I/I. Existing Sanitary with I/I Based on the modeling results there are no capacity problems at current flows with I/I. Future Sanitary with I/I Based on the modeling results there are no capacity problems at future flows with I/I. Underwood Engineers, Inc Facilities Plan Update C:\Program Files\Adobe\Acrobat 4.0\Acrobat\plug_ins\OpenAll\Transform\temp\785sec4.doc
61 INSERT FIGURE 4-6 Underwood Engineers, Inc Facilities Plan Update C:\Program Files\Adobe\Acrobat 4.0\Acrobat\plug_ins\OpenAll\Transform\temp\785sec4.doc
62 Known Collection System Problem Areas Based on meetings with collection system personnel, targeted flow monitoring by the City and site visits during storm events, a number of problem areas within the collection system were identified. The following is a brief summary of the findings. Due to the complexity of uth s collection system, cause and effect are often difficult to determine, flooding in one area may be caused by a restriction in another area that is perceived to be unrelated. This section covers the major problem areas within the collection system. Particular problems may be lumped into a general area. Table 4-1 lists the major areas of problems within the City and shown on Plate 2. Underwood Engineers, Inc Facilities Plan Update C:\Program Files\Adobe\Acrobat 4.0\Acrobat\plug_ins\OpenAll\Transform\temp\785sec4.doc
63 TABLE 4-1 SUMMARY OF KNOWN SEWAGE COLLECTION SYSTEM PROBLEM AREAS NO. PROBLEM LOCATION PROBLEM DESCRIPTION CS-1. Gosling Road Area Area sewers surcharge when pumping station is overloaded during heavy rains. DPW suspects inflow from roof leaders. Two thirds of basin collection system is vitrified clay pipe. Grease problem sometimes from Kentucky Fried Chicken on Woodbury Ave. CS-2. Atlantic Heights During peak groundwater levels and rain storms, pumping station backs up due to sump pump tie ins and roof leaders. CS-3. Marsh Lane Area Dearborn Place Significant tidal inflow through sewer service laterals. Pumping Station CS-4. Woodlawn Circle at Hillcrest Drive Area sewers surcharge sometimes during heavy rain. Pipe transitions from steep to shallow pitch in this area. Fairview Drive at Woodbury Ave end surcharges sometimes at very heavy rains by Betty s Dream. Pipe size reduction may contribute to problem. CS-5. Onyx to Opal Suspected root problems. CS-6. Dennett, Thornton, Sparhawk, Burkitt Street Area Cross connection to drain at MH 1432 Sewer surcharging during heavy rains. Some combined sections remain. Line on Thornton Street over to Mill Pond Way has a root problem. CS-7. Dennett and Stark Street Surcharging sewers during heavy rains. CS-8. Maplewood to Dennett Street Stays full during periods when Deer Street Station is cut back and box sewer surcharges. CS-9 Panaway Manor/Sherburne Road & The whole area has vitrified clay pipes and a lot of CS-10. Holly Lane root and I/I problems. CS-11. Borthwick Avenue from Bartlet Street to Gray Building Has very serious grease problem, made worse by a stretch of old pipe that is smaller in diameter and taking in a large amount of inflow (identified in previous Kimball-Chase report). CS-12. Essex Avenue Area Combined sewers, I/I problems Root problem between Essex and Sheffield CS-13. Thaxter Street Area Sewers backup/flood on a regular basis. The sewer line starts at the edge of the swamp at Fells Road. The main on Thaxter is 2/3 blocked with roots. CS-14. Albany Street, Cass Street, Lovell This area is a low spot sewers backup and flood Street regularly (some of it is separated). CS-15. Bartlett RR Bridge Storm drains and sewer lines in this area surcharge during high rain events. CS-16. Streets between Islington Street and Surcharge problems related to brick box sewer the North Mill Pond backups. CS-17. Brewster Street Surcharge problems related to brick box sewer backups. Area has combined sewers. Underwood Engineers, Inc Facilities Plan Update C:\Program Files\Adobe\Acrobat 4.0\Acrobat\plug_ins\OpenAll\Transform\temp\785sec4.doc
64 CS-18. Madison, Union, Cabot (Middle Sewers in this area surcharge during wet weather. Street ends) Deteriorated pipe, root problems. NO. PROBLEM LOCATION PROBLEM DESCRIPTION CS-19. Willard, Ash and Orchard This area has experienced sewer surcharging and sewerage in basements during high rain events. This area is not separated. CS-20. Lincoln Avenue Middle Street End This area is low lying and is not separated. Sewer backs up regularly. CS-21. Lincoln Avenue, Richards Avenue This area is not separated and sewer floods regularly. End CS-22. Miller Avenue at Rockland This area is not separated and sewer floods regularly CS-23. Deer Street, Tide Chamber Overflow weir may be a CSO during wet weather. Significant river inflow at high tides. Knife gates for bypass need to be replaced leaking. Install flap valve in overflow over knife gates. CS-24. Ceres Street Area CSO Grease problem from the restaurants. Sewer backs up regularly from Deer Street pumping station. One overflow at MH 1586 by Tugboats. CS-25. Marcy Street by Dunaway Store Peak rainfall combined with high tide makes this areas sewers back up once in a while. Sewage in basement of Dunaway Store. Potential exfiltration. By-pass gate manhole needs more permanent fixture. CS-26. Marcy Street Pump Station Area Problem in pipe just outside wetwell needs to be fixed. Plug in pipe. CS-27. Maplehaven Area Possible infiltration through VC pipe in conservation area. CS-28. Elwyn Park Possible infiltration through AC pipe. CS-29. Lafayette Road at Mirona Road Sewer line in Urban Forestry overflows when Lafayette pumping station flow is reduced. CS-30. Downtown area around State Street Needs to be separated completely. Drainage and Penhallow Area sewer cross-connected. CS-31. Downtown Combined sewers. CS-32. Summer Street at Middle Whole system is concrete pipe (Denny Shay) pipe running through open catch basins. Odor problem. CS-33. Miller Avenue across to Old main collapsed. Need to discontinue and tie Richards Avenue houses to close by main lines? CS-34. Main line through Strawberry Bank Possible infiltration, old pipe. CS-35. Gate Street Main line needs replacing someday, old V.C. pipe. CS-36. Cabot Street Sewer State St. end 21" Denny shay pipe is in very bad shape (cracked to McDonough and part of the bottom is gone in places). CS-37. Court Street Area Combined sewers. CS-38. Brackett Road and Brackett Lane This area is very flat and needs to be looked at. Existing homes not on city sewer with failing septic Clough Drive is clay pipe with roots and infiltration problems CS-39. Broad Street and Rockland Area sewers flood with heavy rain. CS-40. Bridge Street at Hill Street Sewerage overflow related to brick box surcharges. CS-41. CSO 10B The tide structure that discharges to the South Mill Pond needs repair. The embankment is eroded and is a safety hazard. Underwood Engineers, Inc Facilities Plan Update C:\Program Files\Adobe\Acrobat 4.0\Acrobat\plug_ins\OpenAll\Transform\temp\785sec4.doc
65 The tide structure needs a flap valve. Currently there is a significant amount of seawater inflow during high tides. NO. PROBLEM LOCATION PROBLEM DESCRIPTION CS-42 Clinton Street The DES has identified a cross connection to a storm drain that is causing fecal coliform counts to be measured at the storm pipe discharge. CS-43. Leslie Drive area The DES has identified a cross connection to a storm drain that is causing fecal coliform counts to be measured at the storm pipe that discharges to the North Mill Pond. CS-44. Rockland Leary Field Manholes surcharge during high rain events. This problem is likely connected to the backup on Parrot Ave and the CSOs CS-45 CSO at State and Marcy Manhole 1618 is connected to drain to river CS-46 Mechanic Street P.S. by-pass By-pass at Mechanic Street pumping station allows tidal inflow, requires stop logs CS-47 CSO 10A The active combined sewer overflow CS-48 Cross-country sewer, near Sewer is at or near capacity requires upgrade Springbrook Condos CS-49 Failed Septic, Elwyn Road Homes with failed septic systems CS-50 Failed Septic, Sagamore Avenue Homes with failed septic systems South of Bridge CS-51 Failed Septic, Sagamore Avenue Homes with failed septic systems North of Bridge CS-52 Failed Septic, Brackett Road Homes with failed septic systems CS-53 Failed Septic, McGee Drive Homes with failed septic systems CS-54 Hillcrest Mobil Home Park Excess I/I contribution to capacity problems at the Rye Line Pumping Station * Project completed by City during preparation of 201 update. Underwood Engineers, Inc Facilities Plan Update C:\Program Files\Adobe\Acrobat 4.0\Acrobat\plug_ins\OpenAll\Transform\temp\785sec4.doc
66 Tidal Inflow and By-pass Structures As part of the collection system evaluation a number of sources of tidal inflow were determined to be contributing a significant amount salt water flow from the river to the pumping stations and to the Peirce Island WWTP. In addition to taking up needed capacity, salt water causes additional wear and tear on equipment due to corrosion. The following is a brief description of the areas of tidal inflow. Tidal inflow at several locations including the Deer Street tide chamber, CSO 10B, and the Mechanic Street pump station result in higher flow measurements at the pump stations than are being generated within the collection system. The result of this tidal inflow is capacity limitations within the system during the most critical times of heavy rains and storm tides. Based on a evaluation of the Deer Street tide chamber overflow, normal tidal cycles will result in approximately 43 inflow events per year. Storm tides will increase the number and duration of inflow events as well. Under the normal tidal cycles, inflow rates will range from 180 gpm to 8,000 gpm, again with storm tides increasing the flow rates and duration of inflow. The design capacity of the Deer Street pump station is 8,800 gpm. During heavy rain storms with high tides, the entire pump station capacity will be needed to pump river water to the WWTP resulting is sewage backups. Similarly for CSO 10B, inflow during storm tides, when the collection system is already beyond capacity, floods the collection system in the vicinity of South Mill Pond and causes backups within the system. We have also observed tidal inflow at the Mechanic Street pump station overflow where stop logs are missing. These inflow sources are known problems in the collection system, which require relatively low cost/low technology solutions (flap gates and stop logs). Since the start of this 201 Facilities Plan update the City has installed tide gates at the Deer Street Tide Chamber and at CSO 10B. In addition, the inflow source at the Mechanic Street pumping station has been corrected. In addition to sewer structures which allow seawater into the collection system, the Marcy Street by-pass structure is maintained as an emergency relief to avoid flooding if the CSOs 10A and 10B and the Mechanic Street pumping station can not keep up with the flows. The by-pass structure is located on Marcy Street adjacent to the Dunaway Store in Strawberry Banke. The by- Underwood Engineers, Inc Facilities Plan Update C:\Program Files\Adobe\Acrobat 4.0\Acrobat\plug_ins\OpenAll\Transform\temp\785sec4.doc
67 pass is a steel flap gate that is wedged shut with a 2 by 4. This by-pass is used only during extreme conditions or during equipment failures at the Mechanic Street pumping station. This by-pass is not anticipated to be needed in the future as a result of collection system improvements performed by the City in Combined Sewer Overflows In addition to the two licensed CSOs this evaluation identified four other overflow or cross connection. This CSOs are brief described below Deer Street Tide Chamber The Deer Street Tide Chamber is located adjacent to the Deer Street pumping station in front of Granite State Minerals. The vault currently has two butterfly valves for sewage by-pass and a high level overflow. As discussed above, tidal inflow through this overflow has been identified as a source of excess flow. The tidal inflow has been minimized by the installation of the tide gate. However, the potential for overflow is still present. The frequency and quantity of overflows at this CSO location is not known due to lack of monitoring equipment. In anticipation of requirements from EPA and DES, the City has been installed flow monitoring equipment and a rain gauge at this location Burkitt and Dennett As part of this report a cross connection between a sanitary sewer manhole and a storm drain was located at manhole number 1432 at the intersection of Burkitt Street and Dennett Street. The frequency and quantity of overflow at this CSO location is not known due to lack of monitoring equipment. Improvements require eliminating this cross connection and performing the necessary storm water separation to eliminate flooding and back-up in this area. The City has indicated this work will be completed in 1999 Underwood Engineers, Inc Facilities Plan Update C:\Program Files\Adobe\Acrobat 4.0\Acrobat\plug_ins\OpenAll\Transform\temp\785sec4.doc
68 State and Marcy As part of this report a cross connection between a sanitary sewer manhole and a storm drain was located at manhole number 1618 at the intersection of State Street and Marcy Street. The frequency and quantity of overflow at this CSO location is not known due to lack of monitoring equipment. Improvements require eliminating this cross connection and performing the necessary storm water separation to eliminate flooding and back-up in this area Mechanic Street Pumping Station As discussed above the existing by-pass structure at the Mechanic Street pumping station is a source of significant tidal inflow. Hydraulically is does not appear that this by-pass will activate unless CSOs 10A and 10B are blocked. However, this should be confirmed by inspection during a peak rain event. In addition, in anticipation of requirements from EPA and DES flow monitoring equipment should be installed at this location. The City has installed stop logs at this structure which will help minimize the possibility of CSOs from occurring. 4.3 PUMPING STATIONS EVALUATION General Table 4-2 shows the pumping capacities of the pumping stations owned and operated by the City of uth. The City owns 15 constant speed pumping stations and three variable speed pumping stations. The pumping station evaluations included site visits, review of flow or run time records, review of maintenance records and pump drawdown tests performed by the City. In addition, the maintenance personnel responsible for the pumping stations were asked to prepare a problem list for the pumping stations (see Appendix 4-3). Capacity analysis for constant speed pumping stations is usually viewed in terms of pumping station pump run times, with a total run time of 12 hours or greater indicating a pumping station Underwood Engineers, Inc Facilities Plan Update C:\Program Files\Adobe\Acrobat 4.0\Acrobat\plug_ins\OpenAll\Transform\temp\785sec4.doc
69 that is at or near capacity. Because variable speed pumping stations run continuously capacity evaluations are more difficult and are based on the station s ability to handle peak flow. Table 4-3 shows the pump run times of the City s constant speed pumping stations. The following is a review of the pumping stations. TABLE 4-2 EXISTING PUMPING STATIONS Pumping Station Current Pump Capacity (1) Design Capacity, (gpm) Pump 1 Pump 2 Future Capacity Needs Atlantic Heights 43ft Peak Gosling Road 65.2 ft Marsh Lane 37 ft North West Street 40ft Deer Street 57 ft 6,700 (2) -- 8,800 Mill Pond Way 30 ft Mechanic Street 95 ft (3) 12,500 13,889 15,300 Marcy Street 44 ft Lafayette Road 111 ft 90 ft ,000 Woodlands I 38.5 ft Woodlands II 27.3 ft Constitution Avenue 67 ft Heritage Road 26 ft Rye Line 52 ft West Road 40 ft Leslie Drive 34 ft ,550 Underwood Engineers, Inc Facilities Plan Update C:\Program Files\Adobe\Acrobat 4.0\Acrobat\plug_ins\OpenAll\Transform\temp\785sec4.doc
70 Griffin Park 40 ft Tucker Cove (1) (2) (3) Based on drawdown tests performed by WWTP Personnel Magnetic flow meter indicates flow of 8.5 mgd 5,900 gpm Magnetic flow meter indicates peak flow of 16.5 mgd 11,500 gpm. TABLE 4-3 EXISTING PUMPING STATIONS AVERAGE AND PEAK RUN TIMES 1 Pumping Station Average Combined Pump Run Time (hrs) (2) Peak Combined Pump Run Time (hrs) (2) Atlantic Heights Gosling Road N/A N/A Marsh Lane North West Street Deer Street N/A N/A Mill Pond Way Mechanic Street N/A N/A Marcy Street Lafayette Road N/A N/A Woodlands I Woodlands II Constitution Avenue Heritage Road Rye Line N/A N/A West Road Leslie Drive Underwood Engineers, Inc Facilities Plan Update C:\Program Files\Adobe\Acrobat 4.0\Acrobat\plug_ins\OpenAll\Transform\temp\785sec4.doc
71 Griffin Park Tucker Cove N/A N/A 1. Based on run times collected by pump station maintenance personnel. 2. Combined run times are the total daily run time at the stations 3. (N/A) indicates that run times were not available or the stations have VFDs Mechanic Street The Mechanic Street pumping station pumps all the flow collected within the City of uth to the Peirce Island WWTP. The station is equipped with two submersible dry well mounted centrifugal pumps rated at 22 mgd. Flow enters the pumping station influent channel and passes through a 1-inch mechanically cleaned bar screen before it cascades into the wetwell below. The pumping station was designed to grind the collected screenings and discharged them back into the flow to be pumped to the Peirce Island WWTP. Both pumps were overhauled in the fall of Despite the recent overhaul, flow records show the Mechanic Street pumping station has not pumped at its design capacity since start-up. According to the station s in-line magnetic flow meter, the station s current capacity is approximately 16.5 to 20 mgd. depending upon which pump is operating. Due to the small wetwell volume, it is hard to confirm the actual output from the pumps with a pump drawdown unless conducted during a rain event. Because Mechanic Street pumping station is responsible for pumping all of the City s wastewater flow to the Peirce Island WWTP it is important that its pumps be maintained at their peak capacity. Due to the combined nature of the collection system, wastewater and storm flow exceed the pumps capacities during heavy rain events. If the rain event is sustained, flow backs-up within the collection system until it overflows at the South Mill Pond at CSOs 10A and 10B. To minimize the occurrence of CSO events, the pump capacity problem at the Mechanic Street pumping station should be further investigated and corrected if possible. Underwood Engineers, Inc Facilities Plan Update C:\Program Files\Adobe\Acrobat 4.0\Acrobat\plug_ins\OpenAll\Transform\temp\785sec4.doc
72 A limited desktop hydraulic evaluation was performed on the pump and piping configuration. Based on this evaluation it appears that the system head should be around 95 feet at 15,300 gpm (22 mgd) assuming a C value of 110. It is recommended that the operators check all of the valves along the force main to ensure none are partially closed. In addition, the VFDs for the pumps seem to be locked out at 56 hertz. This should be corrected to allow the pumps to run at 60 hertz. For the purposes of this report, it has been assumed for this evaluation that the existing capacity of the Mechanic Street pumping station will remain at 22 mgd in the future. The following is a list of the most significant problems at the Mechanic Street pumping station, a complete list is shown in Appendix 4-3. The Mechanic Street pumping station is a duplex station. Each pump is designed to handle the pump station capacity. Ideally a third pump should be provided for redundancy when one of the two main pumps is down for repair. General Problems Pump capacity problems. The existing grinder is not working. Lack of bypass pumping capability. By-pass stop gates in the influent channel don t allow maintenance on the one-inch bar screen. Odor control system upgrade (see memo Appendix 4-4). Equipment wear caused by grit from collection system Deer Street Pumping Station The Deer Street Pumping station pumps flow from the Box Sewer, Maplewood Ave, Gosling Road, Atlantic Heights and Leslie Drive sewer basins to the Mechanic Street Sewerage Drainage Area. Wastewater enters the influent channel and is macerated by a Worthington comminutor. The design capacity of the station is mgd at 57 feet of head. Recent drawdown tests indicate the actual capacity is around 9.75 mgd. This drawdown value was checked during a rain event to determine the head and flow conditions to see where the pump was running on its pump curve. Based on this check the pressure which the pump is pumping against is greater than the Underwood Engineers, Inc Facilities Plan Update C:\Program Files\Adobe\Acrobat 4.0\Acrobat\plug_ins\OpenAll\Transform\temp\785sec4.doc
73 57 feet it is rated for, which explains part of why the pumps are not pumping at the mgd they were designed for. The excess head may be due to build-up of solids in the force mains, a partially closed valve or complete closure of one of the two parallel force mains. This should be further investigated. Based on flow projections the current capacity of the Deer Street pumping station is adequate for future sanitary flows. Because sections of the drainage areas that flow to the Deer Street pumping station are still combined, the potential for flows greater than the pumping stations capacity will continue. Separation projects currently underway within the Brick Box Sewer Basin will help reduce excess flow. In addition, installation of a new tide gate at the Deer Street by-pass structure has eliminated significant tidal inflow and adds to available pump capacity (see attached Figure 4-7). Like the Mechanic Street pumping station, Deer Street is a duplex station. Each pump is designed to handle the pump station capacity. Ideally a third pump should be provided for redundancy when one of the two main pumps is down for repair. The following is a list of the major problems at the Deer Street pumping station. A more detailed problem list is included in Appendix 4-4. General Problems The existing comminutor is worn out. Lack of a bypass pump to cover periods when one of the main pumps is down. Controls that operate the pumps during low flows appear to bumping the pumps on and off short cycling the pumps. Controls may need to be modified to allow pump and fill operation at low flows. Pumps are not pumping at rated capacity. Odor control system is not working (see memo Appendix 4-4). Equipment wear caused by excess grit in collection system Marsh Lane (formerly Dearborn Place) Marsh Lane pumping station is a small grinder station that services 4 or 5 houses. The station has had significant salt-water infiltration since its installation. The salt-water intrusion has led to Underwood Engineers, Inc Facilities Plan Update C:\Program Files\Adobe\Acrobat 4.0\Acrobat\plug_ins\OpenAll\Transform\temp\785sec4.doc
74 excess wear on the pumps. The source of the infiltration has been determined to be the service laterals and the City has pursued rectifying the problem. Assuming the infiltration problem has been corrected the current capacity is adequate for present and future flows. General Problems Existing electrical box in wetwell is corroded. Salt-water intrusion. Draw down tests have shown the pumps are not pumping at their design capacity. Pumps should be troubleshooted to determine why North West Street Pumping Station The North West Street pumping station has no significant problems. Its current capacity is adequate for future flows Mill Pond Way (formerly Dearborn Extension) The Mill Pond Way pumping station services approximately 5 houses and should generate an approximate peak flow of 7,500 gallons per day at roughly 2.5 hours of pumping per day. Pump run times indicate periods of operation which exceed 12 hours per day. These excessive run times indicate significant I/I to the pumping station or problems with the pump controls. It appears that the excess run time is due to I/I, however this should be confirmed prior to performing any separation projects Atlantic Heights Pumping Station The Atlantic Heights pumping station was installed in 1986 as part of a sewer separation project. The separation covered the Atlantic Heights area. The entire drainage is reported to have been separated. However, pump station flow records and run times indicate excess flow at times (see Table 4-3). With the exception of the excess run times the pump station needs some minor repairs and electrical modifications. The pump capacity should be adequate for future wastewater flow, however, during periods of rain the station at or beyond pump capacity. General Problems Worn impellers and wear plates. Underwood Engineers, Inc Facilities Plan Update C:\Program Files\Adobe\Acrobat 4.0\Acrobat\plug_ins\OpenAll\Transform\temp\785sec4.doc
75 Only one pump will operate with the generator. This should be changed so either pump of the two pumps will operate with generator power. Flow recorder needs upgrading. Excess flows. Pump draw down test shows pump capacity is nearly half the design capacity Leslie Drive Pumping Station Wastewater from the Atlantic Heights pumping station, and the Leslie Drive neighborhood are pumped by the Leslie Drive pumping station to the Deer Street pumping station. The station is a wetwell/dry well configuration. Evaluation of this station revealed the station was in good overall condition. Wastewater flow projections for the Leslie Drive drainage area indicate the station has adequate capacity for the next twenty years. The pump run times shown in Table 4-3 are below 12 hours per day, however the peak day s run time is 9.8. This higher run time is likely due to Atlantic Heights pumping station which had run times of nearly 24 hours (12 hours per pump). However, the pump draw down tests show the station s pumps are not operating at their design capacity. This problem should be investigated and corrected. The following is a list of problems at the Leslie Drive pumping station. A more detailed problem list is included in Appendix 4-3. General Problems Worn impellers and wear plates. Only one pump will operate with the generator. This should be changed so either pump of the two pumps will operate with generator power. Evaluate pumping station to determine the cause of low output Marcy Street Pumping Station The Marcy Street pumping station was installed in 1989 as part of a sewer separation project. The separation covered the neighborhoods east of South Street from the outlet of the South Mill Pond to New Castle Ave. The entire drainage was supposed to have been separated. However, pump run times indicate excess flow at times (see Table 4-3). With the exception of the excess run times the pump station needs some minor repairs and electrical modifications. The pump Underwood Engineers, Inc Facilities Plan Update C:\Program Files\Adobe\Acrobat 4.0\Acrobat\plug_ins\OpenAll\Transform\temp\785sec4.doc
76 capacity should be adequate for future flow. A draw down test of this station was not completed at the time of this report. The following is a list of the some of the problems at the Marcy Street pumping station. A more detailed problem list is included in Appendix 4-3. General Problems Only one pump will operate with the generator. This should be changed so either pump of the two pumps will operate with generator power Gosling Road Pumping Station The Gosling Road pumping station is a Smith and Loveless wetwell drywell configuration. Currently, the station see flows beyond its capacity and should be upgraded to handle the projected future flows. Based on the flow projections performed for this Update the new station should have a capacity of approximately 900 gpm. A preliminary hydraulic evaluation indicates the existing 8-inch force main is adequate to handle these future flows. The following is a list of the major problems at the Gosling Road pumping station. A more detailed problem list is included in Appendix 4-4. General Problems Existing capacity is not adequate for current and future requirements. Comminutor is worn out Griffin Park Pumping Station The Griffin Park Pumping Station has no significant problems. Its current capacity is adequate for future flows Lafayette Pumping Station The Lafayette pumping station, pumps wastewater collected from the southern portion of the City to a gravity sewer near Willard Avenue. The collection system within the Lafayette drainage basin is for the most part a separated system, however, pump station flow records indicate Underwood Engineers, Inc Facilities Plan Update C:\Program Files\Adobe\Acrobat 4.0\Acrobat\plug_ins\OpenAll\Transform\temp\785sec4.doc
77 significant I/I during periods of rain. This station was built in the late 1960 s. The Lafayette pumping station currently can not keep up with peak rain events. Twenty year projected flows for the Lafayette pumping station indicate peak flows as high as 7.4 mgd (5,141 gpm). This flow value is a buildout projection and is dependent upon development patterns in uth and Rye. Assuming half the development occurs in the next 10 years the expected peak flow would be approximately 5.7 mgd (4,000 gpm). In addition to capacity problems, the station s electrical controls need upgrade or replacement. The current controls are a safety hazard. The following is a list of problems at the Lafayette pumping station. A more detailed problem list is included in Appendix 4-3. General Problems Existing pump controls are a safety hazard. Pump selection is done by cannon plug removal and repositioning. Several people have been shocked doing this. The variable speed is controlled by electrodes in and electrolyte solution. It is dangerous adding the solution when it is low. Current pumping capacity can not handle 10 year projected flows West Road Pumping Station The West Road Pumping Station is a suction lift type station which is approximately 20 years old The drawdown test at the West Road pumping station indicates the pumping capacity is approximately half of the stations design capacity (Table 4-2). The drawdown test should be repeated to confirm its accuracy. If it is correct the station should be evaluated to determine why the pumping rate is so low. The design capacity of this station is adequate for future flows. The following is a list of the problems at the West Road pumping station. A more detailed problem list is included in Appendix 4-3. General Problems Worn impellers and wear plates. The roof is leaking. Existing electrical heat is costly and should be replaced with gas heat Constitution Avenue Pumping Station Underwood Engineers, Inc Facilities Plan Update C:\Program Files\Adobe\Acrobat 4.0\Acrobat\plug_ins\OpenAll\Transform\temp\785sec4.doc
78 The Constitution Avenue pumping station has no significant problems. Its current capacity is adequate for future flows. The following is a list of the problems at the Constitution pumping station. A more detailed problem list is included in Appendix 4-3. General Problems Worn impellers and wear plates. Leaking roof. Exiting heat is inadequate Rye Line The Rye Line pumping station is the same style station as the Gosling Road pumping station, a Smith and Loveless wetwell/drywell configuration. The station is approximately 35 years old. Currently, the station sees flows beyond its capacity and should be upgraded to handle the projected future flows.. As part of this evaluation a number of scenarios were evaluated to determine the future capacity requirements for this station. The projections ranged from 660 gpm to 1,350 gpm depending upon what the Town of Rye will request for reserve capacity and whether the Western end of Ocean Road is sewered. In an effort to minimize the future pump station size, the Hillcrest mobile Home Park was identified as a source of excess flow. Hillcrest has a private pumping station which contributes 180 gpm to the Rye Line pumping station. Currently the Hillcrest force main discharges to a manhole which flow south to Rye Line station. This force main could be extended 800 feet a manhole that flows north to reduce flow to the Rye Line station. A preliminary hydraulic evaluation indicates the existing 8 inch force main may not be adequate to handle the higher projected future flows. Replacement of the force main may be necessary if the velocities and pressures are too great. A more detailed evaluation of projected flow and impacts on the force main should be done as part of any preliminary design of the Rye Line pumping station. Underwood Engineers, Inc Facilities Plan Update C:\Program Files\Adobe\Acrobat 4.0\Acrobat\plug_ins\OpenAll\Transform\temp\785sec4.doc
79 The following is a list of the some of the problems at the Rye Line pumping station. A more detailed problem list is included in Appendix 4-3. General Problems Existing pump capacity is not adequate for present or future requirements. existing comminutor is worn out and needs replacement. No potable water line to the pumping station building. Pavement in front of the station was removed to repair a watermain break. The existing grade around the pumping station allows flooding Heritage Avenue Pumping Station The Heritage Avenue Pumping Station is a Smith and Loveless a can type drywell wetwell type pumping station approximately 20 years old. The Heritage Avenue pumping station has no significant problems. Its current capacity is adequate for future flows. The following is a list of the problems at the Heritage pumping station. A more detailed problem list is included in Appendix 4-3. General Problems Existing heater in the generator room is inadequate Woodlands I Pumping Station The Woodlands I Pumping Station is a suction lift type pumping station which is approximately 20 years old. The Woodlands I pumping station has no significant problems. Its current capacity is adequate for future flows. The following is a list of the some of the problems at the Woodlands I pumping station. A more detailed problem list is included in Appendix 4-3. General Problems Worn impeller and wear plate replacement. Wet well penetration into non-explosion area Woodlands II Pumping Station The Woodlands II Pumping Station is a suction lift type pumping station which is approximately 20 years old. Pump station records show combined pump run times which exceed 12 hours per Underwood Engineers, Inc Facilities Plan Update C:\Program Files\Adobe\Acrobat 4.0\Acrobat\plug_ins\OpenAll\Transform\temp\785sec4.doc
80 day (Table 4-3). These excessive run times indicate significant I/I to the pumping station or problems with the pump controls. It appears that the excess run time is due to I/I, however this should be confirmed prior to performing any separation projects. Besides the excessive run times during rain events the Woodlands II pumping station has no significant problems. Its current capacity is adequate for future flows. The following is a list of the some of the problems at the Woodlands II pumping station. A more detailed problem list is included in Appendix 4-3. General Problems Worn impeller and wear plate replacement. Existing heater is inadequate. Wet well penetration into non-explosion area Tuckers Cove Pumping Station The Tuckers Cove Pumping Station was installed in 1998 and is a suction lift type pumping station. Tuckers Cove Pumping Station is a new pumping station and does not currently receive significant flows. TABLE 4-4 PUMPING STATIONS PROJECTS (Projects listed in random order) Atlantic Heights PS-1 Modify electrical controls to allow both pumps to operate on the generator. PS-2 Upgrade flow recorder Constitution PS-3 The roof should be replaced. PS-4 Install gas heat. Deer St PS-5 Air conditioning unit need to be replaced with something that withstands the salt air. PS-6 Replace generator enclosure with one that will withstand the salt air. PS-7 Replace the comminutor with a Channel Monster. Priority M M H M M M M Underwood Engineers, Inc Facilities Plan Update C:\Program Files\Adobe\Acrobat 4.0\Acrobat\plug_ins\OpenAll\Transform\temp\785sec4.doc
81 PS-8 Upgrade the by-pass vault to allow installation of a temporary by-pass pump. PS-9 Upgrade the odor control system. PS-10 Modified pump controls to minimize short cycling of pumps during low flows. PS-11 Perform evaluation to determine why pumps are not pumping at rated capacity, repair or modify to increase pumping rate Gosling Road PS-12 Upgrade Pumping Station to meet future needs. Heritage PS-13 Install upgraded heater in the generator room. Lafayette PS-14 Replace"T". with "Y on Pump #3 discharge line to eliminate solids accumulation. PS-15 Paint the entire station. PS-16 Replace pump controls. PS-17 Upgrade pump capacity to handle future flows. Leslie Dr PS-18 Modify electrical controls to allow both pumps to operate on the generator Marcy PS-19 Modify electrical controls to allow both pumps to operate on the generator Mechanic PS-20 Replace air conditioning units with something that withstands the salt air. PS-21 Replace the existing screenings grinder with a screenings wash press system. PS-22 Upgrade odor control system. PS-23 Upgrade the by-pass vault to allow installation of a temporary by-pass pump. PS-24 Install new day tank for emergency generator. PS-25 Repair or replace the stop gates in front of the climber screen PS-26 Perform evaluation to determine why pumps are not pumping at rated capacity, repair or modify to increase pumping rate Rye Line PS-27 Upgrade Pumping Station West PS-28 The roof should be replaced. PS-29 Install gas heater. H H M H H M M M H M M M M H M H H H H H H M Underwood Engineers, Inc Facilities Plan Update C:\Program Files\Adobe\Acrobat 4.0\Acrobat\plug_ins\OpenAll\Transform\temp\785sec4.doc
82 PS-30 Seal hole from wetwell into the pump room explosion rating violation Woodlands I PS-31 Install gas heater. PS-32 Seal wetwell penetration into non-explosion area. Woodlands II PS-33 Install gas heater. PS-34 Seal wetwell penetration into non-explosion area. Operations and Maintenance PS-35 Calibrate flow meters and instrumentation annually PS-36 Establish routine maintenance schedule for pumping stations PS-37 Record pump run times on a regular basis (i.e. 5-7 times per week) PS-38 Upgrade or replace SCADA system to interface with RTUs at pumping stations H M H M H H H H H Pumping Station Operational Recommendations A review of current pumping station operations and maintenance procedures indicates that evaluation of pump performance is not routinely performed. Pump run times should be recorded each time the station is visited or daily basis if telemetry allows. Annual pump draw-downs should be performed to ensure pump capacity isn t decreasing. Pump impellers and seals should be inspected annually at all pumping stations. Routine evaluation of pump run times and flows will help determine problems before they become significant. In addition, run time and flow records can help isolate areas of infiltration and inflow within the collection system. To aid in monitoring and collection of data the City is planning on upgrading the existing telemetry and remote terminal units at the pumping stations. The existing telemetry and remote terminal units (RTUs) at the pumping station are limited to alarm annunciation with the exception of Mechanic Street and Deer Street. The existing system is inadequate for additional data acquisition needed to properly monitor the collection system. At a minimum, run time data from each pumping station is required to better predict maintenance needs and avoid potential emergency situations. The upgraded system will incorporate a systems Underwood Engineers, Inc Facilities Plan Update C:\Program Files\Adobe\Acrobat 4.0\Acrobat\plug_ins\OpenAll\Transform\temp\785sec4.doc
83 control data acquisition (SCADA) program at the Peirce Island WWTP. This SCADA system will collect data from each pumping station and automatically create a historical plot of information collected from each station. 4.4 COLLECTION SYSTEM SUMMARY (Exclusive of Pease) The collection system evaluation included a review of existing problem areas, site visits during storm events and tidal inflow events, and modeling of the main interceptors within the collection system. In general the approach used was a desktop analysis. The evaluation used available data collected by the wastewater treatment plant, collection system, and department of public works staff. A full scale sewer system evaluation survey (SSES) was not performed as part of this update. However, limited flow monitoring and sewer inspection was performed to better prioritize potential projects. The major problems identified in the collection system include tidal inflow, combined sewers, infiltration and the need to address the CSOs. The strategy proposed to address these problems involves a stepwise approach. Initially, major tidal and freshwater inflow sources should be addressed, as they may be a significant contributor to sewage backups during heavy rains. Additionally, cleaning and inspection of the major interceptors should be performed to maximize the system storage capacity, identify blockages or flow restrictions, and evaluate the need for repairs or replacements. Following removal of significant inflow sources and interceptor evaluations, combined sewer separations should be prioritized to address the worst problem areas first. As the sewer cleaning and repairs, and combined sewer I/I removal progresses, a reduction in the frequency and duration of the CSOs should be realized as well as a decrease in the incidence of sewage backups and system flooding. It is likely that complete I/I removal within all combined areas will not be necessary to realize a significant improvement, however, the effectiveness of each project should be monitored through follow-up flow monitoring to determine the extent and need of additional I/I removal. For areas that are considered for I/I removal, inspection and cleaning should be performed initially to determine if there any blockages or obstructions contributing to capacity problems as Underwood Engineers, Inc Facilities Plan Update C:\Program Files\Adobe\Acrobat 4.0\Acrobat\plug_ins\OpenAll\Transform\temp\785sec4.doc
84 well as to determine whether sewer replacement or storm drain construction is the most cost effective means of I/I removal. In addition to areas considered for I/I removal, the City should consider establishing a routine cleaning and inspection program for the entire collection system. Operation and maintenance of the City s pumping stations should focus on maintaining maximum pumping capacity to minimize the potential of sewage backups and CSOs. Currently the two most important pumping stations in the City are not pumping to their design capacity. These stations should be evaluated to determine the cause of their capacity limitations. In the past the pumping stations have been used to balance flows within the collection system and to maintain certain flows to the WWTP. Based on our evaluation it appears that this method of operation was necessary to minimize loss of solids from the clarifiers and to avoid overloading the primary effluent filters. However, it has created a situation that may have artificially increased the flooding and backups within the collection system. In addition, this approach to collection system operation has increased the frequency and duration of CSO events. This section presented an extensive list of collection system projects. However, we do not recommend site-specific solutions for all the listed problems. The general approach to these project is incremental and iterative, the most effective solutions will be implemented first with follow-up monitoring to determine the success of the project. The CSO Long Term Control Plan will be developed and implemented concurrent with these projects. The two programs, collection system upgrades and CSO control, will be dependant upon each other. Therefore, periodic monitoring and coordination will be necessary throughout their execution. Section 6 of this report covers the recommended collection system projects and their associated costs. Underwood Engineers, Inc Facilities Plan Update C:\Program Files\Adobe\Acrobat 4.0\Acrobat\plug_ins\OpenAll\Transform\temp\785sec4.doc
85
86
87
88 SECTION 5 EVALUATION OF PEIRCE ISLAND WASTEWATER TREATMENT PLANT AT EXISTING AND FUTURE FLOWS AND LOADS 5.1 GENERAL As part of the 201 Facilities Update, the Peirce Island WWTP was evaluated to determine current and future capacity limitations. The evaluation included a plant wide mass balance, a hydraulic evaluation and a unit process evaluation. The development of current and future flows was discussed in Section 3 of this report and is summarized here again in Table 5-1. TABLE 5-1 SUMMARY OF PRESENT AND FUTURE PROJECTED FLOWS AND LOADS Based on Buildout Flow Projections Total Average Sanitary Flow (mgd) Estimated Average I/I (mgd) Total Annual Average Daily Flow (mgd) Peak Hourly Flow W/O Sewer Separation (mgd) Peak Hourly Flow with Sewer Separation or continued use of CSOs (mgd) Average Daily BOD 5 (lbs./day) 5,410 7,630 9,880 Average Daily TSS (lbs./day) 5,180 7,300 9,470 Average Daily TSS W/Chemical Addition (lbs./day) 5,490 7,700 9,920 Peak Week BOD 5 (lbs./day) 12,810 18,080 23,420 Peak Week TSS (lbs./day) 11,780 16,660 21,580 Peak Week TSS W/Chemical Addition (lbs./day) 12,520 17,600 22,660 Peak Month BOD 5 (lbs./day) 8,990 12,670 16,400 Peak Month TSS (lbs./day) 7,110 10,000 12,970 Peak Month TSS W/Chemical Addition (lbs./day) 7,620 10,660 13,720 Underwood Engineers, Inc Facilities Plan Update C:\Program Files\Adobe\Acrobat 4.0\Acrobat\plug_ins\OpenAll\Transform\temp\785sec5.doc
89 The original Peirce Island primary wastewater treatment plant was put into service in 1964 and was upgraded to an advanced primary treatment plant in The upgraded plant was designed to handle an average daily flow of 4.8 mgd and a peak hourly flow of 22 mgd (NPDES Permit limit is 4.5 mgd). The treatment plant is comprised of preliminary treatment, primary treatment, primary effluent filtration and disinfection. Treated wastewater is discharged to the Piscataqua River via a 24-inch outfall. A process flow diagram is shown in Figure METHODOLOGY As part of the WWTP evaluation, Underwood Engineers Inc. prepared a mass balance of the entire treatment plant to determine the theoretical limitations at the plant and compared these values to actual plant data. A series of meetings were held with plant personnel to review existing problem areas. As a result of these meetings and the mass balance, a list of projects was developed, advantages and disadvantages for each project were discussed, and each project was ranked. The complete list of projects is included in Appendix 5-1. Unit process evaluations were performed on each unit process to determine their theoretical capacities. In addition, treatment plant records from 1993 to 1999 were reviewed to determine the historical treatment efficiency of the plant. 5.3 PERFORMANCE EVALUATION Records from 1993 to 1999 were evaluated to determine the performance of the treatment plant and to determine if modifications to any unit processes were required. Table 5-2 lists the NPDES permit and 301 (h) waiver requirement violations since the upgraded plant went on-line. Ignoring violations for excess flow, which is mainly due to wet weather flows, roughly 80% of all the violations were due to either total coliform or failure to meet the 30% removal requirement for BOD 5. The causes and proposed solutions to these violations will be discussed further within this Section. 5.4 HYDRAULIC EVALUATION A hydraulic evaluation was performed to determine the maximum possible flow the existing plant could handle. This evaluation ignored unit process treatment efficiencies and focused on Underwood Engineers, Inc Facilities Plan Update C:\Program Files\Adobe\Acrobat 4.0\Acrobat\plug_ins\OpenAll\Transform\temp\785sec5.doc
90 the maximum amount of flow the plant could handle before the tanks would overtop. Based on the existing configuration and pump capacity the plant is limited to 22 mgd. Assuming pump capacity at Mechanic Street pumping station were not the limiting factor the outfall is the next Insert Figure 5-1 Underwood Engineers, Inc Facilities Plan Update C:\Program Files\Adobe\Acrobat 4.0\Acrobat\plug_ins\OpenAll\Transform\temp\785sec5.doc
91 limiting factor at 26 mgd. The aerated grit chambers are hydraulically limited to approximately 32 mgd. Beyond 32 mgd the clarifiers and chlorine contact tanks begin to overtop. TABLE 5-2 SUMMARY OF NPDES AND 301 (H) WAIVER REQUIREMENT VIOLATIONS * BOD #/day BOD mg/l Solids, Total Suspended % Removal BOD Settleabl Flow Coliform ph e Solids Totals * As of August 31, UNIT PROCESS EVALUATION Each unit process at the treatment plant was evaluated to determine its capacity. Table 5-3 lists the capacities of the major unit process at present and future flow and loads. Process evaluation calculations are presented in Appendix 5-2. The following is a brief discussion of each unit process Preliminary Treatment Screening Preliminary treatment is the first step in wastewater treatment at the Peirce Island WWTP. Preliminary treatment involves the removal of large, stringy, or floatable materials and removal of grit in order to protect downstream equipment. The Mechanic Street Pumping Station pumps all of the wastewater collected throughout the City of uth to the Peirce Island WWTP. Wastewater flowing into the Mechanic Street pumping station is screened using an Infilco Degremont Inc. 1-inch mechanically cleaned climber screen. Debris caught in the screen is Underwood Engineers, Inc Facilities Plan Update C:\Program Files\Adobe\Acrobat 4.0\Acrobat\plug_ins\OpenAll\Transform\temp\785sec5.doc
92 removed by a rake, which elevates the debris to a mechanical grinder. The grinder macerates the screenings and reintroduces them into the wastewater stream where they are pumped to the WWTP. At the WWTP, wastewater flows into an aerated grit chamber where grit is removed. Screenings removal was identified in EER s 1996, Water and Sewer Operational Study. Screenings were causing problems in the primary effluent sand filters (PEF) during periods of high flow. The PEF manufacturer now recommends installing ¼ -inch opening fine screens before PEFs. If the PEFs are brought into service full time a new fine screen may be necessary to ensure efficient operation. The existing grinder at the Mechanic Street pumping station has been a maintenance problem and is currently inoperable. The City has piloted a screenings wash press and is scheduled to replace the grinder with this wash press in the Spring of This system washes the organic matter off the screenings and dewaters the material reducing its volume and potential for odors. Additional work necessary at the Mechanic Street pumping station is discussed in Section 4 of this report. Underwood Engineers, Inc Facilities Plan Update C:\Program Files\Adobe\Acrobat 4.0\Acrobat\plug_ins\OpenAll\Transform\temp\785sec5.doc
93 TABLE 5-3 UNIT PROCESS CAPACITY Unit Process Design Capacity % Capacity Utilized Septage mgd 25% 25% 25% Grit Removal mgd 104% 104% 104% Primary Clarifier ADF mgd 51% 62% 74% Peak Day mgd >100% >100% >100% Peak Hr mgd 80% 80% 80% Sand Filters ADF 6.00 mgd 91% 113% 134% Peak Day 9.00 mgd >100% >100% >100% Peak Hr mgd >100% >100% >100% Chlorine Contact ADF 30 min 81% 99% Peak Flow 15 min 161% 161% 161% Belt Filter Press (30 hr/week) Average Loading 66,000 lb/week 35% 49% 63% Peak Month Average Loading 47% 67% 87% Peak Month With Chemical Addition (20 ppm FeCl 3 ) 61% 84% 109% Gravity Thickener Range of Allowable Loadings #/sf * day Average Loading 14 #/sf * day 21% 27% 37% Peak Month Loading w/chem 21 #/sf * day 35% 50% 63% Sludge Storage Tank 3% solids) Recommended 3 days Average Loading 2.25 days 79% 112% 144% Peak Month Average Loading -- days 109% 153% 200% With Chemical Addition -- days 138% 195% 250% Underwood Engineers, Inc Facilities Plan Update C:\Program Files\Adobe\Acrobat 4.0\Acrobat\plug_ins\OpenAll\Transform\temp\785sec5.doc
94 Grit Removal Treatment at the WWTP begins with the aerated grit chamber. Flow from Mechanic Street pumping station, the Town of New Castle, the primary effluent filter backwash, the septage receiving tanks and the belt filter press wash water all combine at the influent trough of the aerated grit chamber. The grit chambers are comprised of two 22,000 gallon tanks, two positive displacement blowers, two grit screw conveyors, three grit pumps and a grit wash/dewatering unit. Air is supplied by diffusers at the bottom of each tank to create a rolling action in the tanks. The lighter organic matter is kept in suspension while grit and heavier solids fall to the sloped tank bottom. The accumulated solids are conveyed to a suction sump for the grit pumps. Due to excess wear from sand carry over from the primary effluent filters the grit screw conveyors on the bottom of each grit tank were removed. In addition to the grit screw conveyors, the grit wash/dewatering unit is worn out and needs replacement. Currently the grit wash/dewatering unit is located in the sludge dewatering room. The moist corrosive atmosphere of that area has contributed to the corrosion of the grit wash/dewatering unit. Possible relocation of a new grit wash/dewatering unit to the scum concentrator building would help reduce the corrosion on this equipment and extend its life. This would create a separate side stream of grit which would have to be dealt with in addition to the dewatered sludge Preliminary Treatment Summary The preliminary equipment is adequately sized to handle the peak flow of 22 mgd. However, maintenance is required to ensure the equipment can meet this capacity. The following are the major items which should be addressed. A complete list of items associated with the preliminary treatment process is listed in Appendix 5-1. As discussed in Section 4 of this report, the Mechanic Street pumping station s pumps are not pumping at the 22 mgd rate specified. This pump system should be fully evaluated to determine the cause of and solution to this problem. Underwood Engineers, Inc Facilities Plan Update C:\Program Files\Adobe\Acrobat 4.0\Acrobat\plug_ins\OpenAll\Transform\temp\785sec5.doc
95 The screenings grinder at the Mechanic Street pumping station is a maintenance problem and is now inoperable and needs replacement. Currently a project is underway to replace the grinder with a screenings wash dewatering system which will remove the screenings from the waste stream. The grit screws in the aerated grit chambers should be replaced. The system was designed to allow grit to settle and concentrate on the bottom of the grit tank. The screws would convey grit to a sump where the grit pumps would pump to the grit washer. Currently the grit pumps are run continuously to avoid grit accumulation. This additional pumping adds to the operation and maintenance cost of this equipment. Replace and relocate the grit concentrator in the scum building. The existing grit concentrator needs replacement due to corrosion and wear. The existing concentrator location, in the sludge dewatering building, requires that grit slurry be pumped over 200 feet. Current design practice recommends minimizing the distance grit is pumped to reduce clogging and problems with pipe wear Primary Treatment Wastewater flows from the aerated grit chambers to a 22-foot by 12-foot distribution structure where flow is split between two 76-foot diameter primary clarifiers. Each clarifier can be isolated for maintenance by closing one of the 30-inch sluice gates located at the distribution structure. The distribution structure has provision for an additional clarifier at some future time. Wastewater enters the two 76-foot clarifiers, where solids are settled out to form primary sludge. Typically, solids removed in the primary clarifier will account for approximately 25% to 30 % of the non-soluble influent BOD and 40 % to 60 % of the influent TSS. The settled sludge is scraped to a center sludge hopper by rake arms. The sludge is removed by three 130 gallon per minute (gpm) sludge pumps which pump the sludge to a gravity thickener. The pumps are configured to have one pump wasting sludge from each clarifier with one pump as a back up. The clarifiers are equipped with scum collectors, which automatically remove surface scum for the entire clarifier surface, and deposits it in scum storage tanks. Underwood Engineers, Inc Facilities Plan Update C:\Program Files\Adobe\Acrobat 4.0\Acrobat\plug_ins\OpenAll\Transform\temp\785sec5.doc
96 Primary Clarifiers Clarifier performance is based on a number of factors including detention time, surface overflow rate, solids loading rate, volume of stored sludge and side water depth. As overflow rates increase, removal efficiency decreases. The 76-foot diameter primary clarifiers were designed for an average daily overflow rate of 606 gallons per day per square foot (gpd/sf) and a peak overflow rate of 2,425 gpd/sf (approximately 22 mgd). These values are within the recommendations of the Guidelines for the Design of Wastewater Treatment Works (TR-16). However, sustained flows above the average overflow rate will reduce removal efficiency and potentially lead to solids loss from the clarifiers. An alternative method of clarifier evaluation uses side water depth and detention time to determine allowable surface overflow rates. Using this method the existing clarifiers are rated at 5.4 mgd average daily flow and 10.8 mgd peak hourly. Operational data and observations by the WWTP operators appear to support this lower allowable overflow rate and indicate a third primary clarifier may be necessary if peak flows over 10.8 mgd occur for extended periods of time. Based on WWTP and CSO flow records, average daily flow exceeding 10.8 mgd occur approximately 4 percent of the time or 15 days per year. Treatment plant records were reviewed to determine if there was a correlation between high flows (> 10.8 mgd) and NPDES violations. Based on plant records no clear pattern was evident. However, solids lost from the clarifiers settle and accumulate in the chlorine contact tanks (CCT) and effect disinfection efficiencies. This issue will be discussed further below Primary Waste Sludge Pumps The existing 130 gpm pumps are adequate for projected flows and loads. Balancing the flow of sludge wasted from each clarifier can be improved by installation of an additional inline flow meter. Installation of an inline sludge grinder(s) on the discharge piping will help minimize the clogging of the thickened sludge waste line from the gravity thickener (see Solids Handing Memo Appendix 5-3). Underwood Engineers, Inc Facilities Plan Update C:\Program Files\Adobe\Acrobat 4.0\Acrobat\plug_ins\OpenAll\Transform\temp\785sec5.doc
97 Primary Treatment Summary The primary treatment equipment is sized to handle the hydraulic peak flow of 22 mgd. However, lower solids removal efficiencies at higher flows may reduce disinfection efficiency in the chlorine contact tank. Maintenance is required to ensure the equipment can continue to meet this capacity. The following are major items, which should be addressed. A complete list of items associated with the primary treatment process is listed in Appendix 5-1. Construct a new primary clarifier if, after sewer separation projects, average daily flows continue to exceed 10.8 mgd four percent of the year and solids carry over is shown to contribute to permit violations Replace existing clarifier mechanisms within the next 10 years Advanced Primary Treatment (Primary Effluent Filters) From the two primary clarifiers, effluent can flow directly to the chlorine contact tank (CCT) for disinfection or to the primary effluent filters (PEFs). The PEFs are eight Zimpro Hydro-Clear sand filters designed to handle 6 mgd average daily flow, 9 mgd peak daily flow and a hydraulic peak of 22 mgd. The filtered effluent is pumped to a parshall flume for flow measurement prior to the CCT. The primary effluent filter was designed to remove 50 to 70% TSS to aid in disinfection by removing clumps of solids that could shield bacteria. Although it was not designed specifically for BOD removal, it was anticipated that the PEFs would provide an additional 30 to 50% removal of BOD. However, since start-up the PEFs have had limited success meeting the TSS removal efficiency and have not significantly increased BOD removal efficiency over that achieved by the primary clarifiers. The PEF system has been a maintenance problem since it went on line. Currently the system is off-line and requires a significant overhaul to ensure long term operation. Included in Appendix 5-1 is a list of PEF maintenance items identified as part of this update. This 201 Facilities Update performed a desktop evaluation of the PEF system. The evaluation included a review of maintenance records, treatment efficiency and a limited literature review to Underwood Engineers, Inc Facilities Plan Update C:\Program Files\Adobe\Acrobat 4.0\Acrobat\plug_ins\OpenAll\Transform\temp\785sec5.doc
98 determine the causes of the continuing problems with the filter system. Concurrent with this report, the City performed pilot studies on two alternate filter systems, a Dynasand filter by Parkson and an Aqua Disk by Aqua Aerobics. Equipment data sheets and pilot results are included in Appendix 5-4. Both units appeared to provide some benefit, however, due to the limited scope of the pilot studies no recommendations can be made. If filtration is required to meet permit limits and the existing PEFs are used as a backup system, a long term pilot evaluation should be performed to ensure the system selected as the primary filters can handle the varied flows and loads a full scale unit would see. In addition, the City has contacted the PEF design engineers (Earth Tech) and asked them to determine what it would require to make the PEFs functional again and if the system can reliably meet the 301 (h) requirement of 30 percent removal of BOD 5 which became effective in As an alternative to primary effluent filtration, the City is currently performing a full-scale pilot evaluation of chemically enhanced primary clarification. Chemically enhanced primary clarification using metal salts with or without polymer can be used to enhance removal efficiency and improve clarifier performance at high flows. The City of uth is using a ferric chloride polymer blend and polymer to improve BOD 5 removal efficiency to meet the 30% removal requirement of the City s 301 (h) wavier. Data collected from the pilot study to date indicate an average 40% removal of BOD 5. With the exception of August 1999, the pilot study data, shows that chemically enhanced primary clarification should allow the Peirce Island WWTP to meet the permit requirement for BOD 5 removal efficiency. In August of 1999, dry weather flows increased the influent concentration of BOD 5 to around 300 mg/l. Jar tests showed that the ferric polymer blend dosage needed to be higher (~30 ppm) to obtain the removal efficiency required. However, the chemical metering pumps were not large enough and new pumps were not installed until mid September, after the August permit violations. It appears that the increased dosage would have worked to remove the BOD 5, but the incident shows that additional treatment may be necessary to meet BOD 5 limits in the future. The City is working with Underwood Engineers, Inc. to pilot the existing PEFs in conjunction with the chemically enhanced primary clarifiers. This pilot will help determine the need for additional treatment to meet the City s NPDES and 301 (h) permit waiver requirements during periods of high strength Underwood Engineers, Inc Facilities Plan Update C:\Program Files\Adobe\Acrobat 4.0\Acrobat\plug_ins\OpenAll\Transform\temp\785sec5.doc
99 influent and as organic loads to the plant increase over time. In addition, this pilot will better define the actual sizing required for a new chemically enhanced primary clarification system. A cost-effective evaluation of the filtration options and chemically enhanced primary clarification are presented in Section 6 of this report Effluent Flow Meter From the PEFs, flow is pumped to a 30-inch Parshall flume before it is split to the two chlorine contact tanks. The 30-inch Parshall flume is adequate up to future peak flows of approximately 27 mgd. The current piping configuration does not allow measurement of flow that by-passes the PEFs. This affects the ability to flow pace chlorination and dechlorination dosing. During periods when the PEFs are by-passed, the flow signal from the Mechanic Street pumping station is used to pace the chlorine feed pumps. This is an acceptable short-term solution, however, it is not the most accurate location to measure flow in the CCT because of the lag in actual flow throughout the entire plant. The goal of disinfection systems should be to minimize the lags between measurement and chemical dosage of effluent to be disinfected. Good design practice requires a flow meter adjacent to the CCT Disinfection System Primary effluent from the Peirce Island Wastewater Treatment Plant is disinfected with sodium hypochlorite and dechlorinated with sodium metabisulfite prior to final discharge to the Piscataqua River. The City s NPDES permit requires a total coliform concentration of 70 colonies per 100 ml and a chlorine residual of less than 1 mg/l. Because of the difficulties meeting the total coliform limit the City has been performing side by side tests for fecal coliform. The City currently can meet the fecal coliform limits and has requested a permit modification. The Disinfection system is comprised of chemical storage, chemical feed system, chemical mixing and the chlorine contact tank (CCT) Chemical Storage Underwood Engineers, Inc Facilities Plan Update C:\Program Files\Adobe\Acrobat 4.0\Acrobat\plug_ins\OpenAll\Transform\temp\785sec5.doc
100 Sodium hypochlorite and sodium metabisulfite are stored in two 10,000-gallon tanks. During summer months the existing storage capacity for sodium hypochlorite is inadequate and deliveries must be made weekly. Because regular deliveries are hard to guarantee, an additional 10,000 gallons of Hypochlorite storage capacity should be installed Chemical Metering Pumps Four 240-gallon per hour (gph) chemical metering pumps are used to feed sodium hypochlorite to the chlorine mix chamber. Assuming future flows do not exceed 22 mgd this capacity is adequate. Two 48 gph chemical metering pumps are used to feed sodium metabisulfite to the dechlorination chamber of the CCT. According to the treatment plant operators chlorine residual concentrations are at times as high as 50 mg/l. With chlorine residuals of 50 mg/l the sodium metabisulfite pumps may not be adequate to provide enough chemical to dechlorinate at flows above 17.5 mgd Chlorine Contact Tanks As constructed, the CCT s provide approximately 10 minutes of detention time at the peak flow. The City was given a waiver to allow a detention time less than the 15 minutes required by NHDES. As a condition of the waiver, pre-chlorination before the primary effluent filters (PEF s) was to provide additional contact time (see copy of NHDES waiver in Appendix 5-5). Disinfection efficiency is based on adequate chlorine dosage and detention time to provide the kill necessary to meet permit requirements. The formula below shows the relationship between chlorine dosage and contact time (ct). Y = Yo[ ct]^-3 Y = Total Coliform in Final Effluent c = chlorine residual at end of CCT Yo = Total Coliform in Primary Effluent t = detention time (Source: White s Handbook on Chlorination and Alternative Disinfectants) In order to maintain a given ct as flow increases, either detention time or chlorine concentration needs to increase. Because the dimensions of the CCT s fix detention time, the operators can only increase chlorine dosage as flow increases. Based on theory, the Peirce Island Wastewater Underwood Engineers, Inc Facilities Plan Update C:\Program Files\Adobe\Acrobat 4.0\Acrobat\plug_ins\OpenAll\Transform\temp\785sec5.doc
101 Treatment Plant requires a chlorine residual of 31 mg/l at 16 mgd of flow in order to provide adequate kill. In addition to chlorine dosage and detention time, disinfection efficiency is affected by TSS concentration due to the clumping phenomenon (White, 1992). Higher concentrations of solids in the effluent shield bacteria requiring additional chlorine and detention time to ensure adequate kill. A review of NPDES permit violations at the wastewater treatment plant indicates that inadequate disinfection has been a reoccurring problem. According to plant operators, violations tend to occur during periods of high flow or when chlorine residuals are below 25 mg/l. Our evaluation indicates that a number of factors are likely contributing to the poor performance of the CCT s. These factors include: High residual chlorine concentration requirements and difficulty maintaining consistent chlorine residual. Clumping Phenomenon = Solids in the effluent act as a shield for bacteria. Inadequate detention time at flows above 14 mgd. Inadequate mixing of chlorine or short-circuiting of flow in the rapid mix chambers. Poor flow pattern through the CCT s, dead zones and areas of high velocity. Solids accumulation and the difficulty cleaning the CCT s. Based on the Ten States Standards, NEIWPCA TR-16, and The Handbook of Chlorination by White 1992, CCT s should be designed to provide plug-flow and avoid velocity gradients to achieve optimum disinfection. Previous evaluations by other consultants showed significant increases in velocity at the baffle wall and at different depths of flow (See Appendix 5-5). Inspection of the tanks conducted as part of this evaluation revealed areas of solids accumulation, also indicating velocity gradients. Data collected by the operators indicates a significant reduction in TSS as wastewater passes through the CCT s. The solids accumulation appeared to be the worst at the section of the CCT s just before to the effluent trough. Underwood Engineers, Inc Facilities Plan Update C:\Program Files\Adobe\Acrobat 4.0\Acrobat\plug_ins\OpenAll\Transform\temp\785sec5.doc
102 Samples analyzed for chemical oxygen demand (COD) before and after the CCT s show an increase in COD as wastewater passes through the CCT s, which may indicate that the accumulated solids are solubilizing. In addition, re-suspension of solids at high flows or solubilization of solids may be contributing to difficulties meeting coliform limits due to clumping or release of bacteria. The sluice gates that isolate the two CCT s have leaked in the past, preventing routine cleaning of the CCT s. The operators have recently repaired these gates, allowing for routine cleaning. Side by side analysis of effluent samples for total coliform versus fecal coliform show the plant is consistently meeting fecal limits even while violating total coliform. The State of New Hampshire surface water quality regulation use the National Shellfish Sanitation Program (see Appendix 5-6) which allows wastewater treatment plants with marine discharge the option of using either total coliform or fecal coliform. Currently, the Peirce Island Wastewater Treatment Plant s NPDES Permit is written around total coliform. The City has requested a permit modification from total coliform to fecal coliform. The modification may preclude the need for most of the recommended modifications to the disinfection system and may help reduce chemical costs Disinfection System Recommendations Based on this evaluation a number of modifications were identified that would improve the CCT s operation. A complete list of recommended CCT modifications is included in Appendix 5-5. Operational recommendations are discussed in the Process Modifications Section of this Section. Some of the more significant modifications are listed in below. 1. Request modification to the Plant s NPDES permit from total coliform to fecal coliform. 2. Modifications to the CCT s to eliminate dead zones and areas of velocity gradients, i.e. fillets in corners and flow directional baffles to minimize solids accumulation. 3. If necessary modify the rapid mix chambers to eliminate short-circuiting and optimize chemical use. (modifications to the mix chamber have been completed) 4. Install an additional 10,000-gallon sodium hypochlorite storage tank. Underwood Engineers, Inc Facilities Plan Update C:\Program Files\Adobe\Acrobat 4.0\Acrobat\plug_ins\OpenAll\Transform\temp\785sec5.doc
103 5. Install new chlorine residual analyzer just after the rapid mix chambers to automatically adjust stroke length of chlorine feed pumps to improve chemical dosage. 6. Install a new chlorine residual analyzer just prior to the effluent channel to provide a continuous monitor of chlorine residual and to pace the dechlorination pumps. 7. To optimize chemical use, flow pace the chlorine feed and dechlorination feed pumps off an effluent flow meter instead of relying on the Mechanic Street pumping station flow meter. 8. If necessary after implementing previous CCT modification recommendations, construct additional CCT capacity to provide additional detention time at higher flows Solids Handling and Dewatering System The goal of the solids handling and dewatering system is to remove excess water from the accumulated sludge to facilitate disposal. Accumulated sludge from the bottom of the primary clarifiers is wasted to the gravity thickener by three 130-gpm primary sludge pumps. Thickened sludge from the gravity thickener is pumped to the sludge storage tanks by three 50-gpm positive displacement plunger pumps. From the sludge storage tanks sludge is pumped to two, one meter belt filter presses by three progressive cavity positive displacement pumps. Dewatered sludge is transported to the Turnkey Landfill in Rochester, New Hampshire for final disposal. As part of the wastewater treatment plant evaluation, sludge production, belt press capacity and solids handling were evaluated. An in-depth memorandum on the solids handling system is included in Appendix 5-3 and is summarized below. In addition, a cost effective evaluation on alternatives to the existing BFPs was performed to determine if a more cost effective means of dewatering were available. This evaluation is also included in Appendix Gravity Thickener Sludge wasted from the primary clarifiers is pumped to a 30-foot diameter gravity thickener. The gravity thickener concentrates primary sludge to improve dewatering by the belt filter presses. The gravity thickener was designed for a hydraulic overflow rate of 530 gallon per square foot of surface area and solids loading rate of 8 to 14 pounds per day per square foot. Based on recommended allowable loading rates for gravity thickeners 18 to 24 pounds per day per square Underwood Engineers, Inc Facilities Plan Update C:\Program Files\Adobe\Acrobat 4.0\Acrobat\plug_ins\OpenAll\Transform\temp\785sec5.doc
104 foot (Metcalf and Eddy, Wastewater Engineering Third Edition) the gravity thickener has adequate capacity for future requirements. Historical performance of the gravity thickener indicates the unit has not consistently performed as designed. Inconsistent performance effects dewatering and sludge storage capacity. The operators should monitor the following gravity thickener parameters: Influent (primary clarifier waste sludge) for TS, and flow Effluent (flow over weirs) for TS, and flow Thickened Sludge for TS and flow Daily Depth of blanket. Typically depth of blanket is the height of sludge off the bottom of the tank as measured at about 1/3 distance towards center of tank. The exact location isn t important but consistency is. Mark location on rail with tape. Determine the sludge volume ratio (SVR) which is the volume of sludge blanket divided by volume of thickened sludge wasted per day. Typically SVR should be 0.5 to 2 days. This information will help determine the efficiency of the thickener. Attached in Appendix 5-3 is a figure which shows volume per depth of sludge at a point 5 feet from wall. This sheet takes into consideration the sloped floor Thickened Sludge Pumps The thickened sludge pumps convey thickened sludge from the 30-foot diameter gravity thickener to the sludge holding tanks. Three 50-gpm simplex plunger pumps installed on the ground floor of the scum concentrator building are used for the dual purpose of wasting thickened sludge and transferring septage. Based on projected sludge volumes the existing thickened sludge pumps should have adequate capacity for future needs. The current piping configuration and pump location is a suction lift. This configuration may contribute to periodic clogging at higher percent solids and increase the operation and maintenance time required keeping the lines clear. Intuitively, one would believe that relocating Underwood Engineers, Inc Facilities Plan Update C:\Program Files\Adobe\Acrobat 4.0\Acrobat\plug_ins\OpenAll\Transform\temp\785sec5.doc
105 the thickened sludge pumps to the basement of the Scum Building would increase the available net positive suction head on the pumps and therefore reduce the clogging. However, a hydraulic evaluation indicates the suction lift is within the pumps capacity. Based on further investigation it appears that rags are the main cause of clogging. Therefore, relocating the pumps may not reduce clogging Sludge Storage Tanks The two 16 by 16 by 7.5 storage tanks provide approximately 30,000 gallons of working sludge storage volume. Table 5-3 shows the projected storage capacity for present and future flows and loads. Based on these projections and a recommended minimum storage capacity of three days, additional sludge storage is necessary. In addition, the current aeration diffuser configuration does not provide adequate mixing to the sludge, causing stratification. This stratification can lead to wide swings in percent solids that are fed to the belt filter press causing operational difficulties. To provide for the ability to concentrate sludge further, swing arm decanters should be considered in each sludge tank. These decanters will also provide protection from overflowing Belt Filter Presses The belt filter presses (BFPs) at the Peirce Island Wastewater Treatment Plant appear to be sized to handle the loads that the plant is currently seeing, however, based on operator experience they are having a hard time keeping up with the sludge produced Original Design Criteria Based on the original design criteria the BFPs were sized to handle 1,100 dry pounds per hour per meter (approximately 50 gpm per meter at 5% solids). During start-up the presses performed at a throughput of 1,841 dry pounds per meter per hour. The feed solids were 8% at 46 gpm per meter (Appendix 5-3). Based on an evaluation of sludge production data from the plant and discussions with plant operators, it appears the actual output of the BFPs is less than the specified 1,100 pound per Underwood Engineers, Inc Facilities Plan Update C:\Program Files\Adobe\Acrobat 4.0\Acrobat\plug_ins\OpenAll\Transform\temp\785sec5.doc
106 meter. A review of sludge production at Peirce Island since 1993 (assuming an average of 30% solids and 30 hours of pressing) yielded an average throughput of 350 pound per meter per hour. According to the operators the presses are hydraulically limited to around 50 gpm and the typical percent solids fed to the presses is 3 percent. At 50 gpm and 3 percent solids the presses should be able to handle an average of 750 pound per meter per hour or 45,000 dry pounds per week. The representative from Envirex identified a number of problems that are contributing to the low production rate of these presses. These include; low belt speed, wrong belt on BFP #1, broken or missing sludge spreader dams on gravity zone, and broken polymer static mixers. Despite the fact that the existing BFPs should be able to handle the future flow and loads, it may be cost effective to replace the existing BFPs with an alternative dewatering system. One such system is the Fournier Rotary Press. The Rotary Press is totally enclosed, does not require continuous wash water, does not require continuous operator attention, and is predicted to produce a sludge cake of over 40% solids. If piloting shows the unit will perform as anticipated, the annual savings in operation and disposal cost is estimated to be $100,000. An equipment cut sheet and cost evaluation provided by the manufacturer is included in Appendix 5-3. However, the actual life cycle cost including capital and operation and maintenance can not be fully evaluated until the existing presses are rehabilitated and the Fournier Rotary Press piloted Factors that Affect Belt Press Performance There are a number of factors that can affect sludge throughput on the BFPs. These include: 1. Polymer dosage (lbs. of polymer per dry ton of sludge dewatered). Is the appropriate amount of polymer being added to the sludge feed? Based on the start-up records on the presses the optimum polymer dosage was 3 lbs./dry ton. This is on the low side of the typical range of 2 to 9 lbs. polymer/dry ton recommended by EPA. 2. Type of polymer used. Has the type of polymer changed since the start-up? Has the treatment process changed since start-up? Is this the best polymer for the application? Underwood Engineers, Inc Facilities Plan Update C:\Program Files\Adobe\Acrobat 4.0\Acrobat\plug_ins\OpenAll\Transform\temp\785sec5.doc
107 3. Proper polymer make-up. The polymer system is currently a temporary system that is not giving the proper wetting and aging. Permanent installation of the new polymer system will help improve dewatering. 4. Adequate mixing of polymer with sludge. The concentration of polymer fed to the sludge can affect the efficiency of mixing. Incomplete mixing causes poor BFP performance and lower throughput. Varying the amount of carrying water or changing the location or amount of weight on the inline mixer can improve mixing and reduce polymer usage. Adequate contact time from sludge/polymer mix point to BFP should be 10 to 30 seconds. At a sludge feed rate of 50 gpm; polymer injection points should be 13 to 40 feet from the presses. The Envirex representative determined the existing static mixers are inoperable and one of the polymer injection rings needs repair. 5. Adequate cleaning of presses between dewatering runs. If the belts are not cleaned thoroughly after each run, solids can accumulate in the belts and reduce the efficiency of the presses. 6. Fluctuation in solids feed to the presses. Fluctuation in solids concentrations being fed to the presses can significantly increase the amount of operator oversight necessary to ensure polymer dosage is optimum. It appears that poor mixing in the sludge holding tanks creates conditions that change the amount of polymer required continuously. If polymer is over dosed the belts can become blinded. Even if the operators catch the problem and the polymer is adjusted the belts will still have residual polymer which will reduce throughput. 7. Maintenance of presses. Both BFPs are in need of significant rehabilitation. Many of the parts are worn and are in need of replacement. 8. Operator attentiveness to presses during the dewatering runs, and 9. Any combination of the above items. In addition to the BFP s polymer feed system and the sludge storage tanks, the gravity thickener performance contributes to increased dewatering time. Based on discussions with the operators, the gravity thickener is not producing a consistent concentration of sludge. The gravity thickener at the Peirce Island WWTP was designed to produce five to six percent sludge. Periodic Underwood Engineers, Inc Facilities Plan Update C:\Program Files\Adobe\Acrobat 4.0\Acrobat\plug_ins\OpenAll\Transform\temp\785sec5.doc
108 clogging of the thickened sludge piping may hinder operation of the gravity thickener by causing pumps to be run more often reducing the percent solids wasted from the thickener Projected Dewatering Time Required Current BFP capacity problems will be exacerbated by the increased production of sludge due to the chemically enhanced primary clarification and by additional future loads. Table 1 and 2 in Appendix 5-6 summarize the projected weekly number of hours necessary to process sludge for average daily, peak weekly and peak monthly sludge production for the years 1998, 2010 and 2020 with and without chemical addition. These projections are based on average percent solids of three percent and a feed rate of 50 gpm. Based on these numbers the belt filter presses run time will exceed 30 hours per week by 2010 for peak week and peak month and will exceed 30 hours run time by 2020 at all times. If the average percent solids of the feed sludge can be maintained at five percent, run times would not exceed 30 hours except during peak weeks Solids Handling and Dewatering System Summary and Recommendations It appears that based on current configuration and operation, the existing dewatering system is not adequate to handle current peak weekly loads and future loads. However, with modifications to the gravity thickener operations, the sludge holding tanks, the polymer feed system, and the performance of needed maintenance, the existing presses will have adequate capacity for future needs except during the peak week. A complete list of modifications for the solids handling and dewatering system is listed in Appendix 5-1. Significant modifications are listed below. Two additional 22,500 gallon sludge storage tanks Sludge grinders on the suction end of the thickened sludge pumps Upgrade the existing sludge holding tank including new fine bubble aeration and a decant overflow system to improve sludge thickness and mixing Add sludge grinders to primary waste sludge pumps to minimize potential for clogging the thickened sludge waste line. Underwood Engineers, Inc Facilities Plan Update C:\Program Files\Adobe\Acrobat 4.0\Acrobat\plug_ins\OpenAll\Transform\temp\785sec5.doc
109 Once the BFPs have been repaired, have Envirex perform a capacity evaluation of the existing BFP After the capacity of the existing BFPs has been determined and the Rotary Press has been piloted, finalize the cost effective evaluation of an alternative sludge dewatering systems Septage Receiving Septage collected from uth and New Castle is disposed of at the Peirce Island Wastewater Treatment Plant. Septage is screened prior to storage in two 5,280-gallon tanks. Three 50-gpm simplex plunger pumps installed on the ground floor of the scum concentrator building are used for the dual purpose of wasting thickened sludge and transferring septage. The current capacity of septage facility is adequate for future requirements. However, given the high organic strength of septage and the fact that the plant currently has a problem meeting percent BOD 5 removals, the City s may wish to consider relocating the septage receiving facility to the Pease Wastewater Treatment Plant. In addition, relocating the septage receiving facility will reduce truck traffic to Peirce Island Odor Control Two Quad wet chemistry contact mist scrubbers provide odor control at the Peirce Island WWTP. One unit is located adjacent to the dewatering building and treats odorous air from the gravity thickener, aerated sludge holding, aerated septage holding and sludge dewatering. The other unit treats odorous air from the filter building. Both units are currently not in use and require some maintenance to bring them back on-line. Odor complaints have not been a significant concern, given the fact that the Peirce Island WWTP has a sufficient buffer from the nearest neighbors to provide adequate dilution to odors. Included in Appendix 5-7 is an odor control memo which gives an overview of general strategies for dealing with odors. In addition, the odor control systems were evaluated by a representative of EraTech Environmental Systems Inc. EraTech has purchased the rights to the Quad system. Their findings showed that the Quad systems needed some minor repairs but for the most part were in good working order. Included in Appendix 5-7 is EraTech s evaluation and recommendations. Underwood Engineers, Inc Facilities Plan Update C:\Program Files\Adobe\Acrobat 4.0\Acrobat\plug_ins\OpenAll\Transform\temp\785sec5.doc
110 5.6 PROCESS MODIFICATIONS Based on a limited review of current plant operational procedures at the Peirce Island Wastewater Treatment Plant we have the following operational modifications. Many of these modifications have been implemented or are under consideration. This section is intended to provide additional low cost tools to help the operators. Repairing the grit screws will allow the aerated grit chamber to be operated as designed Preliminary Treatment Process Modifications Since the grit screw conveyor at the bottom of the aerated grit chamber is currently not in service the grit pumps are run continuously to prevent grit accumulation. Continuous wasting of grit does not allow the grit to concentrate. In addition the additional pump run time adds unnecessary operational cost Primary Treatment Process Modifications Current primary clarifier operation wastes primary sludge continuously. This mode of operation minimizes the potential for odor production due to septic sludge. However continuous wasting does not allow for sludge thickening in the primary clarifiers prior to being pumped to the gravity thickeners. To improve sludge thickening, the primary waste sludge pumps could be run in timer mode instead of continuous mode. This would allow sludge to concentrate prior to being wasted to the gravity thickener CCTs Process Modifications After the sluice gates have been fixed and the CCT s have been cleaned, the operators should monitor the COD concentrations and depth of sludge on the bottom of the CCT s. In addition, TSS and dissolved solids measurements should be made on the weekly coliform samples to determine if there is any correlation between TSS dissolved solids and coliform counts. More frequent cleaning of the CCT s may help eliminate the periodic problems with coliform violations. Previous evaluations recommended a dye study be performed to determine the Underwood Engineers, Inc Facilities Plan Update C:\Program Files\Adobe\Acrobat 4.0\Acrobat\plug_ins\OpenAll\Transform\temp\785sec5.doc
111 mixing and flow patterns within the CCT s. We agree that a dye study will help identify areas of short circuiting, however, due to the expense and difficulty to perform we recommend waiting to see if other steps correct the problem first. CCT Operational Actions 1. Clean tanks on a regular basis to minimize grease and solids accumulation. 2. Pursue changing the City s permit limit from 70 total coliform per 100 ml to 14 fecal coliform. Fecal coliform should be easier to meet than the total coliform limits and may require less chlorine. Based on conversations with NHDES they are likely to require six months of side by side data before they allow the switch Solids Handling and Dewatering System The City should document the performance of the existing presses. The plant s operations and maintenance manual has laboratory control and record keeping sheets which we recommend the operators use. The operators need to collect this additional data each time they process sludge so the actual performance of the presses can be documented. This should confirm the 350 lbs. per meter per hour historical performance. Belt filter press fed pump run times and flow rate should be recorded to confirm the actual amount of time sludge is being dewatered. Polymer preparation and dosing is crucial to optimum performance of any dewatering system. Current operations allow for periodic overdosing of polymer, which blinds the filter belts and increases the amount of time necessary to dewater sludge. The City needs to proceed as quickly as possible to eliminate the temporary polymer system with the purchase and installation of a permanent polymer feed system. Also the operators should consider changing the polymer injection points or adjust the static mixers to see if there is an improvement. The aeration configuration in the sludge holding tanks does not provide adequate mixing of thickened sludge. Poor mixing contributes to the variability of sludge concentration being fed to the BFPs and requires constant attention to assure polymer dosing is correct. The existing storage tanks need to be retrofitted to improve mixing. This change will help with BFP Underwood Engineers, Inc Facilities Plan Update C:\Program Files\Adobe\Acrobat 4.0\Acrobat\plug_ins\OpenAll\Transform\temp\785sec5.doc
112 operations by providing a thoroughly mixed feed sludge. In addition to mixing, the existing sludge holding tanks do not provide adequate storage capacity. Typically three days of storage capacity is recommended. At average daily loads and a concentration of three percent solids, the existing tanks provide approximately two day of storage (see Table 3 of Appendix 5-6). At five percent solids the holding tanks are adequate for current average days only. The construction of an additional storage tank is needed to provide a minimum of three days storage during the future peak month. The additional sludge storage tank volume will minimize weekend operation of the BFPs due to lack of storage capacity. The data requested here will help justify funding eligibility of any equipment necessary for current and future operation of the solids handling system at the Peirce Island Wastewater Treatment Plant. At this point it appears that equipment conditions, low percent solids and variability of percent solids fed to the BFPs are the main causes of lower output from the BFPs. Additional items such as a permanent installation of the polymer feed system, modifications to the sludge holding tank and improved operation of the gravity thickener will help improve output of the presses to provide enough capacity for the immediate future SCADA Process data such as pump run times, sludge volumes and flow rates are crucial to understanding the cause and effect of plant operations. Routine data collection will improve plant operation and help predict maintenance needs. A systems control data acquisition (SCADA) computer system can facilitate tying equipment and flow monitoring devices for automatic data logging. The SCADA system will collect data from each unit process that has output signals and automatically create a historical plot of information collected. This could be the same SCADA system the City is currently working on for the pumping station monitoring. (Note: this work is currently being performed) 5.7 POTENTIAL PROJECTS The results of site visits, desktop evaluations and meetings with WWTP staff were compiled to develop a comprehensive idea list of projects for the WWTP (see Appendix 5-1). The WWTP Underwood Engineers, Inc Facilities Plan Update C:\Program Files\Adobe\Acrobat 4.0\Acrobat\plug_ins\OpenAll\Transform\temp\785sec5.doc
113 staff, the City engineer, and Underwood Engineers ranked these projects, based on relative priority and generated the list shown in Table 5-4. Unit processes that were identified as limiting the effectiveness of treatment plant performance were ranked higher than maintenance items. During the evaluation some projects were identified as maintenance projects that could be pursued by plant staff others were determined to be non-essential and were not evaluated further. The cost effective alternative evaluation and opinion of cost for priority projects are discussed in Section 6 of this report. Underwood Engineers, Inc Facilities Plan Update C:\Program Files\Adobe\Acrobat 4.0\Acrobat\plug_ins\OpenAll\Transform\temp\785sec5.doc
114 TABLE 5-4 WASTEWATER TREATMENT PLANT PROJECTS Priority WW-1 Add Inline Sludge Grinders before Thickened Sludge Pumps High WW-2 Install Chemical Addition System to Primary Clarifiers to Aid BOD 5 and TSS High Removal WW-3 Install flow meters on Primary Sludge Waste Line, Tie to SCADA System High WW-4 Replace Adjustable Belt Drives on Primary Sludge Waste Pump with VFDs High WW-5 Replace Pipe Hangers in Gravity Thickener with Corrosion Resistant Material High WW-6 Build an Additional Sludge Holding Tank High WW-7 Retrofit Existing Sludge Tank to Improve Mixing and Aeration, and Provide High Overflow WW-8 Replace Sludge Holding Tank Blowers High WW-9 Replace BFP Feed Pump Belt Drives and Motors with New Motors and VFDs High WW-10 Install Second Dechlor line to Dechlor Mix Chamber High WW-11 Add Additional Sodium Hypochlorite Tank High WW-12 Modify CCTs to Minimize Dead Zones High WW-13 Modify CCT Mix Chambers to Eliminate Short Circuiting High WW-14 Install Drains and Piping to CCTs to Allow Easier Cleaning. High WW-15 Install New Chlorine Residual Analyzer in CCT High WW-16 Install Sludge Grinders on Primary Waste Sludge Pumps High WW-17 Replace and Relocate Dewatering Room Permanganate Feed System Med WW-18 Install BFP Feed Pump Speed Control Locally at the BFPs High WW-19 Replace Safety Shut-Off on BFP #2 High WW-20 Replace Corroded Pipe Hangers in Dewatering Room High WW-21 Repair or Replace the Serpentex Sludge Conveyor High WW-22 Change Influent Sampling Location to Avoid Side Streams High WW-23 Relocate Septage Receiving Facility to Pease High WW-24 Institute and Enforce a City Wide Grease Ordinance. High WW-25 Repair Concrete Stair Around Plant High WW-26 Install an Effluent Flow Meter that will Work when the Filters are Off-line High WW-27 Install a Plant Wide SCADA System High WW-28 Replace Grit Classifier Med WW-29 Replace Grit Screws in Aerated Grit Chambers Med WW-30 Replace Existing Influent Sampler System with Refrigerated ISCO (type) Unit Med WW-31 Install curb to stop Water from Dripping Down to the Basement of the Scum Med Building WW-32 Replace Pulley Drive on Septage and Grit Chamber Blowers with VFDs Med WW-33 Build an Additional Clarifier to Handle ADF and Peak Med WW-34 Replace Center Mechanisms of Existing Clarifiers Med WW-35 Add Grinders to Primary Sludge Pumps Med WW-36 Sand Blast and Repaint Hydrant and Valve Operator Pedestals Throughout the Med Plant WW-37 Repair/Replace Hatches or Hatch Mechanisms Med WW-38 Increase Odor Control Fan Size at Gravity Thickener to Improve Air Handling Med Underwood Engineers, Inc Facilities Plan Update C:\Program Files\Adobe\Acrobat 4.0\Acrobat\plug_ins\OpenAll\Transform\temp\785sec5.doc
115 WW-39 Add additional CCT to Provide a Detention time of 15 Min. at Peak flow of 22 Med MGD WW-40 Retrofit Existing BFPs to handle Future Loads High WW-41 Install Flow Meter Totalizer on BFP Sludge Feed Line, Tie to SCADA System High WW-42 Paint Sludge Dewatering Room Med WW-43 Replace Lighting in Press Room Med WW-44 Replace Heating System in the Dewatering Building with a Hot Air System Med WW-65 Improve Air Handling System in Dewatering Room High WW-45 Repair or Replace Roof on Metal Storage Building Med WW-46 Clean Light Sensors on Yard Lights, Install Sensor Covers Med WW-47 Replace Rotary Lobe Scum Pumps Med WW-48 Repair Sludge Bay Floor Drains Med WW-49 Install New Overhead Door in Sludge Bay Med WW-50 Retrofit or Replace the Existing Quad Odor Control System Med WW-51 Replace Effluent Sampler System with Refrigerated ISCO (type) Sampler High WW-52 Relocate Grit Blower to upper level of Scum Building Low WW-53 Relocate Thickener and Septage Pumps to Basement of Scum Building Low WW-54 Install New Mechanical Bar Screen(s) Upstream of the Grit Chamber Low WW-55 Extend Deer St F.M. to Pierce Island Plant Low WW-56 Install a Septage Grit and Screenings Removal System Low WW-57 Install Motor Operators in Gates to Grit Chamber Low WW-58 Paint Piping in Scum Concentrator Building Low WW-59 Add Sonar to Measure Sludge Blanket Low WW-60 Install Deox Analyzer to Measure Bisulfite Residual in Final Effluent Low WW-61 Replace Gas Detector Low WW-62 Install a New Plant Water System Low WW-63 Cover Effluent Launders of Clarifiers and Vent to an Odor Control System Low WW-64 Cover Distribution Boxes and Vent to an Odor Control System Low Underwood Engineers, Inc Facilities Plan Update C:\Program Files\Adobe\Acrobat 4.0\Acrobat\plug_ins\OpenAll\Transform\temp\785sec5.doc

116
117 SECTION 6 RECOMMENDED PROJECTS 6.1 INTRODUCTION Sections 4 and 5 of this report present the problems identified during this evaluation. The City s collection system and WWTP were evaluated to determine the City s present and future needs to meet its environmental, infrastructure, and regulatory requirements. As part of this evaluation general problems with the collection system and WWTP were identified. Tables 6-1 and 6-2 list these general problems. In addition, these tables list some of the causes and general solutions to these problems. This 201 Facilities Plan Update is broken up into collection system (sewerage and pumping stations) and the WWTP. The goal of each portion is as follows: Collection System Evaluation Goal: The goal of the collection system evaluation is to identify projects to address sewage back-ups/flooding within the collection system and their associated public health risks. Elimination or abatement of the remaining combined sewer overflows was not a primary goal of this evaluation. However, if the recommended collection system projects are implemented, the frequency and duration of the CSO events will be reduced which will also reduce the potential costs for long term CSO abatement. Wastewater Treatment Plant Evaluation Goal: The goal of the WWTP evaluation was to identify projects which will enable the City to eliminate NPDES permit and 301 (h) waiver violations in order to comply with the Consent Decree (Civil No D) and retain 301 (h) status (i.e. avoid having to build a new secondary wastewater treatment facility). Options for funding the projects recommended in this Section will be discussed in Section 8. Not all of the projects identified here will necessarily be eligible for State Revolving Fund loans or State Aid Grants. Underwood Engineers, Inc Facilities Plan Update C:\Program Files\Adobe\Acrobat 4.0\Acrobat\plug_ins\OpenAll\Transform\temp\785sec64.doc
118 TABLE 6-1 SUMMARY OF GENERAL COLLECTION SYSTEM PROBLEMS Problem Causes Solutions Priority Flooding/Sewage Back-up Combined Sewers Targeted I/I Removal High Illicit Sewer Connections SSES of Problem Areas & Undersized Interceptors Interceptors Pump Stations not Performing Remove Tidal Inflow at Design Capacity Optimize Pumping Station Lack of Coordination between Capacity Sewer Line Crews and WWTP Upgrade Interceptor Crews Where Necessary Tidal Inflow Increase Communication Lack of Inspection and between Sewer and Cleaning WWTP Crews Unlicensed CSOs Lack of System Information Remove Unlicensed CSOs High Bypass Combined Sewers Lack of Coordination between Sewer Line Crews and WWTP Crews Pumping Station Capacity Pumping Capacity Combined Sewers Tidal Inflow High Infiltration Lack of Inspection and Cleaning Old Deteriorated Pipe High Inflow Tidal Inflow Combined Sewers Targeted I/I Removal Increase Communication between Sewer and WWTP Crews Optimize Pumping Stations Remove Tidal Inflow Optimize Pumping Station Capacity Upgrade Interceptor Where Necessary Targeted I/I Removal Remove Tidal Inflow CSO / South Mill Pond Combined Sewers Perform I/I Removal CSO Abatement and Removal Provide Inline/offline Storage High High Med Med Med Water Quality No Treatment of CSOs Remove Illegal CSOs High Unknown Condition of Lack of Inspection and Flow Monitoring High Collection System Pipes Cleaning SSES of Problem Areas & Interceptors Interceptor Capacity Combined Sewers SSES of Problem Areas & Med Interceptors Upgrade Interceptors Failing Septic Systems Extend Sewers to Low Eliminate Septic System Problems 1 Priority ((High) Immediate, (Medium) 5 to 10 year and (Low) 10 to 20 year projects) Underwood Engineers, Inc Facilities Plan Update C:\Program Files\Adobe\Acrobat 4.0\Acrobat\plug_ins\OpenAll\Transform\temp\785sec64.doc
119 TABLE 6-2 SUMMARY OF GENERAL WWTP PROBLEMS Problem Causes Proposed Solutions Priority BOD 5 Removal WWTP not Designed for 30% BOD 5 removal High % Soluble BOD 5 Side Stream Interference Chlorine Contact Tank (CCT) Disinfection Efficiency Solids Accumulation in CCT CCT Configuration Chemically Enhanced Primary Relocate Septage to Pease Increase Frequency of CCT Cleaning Modify CCT Configuration Excess Flow Combined Sewers Perform Targeted I/I Removal Projects Premature Equipment Failure PEF Sand Loss Salt Water in Collection System Lack of Adequate Funding and Implementation of Preventive Maintenance Solids Handling Not Enough Sludge Holding Tank Capacity Poor Mixing in Existing Sludge Holding Tank Belt Filter Press Performance Primary Effluent Filters (PEF) Performance WWTP Permit Compliance Lack of Process Control Data PEF Sand Loss Fats Oils and Grease in Wastewater Not Designed for 30% BOD Removal Lack of Data BOD 5 Coliform Violations Modify Filters to Eliminate Sand Loss Fully Fund and Implement Preventive Maintenance Program Install Tide Gates High Med High Med Solids Handling Upgrades High Mothball PEF Modify to Eliminate Sand Loss Implement Fats Oils and Grease Requirement from Sewer Use Ordinance Perform PEF Evaluation Chemically Enhanced Primary Relocate Septage to Pease Modify CCT Configuration Increase Process Control Sampling/Data Collection to improve average Budget Constraints Increase Process Control Sampling/Data Collection 1 Priority ((High) Immediate, (Medium) 5 to 10 year and (Low) 10 to 20 year projects) High High High Underwood Engineers, Inc Facilities Plan Update C:\Program Files\Adobe\Acrobat 4.0\Acrobat\plug_ins\OpenAll\Transform\temp\785sec64.doc
120 6.2 PROJECT SELECTION METHODOLOGY As part of the 201 Facilities Plan Update existing maintenance and plant operational records were reviewed, hydraulic evaluations of the WWTP and collection system were performed, unit process evaluations of the WWTP were performed, site visits were made and meetings with collection system and treatment plant staff were held to solicit their input. From these efforts a list of potential projects were identified. These projects were identified as either maintenance or capital improvement projects and the City staff ranked them in order to determine their relative importance. Once projects were sorted and ranked they were evaluated to determine whether they accomplished the immediate goals of eliminating sewage backup/flooding, improve NPDES/301 (h) compliance and or address the problems presented in Tables 6-1 and 6-2. Where applicable, cost-effective analysis was preformed to determine the most cost-effective option to correct these problems. These cost-effective analyses are included in the Appendices. In addition, the projects that have been identified but were not listed here as high priority are listed in Appendices along with their opinion of costs and design documentation. Projects were ranked in order of priority and are presented as immediate (High), 5 to 10 year (Medium) and 10 to 20 year projects (Low). Immediate projects are projects that are presently needed to meet current permit and collection system requirements. Five to 10 year projects are projects that should be budgeted for and preliminary design should begin within the next five years. Ten to 20 year projects are projects that will likely be necessary to meet the City s twenty-year capacity needs. The evaluation of alternatives was done using a present worth factor. Alternatives such as chemically enhanced primary clarification have operational costs, which effect the true cost of the project. These costs include operation, maintenance, labor and materials and power. These costs vary over the life of the project. Application of a Present Worth Factor to consumable items allows a current value to be estimated for an annual cost. This process allows the true cost of alternatives to be compared. For the purpose of this report the EPA standard values of 20 Underwood Engineers, Inc Facilities Plan Update C:\Program Files\Adobe\Acrobat 4.0\Acrobat\plug_ins\OpenAll\Transform\temp\785sec64.doc
121 years of payments at an interest of eight (8) percent were used to perform present worth evaluations. 6.3 REVIEW OF PROPOSED COLLECTION SYSTEM PROJECTS As identified above in Table 6-1, the major problems within the collection system are excess flow, flooding/sewage backup, and CSOs. These problems contribute to capacity problems within the sewers and at the pumping stations and water quality problems. The solutions to these problems in general either eliminate the excess flow or increase the capacity of the system to be able to convey these flows to the wastewater treatment plant Treatment Versus I/I Removal The option of treating all of the excess flows was briefly evaluated and determined to be too costly due to the fact that the collection system, sewers and pumping stations, can not currently convey the existing peak wet weather flows nor can the treatment plant hydraulically handle the peak flow. To upgrade the collection system and treatment plant to handle the projected peak flow of over 60 million gallons per day would cost in excess of $46 million. However, complete separation is also extremely expensive and may not be necessary. Complete separation was projected to cost as much as $27 million by Whitman and Howard, (1990) or approximately $35 million in 1999 dollars. Cost calculations are in Appendix 6-8. As an alternative to complete treatment or separation, partial separation versus an incremental increase in flow to the plant was evaluated. In order to treat an additional 10 mgd of wastewater, the following modifications would be required. Deer Street force main would have to be extended to the WWTP. A new outfall would have to be installed. The current outfall hydraulic capacity is 26 mgd. An additional clarifier would have to be constructed to handle peak flows. Additional CCT capacity to provide 15 minutes detention time at peak flow. The Strawberry Bank interceptor sewer would have to be replaced from Parrott Avenue to the Mechanic Street pumping station to add capacity. Existing sewer s capacity is 17 mgd. Underwood Engineers, Inc Facilities Plan Update C:\Program Files\Adobe\Acrobat 4.0\Acrobat\plug_ins\OpenAll\Transform\temp\785sec64.doc
122 The opinion of cost for this option not including the additional operations and maintenance cost is approximately $5,000,000. Cost calculations are in Appendix 6-8. If this same amount of money was spent on separation, approximately 160 acres of city could be separated. This would amount to a removal of over 12 mgd of flow during a 2 year rain event (3.2 inches). Based on cost and the fact that during heavy rain event additional flow would be eliminated from the collection system, targeted I/I removal is the most cost-effective option. It is important to note that this evaluation does not directly consider CSO impacts and the cost to treat CSO versus separation. The goal of targeted separation is to help minimize sewage back-ups/flooding. The additional benefit is that the frequency and duration of CSOs will be reduced. Once the most cost effective I/I removal projects have been completed to address sewer backups the issue of cost to treat versus separation will have to be revisited in light of CSO abatement. It is anticipated that this issue will be covered in depth during the CSO Long Term Control Plan (LTCP). The CSO LTCP will be done concurrently with the targeted I/I removal projects The LTCP will have flexibility to incorporate additional flow data as the I/I removal projects are completed and their effectiveness determined. The LTCP is scheduled to start within the next year and will last two to three years Priority Sewer Projects Based on the goal of eliminating sewage back-ups/flooding the following list of high priority projects was developed. These projects are not contingent upon completion of other projects. Some of these projects are currently underway or have been recently completed. These projects are listed in order of priority. Project: Install tide gates at Deer Street Tide Chamber $2,000 Comment: This project successfully eliminated tidal inflows that contributed to flooding/backups in the Brick Box sewer basin (Completed) Phase I SRF Loan Underwood Engineers, Inc Facilities Plan Update C:\Program Files\Adobe\Acrobat 4.0\Acrobat\plug_ins\OpenAll\Transform\temp\785sec64.doc
123 Project: Install tide gates at CSO 10B at South Mill Pond $4,700 Comment: This project will help reduce flooding/backups in the Richards Ave Area (completed) Phase I SRF Loan Project: Deer Street Tide Chamber Flow Monitoring $18,000 Comment: Install flow monitoring equipment and rain gage to determine the CSO activity and volume at the Deer Street Tide Chamber. Project: Install stop logs at Mechanic Street pumping station by-pass structure $100 Comment: During high tides seawater inflow takes up capacity at the Mechanic Street pumping station, which contributes to CSOs flooding and backups in the Richards Avenue area and South Mill Pond. (Completed) Project: Clean, video inspect, and rehabilitate as necessary the Brick Box sewer. $250,000 Comment: The 100+ year old Brick Box has never been fully cleaned or inspected. Currently the Brick Box has over 20 inches of material settled in it. This material takes up necessary capacity and contributes to flooding and backups. (Underway, cleaning and video inspection completed) Phase I SRF Loan. Project: Separate Thaxter Street/Fells Road area. (Brick Box System) $900,000 Comment: This portion of the Brick Box system currently drains a swamp off of Fells Road. In addition, sections of collapsed root clogged pipe contribute to flooding in this area. Flow monitoring identified 2 mgd excess flow, from a one (1) inch rain storm, from this area which contributes to flooding within the Brick Box System. (Underway) Phase I SRF Loan. Underwood Engineers, Inc Facilities Plan Update C:\Program Files\Adobe\Acrobat 4.0\Acrobat\plug_ins\OpenAll\Transform\temp\785sec64.doc
124 Project: Separate Essex & Sheffield Road area. (Brick Box System) Comment: (Completed) City Maintenance Budget $30,000 Engineering Work by City, not SRF Funded. Project: Perform SSES, i.e. Clean and video inspect the major interceptors and problem areas (see Plate 2.) $250,000 Comment: In order to accurately determine the causes of sewage backups/flooding throughout the City the main interceptors and selected problem areas will be video inspected and cleaned. This step is necessary to ensure the most cost effective projects are completed first. In addition, this work is necessary to ensure funding eligibility. Phase II SRF Loan. Project: South Street I/I Removal $200,000 Comment: This section of combined sewer contributes to flooding, sewage backups and CSO around the South Mill Pond. This project will be coordinated with the City s paving program to take advantage of the cost savings of resurfacing the road. (underway) Project: Oil and Grease Program $26,000 Comment: This project will establish an oil and grease program to improve compliance with the sewer use ordinance. Project: NHDES Cross Connection Investigation $100,000 Comment: On-going efforts by NHDES to identify and eliminate sewer cross connections has identified a number of areas in the City where sewers are cross connected to storm drains. These funds are intended to allow the City to respond quickly when a cross connection is identified. Underwood Engineers, Inc Facilities Plan Update C:\Program Files\Adobe\Acrobat 4.0\Acrobat\plug_ins\OpenAll\Transform\temp\785sec64.doc
125 In addition to the priority projects identified above, the following projects are of high priority but are contingent upon the results of the SSES investigations. These projects were identified to solve known problems and depending upon the results of the SSES, will either be pursued or tabled until funding is available. Opinions of costs for these projects are included here for budgeting purposes. Project: I/I Removal Chevrolet Avenue area. Phase II SRF Loan. (Brick Box System) $1,500,000 Comment: This area of the City routinely has sewage backups/floods and contributes excess flow to the Brick Box System. Project: Upgrade/Perform I/I Removal on Sewer from Lafayette Road to Sagamore Cemetery $1,500,000 Comment: This area is part of the major interceptor that contributes excess flow to CSOs 10A and 10B and flooding/sewage backup to Lincoln Ave. Willard Ave., Ash and Orchard neighborhoods Phase II SRF Loan. Project: Lincoln Vault to South Mill Pond I/I Removal $400,000 Comment: This proposed project would perform I/I removal in the Richards Avenue area. and the neighborhoods around the South Mill Pond to be separated. Phase II SRF Loan Project: I/I Removal Islington Street between Albany Street and Cabot (Brick Box Sewer) $400,000 Comment: This project will remove I/I from the area off of Islington Street between Albany Street and Cabot Street. These areas currently experience flooding and backup during peak rains and contribute to Brick Box flooding. Phase II SRF Loan. Underwood Engineers, Inc Facilities Plan Update C:\Program Files\Adobe\Acrobat 4.0\Acrobat\plug_ins\OpenAll\Transform\temp\785sec64.doc
126 Project: Separate Panaway Manor (Brick Box System) $500,000 Comment: This project provides I/I removal for the combined portions of Panaway Manor. Phase II SRF Loan. Project: I/I Removal, Meadow Road Area (Maplewood Basin) $280,000 Comment: This project provides I/I removal to the combined portions of Meadow Road area. Phase II SRF Loan. Project: I/I Removal, Dennett Street Area (Maplewood Basin) $350,000 Comment: Will eliminate existing cross connections at Burkitt St. and Dennett St. and cross connection on Clinton St. and separate storm drains to eliminate flooding and sewage backups. Phase II SRF Loan. Project: CSO Long Term Control Plan $208,000 Comments: As part of ongoing efforts to address the Consent Decree (civil No D) the city has committed to updating their 1991 CSO abatement program. Phase II SRF Loan. Project: Remove unlicensed CSOs at State St. and Marcy St., Ceres St. and Burkitt St. $10,000 Comment: These unlicensed CSOs were identified during this facilities plan update. Upon completion of the priority projects, additional flow monitoring will confirm the success of the separation projects. The following projects may be necessary depending upon the success of the Phase II SRF loan projects. Underwood Engineers, Inc Facilities Plan Update C:\Program Files\Adobe\Acrobat 4.0\Acrobat\plug_ins\OpenAll\Transform\temp\785sec64.doc
127 Project: Remaining combined sewer areas should be considered for separation or inline/offline storage as problems arise and if further CSO reduction is necessary To Be Determined ($TBD) Comment: Phase III SRF Loan if Necessary Project: Upgrade sewer interceptors for future flows as necessary. $TBD Comment: Phase III SRF Loan if Necessary Project: Construct new sewers in developing areas as necessary and in areas of failing subsurface disposal systems. $TBD Comment: Phase III SRF Loan if Necessary Project: Implement CSO Long Term Control Plan. $5,000,000 * Comment: This may entail further I/I Removal, offline/online storage, or CSO treatment. *The $5.0M cost is based on the 1991 CSO Abatement Program estimate. This cost will vary depending upon the findings and recommendations of the Long Term Control Plan to be developed over the next two to three years Additional Sewer Projects In addition to the priority projects, a number of projects were identified. These projects include sewer extensions to areas that are not currently sewered, sewer upgrades to address present and future capacity limitations, and sewer extensions to serve homes with failed septic systems. Backup to these projects is presented in Appendix 6-1. Borthwick Avenue Sewer Replace $500,000 Willard, Ash, Orchard Sewer Upgrade $365,000 Lafayette Interceptor North $1,329,800 Brackett Road and Brackett Lane Extension $65,400 CMA Report Lafayette Sewer Interceptor $1,000,000 Underwood Engineers, Inc Facilities Plan Update C:\Program Files\Adobe\Acrobat 4.0\Acrobat\plug_ins\OpenAll\Transform\temp\785sec64.doc
128 Hillcrest Estate Forcemain Extension $101,800 Country Club Road Sewer Upgrade $38,000 Failed Septic, McGee Drive $150,000 Greenland Road Sewer Extension $450,000 $3,500,000 Cabot Street Sewer - State end to McDonough * Court Street Area * Strawberry Bank Sewer Interceptor Upgrade * Downtown area around State Street Penhallow Area * Failed Septic, Elywin Road * Failed Septic, Sagamore Avenue North of Bridge * Summer Street at Middle * Gate Street Upgrade * Jones Avenue Sewer Extension * Ocean Road Sewer Extension * Banfield Road Sewer Extension * $1,000,000 * One million dollars has been allocated to perform a portion of these projects that are deemed the highest priority within the next twenty years. 6.4 PRIORITY PUMPING STATION PROJECTS Listed below are major pumping station capital projects identified as part of the 201 Facilities Plan update. The goal of the pumping station evaluation was to maximize the flow to the Wastewater Treatment Facility to minimize flooding and sewage backups. For this evaluation it was assumed that the current design capacities of Mechanic Street and Deer Street would remain 22 mgd and mgd respectively. Items that are considered maintenance in nature are listed in Table 4-4 and in the Appendix 5-1. The following projects are high priority and are not contingent upon further investigation. Project: Install New SCADA system for pumping stations $350,000 Comment: This project is currently underway and will be paid for through the Phase I SRF Loan. This project will improve operation and maintenance through automated data collection and system monitoring. Project: Design Rye Line pump station upgrades $12,500 Underwood Engineers, Inc Facilities Plan Update C:\Program Files\Adobe\Acrobat 4.0\Acrobat\plug_ins\OpenAll\Transform\temp\785sec64.doc
129 Comment: The Rye Line pumping station is currently at capacity during times of significant rain. Future flow projects indicate additional capacity is required. This project includes the design necessary to upgrade this station. Phase I SRF Loan. Project: Design Gosling Road pump station upgrades $12,500 Comment: The Gosling Road pumping station is currently at capacity during times of significant rain. Future flow projects indicate additional capacity is required. This project would include design necessary to upgrade this station. Phase I SRF Loan Mechanic Street The Mechanic Street pumping station pumps all the flow collected within the City of uth to the Peirce Island WWTP. The station is equipped with two 22 mgd submersible dry well mounted centrifugal pumps. The following projects have been identified as high priority projects which should be completed immediately. Project: Evaluation Mechanic Street pumping station to determine the cause of pump capacity problem. (City to Pursue) Comment: Despite the fact that both pumps were overhauled in the Fall of 1998, they still do not meet the design capacity of 22 mgd. The inability to pump at its design capacity causes additional CSO events and adds to flooding and sewage backups. The pump manufacturer has indicated that they will work with the City to determine the cause pump capacity problem. Project: Upgrade Screenings system at Mechanic Street pump station $200,000 Comment: This project is currently underway and is funded as part of the Phase I SRF Loan. The new system would wash and dewatering the screenings. The original design, ground the screenings and discharged them into the flow to be pumped to the WWTP. Project: Repair or replace odor control system $13,600 Underwood Engineers, Inc Facilities Plan Update C:\Program Files\Adobe\Acrobat 4.0\Acrobat\plug_ins\OpenAll\Transform\temp\785sec64.doc
130 Comment: This project is included as part of the upgrade to the screening system. Currently the odor control system is not being operated. This pumping station is in a residential area and efforts should be made to minimize odors. Project: Upgrade air conditioner unit $10,000 Comment: Existing air conditioner does not provide adequate cooling for the pumping station. Project: Upgrade stop gates in influent channel $10,000 Comment: The existing stop gates were not upgraded as part of the last pumping station upgrade. These gates are necessary to provide a means to access the existing bar screen to perform maintenance. Project: Provide Permanent By-pass Pumping $280,000 Comment: Because the existing pumps are custom made spare parts and repairs take a long time. In 1998 both pumps were out of service for 5 months and by-pass pumping rental cost $30, Deer Street The Deer Street Pumping station pumps flow from the Box Sewer Basin, Maplewood Avenue, Gosling Road, Atlantic Heights and Leslie Drive sewerage basins to the Mechanic Street Sewerage Drainage Area. The design capacity of the station is mgd at 57 feet of head. Recent drawdown tests indicate the actual capacity is around 9.75 mgd. This drawdown value was checked during a rain event to determine the head and flow conditions to see where the pump was running on its pump curve. Based on this check, the pressure which the pump was pumping against was greater than the 57 feet it is rated for, which explains in part why the pumps are not pumping at the mgd they were designed for. The excess head may be due to build- Underwood Engineers, Inc Facilities Plan Update C:\Program Files\Adobe\Acrobat 4.0\Acrobat\plug_ins\OpenAll\Transform\temp\785sec64.doc
131 up of solids in the force mains, a partially closed valve or complete closure of one of the two parallel force mains. Based on flow projections the current limited capacity of Deer Street pumping station is adequate for future sanitary flows. Because sections of the drainage areas that flow to the Deer Street pumping station are still combined the potential for flows greater than the pumping stations capacity will continue. Inflow/infiltration removal projects currently underway within the Brick Box Sewer Basin will help reduce and may eliminate the majority of the excess flow. Like the Mechanic Street pumping station, Deer Street is a duplex station. Each pump is designed to handle the pump station capacity. Ideally a third pump should be provided for redundancy when one of the two main pumps is down for repair. The following projects were identified as immediate priorities. Project: Evaluation Deer Street pumping station to determine the cause of pump capacity problem (City to Pursue) Comment: The pump manufacturer has indicated that they will work with the City to determine the cause pump capacity problem. In addition this evaluation should investigate pump control modifications to reduce the short cycling of the pumps during low flows. Short cycling increases wear and tear on pumps. Project: Upgrade existing comminutor with channel grinder $78,000 Comment: The existing comminutor is periodically submerged causing maintenance issues. A new submersible channel grinder would allow continuous operation even while submerged. Underwood Engineers, Inc Facilities Plan Update C:\Program Files\Adobe\Acrobat 4.0\Acrobat\plug_ins\OpenAll\Transform\temp\785sec64.doc
132 Project: Repair or replace odor control system. $13,600 Comment: The existing odor control system requires upgrade. Odor complaints have been lodged concerning odors from Deer Street pumping station. Project: Upgrade air conditioning unit. $10,000 Comment: Existing air conditioner does not provide adequate cooling for the pumping station. Project: Replace generator enclosure. Comment: Existing generator enclosure is corroded and requires replacement. (City to Pursue) Rye Line Pumping Station Project: Rye Line pumping station upgrades $187,500 Comment: Construction of the upgrades designed in the Phase I SRF Loan Golsing Road Pumping Station Project: Gosling Road pumping station upgrades $187,500 Comment: Construction of the upgrades designed in the Phase I SRF Loan Excess Pumping Station Run Times Based on a review of pumping station run times the Atlantic Heights, Marcy Street, Mill Pond Way and Woodlands II pumping stations were determined to have periods of excess run times. Underwood Engineers, Inc Facilities Plan Update C:\Program Files\Adobe\Acrobat 4.0\Acrobat\plug_ins\OpenAll\Transform\temp\785sec64.doc
133 Total pump station run times in excess of 12 hours indicates when a constant speed pumping station is at capacity. It appears that the excess run times correspond to rain events indicating inflow. We recommend City staff investigate the causes of these excess run times. Sewer system evaluation studies may be necessary to identify excess inflow and infiltration Upgrade Lafayette Pumping Station The Lafayette pumping station, pumps wastewater collected from the southern portion of the City to a gravity sewer near Willard Avenue. The Lafayette pumping station currently can not keep up with peak rain events. Twenty year projected flows for the Lafayette pumping station indicate peak flows as high as 7.4 mgd (5,141 gpm). This flow value is a buildout projection and is dependent upon development patterns in uth and Rye. Assuming half the development occurs in the next 10 years the expected peak flow would be approximately 5.7 mgd (4,000 gpm). In addition to capacity problems the station s electrical controls need upgrade or replacement. The current controls are a safety hazard. The following is a list of projects at the Lafayette pumping station. A more detailed problem list is included in Appendix 4-3. Project: Replace Pump Controls & Upgrade cooling System on Emergency Generator. $120,000 Comment: The existing control are a safety hazard. Pump selection is done by cannon plug removal and repositioning. Several people have been shocked doing this. Electrodes in and electrolyte solution control the variable speed drive. It is dangerous adding the solution when it is low. Project: Upgrade the Pumping Station Capacity. $100,000 Comment: Upgrade pumping capacity to handle 10 year projected flows with configuration to handle 20 year flows. An SSES of the Lafayette drainage basin should be done prior to the upgrade to ensure appropriate pump selection. Underwood Engineers, Inc Facilities Plan Update C:\Program Files\Adobe\Acrobat 4.0\Acrobat\plug_ins\OpenAll\Transform\temp\785sec64.doc
134 6.4.7 Additional Pumping Station Projects In addition to the priority projects that are recommended for implementation and routine maintenance a number of projects that potentially could be required were identified and listed below Mechanic Street Potential long-term projects that were identified for the Mechanic Street pumping station include the following. Project: Install grit removal vault $150,000 Comment: Pursue if the pumping station evaluation identifies grit as a significant cause of poor pump performance Deer Street Potential long-term projects that were identified for the Deer Street pumping station include the following. Project: Install grit removal vault. $150,000 Comment: Pursue if the pumping station evaluation identifies grit as a significant cause of poor pump performance. Project: Install by-pass emergency pump. $100,000 Comment: The pump manufacturer indicated that they would give or sell to the City at cost an emergency by-pass pump that could be installed in the by-pass vault adjacent to the pumping station. This project would provide piping and electrical quick connect to allow a portable submersible pump to lowered into the existing by-pass wetwell when necessary. This pump would be able to be used at the Mechanic Street Underwood Engineers, Inc Facilities Plan Update C:\Program Files\Adobe\Acrobat 4.0\Acrobat\plug_ins\OpenAll\Transform\temp\785sec64.doc
135 pumping station as well. 6.5 PEIRCE ISLAND WWTP In general, the Peirce Island treatment plant does not require any major modifications to increase its capacity. It will, however, require process modifications to meet its NPDES permit requirements for BOD 5 removal and coliform limits. Listed below are the major capital projects identified as part of the 201 Facilities Plan update necessary to meet the goals of eliminating NPDES permit and 301 (h) waiver violations and retain 301 (h) status (i.e. avoid having to build a new secondary wastewater treatment facility). Additional capital projects with an opinion of cost are listed in Table 6-3. Attached in Appendix 5-1 is a complete list of treatment plant projects including maintenance and operational recommendations. Additional data supporting the opinions of cost are included in Appendix Advanced Primary Treatment Options In order to comply with the requirements of the 301 (h) waiver of the City s NPDES permit, some form of advanced primary treatment will be necessary. The existing primary effluent filters PEFs were designed to remove 50 to 70% TSS to aid in disinfection by removing clumps of solids that could shield bacteria. Although it was not designed specifically for BOD 5 removal, the manufacturer anticipated the PEFs would provide an additional 30 to 50% removal of BOD 5. However, since start-up the PEFs have had limited success meeting the TSS removal efficiency and may not have significantly increased BOD 5 removal. The PEF system has been a maintenance problem since it went on-line. Currently the system is off-line and requires a an overhaul to put it back on-line. Concurrent with this report, the City performed pilot studies on two alternate filter systems a Dynasand filter by Parkson and an Aqua Disk by Aqua Aerobics and has contacted the PEF design engineers (Earth Tech) and asked them to determine what it would require to make the PEFs functional again and if the system can reliability meet the new 301 (h) requirements of 30 Underwood Engineers, Inc Facilities Plan Update C:\Program Files\Adobe\Acrobat 4.0\Acrobat\plug_ins\OpenAll\Transform\temp\785sec64.doc
136 percent removal of BOD 5. This evaluation has been completed and did not yield a conclusive answer. Therefore, additional evaluation of the PEF system is recommended. Use of the PEF in conjunction with chemically enhanced primary clarification may be part of the long term strategy to comply with NPDES and 301(h) waiver requirements. As an alternative to primary effluent filtration, the City is currently performing a full-scale pilot evaluation of chemically enhanced primary clarification. Chemically enhanced primary clarification using metal salts with or without polymer can be used to enhance removal efficiency and improve clarifier performance. Data collected from the pilot study to date indicate a 40% removal of BOD 5. A cost effectiveness evaluation was performed comparing primary filtration options to chemically enhanced primary clarification. This cost effectiveness evaluation is attached in Appendix 6-3. Based this evaluation and the pilot study data, chemical is the most cost effective means of meeting the BOD 5 removal requirements to meet the City s permit requirements. However, the pilot data also showed potential limitations to chemically enhanced clarification. During August 1999, dry weather flow increased the influent strength of the wastewater. The chemical feed pumps were not large enough to pump the theoretical dosage required to lower the BOD 5 below permit limits and a permit violation occurred. Since that time new chemical metering pumps have been put in place and the permit limits are being met. We recommend that the chemically enhanced pilot study be continued and that the pilot be expanded to include concurrent piloting of the PEFs. This additional piloting will be part of the preliminary design for enhanced organics removal system including the chemically enhanced primary system. This piloting will document removal efficiencies of the PEFs with and without chemical addition. Project: Enhanced Organics Removal System Primary Clarification $270,000 Comment: The Enhanced Organics Removal System will include chemically enhanced primary clarification, Primary Effluent Filtration and both in combination. The project will include piloting during the preliminary design to ensure equipment is sized properly and that Underwood Engineers, Inc Facilities Plan Update C:\Program Files\Adobe\Acrobat 4.0\Acrobat\plug_ins\OpenAll\Transform\temp\785sec64.doc
137 removal efficiencies are known before the project goes to construction The equipment and controls for the existing chemically enhanced pilot study would be would housed in a permanent structure. Phase II SRF Loan Disinfection Reliability Based on an evaluation of the disinfection system and a review of permit violations since the plant was upgraded in 1991, the existing chlorine contact tank (CCT) and disinfection system is not reliably disinfecting the wastewater. The current NPDES permit requires a total coliform count of 70 colonies per 100 mls, however, the regulations allow an alternative permit limit of 14 fecal coliform. The WWTP staff have been taking side by side samples to compare disinfection effectiveness for total versus fecal and have shown despite violations for total coliform the fecal coliform limits are continuously met. We recommend the City continue to pursue a permit modification making their permit limit fecal coliforms. Assuming the permit modification is granted the existing disinfection system would require minimal upgrades other than routine maintenance. If the permit modification were denied we recommend the following projects be pursued immediately. Additional information supporting these costs is included in Appendix 6-4. Project: Modification to the chlorine contact tank. Install new chlorine residual analyzer. Install scum removal trough Install tank drain to improve cleaning $85,000 Comment: Included is a dye study to confirm flow patterns to eliminate short circuiting. Phase II SRF Loan Project: Effluent flow pace chemical feed system $53,000 Underwood Engineers, Inc Facilities Plan Update C:\Program Files\Adobe\Acrobat 4.0\Acrobat\plug_ins\OpenAll\Transform\temp\785sec64.doc
138 Comment: Currently disinfectant is paced off the Mechanic Street pumping station flow meter. This may contribute to inaccurate dosing of disinfectant. Phase II SRF Loan Project: Add additional hypochlorite storage tank $53,000 Comment: Current storage capacity is not adequate during the summer. Phase II SRF Loan Project: Construct new CCT or retrofit filter building to be used as CCT to provide additional chlorine contact time. $1,100,000 Comment: If after the above projects have been completed, the plant is since not meeting its Phase III SRF Loan if Necessary Solids Handling The solids handling and dewatering systems require a number of modifications to meet the wastewater treatment plant s current and future needs. These include the following projects. In addition, we recommend the City investigate the cost saving potential of replacing their existing belt filter press sludge dewatering system with an alternative Rotary Press. Based on a preliminary cost evaluation it appears this new system would significantly reduce the operation and maintenance costs and disposal costs for processing sludge and could have a payback as short as 5 years. Additional information supporting these costs are included in Appendix 6-5. Project: Installation of a new sludge holding tank $250,000 Comment: Current sludge storage capacity is not adequate Phase II SRF Loan Project: Modify existing sludge storage tanks $75,000 Comment: The existing aeration system does not provide adequate Underwood Engineers, Inc Facilities Plan Update C:\Program Files\Adobe\Acrobat 4.0\Acrobat\plug_ins\OpenAll\Transform\temp\785sec64.doc
139 mixing, which makes it harder to dewater sludge. Phase II SRF Loan Project: Upgrade existing sludge conveyor $80,000 Comment: The existing conveyor is in disrepair and requires upgrade. Phase II SRF Loan Project: New polymer feed system $--- Comment: This project is currently underway. Improper dosing of polymer contributes to additional time and cost of sludge dewatering (Completed) Project: Perform Feasibility Evaluation on Alternative Dewatering System. $2,500 Comment: This evaluation will determine the cost effectiveness of an alternative dewatering system to replace the existing belt filter presses. This evaluation is necessary to ensure maximum funding eligibility. (Completed) Project: Retrofit existing belt filter presses $60,000 Comment: The two existing one meter belt filter presses require significant maintenance and is contributing to difficulty dewatering sludge. This project is contingent upon the outcome of the investigation into an alternative means of dewatering. Phase II SRF Loan Septage Receiving In addition to chemically enhanced primary clarification, relocating the Peirce Island septage receiving facility to the Pease Tradeport wastewater treatment facility would help reduce the BOD 5 load at the Peirce Island WWTP. These options were evaluated to determine the most cost Underwood Engineers, Inc Facilities Plan Update C:\Program Files\Adobe\Acrobat 4.0\Acrobat\plug_ins\OpenAll\Transform\temp\785sec64.doc
140 effective means of receiving septage at the Pease WWTP. This evaluation is included in Appendix 6-6. Project: Relocate Septage Receiving Facility to Pease $170,000 Comment: Septage rates should be adjusted to cover the additional capital cost of the move Additional Projects In addition to the priority projects listed above, this evaluation identified a number of capital projects which if constructed would improve operations, reduce operation and maintenance costs and extend the life of existing equipment. Many of these projects can be included as part of bigger projects to take advantage of economies of scale or can be addressed as part of the WWTP s operating budget. Table 6-3 lists these additional projects and an opinion of cost for each. Supporting documentation for these opinions of costs and equipment cuts are included in Appendix 6-7. Underwood Engineers, Inc Facilities Plan Update C:\Program Files\Adobe\Acrobat 4.0\Acrobat\plug_ins\OpenAll\Transform\temp\785sec64.doc
141 TABLE 6-3 Additional Capital Projects Project Opinion of Cost New Primary Clarifier $1,010,000 Chemical/Sand Storage Building $60,000 Install Sludge Grinders on Primary Waste Sludge Pumps $20,000 Replace and Relocate Dewatering Room Permanganate Feed System $35,000 Replace BFP Feed Pump Belt Drives and Motors with New Motors and VFDs and install new speed control local to the BFPs $40,000 Install flow meters on Primary Sludge Waste Line, Tie to SCADA System $5,700 Replace Adjustable Belt Drives on Primary Sludge Waste Pump with VFDs Replace Pipe Hangers in Gravity Thickener with Corrosion Resistant Material $10,000 $500 Add Inline Sludge Grinders before Thickened Sludge Pumps $20,000 Change Influent Sampling Location to Avoid Side Streams $5,000 Install a Plant Wide SCADA System $350,000 Replace Grit Classifier $55,000 Replace Grit Screws in Aerated Grit Chambers $54,000 Replace Existing Influent Sampler System with Refrigerated ISCO type Unit $4,000 Replace Pulley Drive on Septage and Grit Chamber Blowers with VFDs $21,000 Replace Center Mechanisms of Existing Clarifiers $210,000 Add Grinders to Primary Sludge Pumps $45,000 Increase Odor Control Fan Size at Gravity Thickener to Improve Air H dli $7,000 Underwood Engineers, Inc Facilities Plan Update C:\Program Files\Adobe\Acrobat 4.0\Acrobat\plug_ins\OpenAll\Transform\temp\785sec64.doc
142 Handling Install Flow Meter Totalizer on BFP Sludge Feed Line, Tie to SCADA System Upgrade Heating System and Air Handling System in the Dewatering Building with a Hot Air System $5,700 $250,000 Replace Rotary Lobe Scum Pumps $4,000 Repair Sludge Bay Floor Drains $1,500 Install New Overhead Door in Sludge Bay $4,000 Retrofit the Existing Quad Odor Control System $14,000 Replace Effluent Sampler System with Refrigerated ISCO Sampler $4,000 Relocate Grit Blower and Thickener Pumps to in Scum Building $10,000 Install New Mechanical Bar Screen(s) Upstream of the Grit Chamber $581,000 Add Sonar to Measure Sludge Blanket $10,500 Install Deox Analyzer to Measure Bisulfite Residual in Final Effluent $10,000 Replace Gas Detector $10,000 Install a New Plant Water System $63,000 Cover Effluent Launders of Clarifiers and Distribution Boxes Vent to an Odor Control System $150,000 Contingency $361,000 Total $ 3,430,900 Underwood Engineers, Inc Facilities Plan Update C:\Program Files\Adobe\Acrobat 4.0\Acrobat\plug_ins\OpenAll\Transform\temp\785sec64.doc
143 SECTION 7 PEASE SEWER EVALUATION 7.1 INTRODUCTION The wastewater collection system at the Pease International Tradeport originally served the needs of the Air Force from 1954 to It is currently leased by the Pease Development Authority and maintained by the City of uth and consists of approximately 15 miles of sewer pipe ranging from 6 to 27 inches in diameter, 400 manholes and seven pumping stations. An additional private pumping station is located at the Jones School. The collection system today, shown in Figure 7-1, remains essentially unchanged since 1990 with the exception of some limited trunkline upgrades and abandonment of a network of lines in the former Air Force housing area (Parcel I). The future development anticipated at the Tradeport will in short time strain an already stressed sewer system requiring a strategy that includes up-to-date investigations, and proactive line rehabilitation and upgrades. The purpose of this evaluation has been to identify, from the available information, areas of priority where problems require rehabilitation/reconstruction, and determine the areas which are currently capacity limited, or will soon be capacity limited due to development. Future investigations have been recommended for priority areas with inadequate available information. Recommendations for sewer rehabilitation/reconstruction projects and upgrades have also been developed. The WWTP was upgraded in 1996 to provide capacity for future growth at the Tradeport. An evaluation of the WWTP was not included as part of this Facilities Plan update. However, capital and maintenance projects identified by WWTP staff have been included in Appendix 7-5 for planning and budgeting purposes. Underwood Engineers, Inc Facilities Plan Update C:\Program Files\Adobe\Acrobat 4.0\Acrobat\plug_ins\OpenAll\Transform\temp\785sec7.doc uth
144 Insert Figure 7-1 Underwood Engineers, Inc Facilities Plan Update C:\Program Files\Adobe\Acrobat 4.0\Acrobat\plug_ins\OpenAll\Transform\temp\785sec7.doc uth
145 7.1.1 General Physical Condition of Sewers Previous investigations have described the sewer collection system as being in poor structural condition, and having many line sags, leaky offset joints, and unusual changes in grade. The investigations and studies of the collection system up to this point have focused primarily in areas of recent development. As a result very little up-to-date information exists for the remaining areas with high development potential. Less than 5% of the sewers have been television inspected since In the last three years, since the opening of the Redhook Brewery, the Wastewater Treatment Plant (WWTP) has experienced average influent flows of 0.44 mgd. It is estimated that more than half of the 0.44 mgd is infiltration and inflow (I/I), and an estimated 65% of all I/I is generated in areas that little to no information concerning the physical condition is known. The original layout of the collection system was designed to serve a military base and appears to have been constructed in various stages to accommodate expanding residential housing and airfield facilities. The result is a sprawling system of interceptor sewers and lateral service lines that stretches out through areas of current use and large tracts of land slated for development. The major interceptors tend to occupy obvious topographic lows and were laid at or below conventional minimum slopes considered acceptable for new design. Many trunklines follow the most likely routes and wherever possible should be utilized for future development. The existing 8 diameter network of collection lines may not be adequate to serve the needs of business/commercial or industrial growth. 7.2 REVIEW OF PREVIOUS INVESTIGATIONS AND STUDIES HTA, Sewer Evaluation - Family Housing Area/Pease AFB The sewer system in the family housing area was the subject of an evaluation by Hoyle, Tanner & Associates (HTA). The family housing area corresponds to sewer basin 4, and a portion of basin 5 as shown on the attached Figure 7-2. Television inspection (performed from 1970 to 1971 but reviewed in 1982) and flow monitoring (performed between 1:00 Underwood Engineers, Inc Facilities Plan Update C:\Program Files\Adobe\Acrobat 4.0\Acrobat\plug_ins\OpenAll\Transform\temp\785sec7.doc uth
146 Insert Figure 7-2 Underwood Engineers, Inc Facilities Plan Update C:\Program Files\Adobe\Acrobat 4.0\Acrobat\plug_ins\OpenAll\Transform\temp\785sec7.doc uth
147 AM and 4:00 AM on November 23, 1982) revealed an aging vitrified clay pipe system that was structurally failing, leaking offset joints, significant sags and debris/sediment accumulation, collapsed sections of pipe, sharp bends, root intrusion, and protruding/obstructing service connections and laterals were noted. An average of 441,050 gallons per day (gpd) of infiltration was measured in this area based on depth of flow measurements in manholes. Extensive repairs and replacement of 6500 feet of 8- inch and 12-inch sewer pipe was recommended totaling $513,000. Based on discussions with the City of uth Department of Public Works and PDA personnel, it is unknown if any of the recommended rehabilitation was conducted. Although some of the worst areas have been decommissioned since 1982, approximately half of the residential area evaluated (in 1982) was described as some of the worst in regards to condition and infiltration (sewer basin 4). Excerpts from this report are provided in Appendix Rist Frost, Pease AFB I/I Study Six weirs were installed at the outlets of service areas 12, 4-12, 60, 61B, 62, and 300 to determine quantities of I/I during evening flows. Service area numbers were designated based on the manhole number designations at the outlet of each area. This numbering system correlates to the sewer basin numbers shown on Figure 7-2 as follows: TABLE 7-1 SERVICE AREA/SEWER BASIN CORRELATION SERVICE AREA SEWER BASIN # 12 1,2,9, ,8 61b Underwood Engineers, Inc Facilities Plan Update C:\Program Files\Adobe\Acrobat 4.0\Acrobat\plug_ins\OpenAll\Transform\temp\785sec7.doc uth
148 A total of 242,280 gpd of infiltration, and 478,080 gpd inflow in the sewer system was measured in April Minimum infiltration estimates ranging from 200,000 gpd to 750,000 gpd were estimated with an average yearly infiltration rate of 445,000 gpd. The I/I results of this study are summarized below: TABLE 7-2 SUMMARY of RIST FROST INFLOW/INFILTRATION (I/I) Service Area (Sewer Basin) Percent of Total Infiltration Percent of Total inflow 12 (1,2,9,10) 38% 2% 4-12 (2) 7.5% 15% 60 (7,8) 26% 14% 61B (5) 14% 6% 62 (6) 9% 20% 300 (4) 5.5% 43% This study concluded that the majority of infiltration (64%) was generated in service areas 12 and 60 (sewer basins 1,2,7,8,9,10). These areas correspond to areas with sewers below the watertable shown in Figure 7-1. It was noted that the inflow data was collected 10 hours after the rainstorm ended, therefore missing the true peak inflow. Consequentially, the inflow results were inconclusive. This study recommended a Sewer System Evaluation Study (SSES) of service areas 12, 60, 300, and Excerpts from this report are provided in Appendix HTA, Pease Headworks Loading Analysis. In 1992 the average daily flows to WWTP were estimated to be 0.46 mgd (prior to the official closing of the Air Force Base in 1991 average daily flows were 0.72 mgd). At that time, full buildout flow to WWTP was estimated to be 3.0 mgd (peak hourly flow). It was estimated at the time I/I was approximately 30% of average (1992) daily flows and I/I was assumed to be 0.15 mgd under full build out conditions (sewer system rehabilitation was assumed to reduce I/I). Underwood Engineers, Inc Facilities Plan Update C:\Program Files\Adobe\Acrobat 4.0\Acrobat\plug_ins\OpenAll\Transform\temp\785sec7.doc uth
149 CDM, Pease Wastewater Collection and Treatment System Evaluation. Field Investigations performed during 1994 were utilized in evaluating the existing system and recommended two approaches for correcting general condition and capacity limitation problems. The investigation focused on service areas 60 and 62 (sewer basins 6,7,8) only and results were extrapolated to the remaining areas. The scope of the investigations in this study included flow isolation, smoke testing, and television inspection performed by Vermont Pipeline Services (HTA). Flow isolation performed in Service Areas 60 and 62 in May 1994 revealed total infiltration of 74,000 gpd and 8,500 gpd in each of those areas respectively. These results were similar to Rist Frosts April 1985 results. Smoke testing performed in service areas 60 and 62 revealed little apparent stormwater connection to the sewer system. Television inspection was performed totaling 2700 LF of 15-inch pipe along Corporate Drive from the WWTP north, 800 LF in service area 60, and 1000 LF in service area 62. The Collection system evaluation in service areas 60 and 62 revealed the following: The general condition of the vitrified clay pipe is in disrepair with many separated, leaky, offset joints, line sags, cracked and broken pipe, and shallow slopes. 115 manholes were inspected and some were found to be in need of repair, however, most were generally in good condition. The existing flow capacity was evaluated at the pipe reaches obviously capacity limited by shallow slopes. These reaches were identified as limiting but were not causing existing capacity problems. Capacity calculations were performed using slopes as defined by invert elevations in manholes. It was noted that by defining pipe slopes by manhole inverts, the line sags between manholes would tend to result in overestimates of actual pipe capacity. Future flows were estimated based on zoning, projected water usage, and 70% saturation development of the Tradeport by the year It was assumed that all water that is used for domestic and industrial purposes is returned as sewage. The system trunkline capacities were reported to be generally sufficient to carry the Underwood Engineers, Inc Facilities Plan Update C:\Program Files\Adobe\Acrobat 4.0\Acrobat\plug_ins\OpenAll\Transform\temp\785sec7.doc uth
150 anticipated future peak hour flows (design year 2011) of 3.03 mgd under full flow conditions. It was assumed that flows would not change between year 2011 and 2016 based on anticipated I/I reduction efforts. It was reported that on an annual bases approximately 70% of the flow currently being treated at the WWTP is I/I. Recommendations by CDM included a $1.5 Million program of sewer system rehabilitation aimed at reducing I/I by 75%. Rehabilitation work was assumed to include sewer cleaning, joint testing and sealing, spot repairs/pipe replacement, and manhole sealing/lining. CDM concluded that the existing collection system had adequate capacity (at full pipe flow) for existing and future (70% buildout) flows. This buildout scenario was based on projected development over 20 years, but did not represent 100% potential development. Excerpts from this recent report are provided in Appendix Underwood Engineers, Pease WWTP Baseline Evaluation Report Flow projections were developed in 5 year increments extended to the design year of 2016 (20 years) and beyond to full build out. The buildout average daily flow was estimated to be 1.2 mgd with a peak hourly flow of 4.03 mgd. It was assumed that I/I would be reduced over time from a peak flow of 2.45 mgd in the year 1996 to 1.52 mgd in the year The flow projection was based on CDM s 1995 report and accounted for a development scenario over 20 years that was assumed to be realistic, but not 100% buildout Summary of Previous Investigations and Studies The following summarizes the results of previous collection system investigations at the Tradeport: Based on a limited amount of collection system investigations, it was determined that infiltration is a significant problem. CDM estimated that up to 70% of the flow to the WWTP on an annual basis is infiltration. This is due to the age of the collection system (mid 1950 s), pipe type (vitrified clay), and that much of the sewers are below the water table and in poor condition. Underwood Engineers, Inc Facilities Plan Update C:\Program Files\Adobe\Acrobat 4.0\Acrobat\plug_ins\OpenAll\Transform\temp\785sec7.doc uth
151 Previous buildout scenarios have looked at 20-year projections of anticipated development. The WWTP upgrades in 1996 were based on this scenario. Full buildout at saturation density was not considered. Much of the collection system required rehabilitation at a cost of approximately $1.5 Million for the purpose of reducing I/I by 75%, and to maintain current system capacity. System capacity was determined to be adequate for 20-year projected flows in the development scenario presented. 7.3 METHODOLOGY In developing a Master Plan for the Pease International Tradeport sewer system, it was necessary to evaluate the potentially developable areas for their maximum buildout potential. While this provided what may be an overly conservative evaluation, it identifies areas within the collection system that should be monitored and reassessed as development progresses. It also provides the information necessary to properly size interceptor sewers that require replacement due to deteriorating conditions. The following subsections describe the methodology used in evaluating the potential capacity limitations within the existing system and in determining collection system evaluation, rehabilitation and upgrade needs. The pipe capacity evaluation focused mainly on the interceptor sewers. The reason for this is that much of the lateral sewers in the former housing area are known to be in poor condition, with shallow slopes, and the future development will rely more on connections to interceptors than to old, deteriorating laterals. Also, in areas in the airport, or the airport industrial zone, there is not significant development potential available beyond what is already developed. Therefore capacity increases in the 8-inch laterals is less likely, unless significant wet industries develop the remaining parcels in these areas, or existing structures are demolished and these areas redeveloped. Underwood Engineers, Inc Facilities Plan Update C:\Program Files\Adobe\Acrobat 4.0\Acrobat\plug_ins\OpenAll\Transform\temp\785sec7.doc uth
152 7.3.1 Existing Pipe Capacity The sewer system was divided up into ten (10) sub-basins. These sewer basins were delineated based on the major interceptor locations and the topographic divides. Each sewer basin was further divided based on zoning for analysis of potential development impacts on wastewater flow. Interceptor segments which limit the capacity of each subbasin were identified by evaluating pipe diameters and slopes. The interceptor sewers (pipes greater than 8-inch diameter) are shown on Figure 7-1 and Figure 7-2. The Mannings equation was applied under 80% flow conditions. In some sub-areas the pipe capacity may be limited at numerous locations by more than one pipe segment. The flow to a specific capacity limiting pipe segment in most cases is a cumulative flow from multiple up-stream contributing sub-areas. As a result, a segment with flow limitations may potentially impact an area of significant acreage. In the estimation of existing average daily flow from each sewer basin, the contribution of I/I based on current plant records was distributed only to the areas currently occupied. The amount of I/I actually contributed by areas with sewers not in use is therefore distributed through the occupied areas and may tend to overestimate capacity limitations in areas of current use. This method to distribute known I/I flow was used since many areas with no current use have had their sewers disconnected to limit I/I from abandoned areas. Underwood Engineers, Inc Facilities Plan Update C:\Program Files\Adobe\Acrobat 4.0\Acrobat\plug_ins\OpenAll\Transform\temp\785sec7.doc uth
153 7.3.2 Existing Flows Existing Average Daily Flow Existing flows from each sewer basin in current use were estimated using the average and peak influent flow data from the WWTP, over the last three years (1997,1998,1999) since the Red Hook Brewery went on line. An average daily flow of 0.44 mgd has been measured at the WWTP during this time period. The current unit flow rate of approximately 1100 gal/ac/day was calculated by dividing average daily flow of 0.44 mgd by the area of current use. The area of current use was estimated by measuring the aerial extent of the currently occupied acreage from the existing Pease Development Authority Plans, excluding the former Air Force family housing areas, barracks and airfields. Approximately 30% of the available developable acreage is currently occupied at the Tradeport. The existing average daily flow at each limiting pipe segment was determined by evenly distributing the loading rate of 1100 gal/ac/day to the area of current use within a relative contributing area. Only the trunklines greater than 8 in diameter were evaluated. Underwood Engineers, Inc Facilities Plan Update C:\Program Files\Adobe\Acrobat 4.0\Acrobat\plug_ins\OpenAll\Transform\temp\785sec7.doc uth
154 Peak Hour Flow The peak hour flow is a one time per year instantaneous flow. This condition is expected to occur 0.01 % of the time. This flow condition is used to size the sewer lines so that backups or sewer overflows do not occur. It is assumed that the peak hour flow will occur during a rainfall event with peak infiltration/inflow occurring and a maximum day domestic flow. The peak hourly flow was observed from instantaneous flow from metering records from the WWTP. It is clear from the flow records that infiltration/inflow is a significant portion of the sewer capacity. On June 12, 1998, just prior to a major rainstorm, the influent flow to the WWTP was 0.48 mgd. On June 13, 1998, following a 6.8-inch rainstorm, the peak influent to the WWTP was 3.98 mgd. A flow above 2.3 mgd was maintained for 3 additional days, during which time another 2.9- inches of rain fell. The very quick response in peak flow suggests that inflow may play more of a significant role in the flow to the WWTP than previously thought. The extended maintained peak flow following this rain event is related primarily to infiltration. The cost of sizing sewer lines for this capacity should be weighed against the cost to remove the infiltration/inflow and the system capacity needs as development progresses. An existing peaking factor of 9.05 was calculated by dividing the average daily flow by the peak hourly flow. The peak hourly flows within the limiting pipe segments were calculated by multiplying the average daily flows by the existing peaking factor. This high peaking factor is indicative of a system highly influenced by I/I with greater than 50% of the sewer below the ground water elevation. Table 7-3 compares the existing WWTP flows to the estimated contribution of I/I for average monthly and peak hourly flows: TABLE 7-3 AVERAGE AND PEAK FLOWS AT THE PEASE WWTP Parameter Range 1 Average Average Daily Flow 0.1 mgd mgd mgd 2 Peak Hourly Flow 0.48 mgd mgd 2 - Average Daily I/I 0.06 mgd mgd mgd 1 Peak Hourly I/I 0.15 mgd mgd 1-1 CDM (1995), Evaluation of Pease Tradeport Wastewater Collection and Treatment System Report Underwood Engineers, Inc Facilities Plan Update C:\Program Files\Adobe\Acrobat 4.0\Acrobat\plug_ins\OpenAll\Transform\temp\785sec7.doc uth
155 2 From 1997, 1998, 1999 metered WWTP influent records (since Redhook Brewery went on-line) Future Flows As areas are developed further, the sewers will experience an increase in flows accordingly. Projected future flows were estimated based on influent records at the WWTP and industry standard loading rates consistent with the Tradeport land use zoning ordinances. An average daily unit flow rate of 2000 gal/ac/day was applied to all available industrial zoned areas (excluding areas zoned airport industrial) and large tracts of commercial/business areas. An average daily unit flow rate of 1100 gal/ac/day was applied to the all remaining available areas based on the current flows from the existing partially developed areas. The average daily flows per unit area multiplied by a peaking factor of 4 to produce peak hourly flow rates and applied evenly to the available developable areas. Flow projections were calculated at varying percentages of development ranging from 10% above existing land use to full buildout (100% saturation density). It is unlikely that future development at the Tradeport ultimately reaches 100% saturation density which assumes all acreage is developed to its full potential. A final buildout at the Tradeport of between 70% and 85% saturation density is probably more realistic considering the type of current development and that many existing structures will most likely be used as is rather than demolished and the land redeveloped more efficiently. It is important that the City monitor the development at the Tradeport and continue to track the trends of water use and wastewater loading. The WWTP should be evaluated at least every 5 years to determine whether it is approaching capacity earlier than expected. Sewer trunklines being fed by areas with significant developable land will experience greater increases in flow compared to areas that are near buildout. The flow from an area at a particular percentage of development was calculated by multiplying the flow rate by the percentage acreage remaining (e.g. 10% of the remaining 100 acres x 2000 gal/acre/day) and then adding that amount to the existing flow. To determine the future flow at a particular capacity limiting pipe segment, the flows from all basins included in Underwood Engineers, Inc Facilities Plan Update C:\Program Files\Adobe\Acrobat 4.0\Acrobat\plug_ins\OpenAll\Transform\temp\785sec7.doc uth
156 the contributing area would be summed. To account for the future removal of I/I as the sewer system is rehabilitated and up-graded, the peaking factor was gradually reduced from the existing 9.05 to a peaking factor indicative of a system less influenced by I/I of 4.0. Again, only the trunklines greater than 8 in diameter were evaluated. Refer the calculation table in Appendix 7-4 for future flow projection from individual sewer basins. 7.4 ASSESSMENT OF EXISTING CONDITIONS The sewers at the Tradeport were assessed using a multilevel ranking system which included the tendency to be capacity limited, the general physical condition of the sewer, the tendency for infiltration, the size of the contributing area, relative contributing area below the water table, and the relative contributing area currently developed. A low ranking in every category would be a capacity limited sewer in poor condition, downstream of a large contributing area which produced a significant amount of infiltration, much of which is below the water table, and with high potential for development. A combined low ranking is an indicator of priority areas where immediate SSES work should be focused and rehabilitation/reconstruction projects be considered. The individual ranking of each capacity limiting sewer segments evaluated is tabulated in Appendix Interceptor Sewers The interceptor sewers were the focus of this evaluation. The amount of up-to-date information about the true condition of the sewers at the Tradeport however, is very limited, making an assessment of the sewer condition difficult. No information is available on the condition of the Air National Guard sewers (basins 9 and 10). Very little information is available on the 18 trunkline along Rye Street (basin 3), most of which is well below groundwater. The television inspection last performed in the residential area was in 1971 (basin 4). Less than 5% of total sewer pipe was television inspected in Since past investigations focused primarily on areas near the airport terminal, information on the sewers in the areas that are now prime for development (i.e. former residential Underwood Engineers, Inc Facilities Plan Update C:\Program Files\Adobe\Acrobat 4.0\Acrobat\plug_ins\OpenAll\Transform\temp\785sec7.doc uth
157 areas) is almost completely lacking. An estimated 65% of all I/I is supplied by areas lacking investigation other than 1985 I/I study (flow monitoring only) Pumping Stations The pumping stations where last evaluated in 1994 and reported on by CDM in A summary of the condition of the pumping stations as reported by CDM follows: TABLE 7-4 SUMMARY OF CITY MAINTAINED PUMPING STATION CONDITIONS LIFT STATION CONDITION COMMENTS 1 Texvit Fair Pumps are marginally functional. I/I apparently flows into wet well. Demolition was previously recommended by CDM (presumably because it is located in area not anticipated to be useful). This pumping station is visited once a month, the pumps are run, and wet wells cleared of standing water. As early as 1982 the Texvit lift station was described as having a surface water drain piped directly into the wet well. Corporate Dr./ New Housing Good Does not currently serve any users and mothballing was previously recommended. I/I apparently flows into wet well. Presently the Corporate Drive pumping station is visited once a month, the pumps are run, and wet wells cleared of standing water. BOQ Good In constant operation due to heavy Infiltration. Recently upgraded to auto-operation. Hospital Good In constant operation presumably due to possible leaking or broken pipes in the hospital. This station is owned by the PDA, however, not maintained by the WWTP personnel. ABEX Poor This station is also not maintained by the WWTP personnel. Sherburn Poor Previously recommended for decommissioning when no longer needed. Building 205 Poor Supposedly abandoned.. 1 Comments are based primarily on the 1995 CDM Wastewater Collection and Treatment System Evaluation Underwood Engineers, Inc Facilities Plan Update C:\Program Files\Adobe\Acrobat 4.0\Acrobat\plug_ins\OpenAll\Transform\temp\785sec7.doc uth
158 7.5 SEWER PROBLEM AREAS General Repairs and Upgrades There have been only a few minor repairs since the recommendation made by CDM in According to uth DPW personnel, repairs have consisted of leak patching of some manholes in service area 60 where CDM recommended manhole repairs. In addition, a 24 PVC sewer pipe was installed to upgrade a section of pipe along Corporate Avenue from the Redhook Brewery to approximately 350-ft south of Franklin Pierce College Existing Capacity Limitations Although reports of sewer backup problems have not been noted, calculations indicate a few areas where the interceptors are currently flowing at capacity or are capacity limited. The areas with existing capacity limitations are indicated on Figure 7-2 and described in Table 7-5 below Future Capacity Limitations The evaluation of the future capacity of the sewers identified 14 locations throughout the system where the capacity is possibly exceeded. Table 7-5 describes the pipe segments which are potentially capacity limited in the future. TABLE 7-5 SUMMARY OF SEWER EVALUATION Basin (Zoning) 7 (Ind) 3 (Bus/Com) 3 (Bus/Com) Pipe diam./slope Combined 1 Rank Physical Description 10 / Moderately large contributing area, >75% of sewers below 12 / watertable, existing capacity limitation, poor condition, <50% of contributing area is currently built-out. 18 / Large contributing area, >75% of sewers below watertable, approaching capacity limitation, condition unknown, <50% of contributing area is currently built-out. 27 / Very large contributing area, >75% of sewers below watertable, condition unknown, <50% of contributing Underwood Engineers, Inc Facilities Plan Update C:\Program Files\Adobe\Acrobat 4.0\Acrobat\plug_ins\OpenAll\Transform\temp\785sec7.doc uth
159 Basin (Zoning) Pipe diam./slope Combined 1 Rank area is currently built-out. Physical Description Underwood Engineers, Inc Facilities Plan Update C:\Program Files\Adobe\Acrobat 4.0\Acrobat\plug_ins\OpenAll\Transform\temp\785sec7.doc uth
160 2 (Bus/Com) 5 (Ind) 4 (Bus/Com) 7 (Bus/Com) 6 (Ind) 8 (Ind) 15 / Large contributing area, <25% of sewers below watertable, near capacity limited, marginal condition, <75 and >50% of contributing area is currently built-out. 10 / Moderately large contributing area, capacity limited at 75% buildout, condition unknown, <50% of contributing area is currently built-out. 12 / Moderately large contributing area, <50% of sewers below watertable, approaching capacity limitation, poor condition, <50% of contributing area is currently built-out. 15 / Large contributing area, >75% of sewers below watertable, near capacity limited, marginal condition, 8 / / /.0005 >75% of contributing area is currently built-out. 11 Moderately large contributing area, existing capacity limitation, poor condition, >75% of contributing area is currently built-out. 8 / Medium size contributing area, >75% of sewers below watertable, poor condition, >75% of contributing area is currently built-out. 1. Refer to Ranking Table in Appendix RECOMMENDED SEWER PROJECTS SSES Projects Until more information regarding the general sewer condition and knowledge of where the future growth will occur, recommendations for specific sewer projects is premature. The first priority is to perform SSES investigations in all trunklines and 8 collection lines which serve current users beginning with capacity limited lines described in Table 7-6. The areas which have a greater potential for development (i.e. large tracts of high and dry undeveloped land) are more likely to draw rapid development quickly turning a near capacity line to an over capacity line. Accurate knowledge of conditions of sewers in these areas will be necessary to make informed decisions concerning which sewers need rehabilitation or upgrade Upgrade/Rehabilitation Projects Underwood Engineers, Inc Facilities Plan Update C:\Program Files\Adobe\Acrobat 4.0\Acrobat\plug_ins\OpenAll\Transform\temp\785sec7.doc uth
161 Existing capacity limitations were identified in sub-areas 6 and 7, see Figure 7-2. In subarea 6, there are two possible solutions depending on the determination of the pipe condition. Difficulty in improving the slope in the limited sections of sub-area 6 would require approximately 1350-ft of 10 pipe to be upgraded between International Avenue and New Hampshire Avenue and 1100-ft of 8 and 12 pipe between New Hampshire Avenue and Aviation Avenue to be upgraded. Another 10 trunkline extending through basin 8 is also recommended for upgrading pending an SSES. As an alternative to replacing the capacity limited section of sub-area 6, a relief gravity line from sub-area 4 (former residential area) through sub-area 5 out to pick-up potentially half of the existing flows in sub-area 6 was evaluated. The existing 12-inch trunkline in basin 4 may need to be to be upgraded to an 18-inch or a 24-inch line. The advantage to this alternative is that a new gravity line extended out to sub-area 6 could provide potential growth in this area with a much needed sewer outlet. This would be advantageous if flows expected from the Travel Port and Panaway Manor are directed to Pease via the south entrance of the Tradeport. Table 7-6 is a summary of the priority projects recommended of the Tradeport. TABLE 7-6 RECOMMENDED SEWER PROJECTS Sub-Area (zone) 6 (Ind) 7 (Ind) 2 (Bus/Com) 3 (Bus/Com) Rational Existing capacity limitation Existing capacity limitation SSES/Near capacity limitation SSES Project Description 1) Upgrade/reroute 8 and 12 segments into line of proper slope. 2) Combine/upgrade 10 describe above for basin 7. 1) Upgrade trunkline. 2) Alternatively, combine flows with parallel capacity limited 10 line in basin 6 into one upgraded line. Evaluate condition of 15 legs of trunklines: 1) If condition of pipe is unacceptable consider CIPP lining, or 2) upgrade in same location. Evaluate condition of 18 and 27 trunklines: 1) If condition of pipe is unacceptable consider CIPP lining, or 2) Reroute/upgrade closer to roadway of Rye Street. Underwood Engineers, Inc Facilities Plan Update C:\Program Files\Adobe\Acrobat 4.0\Acrobat\plug_ins\OpenAll\Transform\temp\785sec7.doc uth
162 Sub-Area Rational (zone) 5 SSES/possible (Ind) and capacity (Bus/Com) limitation 4 (Bus/Com) 7 (Bus/Com) 9 and 10 (Air Nat. Guard) SSES SSES/Near capacity limitation SSES * Listed by order of priority Project Description Evaluate the condition of 10 gravity line and 6 forcemain: 1) If condition of pipe is unacceptable consider replacement and rerouting along International Drive and 2) Reconnecting forcemain on International Drive, or 3) Rerouting forcemain to basin 4. Evaluate condition siphon and 12 trunkline: 1) If condition of siphon is unacceptable consider eliminating it and rerouting trunkline over culverts on Corporate Drive. This may require a lower profile box culvert. 2) If condition of pipe is unacceptable consider CIPP lining or replacement. 3) Consider extending trunkline to intercept flow from BOQ lift station (basin 5) and potentially intercept flow from basin 6. This would likely require upgrading. Lift stations could be easily routed to a connection on Corporate Drive. Evaluate condition of 15 trunkline: 1) If condition of pipe is unacceptable consider rehabilitation. 2) Replace/upgrade final 15 leg (between MH-59 and MH- 61) with proper slope. If trunkline from F-I is rerouted to E-I, upgrading 15 line in basin 7 may be unnecessary. Evaluate condition of 8 and 10 sewers and manholes to determine true potential to produce I/I. Consider requiring the Air National Guard to line all sewer pipes producing significant amount of I/I Sewer Projects Costs General costs for SSES work is $1.25 per linear foot for 8-inch to 12-inch diameter sewers, $1.40 per linear foot for 14-inch to 18-inch diameter sewers, and $1.50 per linear foot for 24-inch to 30-inch diameter sewers which includes television inspection, and light cleaning. The cost for upgrading sewer pipes 10-inch diameter or less is approximately $90 per linear foot, $100 per linear foot for 12-inch and 15-inch diameter sewer pipes, and $110 to $150 for sewer pipes 18-inch or greater. Table 7-7 is a breakdown of costs for the sewer upgrade project in basin 6 described above. Underwood Engineers, Inc Facilities Plan Update C:\Program Files\Adobe\Acrobat 4.0\Acrobat\plug_ins\OpenAll\Transform\temp\785sec7.doc uth
163 TABLE 7-7 COST SUMMARY OF BASIN 6 SEWER UPGRADE PIPE SECTION International Ave to New Hampshire Ave New Hampshire Ave to Aviation Ave New Hampshire Ave to Aviation Ave Existing Upgraded PRICE LENGTH COST Diam. (in) Diam. (in) (ft) $ $134, $ $30, $ $90,000 TOTAL $254,000 Table 7-8 is a breakdown of costs to construct a relief sewer /upgrade/gravity line extended in basin 4, 5, and 6 which would allow a diversion of flow from the entire east branch of sub-area 6 in an effort to relieve a significant amount of sewage that currently flows through the capacity limited section of the west branch of basin 6: TABLE 7-8 COST SUMMARY OF BASIN 4,5,6 RELIEF/UPGRADE SEWER PROJECT PIPE SECTION Corporate Ave to Aspen Ave Aspen Ave. to Jones School Forcemain Existing Upgraded PRICE LENGTH COST Diam. (in) Diam. (in) (ft) $ $211,000 12, 8 18 $ $186,000 Jones School Forcemain to West Entrance of Cabletron. 8 15, 12 $ $221,000 Subtotal cost to construct the relief sewer to west entrance of $618,000 Cabletron near Grafton Avenue and Corporate Avenue intersection West Entrance of Cabletron to Building $ $241,000 Subtotal cost to reroute flow from Building 205 to relief sewer $241,000 Underwood Engineers, Inc Facilities Plan Update C:\Program Files\Adobe\Acrobat 4.0\Acrobat\plug_ins\OpenAll\Transform\temp\785sec7.doc uth
164 PIPE SECTION Existing Diam. (in) Upgraded Diam. (in) PRICE LENGTH COST (ft) TOTAL $859, RECOMMENDED PROGRAM A phased approach of evaluation and rehabilitation is recommended, making successive decisions based on thorough investigation and alternatives evaluation. The first priority is to perform cleaning and video inspection of the major interceptor sewers, replace existing capacity limited sections of the interceptors, and replace interceptors known at this time to be in poor condition. The cost associated with this work is $1,354,000. The second priority is to rehabilitate or replace existing interceptor sewers in poor condition to restore flow capacity and minimize infiltration. The majority of the interceptors were originally constructed along topographic low points so major rerouting of interceptor sewers is not expected. Pumping stations generally served small areas and consideration should be given to abandoning those not in use or privatizing them to future developers of these areas. The costs for rehabilitation or replacement of the major interceptor sewers, will be based on the cleaning and inspection findings and additional cost effective evaluations. Based on available information the current opinion of cost to perform this work ranges from $500,000 to $2,000,000. The remainder of the collection system consists of 8-inch pipe and some 6-inch sections. It is suspected, based on previous evaluations that a significant amount of groundwater infiltration occurs in these pipes. Although collection system and WWTP capacity is generally adequate today, a sewer system evaluation survey (SSES) including cleaning, video inspection, and flow monitoring should be conducted in these areas to identify rehabilitation and infiltration reduction needs. The rehabilitation can then be phased in as problems arise or as additional capacity for sanitary flows is needed as development progresses. The estimated cost for SSES work and system rehabilitation of the collector sewers is $900,000. The Pease Tradeport collection system program costs are summarized below in Table 7-9. Underwood Engineers, Inc Facilities Plan Update C:\Program Files\Adobe\Acrobat 4.0\Acrobat\plug_ins\OpenAll\Transform\temp\785sec7.doc uth
165 Finally we recommend that the septage receiving facility currently located at the Peirce Island WWTP be relocated to the Pease WWTP. Pease is a secondary WWTP which can more effectively treat this high strength waste. The cost of this recommendation is covered in Sections 5 and 6. TABLE 7-9 PEAESE COLLECTION SYSTEM PROGRAM COST SUMMARY Priority/Cost Project Phase II Phase III Phase IV 0-5 YEAR 5-10 YEAR YEAR TOTAL Pease Collection System SSES Interceptor Sewers $ 35,000 Replace Current Capacity Limited Sections $ 330,000 Replace New Housing Area $ 489,000 Interceptor Upgrade/Replace Interceptor $ 500,000 $ 750,000 $ 750,000 Sewers SSES Lateral Sewers $ 48,000 I/I Reduction in Lateral Sewers $ 900,000 TOTAL $ 1,354,000 $ 798,000 $ 1,650,000 $ 3,802, HEADWORKS LOADING ANALYSIS The headworks loading analysis is being performed at the time of this Facilities Plan Update submission and will be submitted as a supplement to this Update. Underwood Engineers, Inc Facilities Plan Update C:\Program Files\Adobe\Acrobat 4.0\Acrobat\plug_ins\OpenAll\Transform\temp\785sec7.doc uth
166 SECTION 8 FUNDING 8.1 INTRODUCTION Projects which address an existing problem with the sewerage infrastructure are generally eligible for the SRF and SAG funding programs. Projects should be evaluated and presented with the supporting documentation to maximize funding eligibility for these programs. A copy of the most current SRF/SAG eligibility criteria is provided in Appendix 8-1. Other sources of funding should be considered. These include Community Development Block Grants for projects which benefit low to moderate income sections of the City; Economic Development Administration possibly working with the Pease Development Authority; New Hampshire Coastal Program/New Hampshire Estuarine Project for projects which address water quality issues in the New Hampshire coastal zone; and any private or other public funding sources. In addition to existing funding programs, new funding opportunities may arise through federal and State programs. Currently Senator Bob Smith is sponsoring Senate Bill S-914 is in the US Senate (See Appendix 8-2). If approved, this bill would provide 50% grants for eligible CSO abatement projects. The status of this bill should be followed closely. If the City has not already done so they should write a letter of support for this bill and work with the Senator s staff to determine what is required to complete an application for this grant program if authorized. 8.2 RECOMMENDED PROGRAM The projects recommended are broken into phases in accordance with their priority. A four phase program is proposed. Phase I is currently underway. Phases I, II, and III represent the first 10-years of the program which is aimed at addressing the most pressing needs. A listing of projects and their associated costs is provided in Table 8-1. A recommended loan structuring is provided in Figure 8-1. The sewer use rate impacts of Phases I, II, and III are shown in Table 8-2 Underwood Engineers, Inc Facilities Plan Update C:\Program Files\Adobe\Acrobat 4.0\Acrobat\plug_ins\OpenAll\Transform\temp\785sec8.doc
167 and fit within a program to maintain sewer rates at inflationary increases approximately 3 % annually. Underwood Engineers, Inc Facilities Plan Update C:\Program Files\Adobe\Acrobat 4.0\Acrobat\plug_ins\OpenAll\Transform\temp\785sec8.doc
168 FIGURE 8-1 SEWERAGE IMPROVEMENT LOANS PORTSMOUTH NEW HAMPSHIRE Close Out Phase I SRF Loan at $3.5 M Carry over $1.7 M to Phase II SRF Loan Phase I $5.2 M $5.0 M New Funds for Phase II $6.7 M SRF Loan Phase II $5.0 M $11.1 M SRF Phase III Loan Phase III $5.0 M $8.68 M SRF Phase IV Loan Phase IV $12.5 M Years Current Projects to be Completed Summer 2000 Zero to 5 Year Six to Ten Years Eleven to Twenty Years REQUIRED ACTIONS Phase I $5.2 M (4.8% Interest) Final Loan Amount $3.5 M (@ ~ 4.58%) - Submit Phase II Loan Pre-Application Immediately (Completed) Phase II $6.7 M (3.8% Interest) $5.0 M in New Funds - Request Timeframe Extension On Phase I SRF Loan, Restructure Loan For $3.5 M At A Maximum Of 4.8% Interest Immediately. A Letter Has Been Sent To NHDES For Approval. - Phase II SRF Loan Application has been Completed, the new interest rate is 3.8%. Phase III $11.1 M (Interest Rate to be Determined) Phase IV $8.68 M (Interest Rate to be Determined) Total Sewer Funding $30 Million 30% State Aid Grant For Eligible Projects
169

170
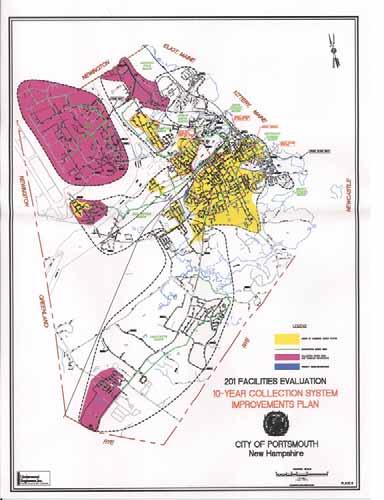
171
172 Table ES-1 WASTEWATER FACILITIES IMPROVEMENTS RECOMMENDATIONS CITY OF PORTSMOUTH, NH Project Phase I Phase II Phase III Phase IV TOTAL Projects Completed to Date $ 1,095,283 uth Collection System Tidal Inflow Removal $ 6,800 Box Sewer Rehabilitation $ 250,000 Essex/Sheffield I/I Removal --- South Street I/I Removal $ 200,000 Thaxter/Fells I/I Removal $ 900,000 SSES Interceptors & Problem Areas $ 250,000 Minor CSO & Sewer-Drain Connection Removal $ 10,000 Deer Street CSO Monitoring System $ 18,000 Panaway Manor Separation $ 50,000 $ 450,000 Oil and Grease Survey $ 26,000 PS SCADA System $ 350,000 Rye &Gosling PS Upgrades $ 25,000 $ 375,000 Mechanic Street Wash Press $ 200,000 Mechanic Street Improvements $ 20,000 Deer Street Improvements $ 5,500 $ 201,000 Lafayette PS Pump Controls Upgrade $ 120,000 Cross Connection Abatement(NHDES) $ 100,000 Box Sewer Basin I/I Removal $ 500,000 $ 1,400,000 Lincoln Ave Basin I/I Removal $ 1,500,000 $ 400,000 Maplewood Basin I/I Removal $ 630,000 CSO LTCP $ 8,000 $ 200,000 Borthwick Ave Sewer Replacement $ 500,000 Mechanic & Deer Street Emergency Bypass Pumps $ 280,000 Lafayette PS Capacity Upgrade $ 100,000 CSO Abatement Design and Construction $ 5,000,000 Mechanic & Deer St PS Grit Removal Vaults $ 300,000 Future Sewer Capacity Upgrades/Extensions $ 200,000 $ 4,300,000 Contingency Overlay $ 70,917 $ 532,000 Subtotal $ 3,500,000 $ 4,242,500 $ 8,231,000 $ 4,600,000 $ 20,573,500 Pierce Island WWTP Administrative Order Engineering Assistance $ 5,000 Chemically Enhanced Primary Clarification $ 270,000 New Sludge Storage Tank $ 250,000 Modify Sludge Storage Tanks $ 75,000 Sludge Conveyor Repair/Replace $ 80,000 BFP Upgrades $ 60,000 Hypochlorite Flow Pace Feed System $ 53,000 Sludge Dewatering System Capacity Eval. $ 2,500 Relocate Septage Receiving To Pease $ 170,000 CCT Modifications $ 85,000 Additional Hypochlorite Storage $ 53,000 Additional CCT Volume $ 1,100,000 Additional Capital Operational Improvements $ 1,000,000 $ 2,430,900 Subtotal $ 1,103,500 $ 2,100,000 $ 2,430,900 $ 5,634,400 Pease Collection System SSES Interceptor Sewers $ 35,000 Replace Current Capacity Limited Sections $ 330,000 Replace New Housing Area Interceptor $ 489,000 Upgrade/Replace Interceptor Sewers $ 500,000 $ 750,000 $ 750,000 SSES Lateral Sewers $ 48,000 I/I Reduction in Lateral Sewers $ 900,000 Subtotal $ - $ 1,354,000 $ 798,000 $ 1,650,000 $ 3,802,000 Total Cost $ 3,500,000 $ 6,700,000 $ 11,129,000 $ 8,680,900 $ 30,009, COSTSfinal.xls ES-11 1/26/2000

173
PEIRCE ISLAND WASTEWATER TREATMENT FACILITY UPGRADE
 REQUEST FOR QUALIFICATIONS CITY OF PORTSMOUTH NEW HAMPSHIRE Public Works Department ENGINEERING SERVICES PEIRCE ISLAND WASTEWATER TREATMENT FACILITY UPGRADE VALUE ENGINEERING REVIEW RFQ No. 59-14 City
TOWN OF LONDONDERRY, NEW HAMPSHIRE WASTEWATER FACILITIES PLAN UPDATE TABLE OF CONTENTS
 6%34(6%4(2 )%&+-+4+(3 1-%/ 51 %4( :=>?;9 406/ 0) -0/ 0/ (227! /(6 *%.13*+2(,8A #""$ TOWN OF LONDONDERRY, NEW HAMPSHIRE WASTEWATER FACILITIES PLAN UPDATE TABLE OF CONTENTS SECTION DESCRIPTION PAGE ES
City of Portsmouth Portsmouth, New Hampshire Public Works Department RFP #52-14 REQUEST FOR PROPOSAL
 City of Portsmouth Portsmouth, New Hampshire Public Works Department RFP #52-14 REQUEST FOR PROPOSAL DESIGN ENGINEERING SERVICES PEASE WASTEWATER TREATMENT FACILITY HEADWORKS UPGRADE INVITATION Sealed
Northfield Township WWTP Capacity Evaluation Report
 Northfield Township WWTP Capacity Evaluation Report March 18, 2015 PRESENTED TO PRESENTED BY Northfield Township 8350 Main Street Suite A Whitmore Lake, Michigan 48189 Tetra Tech 710 Avis Drive Suite 100
AUTHORITY OF THE BOROUGH OF CHARLEROI WASHINGTON COUNTY, PENNSYLVANIA ACT 537 SEWAGE FACILITIES PLAN UPDATE
 PLAN SUMMARY AUTHORITY OF THE BOROUGH OF CHARLEROI WASHINGTON COUNTY, PENNSYLVANIA ACT 537 SEWAGE FACILITIES PLAN UPDATE The Pennsylvania Sewage Facilities Act (Act 537) was enacted by the Pennsylvania
SCOPE OF WORK (Last amendment 9/18/08) Update: Signed agreement in hand Work to proceed March 15, 2009 June 30, 2010
 Update: Signed agreement in hand Work to proceed March 15, 2009 June 30, 2010") SCOPE OF WORK (Last amendment 9/18/08) Update: Signed agreement in hand Work to proceed March 15, 2009 June 30, 2010 TITLE: IDENTIFICATION OF ILLICIT DISCHARGES TO STORM DRAIN SYSTEM PROBLEM/NEED: The
SCOPE OF WORK (Last amendment 9/18/08) Update: Signed agreement in hand Work to proceed March 15, 2009 June 30, 2010 TITLE: IDENTIFICATION OF ILLICIT DISCHARGES TO STORM DRAIN SYSTEM PROBLEM/NEED: The
ENVIRONMENTAL ASSESSMENT
 ENVIRONMENTAL ASSESSMENT Project Identification Name: Piqua Wastewater Plant Expansion NRD WPCLF#: CS390755-0009, AIMS #5945 Contact: Gary Huff, City Manager City of Piqua 201 Water Street Piqua, OH 45356
Infiltration and Inflow. Michael Sassaman Phone
 Infiltration and Inflow Michael Sassaman msassaman@entecheng.com Phone 610-373-3345 Inflow and Infiltration PA DEP Learning Objectives Do you have Excessive I/I? Sources of Inflow and Infiltration I/I
Chapter 8 Addressing I/I Issues and High Flows
 Chapter Outline Chapter 8 Addressing I/I Issues and High Flows This chapter is organized into the following sections: Introduction Background Estimation of Infiltration Volume Conveyance Costs Effect of
SSO- WDR Compliance Workshop Electronic Reporting: Reporting Requirements & Tips. Sewer System Management Plan Chapter
 Chapter Contents Introduction SSMP Requirements and Suggested Content SSMP Preparation Deadlines Introduction This chapter provides a brief overview of the GWDR requirements for an SSMP and provides some
Streamlining I/I Repairs in Berlin Charter Township
 Case Study: Streamlining I/I Repairs in Berlin Charter Township Presented by: Rich Grant, PE Agenda Discussion of the problems & the SAW I/I Evaluation & SSES = Asset Management Groundtruthing of Results
BEING GOOD STEWARDS: IMPROVING EFFLUENT QUALITY ON A BARRIER ISLAND. 1.0 Executive Summary
 BEING GOOD STEWARDS: IMPROVING EFFLUENT QUALITY ON A BARRIER ISLAND Brett T. Messner, PE, Tetra Tech, Inc., 201 E Pine St, Suite 1000, Orlando, FL 32801 Brett.Messner@tetratech.com, Ph: 239-851-1225 Fred
Synergy: Addressing Combined Sewer Overflows and Nitrogen
 District of Columbia Water and Sewer Authority Briefing on Synergy: Addressing Combined Sewer Overflows and Nitrogen to Anacostia Steering Committee August 27, 2009 1 Introduction Background Addressing
Wastewater Master Plan Status Update. City of Portsmouth, New Hampshire
 Wastewater Master Plan Status Update City of Portsmouth, New Hampshire November 21, 2011 Topics for Discussion Review of Master Plan Effort Regulatory Status Pilot Effort to Verify Technology Selection
Chapter 2: Description of Treatment Facilities
 2020 Facilities Plan Treatment Report 2.1 Introduction Chapter 2: Description of Treatment Facilities This chapter defines the Milwaukee Metropolitan Sewerage District (MMSD) service area. It also describes
WEFTEC.06. **Cobb County Water System, Marietta, Georgia
 CHEMICALLY ENHANCED PRIMARY TREATMENT FOR A LARGE WATER RECLAMATION FACILITY ON A CONSTRICTED SITE - CONSIDERATIONS FOR DESIGN, START-UP, AND OPERATION ABSTRACT Jeffrey A. Mills, P.E., BCEE,* Roderick
Tunnel Works. How we got here - Fort Wayne s Consent Decree. Tunnel Works Program Frequently Asked Questions
 City Utilities operates the largest municipally-owned wastewater collection and treatment system in Indiana. The system serves 161 square miles and includes 1,014 miles of sanitary sewer lines, 365 miles
AUTHORIZATION TO DISCHARGE UNDER THE NATIONAL POLLUTANT DISCHARGE ELIMINATION SYSTEM
 Page 1 of 15 AUTHORIZATION TO DISCHARGE UNDER THE NATIONAL POLLUTANT DISCHARGE ELIMINATION SYSTEM In compliance with the provisions of the Federal Clean Water Act, as amended, (33 U.S.C. 1251 et seq.;
Operations Report. September 10, 2015
 Operations Report September 1, 215 Plant Loading and Operations Summary August 215 Biochemical Oxygen Demand, 5-Day (Avg. 2,151 lb./day) Total Suspended Solids (Avg. 33,197 lb./day) Average Daily Flow
NIAGARA REGION. Pollution Prevention Control Plan for the Town of Niagara-On-The-Lake Wastewater Collection System
 Welcome to the NIAGARA REGION Pollution Prevention Control Plan for the Town of Niagara-On-The-Lake Wastewater Collection System MUNICIPAL CLASS ENVIRONMENTAL ASSESSMENT Public Information Centre Please
Chapter 9: Alternative Analysis
 Chapter 9: Alternative Analysis 9.1 Introduction The development and evaluation of alternatives are key elements in the facilities planning process. The purpose of this chapter is to evaluate alternatives
CHAPTER IV EXISTING SEWAGE TREATMENT FACILITIES IN THE PLANNING AREA
 CHAPTER IV EXISTING SEWAGE TREATMENT FACILITIES IN THE PLANNING AREA A. EXISTING FACILITIES 1. Westtown-Chester Creek Plant Westtown Township acquired the Westtown-Chester Creek Treatment Plant (WCC Plant)
MUNICIPAL WATER POLLUTION PREVENTION (MWPP) ANNUAL REPORT
 ANNUAL REPORT") MUNICIPAL WATER POLLUTION PREVENTION (MWPP) ANNUAL REPORT SUBMITTED BY: TREATMENT FACILITY: NPDES #: MUNICIPALITY: COUNTY: CONTACT PERSON: Responsible Official Title Telephone #: Fax #: Email Address:
MUNICIPAL WATER POLLUTION PREVENTION (MWPP) ANNUAL REPORT SUBMITTED BY: TREATMENT FACILITY: NPDES #: MUNICIPALITY: COUNTY: CONTACT PERSON: Responsible Official Title Telephone #: Fax #: Email Address:
Storm Water and Sanitary Sewer
 Public Works Department Summary Report on Planned Capital Improvements Storm Water and Sanitary Sewer Introduction Public Works has assembled this summary report to highlight major capital improvements
SSO Reduction Program. WWTP Effluent Violation Corrective Actions
 SSO Reduction Program WWTP Effluent Violation Corrective Actions Report to United States Environmental Protection Agency: SSO Reduction Program This page intentionally left blank i WWTP Effluent Violation
Project Name: Central WWTP Capacity Improvements and CSO Reduction Project. MWS Project Number: 14-SC-0153 Last Updated: 12/19/14
 Project Name: Central WWTP Capacity Improvements and CSO Reduction Project MWS Project Number: 14-SC-0153 Last Updated: 12/19/14 BACKGROUND / PURPOSE Metro Water Services (MWS), in order to comply with
Integrated Long Term Control Plan Targeted Inflow Reduction for CSO Control. OWEA Conference June 29, 2016
 Integrated Long Term Control Plan Targeted Inflow Reduction for CSO Control OWEA Conference June 29, 2016 WWTP Average Daily Flow 6 MGD Peak Flow (Primary Only) 12 MGD Collection System 123 Miles (8 to
Evaluation of Collection System Design Standards
 Wastewater Master Plan DWSD Project No. CS-1314 Evaluation of Collection System Design Standards Technical Memorandum Original Date: August 9, 2001 Revision Date: September 2003 Author: CDM Table of Contents
Providing Infrastructure Redundancy at the Rocky River WWTP. Timothy McCann AECOM Keith Bovard Rocky River WWTP
 Timothy McCann AECOM Keith Bovard Rocky River WWTP WWTP Infrastructure Redundancy Redundancy As NASA Would Say: A Backup Plan for the Backup Plan Nuclear Power Plant Wastewater Treatment Plant Page 3 Infrastructure
HOW TO SAVE COSTS AND IMPROVE SUSTAINABILITY WHILE REDUCING EFFLUENT NITROGEN
 HOW TO SAVE COSTS AND IMPROVE SUSTAINABILITY WHILE REDUCING EFFLUENT NITROGEN Introduction Donna Kaluzniak, CEP, Utility Director, City of Atlantic Beach, Florida John E. Collins, Jr., P.E., J. Collins
City Council Public Input Session Water / Sewer Rate Study. March 19, 2014
 City Council Public Input Session Water / Sewer Rate Study March 19, 2014 Overview of Meeting Introduction of the Study Overview of Water and Sewer Systems FY14 Rate Study Work Accomplished and Presentations
TAHOE TRUCKEE SANITATION AGENCY WASTEWATER TREATMENT INQUIRY
 TAHOE TRUCKEE SANITATION AGENCY WASTEWATER TREATMENT INQUIRY REASON FOR INVESTIGATION The 2003-2004 Grand Jury investigated the status of wastewater treatment in unincorporated Nevada County. This year,
Minnesota Pollution Control Agency
 Minnesota Pollution Control Agency STATE OF MINNESOTA Minnesota Pollution Control Agency MUNICIPAL DIVISION PUBLIC NOTICE OF INTENT TO REISSUE NATIONAL POLLUTANT DISCHARGE ELIMINATION SYSTEM (NPDES)/ STATE
Copies: Mark Hildebrand (NCA) ARCADIS Project No.: April 10, Task A 3100
 ARCADIS Project No.: April 10, Task A 3100") MEMO To: Jeff Pelz (West Yost) Kathryn Gies (West Yost) Copies: Mark Hildebrand (NCA) ARCADIS U.S., Inc. 200 Harvard Mills Square Suite 430 Wakefield Massachusetts 01880 Tel 781 224 4488 Fax 781 224 3033
MEMO To: Jeff Pelz (West Yost) Kathryn Gies (West Yost) Copies: Mark Hildebrand (NCA) ARCADIS U.S., Inc. 200 Harvard Mills Square Suite 430 Wakefield Massachusetts 01880 Tel 781 224 4488 Fax 781 224 3033
Wastewater Flow Monitoring Services
 Wastewater Flow Monitoring Services For San Gabriel, CA July 13, 2015 through July 21, 2015 Revised October 9, 2015 Leaders in Sewer Flow Monitoring Services 601 N. Parkcenter Dr., Suite 209 Santa Ana,
Background Where did CSO systems begin? Combined Sewer Overflow (CSO) Control. Background. Background. Background
 Control. Background. Background. Background") Background Where did CSO systems begin? Combined Overflow (CSO) Control Eric Bergstrom HDR Engineering Background System Development Before About 196 House Background System Development After 196 Building
Background Where did CSO systems begin? Combined Overflow (CSO) Control Eric Bergstrom HDR Engineering Background System Development Before About 196 House Background System Development After 196 Building
This policy will generally explain the following in regards to the City sewerage collection systems:
 CITY OF SACO POLICY ON SEWER AND STORMWATER BACK-UPS PURPOSE The purpose of this policy is to explain how and why sewer or stromwater backups occur, what to do in the event a homeowner has a backup, and
ONTARIO CENTRE FOR MUNICIPAL BEST PRACTICES 200 University Ave., Suite 801, Toronto, Ontario, M5H 3C6. BEST PRACTICE SUMMARY REPORT February, 2008
 ONTARIO CENTRE FOR MUNICIPAL BEST PRACTICES 200 University Ave., Suite 801, Toronto, Ontario, M5H 3C6 BEST PRACTICE SUMMARY REPORT February, 2008 Water and Wastewater PROJECT APPROACH The focus of the
PHASE 1 OF THE CONSENT DECREE/ WET WEATHER IMPROVEMENT PROGRAM ACCOMPLISHMENTS THROUGH 2017
 PHASE 1 OF THE CONSENT DECREE/ WET WEATHER IMPROVEMENT PROGRAM ACCOMPLISHMENTS THROUGH 2017 MSD is delivering Phase 1 is under the original cost estimate Improving Trends in Water Quality MSDGC has completed
Handout 5: Stormwater Cost of Service
 Handout 5: Stormwater Cost of Service Introduction The purpose of this handout is to describe the current cost allocation methodology for the stormwater program. The existing Stormwater Management Service
Metropolitan St. Louis Sewer District PRIVATE INFILTRATION and INFLOW REDUCTION PROGRAM
 PRIVATE INFILTRATION and INFLOW REDUCTION PROGRAM October 27, 2012 TABLE OF CONTENTS 1.0 INTRODUCTION... 1 2.0 PROPOSED REMEDIAL ACTION PLAN... 1 3.0 IDENTIFICATION AND CORRECTION OF PRIVATE LATERAL SOURCES...
9-1. Wet-weather high-speed wastewater filtration system
 9-1.Wet-weather high-speed wastewater filtration system N. Horie 1, M.Kabata 2, K.Sano 3, S.Kanamori 4 Director, Chief Researcher,Senior Researcher 3, Researcher 4 First Research Department Japan Institute
New York State Department of Environmental Conservation
 May 2012 New York State Department of Environmental Conservation Award Submission for Environmental Excellence Awards Port Washington Water Pollution Control District (PWWPCD) Submitted by D&B Engineers
Figure 2 shows the monthly SSO Volumes within the system from 2007 through 2008 reported in million gallons (MG).
.") 28 Annual Report January 27, 29 As required by Section XIX.B., of the pending Consent Decree, the Metropolitan Government of Nashville and Davidson County, Tennessee (Metro) has prepared the enclosed Annual
28 Annual Report January 27, 29 As required by Section XIX.B., of the pending Consent Decree, the Metropolitan Government of Nashville and Davidson County, Tennessee (Metro) has prepared the enclosed Annual
OVERVIEW CAPACITY & CONDITION
 OVERVIEW The nation s 14,748 wastewater treatment plants protect public health and the environment. Years of treatment plant upgrades and more stringent federal and state regulations have significantly
EXEMPLIFYING SHARED COMMITMENT TO THE PEE DEE: A PROACTIVE SOLUTION BY THE CITY
 EXEMPLIFYING SHARED COMMITMENT TO THE PEE DEE: A PROACTIVE SOLUTION BY THE CITY OF FLORENCE AND TOWN OF TIMMONSVILLE Josh Norton, PE CDM Smith Michael Hemingway City of Florence, SC 2014 NC AWWA/WEA 94TH
Wastewater Treatment. Knowledge. Commitment. Excellence.
 Wastewater Treatment Knowledge. Commitment. Excellence. www.kcepc.com Wastewater Treatment KC s wastewater treatment group has designed, constructed, and helped to operate over 70 facilities. We work with
Algae Removal from a Facultative Lagoon System Using Dissolved Air Flotation. J. Patrick Pierce, P.E. Environmental Treatment Systems, Inc.
 Algae Removal from a Facultative Lagoon System Using Dissolved Air Flotation J. Patrick Pierce, P.E. Environmental Treatment Systems, Inc. Facultative Lagoon System Designed for 1.5 MGD Discharging 1.15-1.35
of the Study/Data Collection
 } Sewer System Study Background and Components of the Study/Data Collection } Recommended System Improvements } Project Costs Sources, Uses, and Potential Rate Impacts } Project Purpose DEQ s S2 Grant
Updating the MWRD s Excessive Infiltration and Inflow Control Program. February 19, 2014 Southwest Conference of Mayors Chicago Ridge, Illinois
 Updating the MWRD s Excessive Infiltration and Inflow Control Program February 19, 2014 Southwest Conference of Mayors Chicago Ridge, Illinois MWRD SEPARATE SEWER AND COMBINED SEWER AREAS LEGEND: Separate/Unsewered
Pease Tradeport Water System Overview and History July 27, 2015
 Pease Tradeport Water System Overview and History July 27, 2015 Portsmouth Water Division City of Portsmouth Department of Public Works 680 Peverly Hill Road Portsmouth, NH 03801 603-427-1530 www.cityofportsmouth.com/publicworks
Private Side Sewer Inspections for Sources of Inflow & Infiltration Frequently Asked Questions
 Private Side Sewer Inspections for Sources of Inflow & Infiltration Frequently Asked Questions As of Oct. 1, 2010, Tacoma property owners are required to have a certified inspection of their private side
Wastewater ENVIRONMENTAL SETTING. Wastewater Collection
 4.15.3.1 ENVIRONMENTAL SETTING Wastewater Collection The City owns, operates, and maintains the local sewer lines that collect wastewater generated within the City. The existing sewer lines include a gravity
Foster Park Retrieval Shaft
 Fort Wayne Tunnel Works Foster Park Retrieval Shaft October 25, 2017 Agenda Brief review of the Tunnel & Shafts project Why we have to be in Foster Park Retrieval Shaft Drop Shaft What the project is going
Polishing Ponds. Biosolids Storage. Ammonia Removal. Digesters. Thickeners. Pretreatment. Final Clarifiers. Primary Clarifiers.
 Wastewater Treatment Facility (2012) Polishing Ponds Biosolids Storage Ammonia Removal Digesters Thickeners Pretreatment Primary Clarifiers Activated Sludge Final Clarifiers OVERVIEW Whenever a home, business,
The Metropolitan District. Stormwater & I/I Reduction Presentation March 16, 2017
 The Metropolitan District Stormwater & I/I Reduction Presentation March 16, 2017 AGENDA Introductions/MDC Background CWP Background Consent Decree/SSO Program Discussion Private Inflow Discussion Program
Ann Arbor Wastewater Treatment Plant Facilities Renovations Project October 2017
 Ann Arbor Wastewater Treatment Plant Facilities Renovations Project October 2017 The Facilities Master Plan was completed in 2004 and identified the need for improvements to the City of Ann Arbor s Wastewater
Milwaukee Metropolitan Sewerage District Conveyance and Treatment System. MACRO made available by
 Milwaukee Metropolitan Sewerage District Conveyance and Treatment System MACRO made available by Eric Loucks,, CDM MMSD Collection System Operations MMSD operates an extensive system of sanitary sewers
WASTEWATER DEPARTMENT CITY OF MANNHEIM
 WASTEWATER DEPARTMENT CITY OF MANNHEIM TABLE OF CONTENTS Key dates Locations und employees Organisation Distribution of staff Wastewater charges and expenses Expense distribution Sewage disposal Sewerage
Review & Design of the Apia Pressure Sewer System. Presented by Jammie Saena - Samoa Water Authority & Paul Edwards Urban Water Solutions
 Review & Design of the Apia Pressure Sewer System Presented by Jammie Saena - Samoa Water Authority & Paul Edwards Urban Water Solutions 1 Contents Project Background Project Team Data Collection Physical
1 Metro Vancouver Case Study Vancouver Sewage Area Infrastructure Vulnerability to Climate Change
 1 Metro Vancouver Case Study Vancouver Sewage Area Infrastructure Vulnerability to Climate Change 1.1 Background Within the First National Engineering Vulnerability Assessment, the Public Infrastructure
CONSULTING ENGINEER S ANNUAL REPORT
 Capital Region Water CONSULTING ENGINEER S ANNUAL REPORT Wastewater System September 29, 2017 CONSULTING ENGINEER S ANNUAL REPORT Wastewater System Prepared for: Anthony J. Dill, PE BCEE David Stewart,
CHAPTER 5 WASTEWATER FLOWS
 CHAPTER 5 WASTEWATER FLOWS 5.1 REGIONAL FACILITIES Regional Water Recycling Plants Figure 5-1 illustrates the service area boundaries for IEUA s four water recycling plants. The four Regional facilities
KANSAS CITY S OVERFLOW CONTROL PROGRAM ANNUAL REPORT Reporting Period: January 1 to December 31, 2015
 KANSAS CITY S OVERFLOW CONTROL PROGRAM ANNUAL REPORT Reporting Period: January 1 to December 31, 2015 CONTENTS I. ANNUAL REPORT PURPOSE AND SCOPE... 2 II. KANSAS CITY S OVERFLOW CONTROL PROGRAM... 2 III.
Public Notice: Wetland/Waterway/Water Quality Regulations
 Public Notice: Wetland/Waterway/Water Quality Regulations Pursuant to M.G.L. c.30a, the MA Department of Environmental Protection (DEP) gives notice of its intent to revise the following regulations under
Wastewater Treatment Systems, Wastewater Issues and Permits
 Wastewater Treatment Systems, Wastewater Issues and Permits Lucas Gregory Texas Water Resources Institute November 29, 2017 Debbie Magin Guadalupe Blanco River Authority Ryan Gerlich Texas A&M AgriLife
City of Redlands Wastewater Treatment Plant. Redlands, CA LOCATION: Carollo Engineers; CH2M HILL MBR MANUFACTURER: COMMENTS:
 FACILITY: City of Redlands Wastewater Treatment Plant LOCATION: Redlands, CA GEO. AREA: Southern California STATUS 07/14: Operational CONSTRUCTION: ENGINEERING: Carollo Engineers; CH2M HILL MBR MANUFACTURER:
Water Recycling Facility Project
 Water Recycling Facility May 15, 2006 How did we get here? December 2002 City facing $8,000,000 fines from the Regional Water Quality Control Board (RWQCB) for Wastewater Discharge Violations. Existing
c: Don Labossiere, Director, Environmental Compliance and Enforcement Public Registries
 Climate Change and Environmental Protection Division Environmental Approvals Branch 123 Main Street, Suite 160, Winnipeg, Manitoba R3C 1A5 T 204 945-8321 F 204 945-5229 www.gov.mb.ca/conservation/eal CLIENT
Conceptual Design for a Future Wastewater Treatment Plant
 Wastewater Master Plan DWSD Project No. CS-1314 Conceptual Design for a Future Wastewater Treatment Plant Technical Memorandum Original Date: April 1, 2003 Revision Date: September 2003 Author: CDM Table
Appendix A EXAMPLE COLLECTION SYSTEM PERFORMANCE INDICATOR DATA COLLECTION FORM
 Appendix A EXAMPLE COLLECTION SYSTEM PERFORMANCE INDICATOR DATA COLLECTION FORM EXAMPLE COLLECTION SYSTEM PERFORMANCE INDICATOR DATA COLLECTION FORM I. General Information A. Agency Name B. Agency Address
Using New Jersey s State Revolving Fund to Reduce Combined Sewage Flooding in Camden City
 Using New Jersey s State Revolving Fund to Reduce Combined Sewage Flooding in Camden City Andrew Kricun, P.E., BCEE Executive Director / Chief Engineer Camden County Municipal Utilities Authority Camden,
Wastewater Master Facility Report. (Project Name) (Project Basin Location)
 (Project Basin Location)") Wastewater Master Facility Report For (Project Name) (Project Basin Location) The Wastewater Master Facility Report for (Project name) dated (Date); located in the (Basin Name) Basin has been completed
Wastewater Master Facility Report For (Project Name) (Project Basin Location) The Wastewater Master Facility Report for (Project name) dated (Date); located in the (Basin Name) Basin has been completed
Combined Sewer Overflows July 2012-December 2013
 CSO Facilities Summary Report 213 Combined Sewer Overflows July 212-December 213 Overview MWRA monitored four CSO facilities in the North System during the period covered in this report (July 212 December
CITY OF OXFORD WASTEWATER TREATMENT FACILITY ANNUAL PERFORMANCE REPORT FOR THE CALENDAR YEAR OF 2012
 CITY OF OXFORD WASTEWATER TREATMENT FACILITY ANNUAL PERFORMANCE REPORT FOR THE CALENDAR YEAR OF 2012 PREPARED: January 2013 2012 ANNUAL PERFORMANCE REPORT FOR THE CITY OF OXFORD WASTEWATER TREATMENT FICILITY
HYDRAULIC HYDRODYNAMIC MODELING AS AN EFFECTIVE MANAGEMENT TOOL FOR LARGE COLLECTION SYSTEMS - THE L.A. STORY
 HYDRAULIC HYDRODYNAMIC MODELING AS AN EFFECTIVE MANAGEMENT TOOL FOR LARGE COLLECTION SYSTEMS - THE L.A. STORY Fernando Gonzalez, Adel Hagekhalil, Bryan Trussell, City of Los Angeles Bureau of Sanitation
City of Surrey, ND Municipal Infrastructure Needs Assessment September 2012
 City of Surrey, ND Municipal Infrastructure Needs Assessment September 2012 Project made possible by US Dept. of HUD Regional Substantiality Planning Grant and ND Energy Development Infrastructure and
4 Desired Levels of Service (LOS)
") 4 Desired Levels of Service (LOS) LOS are a key business driver and influence all asset management decisions. LOS statements describe the outputs Halton intends to deliver to its residents and commonly
4 Desired Levels of Service (LOS) LOS are a key business driver and influence all asset management decisions. LOS statements describe the outputs Halton intends to deliver to its residents and commonly
November 28, Dear Mr. Bechtold:
 4000 Hollywood Boulevard Seventh Floor, North Tower Hollywood, Florida 33021 (954) 987-0066 Fax: (954) 987-2949 November 28, 2012 Wastewater Compliance and Enforcement Section FLORIDA DEPARTMENT OF ENVIRONMENTAL
6. Pollutant Sources in
 6. Pollutant Sources in 45 6. Pollutant Sources in the Plum Creek Watershed The LDC analysis for Plum Creek indicates that both point and nonpoint sources contribute pollutants in the watershed. Identifying
REGULATION NO. 62 COLORADO DEPARTMENT OF PUBLIC HEALTH AND ENVIRONMENT WATER QUALITY CONTROL COMMISSION REGULATIONS FOR EFFLUENT LIMITATIONS
 REGULATION NO. 62 COLORADO DEPARTMENT OF PUBLIC HEALTH AND ENVIRONMENT WATER QUALITY CONTROL COMMISSION REGULATIONS FOR EFFLUENT LIMITATIONS ADOPTED: March 18, 1975 FORMAT CHANGED: January 4, 1977 AMENDED:
The City of Grand Forks Industrial Pretreatment Program
 The City of Grand Forks Industrial Pretreatment Program Background Environmental Protection Agency (EPA) was created in December 1970 through a Presidential Executive Order. The Clean Water Act passed
MILTON TOWNSHIP ORDINANCE ANNUAL REPORT DEC 2013 THROUGH DEC 2014
 MILTON TOWNSHIP ORDINANCE ANNUAL REPORT DEC 2013 THROUGH DEC 2014 Introduction: Milton Township lies in Antrim County, bordered by Lake Michigan, Elk Lake, Lake Skegemog and Torch Lake. These surface water
CERTIFICATION PROPOSAL
 WASTEWATER TREATMENT PLANT IMPROVEMENTS Revised: May 11, 2015 WASTEWATER TREATMENT PLANT IMPROVEMENTS INDEX EXECUTIVE SUMMARY 2 1. ELIGIBILITY 4 2. CERTIFICATION CRITERIA 2.1 Technical Criteria 2.1.1.
City of Grenora, ND Municipal Infrastructure Needs Assessment August 2012
 City of Grenora, ND Municipal Infrastructure Needs Assessment August 2012 Project made possible by US Dept. of HUD Regional Substantiality Planning Grant and ND Energy Development Infrastructure and Impact
EVALUATING ALTERNATIVES FOR DISPOSING OF WATER PLANT SOLIDS INTO A WASTEWATER PLANT
 EVALUATING ALTERNATIVES FOR DISPOSING OF WATER PLANT SOLIDS INTO A WASTEWATER PLANT Matthew Valade, P.E. July 25, 2014 Barboe.pptx Presentation Outline Project Background Why Dewater Croton Residuals Offsite?
Fremont Water Pollution Control Center Plant Expansion for Nutrient Removal and Wet Weather Flow Treatment
 OWEA 2013 Annual Conference June 19, 2013 Fremont Water Pollution Control Center Plant Expansion for Nutrient Removal and Wet Weather Flow Treatment Jeff Lamson, Superintendent, WPCC Robert Hrusovsky,
Proposed Wastewater Treatment Facility Equipment Repair and Replacement Project
 Proposed Wastewater Treatment Facility Equipment Repair and Replacement Project Presented August 29 th, 2016 Function of IMKWWTP Treatment Facility History Reasons for Proposed Project Why Now? Modest
Facilities Plan. Technical Memorandum No. TM-WW-7 Hydraulic Analysis and Effluent Pump Station
 City of St. Joseph, Missouri Hydraulic Analysis and Effluent Pump Station By Work Order No. 09-001 B&V Project 163509 May 20, 2010 Table of Contents 1.0 Executive Summary...1 2.0 Purpose of Study...2 3.0
FAYOUM CITY SEWAGE TREATMENT PLANT, DEVELOPMENT STAGES, CASE STUDY
 FAYOUM CITY SEWAGE TREATMENT PLANT, DEVELOPMENT STAGES, CASE STUDY Ahmed El-Zayat, Environmental Engineering Group, Egypt Emaill: ahmed_el_zayat@yahoo.com Introduction This case study focuses on three
System Evaluation and Capacity Assurance Plan
 City of Cedar Hills System Evaluation and Capacity Assurance Plan The City of Cedar Hills believes that one of the keys to preventing sanitary sewer overflows is to evaluate system capacity and to monitor
3. WATERSHED STATUS AND ASSESSMENT
 3. WATERSHED STATUS AND ASSESSMENT The communities of Exeter, Newfields, and Stratham have all experienced substantial growth during the past 50 years. Understanding and mitigating impacts due to population
Taylor Creek Treatment Plant. Metropolitan Sewer District of Greater Cincinnati
 Taylor Creek Treatment Plant Metropolitan Sewer District of Greater Cincinnati Who is this guy and what is he talking about? Brad Blankenship Taylor Creek Operator 3.5 years MSD Operator 5.5 years (total)
SEWER SYSTEM DESIGN GUIDELINES
 SEWER SYSTEM DESIGN GUIDELINES PART 1 GENERAL 1.1 GENERAL GUIDELINES A. The following sewer system design guidelines are based on Federal, State and Local health requirements, and the Berkeley County Water
PLAN SUMMARY HARBORCREEK TOWNSHIP SEWER AUTHORITY ACT 537 SEWAGE FACILITIES PLAN
 PLAN SUMMARY HARBORCREEK TOWNSHIP SEWER AUTHORITY ACT 537 SEWAGE FACILITIES PLAN I. INTRODUCTION The Act 537 Program is administered by the PA Department of Environmental Protection (PA DEP) and their
City of Needles Waste Water
 City of Needles Waste Water Sewer System Management Plan (SSMP) 817 Third Street Needles, CA 92363 March 2011 Table of Contents LIST OF ABBREVIATIONS... 3 Section I GOALS... 5 Section II ORGANIZATION...
Ellis Creek Water Recycling Facility, City of Petaluma
 Ellis Creek Water Recycling Facility, City of Petaluma Historical Timeline Facility Treatment Processes / Flow Schematics Challenges of Wetlands Dechlorination Mode of Operation Benefits of Natural Dechlorination
Facilities Plan. Technical Memorandum Nos. TM-CSO-11 and TM-WW-5 Disinfection Facilities
 City of St. Joseph, Missouri Technical Memorandum Nos. TM-CSO-11 and TM-WW-5 Disinfection Facilities By Work Order No. 09-001 B&V Project 163509 July 31, 2009 Technical Memorandum Nos. TM-CSO-11/TM-WW-5
A H. Marcela Velázquez-Carrillo Consultant to Mountain Systems Inc. on the application of Proficy for Water Treatment
 WASTEWATER TREATMENT IINORMATIION TECHNOLOGY SUEZ, parent company of United Water ONDEO, is one of the largest water and wastewater treatment firms in the world. On January 5 th, 1998, United Water Milwaukee