URBAN SMS Soil Management Strategy
|
|
|
- Elwin McLaughlin
- 6 years ago
- Views:
Transcription


1 URBAN SMS Soil Management Strategy Assessment of Soil Protection Efficiency And Land Use Change G. Siebielec, A. Lopatka, T. Stuczynski, M.Kozak, M. Gluszynska, J. Koza, A. Zurek & R. Korzeniowska-Puculek September, 2010 updated: December 2010
2 Deliverable report ASSESSMENT OF SOIL PROTECTION EFFICIENCY AND LAND USE CHANGE Deliverable number: Partner responsible for this deliverable: PP8 Institute of Soil Science and Plant Cultivation State Research Institute Partners Involved: LP: City of Stuttgart PP2: City of Vienna, PP3: Umweltbundesamt, Environment Agency Austria, Vienna/ Austria PP4: City of Milan, Executive Plans and Programs for Buildings Department- Office for Reclamation Plans, Italy PP9: Czech University of Life Sciences, Prague PP10: Soil Science and Conservation Research Institute, Bratislava, Slovakia PP11: District Authority Stuttgart, Germany
3 Authors: Grzegorz Siebielec Artur Lopatka Tomasz Stuczynski Malgorzata Kozak Magdalena Gluszynska Joanna Koza Anna Zurek Renata Korzeniowska-Puculek 2
4 CONTENT: 1. INTRODUCTION MATERIALS AND METHODS Data sources Satellite images Soil maps Land use change analysis Approach for analysis of soil protection efficiency LAND USE CHANGES AND SOIL CONSUMPTION IN TEST AREAS Milan Bratislava Wroclaw Prague Stuttgart Salzburg Vienna SUMMARY OF LAND USE CHANGE AND SOIL PROTECTION EFFICIENCY IN TEST AREAS KEY MESSAGES REFERENCES ANNEXES Land use maps Land use change maps
5 1. INTRODUCTION Urbanization can be considered as a pressure on landscape reducing its buffering capacity and resistance to degradation (Antrop, 2004). Evaluation of these pressures is fundamental for development of strategies for protection of soils and soil functions. Sealing is one of threats identified in the framework of Strategy for Soil Protection (COM231, 2006). The sealing process may limit performance of soil functions (retention, production, filtering, biodiversity, etc.) and accelerate other soil threats such as decline in organic matter, contamination, floods, compaction. Land use changes are closely related to competition between different sectors, creating a specific demand for land controlled by macroeconomic situation, socio-economic variables, spatial planning, European and national policies and regulations concerning land or soil management. A policy (e.g. soil protection strategies) impact on land use change is difficult to assess as land transformation into different functions is, to some extent, an autonomous process and not always clearly responding to policy variables. The objective of the presented task was to conduct an ex-post analysis of land use change, responding to different soil protection regulations in several Central Europe cities. It is essential to understand what is the rate and pattern of changes in land use and how these changes, especially soil sealing, affect the overall performance of the soil function within the city area. Such an analysis is thought to raise awareness on trends of soil consumption within urban development process and provide information on effectiveness of the current soil protection measures. Soils differ in properties and, thus, ability to fulfill such functions as retention, biodiversity, filtering, crop productivity. Correlation between soil protection measures and loss of valuable soil resources was analyzed, identifying city-specific patterns of land use change and preservation of soils under urbanization pressure. Seven cities served as test areas for the analysis: Milan, Bratislava, Prague, Wroclaw, Stuttgart, Vienna, Salzburg. 4
6 2. MATERIALS AND METHODS The conceptual framework of the analysis of loss of high quality soils in test areas is presented in Figure 1. It involved development of land use change maps based on consistent satellite image data, analysis of land use change trends within 15 years period and subsequent assessment of valuable soils consumption for urban expansion as an indicator of soil protection efficiency. Milan Bratislava Test areas Prague Wroclaw Stuttgart Vienna Salzburg Soil maps Satellite images 10m resolution for 1990/1992 and 2006/2007 Classification of image objects Soil quality maps Land use maps (1990/1992 and 2006/2007) Land use change maps Spatial analysis of soil consumption for urbanization Transition indexes for soils of different quality Analysis of efficiency of current soil protection regulations Figure 1. Concept of soil protection efficiency analysis in test areas 2.1. Data sources Satellite images One of major constraints in spatial analysis of land use change is the quality of mapping and uncertainties of cartographic information related to different sources, scales and methodologies of land use map preparation. Resolution of official European land use database Corine Land Cover (CLC) is inadequate for detailed analysis of transition occurring in urban and suburban zones (EAA, 2005). 5
7 Thus, satellite images gathered from one source were employed for analysis of land use conversion trends in order to ensure consistency of land cover data and allow comparability of results between cities. These were 10-meter resolution SPOT satellite images. The B&W SPOT image is monospectral, color photo is a combination of 4 bands of different wavelengths. The images used represented two periods in order to study land use changes within approximately 15 year timeframe black and white photos captured in and color photos taken in period. One or two year difference between cities was justified by the necessity to avoid low quality images, e.g. due to excessive cloudiness Soil maps Soil maps were provided by the project partners responsible for the respective test cities. Due to diverse soil quality assessment systems, present in different Central European countries, and content of the soil maps the polygons on each map were grouped into 3 classes. They represented high, medium and low quality soils (either from perspective of production function, ecosystem function, buffering, retention etc.). Milan Discrimination of soil quality classes was generally based on the soil texture information. Coarse soils were classified as the least valuable while fine-texture soils as high quality soils due to their high retention and buffering-filtering capacity and, generally, greater crop productivity. Additional land use information provided by Milan partner was used to verify the soil value. The land use class vegetation of humid areas and peat bogs was classified as high quality regardless soil texture due to their role as water reservoir and ecological value. The land use type dismissed areas not used and not grown with flora was classified as low quality soil regardless the soil texture. Bratislava The soil map of Bratislava contains soil quality classes according to Slovakian valorization system in the 1 to 9 scale. Classes 1-4 were taken to the high quality soils group, 5-6 to medium quality while classes 7-9 were considered as low quality soils. Wroclaw Soil agricultural map of Wroclaw region in scale 1:25000 was used for Wroclaw case study. Soil valorization system in Poland involves soil suitability units at the range 1-14 for arable lands and 1z-3z for grasslands. This classification basically reflects productivity potential of the soil (suitability to produce certain crops) and the units were delineated based 6
8 on various soil properties as well as climatic conditions, water conditions and slope. Units 1, 2, 4, 1z were classified as high quality soils, units 3, 5, 8, 2z as medium, while units 6, 7, 9, 14, 3z and barren lands as low quality soils. The soil suitability units generally well describe other soil functions such as water retention, buffering capacity or biodiversity. Prague For purpose of the analysis we used the pedological map of Prague by Tomasek, Discrimination of quality classes was primarily based on soil typology. After consultations with the PP9 (Czech University of Life Sciences) the chernozems were classified as high quality while brown soils as medium quality soil cover. The group of soil with the lowest quality included rankers, rendzinas and brown soil with upper elevation. Stuttgart Soil quality map of Stuttgart contains an overall assessment of the natural soil functions with classes 1-5. The functions are derived of the natural soil functions in the Soil Protection Act of the Federal Republic of Germany. The indicators for the natural soil quality in Stuttgart are: - habitat function for natural and cultural vegetation which is characterised by soil depth, available water capacity, air capacity and nutrient supply, - water balance which is characterised by the available water capacity, - filter and buffer which is characterised by humus content, clay content, ph-value and microbiological decomposition. Classes 1 and 2 were categorized as low quality soil, class 3 as medium and classes 4 and 5 as the highest quality cover. Salzburg and Vienna Soil maps contained 3-class system of soil quality assessment (NSQ value) so no reclassification was needed. If two descriptions appeared as attributes (e.g. low value cropland, medium value grassland) the first one was taken as dominating land use. Currently available digital soil map of Vienna area does not cover whole city administration area. However, most of recorded land use changes in the studied period appeared within the area with available soil quality information this means that the fragmentation of soil map did not substantially affect the analysis Land use change analysis Land use maps of 10-meter resolution were produced for two periods representing years and through classification of the satellite images (Fig.2) 7
.")

 and classification phase (right) of land use map development.")
.")
9 in Definiens Professional software. Process of land use map development in this software basically consists with two major steps: segmentation and classification. The satellite image is represented by 10mx10m pixels described by spectral information (reflectance data at various wavelengths). Segmentation phase is a process based the fact that land use types (e.g. built up area, forest, water) posses different spectral information. Segmentation delineates spectrally homogenous areas the segmentation algorithms are used to subdivide the entire image represented by the pixel level domain or specific image objects from other domains into smaller image objects (groups of pixels) (Fig. 3). Figure 2. BW and color SPOT satellite images used for development of land use maps. Figure 3. Segmentation (left) and classification phase (right) of land use map development. The segmented objects can be characterized by number of different features for measuring color, shape, texture, size, neighborhood. This information contained in image objects is used as a filter for classification (Fig. 3). Based on this, image objects can be analyzed according defined criteria and assigned to classes that best meet these criteria. Classification is a procedure that associates image objects with an appropriate land use class labeled by a name and a color. 8

10 After careful manual revision of the classification using all available spatial information the obtained final layers were used as land use maps of the pilot areas (Fig. 4). Figure 4. Example of the produced land use map with 13 land use classes The land use maps contained 13 different land use types: 1. continuous residential areas 2. commercial and industrial areas 3. green recreation areas (parks) 4. airports 5. sport and leisure facilities (with generally impermeable or reconstructed surfaces with limited performance of soil functions e.g. stadiums, tennis courts) 6. dump and mineral extraction sites 7. arable lands 8. grasslands (pastures and meadows) 9. forests 10. semi-natural areas (covered by shrubs, trees, not used by agriculture) 11. discontinuous residential areas (residential area with dispersed buildings, still can fulfill some soil functions since most of surface is unsealed) 12. water bodies 9

11 13. transport facilities. For some cities the classes forests and semi-natural areas were combined into one class for soil consumption analysis in order to avoid misleading observations related to the fact that these two land uses may look similarly on satellite images, especially when semi-natural areas are of long-term character and are covered by trees. It must be noted that the our data regarding different types of green areas (forest, semi-natural, green park) may differ from the official statistics due to the mentioned uncertainties in distinguishing these classes. The land use change information (Fig. 5) for each pilot area was produced through comparison of land use layers derived for different periods. Figure 5. Urban fabrics sprawl on the new satellite image as background 2.3. Approach for analysis of soil protection efficiency The information on land use change was superimposed on maps characterizing soil quality in order to detect to what extend the urbanization took place on valuable soils. The new sealed area, reflecting the built up sprawl of last 15 years, consisted with expansion of the following land use classes: continuous residential area, commercial/industrial area and transport facilities. The soils under these new land use types fully lost their environmental functions. 10
12 In order to assess what is the scale of consuming valuable soils by urban sprawl, a transition index was used. It reflects the intensity of land use flows in the context of soil quality [Stuczynski, 2007]. Looking at land use stocks and flows occurring on soils belonging to different quality classes, it is difficult to make a straightforward assessment whether the observed land use change is equally distributed among classes distinguished, or is it nonproportional and consumes areas of certain characteristics, less or more intensely, as compared to a general pattern of a given soil quality or parameter. Difficulties arise from the fact that the contribution of e.g. soils of high productivity or high water retention potential to the total soil cover may vary greatly between regions therefore the size (measured in hectares) of change on soils of certain characteristics is not a good indicator if these soils are preferentially taken by urbanization. Preferential flows occur when a certain soil type (characteristics) represents a larger share in the changed land as compared to the share of this type in the general soil cover. Thus, a simple transition index (TI) is proposed to characterize the intensity of conversion of agricultural land observed on different soils, classified according to the ranges of land suitability or quality. The ratio between the share of a given soil type (class) within the changed area and the share of this class in the total soil cover is calculated. percent of soil class" n" in newbuilt area transition index( TI ) = percent ofsoil class" n" in whole urban area It must be noted that for calculation of share of different soil quality classes in whole area only soils that were not sealed in were taken into account. In most cities soil maps did not cover forest areas, except Stuttgart and Prague, for these two cities forest areas were excluded from the calculation since they are protected against urbanization. Interpreting the transition index is straightforward for example, index value of 2 for a flow on a given soil class (e.g. high quality soils) means that within changed land the share of this class is twice as high as in the entire soil cover, therefore the intensity of high quality soils consumption is much larger than can be expected from a structural pattern of soil quality. In contrast, if, for instance, the percentage share of high quality soils within area changed into built-up areas is considerably smaller than 1 (e.g 0.5) it means that these soils are protected from expansion of artificial surfaces. Interpretation of the transition index values is somewhat arbitrary - values in a range of 0.8 to 1.2 are interpreted as indicative of nonpreferential flows consuming soils representing a given range of parameters. Such a range of 11
13 flows considered as non-preferential is necessary to account for the uncertainty of change analysis, resulting from generalization and automatization of the analytical procedure. 3. LAND USE CHANGES AND SOIL CONSUMPTION IN TEST AREAS 3.1. Milan High density of continuous urban fabrics is characteristic for Milan. This land use type covers up to 60 percent of total city area within administrative borders. The increase of urban fabrics in Milan within 15 y period did not exceed 400 ha (Table 1). The increase refers to continuous residential areas. Over 470 ha of arable lands were taken into other land use types. Some urban sprawl appeared on wooded areas mostly on semi-natural areas covered by trees and shrubs. It is worth to note that the green urban areas increased by approx. 230 ha which in combination with the observed decrease in dump and mineral extraction and industrial sites area may indicate substantial city effort into revitalization of brownfield sites. Most of new sealing in Milan were observed in northern and southern-east part of the city (Fig. 6). Forty percent of available soil pool in early nineties was of high quality. The transition index for conversion of these soils into urban area was only slightly over 1. It indicates that high quality soils were not protected in Milan, however they were not preferentially urbanized. Low quality soils that in this case mean coarse soils were preferentially taken for construction purposes (TI>7). It must be noted, however, the pool of these soils is nearly depleted. Table 1. Summary of land use changes in Milan Land use class area in 2006 area in 1991 difference [ha] % of total area [ha] % of total area [ha] % continuous residential areas commercial and industrial areas green urban areas airports sports and leisure facilities dump and mineral extraction sites arable land grasslands wooded areas (forest or seminatural) discontinuos residential areas water bodies transport facilities total area x x x 12

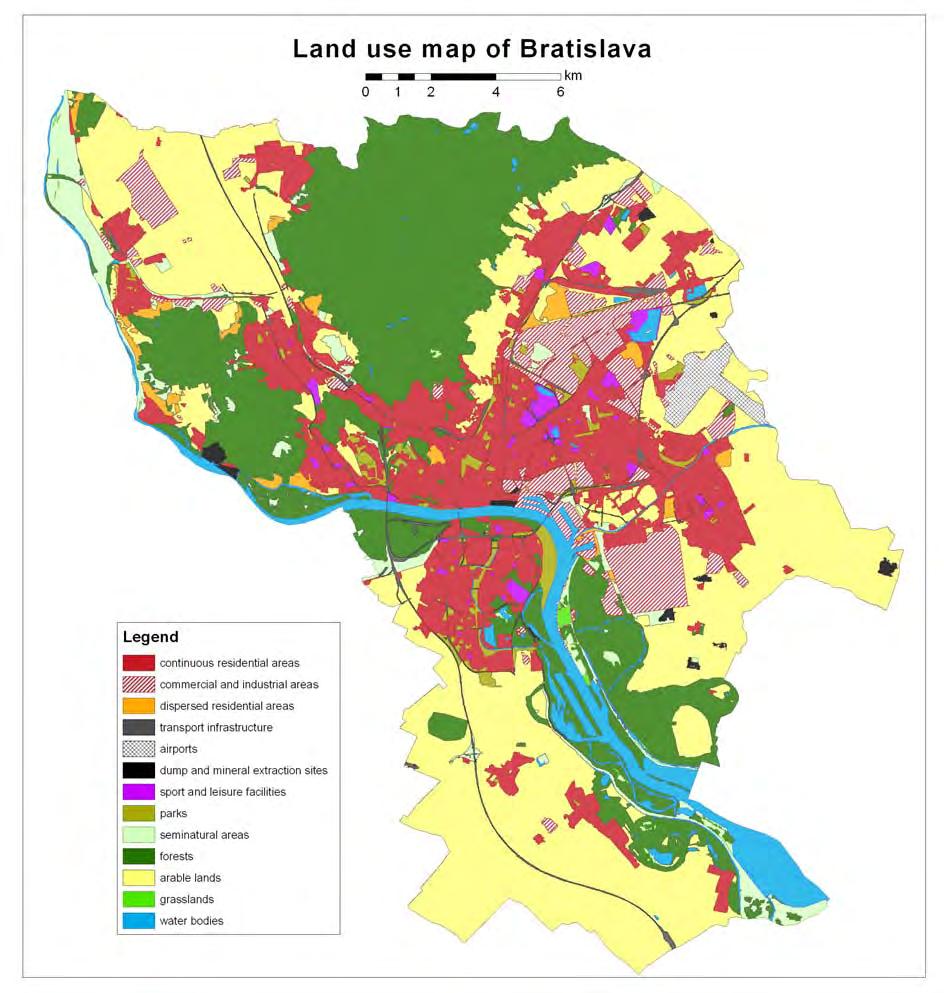
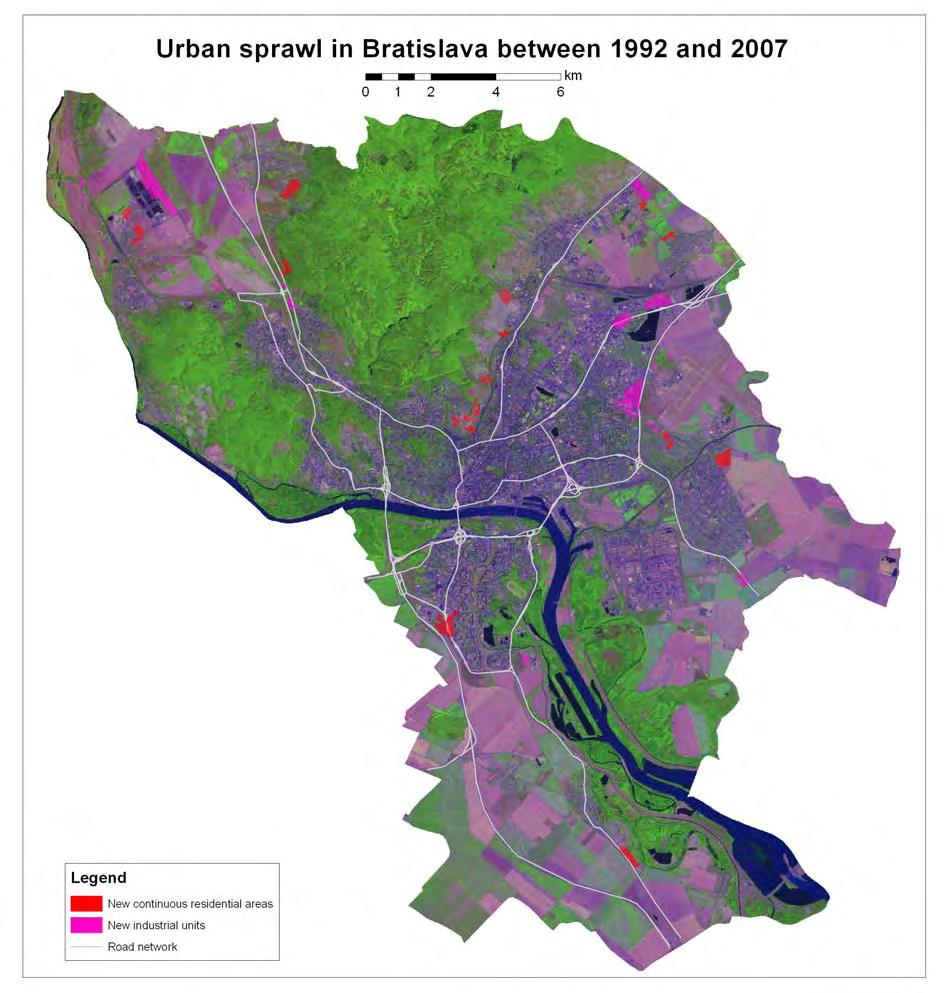
14 Figure 6. Urban sprawl in Milan between 1991 and 2006 on soil quality map Table 2. Statistics for transition of soils of different quality into sealed area for Milan* soil quality class Area of soil class Share of soil class in total area Area converted Percent converted Transition index (TI) (ha) [%] (ha) [% of soil class area] high quality medium quality low quality * The newly sealed area may differ from the provided in Table 1 since Table 2 refers to the area covered by the soil map while Table 1 to the total area presented on Fig. 6. Similar note refers to the other cities 3.2. Bratislava The share of sealed surfaces does not exceed 27% in Bratislava area. It increased by approximately 370 hectares since early nineties (Table 3). Greater increase concerns areas of commercial or industrial facilities. Sealing process was purely at the expense of arable lands 13
15 almost 440 hectares were lost within urban development process. There was a slight increment of green recreational area which was equal to semi-natural area loss. Surfaces used as dump and mineral extraction sites noticeably increased within last 15 years which likely was a cost of development of waste management systems. As indicated by the applied assessment methods the area of dispersed residential area increased by near 20 hectares but still covers not more than 1.2 % of total city area. Arable lands currently cover approximately 35% of total area that in combination with forest and semi-natural areas become a substantial soil reservoir performing a number of functions. Despite that the high quality soils covered as much as 47 % of available soil resources they were effectively protected within last 15 years. The share of high quality soils in new sealed area was 5 times smaller than their contribution to whole available soil pool (TI =0.2). Only 0.5% of high quality soils were transformed into construction within 15 y period. Low quality soils were much more intensively taken for urbanization purposes (Table 4). Table 3. Summary of land use changes in Bratislava Land use class area in 2007 area in 1992 difference % of % of [ha] total area [ha] total area [ha] % continuous residential areas commercial and industrial areas green urban areas airports sports and leisure facilities dump and mineral extraction sites arable land grasslands wooded areas (forest or seminatural) discontinuos residential areas water bodies transport facilities total area x x x 14
")
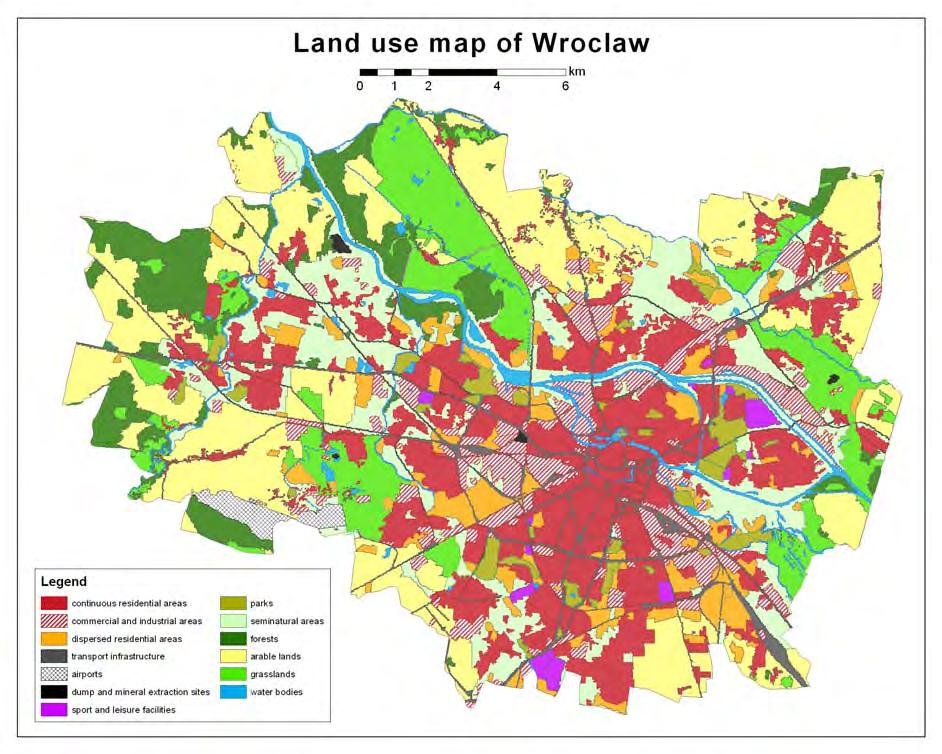
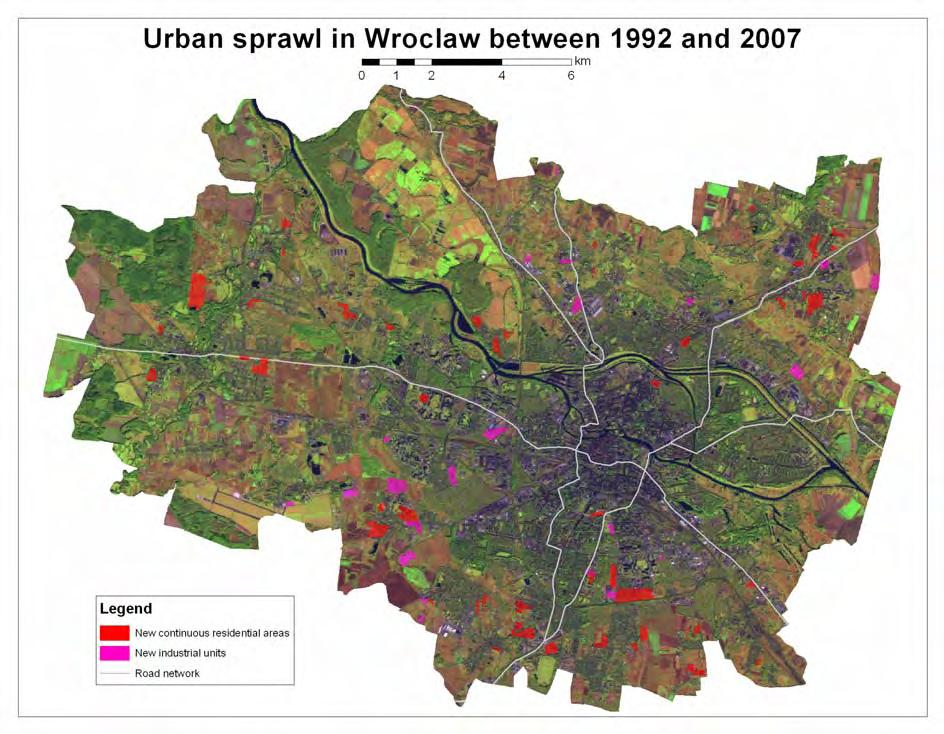
16 Figure 7. Urban sprawl in Bratislava between 1992 and 2007 on soil quality map Table 4. Indexes for transition of soils of different quality into sealed area for Bratislava soil quality class Area of soil class Share of soil class Area converted Percent converted Transition index (TI) (ha) in total area [%] (ha) [% of soil class area] high quality medium quality low quality Wroclaw Continuous urban fabrics cover 35 % of total area of the city and surroundings enclosed in Wroclaw LAU-2 region. Areas able to fulfill soil functions other than surface for construction consist with arable lands, semi-naturally covered lands, grasslands and forests their share in total area is 22, 14.5, 11 and 7.7 %, respectively, which together exceeds 55% of 15
17 total area (Table 5). The area of continuous sealed area increased by over 500 hectares within the period of interest. Most of this change can be referred to residential areas. Discontinuous residential zones did not expand recently - they cover approximately 6 % of total area. Such areas with dispersed pattern of buildings may perform soil functions in certain extend due to substantial share of uncovered surfaces and undisturbed soil profiles. The statistics of soil consumption for urbanization indicate preferential use of high quality soils in Wroclaw (TI>1.3, 3.6% of high quality soils consumed). Share of the weakest soils in newly sealed area was much smaller than their share in total resources despite that their supply is substantial (Table 6). Table 5. Summary of land use changes in Wroclaw Land use class area in 2006 area in 1991 difference % of % of [ha] total area [ha] total area [ha] % continuous residential areas commercial and industrial areas green urban areas airports sports and leisure facilities dump and mineral extraction sites arable land grasslands forest seminatural discontinuos residential areas water bodies transport facilities total area x x x 16
 (ha)")
18 Figure 8. Urban sprawl in Wroclaw between 1991 and 2006 on soil quality map Table 6. Indexes for transition of soils of different quality into sealed area for Wroclaw soil quality class Area of soil class Share of soil class Area converted Percent converted transition index (TI) (ha) in total area [%] (ha) [% of soil class area] high quality medium quality low quality
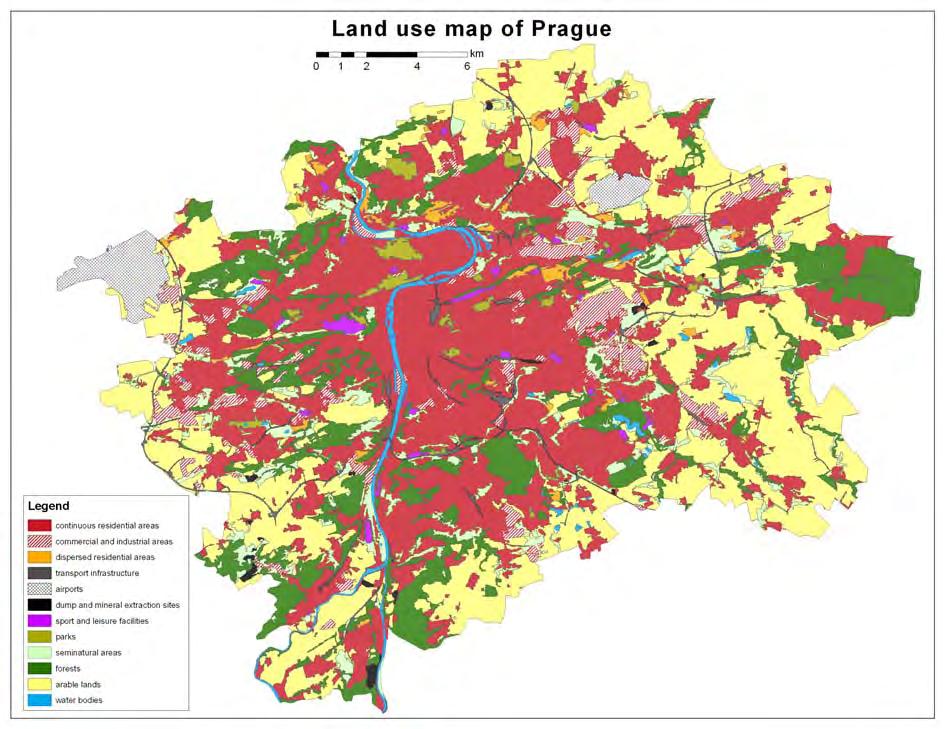
19 3.4. Prague Continuous urban fabrics increased by 780 hectares in Prague between 1990 and Most of the increase refers to residential areas that currently cover approximately 37% of total area (Table 7). The urban built up sprawl was entirely at the expense of arable lands. Arable lands, however, still constitute substantial part of land resources (30% of total area). No significant increases were detected for such land use types as parks, sport facilities, transport infrastructure or dispersed residential zones. The soils classified as the most valuable (chernozems) were preferentially taken for urbanization within period (TI>1.8) (Table 8). This process can be partly explained by the fact that chernozems are homogenously and exclusively located in northern part of the city. Thus any urban development in this zone would cost loss of these soils. Most of urbanization as measured by absolute values took place on medium quality soils which represent 66% of area taken for calculation (with soil information and not covered by forest or construction). Low quality soils were relatively omitted in the urbanization process their share in newly urbanized area was twice smaller than the share in total area of soil resources (Table 8). Table 7. Summary of land use changes in Prague Land use class area in 2006 area in 1990 difference % of % of [ha] total area [ha] total area [ha] % continuous residential areas commercial and industrial areas green urban areas airports sports and leisure facilities dump and mineral extraction sites arable land grasslands forest seminatural discontinuos residential areas water bodies transport facilities total area x x x 18
 (ha)")
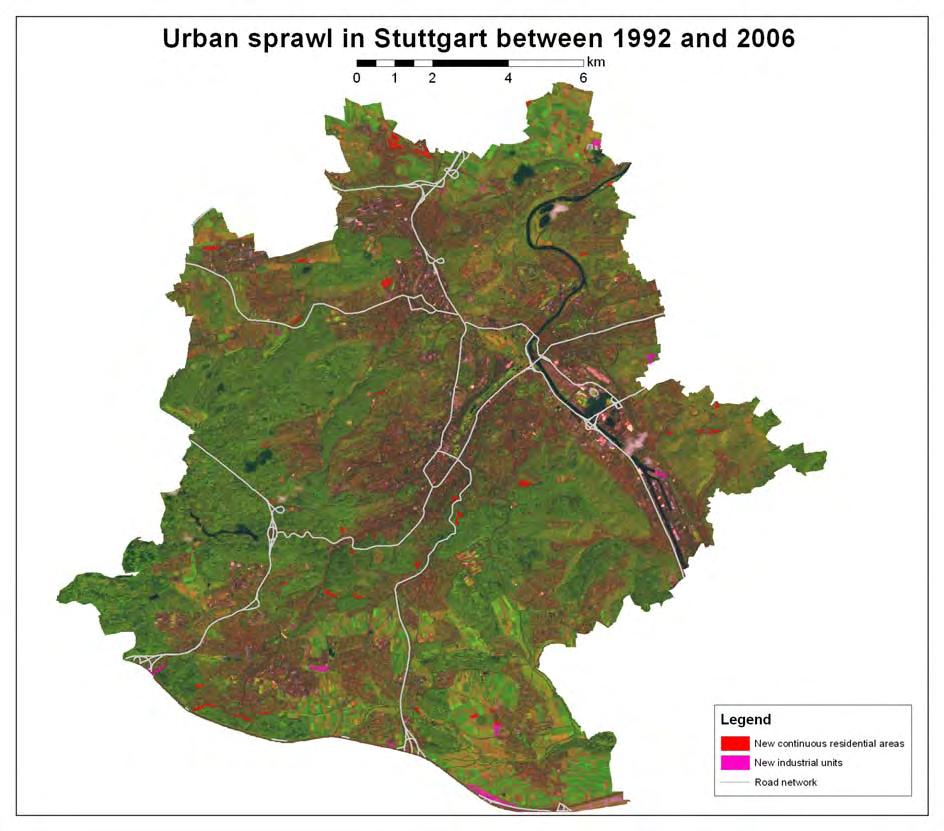
20 Figure 9. Urban sprawl in Prague between 1990 and 2006 on soil quality map Table 8. Indexes for transition of soils of different quality into sealed area for Prague soil quality class Area of soil class Share of soil class Area converted Percent converted transition index (TI) (ha) in total area [%] (ha) [% of soil class area] high quality medium quality low quality Stuttgart The applied assessment method revealed that the urbanization process between 1992 and 2006 captured over 215 hectares of land approximately 190 hectares were converted into continuous sealed area (Table 9). These absolute numbers may differ somewhat from the official statistics data our assessment was aimed at recognition of spatial trends. Residential 19
21 area increase was considerably responsible for the urban sprawl it included both continuous zones and areas of dispersed separate buildings. Discontinuous residential zones cover over 7% of total area these lands still perform some environmental functions including retention, filtering or temperature increase mitigation. The increment was observed in such land use types as airports, transport facilities, sport infrastructure but also green parks. The urbanization took partly place on arable lands but mainly on semi-natural areas such as, for example, abandoned former fruit tree orchards. No clear preferential trends in consumption of particular soil quality classes were observed. They were rather taken for urbanization proportionally to their contribution to the total area covered by the soil map (TI ) (Table 10). Low quality soils were less consumed which might be explained by the fact that they cover only 6% of total soil resources and are not evenly distributed over the city area (Figure 10). The recorded urbanization data leads to the conclusion that the most valuable soils have not been efficiently protected in Stuttgart. Table 9. Summary of land use changes in Stuttgart Land use class area in 2006 area in 1992 difference % of % of [ha] total area [ha] total area [ha] % continuous residential areas commercial and industrial areas green urban areas airports sports and leisure facilities dump and mineral extraction sites arable land grasslands wooded areas (forest or seminatural) discontinuos residential areas water bodies transport facilities total area x x x 20
 transition index (TI) Share of soil class in total area [%] Area")
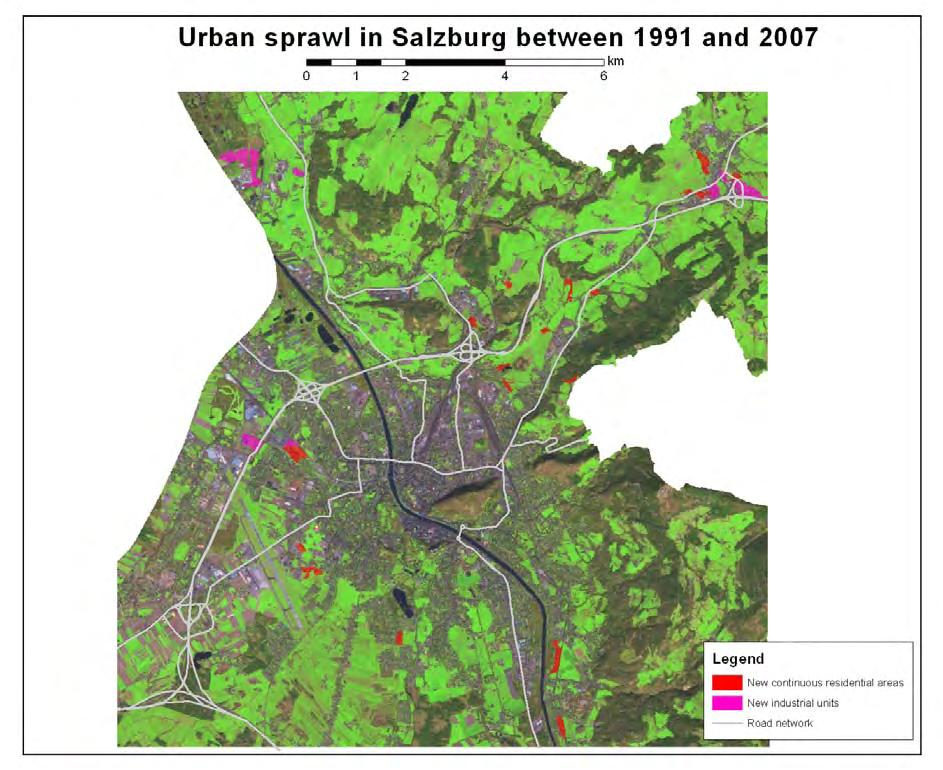
22 Figure 10. Urban sprawl in Stuttgart between 1992 and 2006 on soil quality map Table 10. Indexes for transition of soils of different quality into sealed area for Stuttgart soil quality class Area of soil class (ha) transition index (TI) Share of soil class in total area [%] Area converted (ha) Percent converted [% of soil class area] high quality medium quality low quality Salzburg Equal increase of continuous residential and commercial/industrial area was observed in Salzburg area between 1991 and The total sealing area exceeded 160 hectares 21
23 (Table 11). The new urban fabrics were located on arable lands (3/4 of changes) and likely semi-natural wooded areas (1/4 of changes). The available satellite images for Salzburg and, subsequently, land use maps did not fully cover the Salzburg region. However it did not substantially affect the assessment. Areas behind the land use maps are mostly covered by forests and no substantial land use changes would be expected there. High quality soils occupy only 1/10 part of the area covered by the analysis. However, 35% of new urban fabrics appeared on these most valuable soils (TI=3) (Table 12). Low quality soils were also taken for urbanization preferentially. It must be noted that medium quality soils constitute above ¾ of the analyzed area. Most of land use changes took place on soils of medium quality when expressed in absolute values. Nevertheless, the most valuable soils were not protected and their pool was drained more intensively than their share in total area. Table 11. Summary of land use changes in Salzburg Land use class area in 2007 area in 1991 difference % of % of [ha] total area [ha] total area [ha] % continuous residential areas commercial and industrial areas green urban areas airports sports and leisure facilities dump and mineral extraction sites arable land grasslands wooded areas (forest or seminatural) discontinuos residential areas water bodies transport facilities total area x x x 22
 Share of soil class in total area [%] Area converted (ha) Percent")
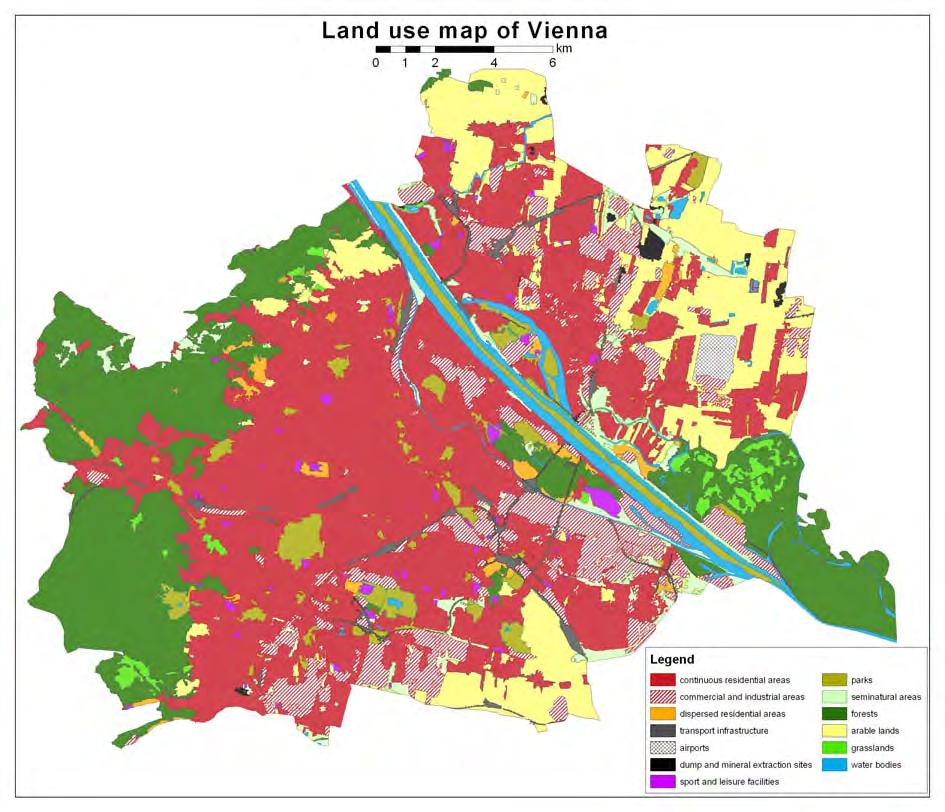
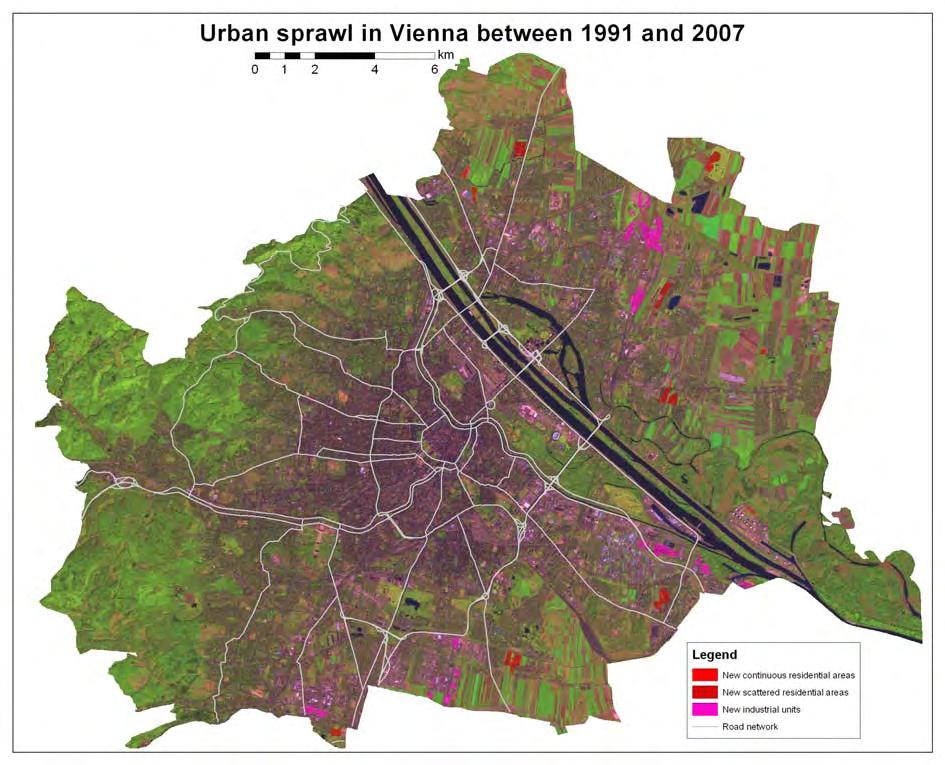
24 Figure 11. Urban sprawl in Salzburg between 1991 and 2007 on soil quality map Table 12. Indexes for transition of soils of different quality into sealed area for Salzburg soil quality class Area of soil class (ha) Share of soil class in total area [%] Area converted (ha) Percent converted [% of soil class area] transition index (TI) high quality medium quality low quality Vienna Most land use changes in Vienna took place in northern-east part of the city (Fig. 12). The substantial increase in commercial/industrial area was observed since 1991 which was greater than sprawl of residential urban fabrics. However residential zones cover up to 40% of total area. Total increase in sealed area exceeded 300 hectares. Most of this enlargement was 23
25 located on arable lands their share lowered from 13.8 to 13.2% of total area within 16 years (Table 13). Soils of high quality are most significant part of the soil resources and constitute 67% of total area for which the soil map is available. Most of new sealing took place on these soils and they were even taken slightly preferentially (TI=1.3). Low quality soils cover less than 1/10 of all soils and they were hardly used for urbanization (Table 14). It must be noted, however, that zone of the recent city expansion is located in northern-east direction where the valuable soils are predominant. Table 13. Summary of land use changes in Vienna Land use class area in 2007 area in 1991 difference % of % of [ha] total area [ha] total area [ha] % continuous residential areas commercial and industrial areas green urban areas airports sports and leisure facilities dump and mineral extraction sites arable land grasslands wooded areas (forest or seminatural) discontinuos residential areas water bodies transport facilities total area x x x 24
 Share of soil class in total area [%] Area converted (ha)")
26 Figure 12. Urban sprawl in Vienna between 1991 and 2007 on soil quality map Table 14. Indexes for transition of soils of different quality into sealed area for Vienna pilot area soil quality class Area of soil class (ha) Share of soil class in total area [%] Area converted (ha) Percent converted [% of soil class area] transition index (TI) high quality medium quality low quality SUMMARY OF LAND USE CHANGE AND SOIL PROTECTION EFFICIENCY IN TEST AREAS This report summarizes outputs of our analysis of relationships between current soil protection policies and the land use change in selected test regions of Central Europe between 25
27 1990/92 and 2006/2007. Land use change size and pattern usually reflects a combination of the geographic location, a specific setting of socioeconomic, historical and environmental conditions and national or regional land/soil protection policies. Therefore it is not practical to analyze these changes for the group of cities as a whole, but instead analyzing them separately since the test areas represent different mechanisms driving land conversion processes. In our analysis we performed analysis for 7 cities representing Germany, Czech Republic, Poland, Slovakia, Austria and Italy. It is well known that the size of conversion of agricultural land into artificial surfaces such as into urban and industrial/commercial units is mainly driven by population growth (both through natural growth and migrations) as well as GDP whereas the spatial sprawl of urban fabrics is partly an independent process and partly is steered by spatial planning. Summarizing our analysis, the area sealed within 15 y period in the test areas ranged from 160 to 780 ha. The data provided here may be somewhat different from the official statistics that use different methodologies. Our study utilized satellite images for detection of land use changes such a method is burdened with a dose of uncertainty. However the advantage of the applied approach is that it enables analysis of spatial trends of land use change and their linkage to soil quality information. The expansion of artificial surfaces took place mostly on arable lands, except Wroclaw and Stuttgart where semi-natural areas were also sealed substantially. New artificial surfaces mostly comprised with residential fabrics, however in some cities (Bratislava and Vienna) development of industrial and commercial constructions was predominant. Bearing in mind some uncertainty of land use change data and that soil data do not cover whole city area the analysis fills the information gap on the quality of soils lost in urbanization process and, thus, efficiency of soil protection approaches. It is evident in the light of this study that the best soils are efficiently protected in Bratislava (Fig. 13). The share of best soils in newly urbanized areas is in Bratislava 5 times smaller than their share in total area. It is assumed that the regulations present in Slovakia help to protect the most valuable soils. The soils classified as high quality in our assessment are covered by a fee payment system (1-4 classes from total 9). Transformation of these agricultural lands into other purposes is loaded with obligatory payment with a range of payment from 6 to 15 EUR per square meter. The similar system had existed in Poland until However this practice did not ensure the efficient protection of most valuable soils in Wroclaw (Table 6, Fig. 13). In Stuttgart and Milan the consumption of high quality soils was rather proportional to their share in the total soil pool. The assessments performed for Wroclaw, Prague, Vienna and 26
28 Salzburg revealed negative trends of preferential use of the most valuable soils. It must be noted that the analysis of soil protection efficiency refers to the period between early nineties to 2006/2007, thus it assesses the regulations existing within this period. It should not be referred to the soil management systems introduced recently. 3,5 TI for high quality soils 3 2,5 2 1,5 1 0, Prague Wroclaw Vienna + Salzburg Stuttgart Bratislava TI for low quality soils Milan Figure 13. Indexes of transition of high and low quality soils into sealed area in the test areas. ( + means presence of positive trend, - presence of negative trend. Positive trend is understood as TI <0.8 for high quality soils and/or TI>1.2 for low quality soils. The negative trend is characterized by the opposite observations) The similar analytical approach as presented in this report can be used for testing how urban growth alters degradation processes (e.g. erosion, contamination) and affects soil function performance (organic matter accumulation, retention potential, buffering capacity) if such spatial information layers are employed in the assessment. 27
29 A comparison of a sealing rate within last 15 years and availability of low and medium quality soils indicates that there is no strong conflict between soil protection goals and a city development needs (Table 15). Such competition may exist locally but, considering this in context of overall city area, the pool of available low and medium quality soils is, for most cities, much greater than land demand for the city development (industry, commerce, transport infrastructure, sport facilities, etc.). This demand is measured by the rate of land transformation into artificial surfaces within last 15 years. Land demand 3 Table 15. Comparison of soil availability and land demand in the test areas. Test area Low quality Low and medium soils 1 quality soils 2 Milan Bratislava Wroclaw Stuttgart Prague Salzburg Vienna soils belonging to low quality agricultural lands (arable and grasslands) within areas covered by the soil maps 2 soils belonging to low and medium quality agricultural lands (arable and grasslands) within area covered by the soil maps 3 rate of artificial surface increase within 15 years in the area covered by the soil maps 5. KEY MESSAGES Expansion of artificial surfaces takes place mostly on arable lands High quality soils were efficiently protected in Bratislava which, at least partly, might be the effect of the fee payment system The most valuable soils were preferentially taken for urbanization in Vienna, Wroclaw, Prague and Salzburg while in Stuttgart and Milan their consumption was proportional to their share in total area. Soil management systems in these cities did not efficiently protect the best soils until 2006 There is no strong conflict between soil protection goals and demand for land related to economic development of cities 6. REFERENCES Antrop M Landscape change and the urbanization process in Europe. Landscape and Urban Planning, 67:

30 COM Communication from the Commission to The Council and European Parliament, The European Economic and Social Committee of The Regions. Thematic Strategy for Soil Protection EAA Image 2000 and CLC Products and methods. European Commission 7. ANNEXES 7.1. Land use maps 29
31 30
32 31
33 32
34 33
35 34
36 35

37 7.2. Land use change maps 36
38 37
39 38
40 39
41 40
42 41
43 42
44 URBAN SMS Soil Management Strategy This paper belongs to the following section of URBAN SMS work plan: WP6 Acceptance and awareness / 6.1 Soil protection measures / Assessment of soil protection efficiency and land use change Contact details of project partner commissioning / responsible for this paper: Mr Grzegorz Siebielec, Institute of Soil Science and Plant Cultivation, ul. Czartoryskich 8, Pulawy, PL, gs@iung.pulawy.pl Other URBAN SMS Partners contributing to this paper: Petra Blümlein & Michael Schweiker, City of Stuttgart, Department for Environmental Protection, DE Isabel Wieshofer, City of Vienna, Environmental Protection, AT Monika Tulipan & Sigbert Huber, Umweltbundesamt, Federal Environment Agency, Vienna, AT Marco Parolin, City of Milan, Executive Plans and Programs for Buildings Department- Office for Reclamation Plans, I Petra Vokurková, Czech University of Life Sciences Prague, CZ Jaroslava Sobocká, Soil Science and Conservation Research Institute, Bratislava, SK Siegmar Jaensch, District Authority Stuttgart, DE This project is implemented through the CENTRAL EUROPE Programme co-financed by the ERDF. The paper in hand reflects the author s views and the Managing Authority of the INTERREG IV B CENTRAL Programme is not liable for any use that may be made of the information contained therein.
Land use change analysis for assessment of soil protection efficiency in urban area URBAN SMS project
 Land use change analysis for assessment of soil protection efficiency in urban area URBAN SMS project Magdalena Gluszynska 1, Grzegorz Siebielec 1, Anna Zurek 1, Artur Lopatka 1 1 Department of Soil Science
Consequences of limited soil protection in cities of Central Europe analyzed through GIS methods and participatory impact assessment URBAN SMS project
 Consequences of limited soil protection in cities of Central Europe analyzed through GIS methods and participatory impact assessment URBAN SMS project Grzegorz Siebielec 1, Artur Lopatka 1, Magdalena Gluszynska
Country fact sheet. Land cover Czech Republic. September Photo: Toni García, My City/EEA
 Country fact sheet Land cover 2012 Czech Republic September 2017 Photo: Toni García, My City/EEA Land cover 2012 Overview of land cover & change According to the annual change rate (0.40%), the overall
Country fact sheet. Land cover Slovakia. September Photo: Toni García, My City/EEA
 Country fact sheet Land cover 2012 Slovakia September 2017 Photo: Toni García, My City/EEA Land cover 2012 Overview of land cover & change With the overall land cover change rate of 0.3 of total area,
URBAN SMS Soil Management Strategy
 URBAN SMS Soil Management Strategy Tools for rational planning and urban soil management Tomaž Vernik Agricultural Institute of Slovenia tomaz.vernik@kis.si Content About the Urban SMS project Soil manager
Country fact sheet. Land cover Serbia. September Photo: Toni García, My City/EEA
 Country fact sheet Land cover 2012 September 2017 Photo: Toni García, My City/EEA Land cover 2012 Overview of land cover & change The development of the n landscape seems to remain stable compared to previous
Country fact sheet. Land cover Hungary. September Photo: Toni García, My City/EEA
 Country fact sheet Land cover 2012 Hungary September 2017 Photo: Toni García, My City/EEA Land cover 2012 Overview of land cover & change With a mean annual land cover change rate of 0.5%, the overall
Country fact sheet. Land cover Germany. September Photo: Toni García, My City/EEA
 Country fact sheet Land cover 2012 Germany September 2017 Photo: Toni García, My City/EEA Land cover 2012 Overview of land cover & change Characterized by the annual land cover change rate of 0,1, the
Country fact sheet. Land cover Austria. September Photo: Toni García, My City/EEA
 Country fact sheet Land cover 2012 Austria September 2017 Photo: Toni García, My City/EEA Land cover 2012 Overview of land cover & change 2006-2012 Despite its significant acceleration, compared to the
Country fact sheet. Land cover Italy. September Photo: Toni García, My City/EEA
 Country fact sheet Land cover 2012 Italy September 2017 Photo: Toni García, My City/EEA Land cover 2012 Overview of land cover & change Italy is a country with a relatively stable landscape, compared to
Country fact sheet. Land cover Luxembourg. September Photo: Toni García, My City/EEA
 Country fact sheet Land cover 2012 Luxembourg September 2017 Photo: Toni García, My City/EEA Land cover 2012 Overview of land cover & change The small country of Luxembourg shows significant decrease of
Country fact sheet. Land cover Norway. September Photo: Toni García, My City/EEA
 Country fact sheet Land cover 2012 Norway September 2017 Photo: Toni García, My City/EEA Land cover 2012 Overview of land cover & change The Norwegian landscape is characterized by very low intensity of
Country fact sheet. Land cover Finland. September Photo: Toni García, My City/EEA
 Country fact sheet Land cover 2012 Finland September 2017 Photo: Toni García, My City/EEA Land cover 2012 Overview of land cover & change The land cover development in Finland has similar intensity and
Country fact sheet. Land cover Poland. September Photo: Toni García, My City/EEA
 Country fact sheet Land cover 2012 Poland September 2017 Photo: Toni García, My City/EEA Land cover 2012 Overview of land cover & change The comparison of annual change rates for the last three observing
The former Yugoslav Republic of Macedonia
 Country fact sheet Land cover 2012 The former Yugoslav Republic of Macedonia September 2017 Photo: Toni García, My City/EEA Land cover 2012 Overview of land cover & change The period in the former Yugoslav
Country fact sheet. Land cover Kosovo* September Photo: Toni García, My City/EEA. *Under UNSCR 1244/99.
 Country fact sheet Land cover 2012 Kosovo* September 2017 Photo: Toni García, My City/EEA *Under UNSCR 1244/99. Land cover 2012 Overview of land cover & change The overall pace of land cover development
Country fact sheet. Land cover Romania. September Photo: Toni García, My City/EEA
 Country fact sheet Land cover 2012 Romania September 2017 Photo: Toni García, My City/EEA Land cover 2012 Overview of land cover & change The Romanian landscape is characterised by its low dynamics of
Country fact sheet. Land cover Bulgaria. September Photo: Toni García, My City/EEA
 Country fact sheet Land cover 2012 Bulgaria September 2017 Photo: Toni García, My City/EEA Land cover 2012 Overview of land cover & change The overall change rate in Bulgaria is very low, compared to other
Country fact sheet. Land cover Malta. September Photo: Toni García, My City/EEA
 Country fact sheet Land cover 2012 Malta September 2017 Photo: Toni García, My City/EEA Land cover 2012 Overview of land cover & change Concerning the land cover development, there occurs no significant
Country fact sheet. Land cover Portugal. September Photo: Toni García, My City/EEA
 Country fact sheet Land cover 2012 Portugal September 2017 Photo: Toni García, My City/EEA Land cover 2012 Overview of land cover & change In the long term, Portugal is a country with the highest dynamics
Country fact sheet. Land cover Switzerland. September Photo: Toni García, My City/EEA
 Country fact sheet Land cover 2012 Switzerland September 2017 Photo: Toni García, My City/EEA Land cover 2012 Overview of land cover & change In the long term, the Swiss landscape shows very low intensity
Country fact sheet. Land cover Denmark. September Photo: Toni García, My City/EEA
 Country fact sheet Land cover 2012 Denmark September 2017 Photo: Toni García, My City/EEA Land cover 2012 Overview of land cover & change The overall land cover change rate in Denmark, which has been below
Country fact sheet. Land cover Albania. September Photo: Toni García, My City/EEA
 Country fact sheet Land cover 2012 Albania September 2017 Photo: Toni García, My City/EEA Land cover 2012 Overview of land cover & change With an annual land cover change rate of 0.1, the overall pace
Country fact sheet. Land cover Cyprus. September Photo: Toni García, My City/EEA
 Country fact sheet Land cover 2012 Cyprus September 2017 Photo: Toni García, My City/EEA Land cover 2012 Overview of land cover & change In the period, there has been observed significant decrease of intensity
Bosnia and Herzegovina
 Country fact sheet Land cover 2012 Bosnia and Herzegovina September 2017 Photo: Toni García, My City/EEA Land cover 2012 Overview of land cover & change The overall pace of land cover development in Bosnia
Country fact sheet. Land cover Liechtenstein. September Photo: Toni García, My City/EEA
 Country fact sheet Land cover 2012 Liechtenstein September 2017 Photo: Toni García, My City/EEA Land cover 2012 Overview of land cover & change As in previous periods, the land cover development in the
Country fact sheet. Land cover Sweden. September Photo: Toni García, My City/EEA
 Country fact sheet Land cover 2012 Sweden September 2017 Photo: Toni García, My City/EEA Land cover 2012 Overview of land cover & change Landscape development in Sweden is very intensive in the 2006-2012
CURRENT PROBLEMS IN SOIL PROTECTION AS SEEN FROM POLAND
 Stanisław Białousz Warsaw University of Technology CURRENT PROBLEMS IN SOIL PROTECTION AS SEEN FROM POLAND Symposium: Soil Protection in Europe Key question for sustainable soil protection Soils in Poland
Changes of artificial surfaces in Slovakia
 Changes of artificial surfaces in Slovakia 1990-2006 Ján Feranec, Monika Kopecká, Ján Oťaheľ, Jozef Novaček Institute of Geography, Slovak Academy of Sciences, Bratislava, Slovakia 32 nd International
Manual of CORINE Land Cover changes
 Manual of CORINE Land Cover changes EEA subvention 2011 Final Draft Prepared by: Gy. Büttner and B. Kosztra Date: 30 Nov 2011 Project Manager: Gy. Büttner Manual of CORINE Land Cover Changes 1 TABLE OF
Country fact sheet. Land cover Spain. September Photo: Toni García, My City/EEA
 Country fact sheet Land cover 2012 Spain September 2017 Photo: Toni García, My City/EEA Land cover 2012 Overview of land cover & change The overall annual land cover change rate in Spain is 0,2, which
1.2. Net change in land cover [ha] 5000
![1.2. Net change in land cover [ha] 5000](/thumbs/94/120614901.jpg "1.2. Net change in land cover [ha] 5000") Land cover 2006 Overview of land cover & change consists of two regions with significantly different character of the landscape. Lowland region of Vojvodina, situated in the northern part of the country,
Land cover 2006 Overview of land cover & change consists of two regions with significantly different character of the landscape. Lowland region of Vojvodina, situated in the northern part of the country,
URBAN SMS Soil Management Strategy. Guidance for Soil in Strategic Environmental Assessment and Environmental Impact Assessment (SEA/EIA Guidance)
") URBAN SMS Soil Management Strategy Guidance for Soil in Strategic Environmental Assessment and Environmental Impact Assessment (SEA/EIA Guidance) M. Leitner & M. Tulipan November, 2011 URBAN SMS WP3 Action
URBAN SMS Soil Management Strategy Guidance for Soil in Strategic Environmental Assessment and Environmental Impact Assessment (SEA/EIA Guidance) M. Leitner & M. Tulipan November, 2011 URBAN SMS WP3 Action
Use of CORINE Land Cover in delivering the EEA strategy
 Use of CORINE Land Cover in delivering the EEA strategy Prof. Jacqueline McGlade Executive Director EIONET Member Countries national teams / co-funding Commission Services: Acknowledgements JRC: joint
Country fact sheet. Land cover Turkey. September Photo: Toni García, My City/EEA
 Country fact sheet Land cover 2012 Turkey September 2017 Photo: Toni García, My City/EEA Land cover 2012 Overview of land cover & change The overall pace of land cover development in Turkey has increased,
1.2. Net change in land cover [ha]
![1.2. Net change in land cover [ha]](/thumbs/72/67518217.jpg "1.2. Net change in land cover [ha]") Land cover 2006 Overview of land cover & change After the large political and economical changes in Slovakia during 90 s, the period is characterised by stabilization - rapid decrease of overall intensity
Land cover 2006 Overview of land cover & change After the large political and economical changes in Slovakia during 90 s, the period is characterised by stabilization - rapid decrease of overall intensity
7 CONCLUSIONS & RECOMMENDATIONS
 7 CONCLUSIONS & RECOMMENDATIONS 7.1 The impact of soil sealing Soil sealing can be defined as the covering of soils by buildings, constructions and layers of completely or partly impermeable artificial
1.2. Net change in land cover [ha] 15
![1.2. Net change in land cover [ha] 15](/thumbs/88/115381486.jpg "1.2. Net change in land cover [ha] 15") Land cover 2006 Overview of land cover & change The Irish landscape (dominated by pastures and peatlands) shows to be less dynamic during this period as average yearly land cover change rate decreased
Land cover 2006 Overview of land cover & change The Irish landscape (dominated by pastures and peatlands) shows to be less dynamic during this period as average yearly land cover change rate decreased
1.2. Net change in land cover [ha] % 1
![1.2. Net change in land cover [ha] % 1](/thumbs/74/69747122.jpg "1.2. Net change in land cover [ha] % 1") Land cover 2006 Overview of land cover & change In period, the situation in landscape of the FYR of Macedonia can be characterized by dynamic development of agricultural land, driven by both internal agricultural
Land cover 2006 Overview of land cover & change In period, the situation in landscape of the FYR of Macedonia can be characterized by dynamic development of agricultural land, driven by both internal agricultural
Country fact sheet. Land cover Slovenia. September Photo: Toni García, My City/EEA
 Country fact sheet Land cover 2012 Slovenia September 2017 Photo: Toni García, My City/EEA Land cover 2012 Overview of land cover & change 2006-2012 In the long term, Slovenia is a country with one of
1.2. Net change in land cover [ha] 20000
![1.2. Net change in land cover [ha] 20000](/thumbs/96/128717489.jpg "1.2. Net change in land cover [ha] 20000") Land cover 2006 Overview of land cover & change The landscape in is characteristic by predominant share of natural land cover, mostly forested land and water bodies. The development of land cover in is
Land cover 2006 Overview of land cover & change The landscape in is characteristic by predominant share of natural land cover, mostly forested land and water bodies. The development of land cover in is
1.2. Net change in land cover [ha] 50000
![1.2. Net change in land cover [ha] 50000](/thumbs/92/107846366.jpg "1.2. Net change in land cover [ha] 50000") Land cover 2006 Overview of land cover & change Finish landscape is characterized by high amount of forested areas and water bodies (almost ¾ of area are composed of coniferous and mixed forest, together
Land cover 2006 Overview of land cover & change Finish landscape is characterized by high amount of forested areas and water bodies (almost ¾ of area are composed of coniferous and mixed forest, together
1.2. Net change in land cover [ha] 1000
![1.2. Net change in land cover [ha] 1000](/thumbs/73/69481075.jpg "1.2. Net change in land cover [ha] 1000") Land cover 2006 Overview of land cover & change The development of landscape in Kosovo is characterized by formation of artificial areas, forested land and, to a lesser extent, arable/crop land and consumption
Land cover 2006 Overview of land cover & change The development of landscape in Kosovo is characterized by formation of artificial areas, forested land and, to a lesser extent, arable/crop land and consumption
Down to earth : Soil degradation and sustainable development in Europe. A challenge for the 21 st century
 United Nation Convention to Combat Desertification Fourth Conference of the Parties Bonn, 19 December 2000 Down to earth : Soil degradation and sustainable development in Europe. A challenge for the 21
1.2. Net change in land cover [ha] 20000
![1.2. Net change in land cover [ha] 20000](/thumbs/79/80301912.jpg "1.2. Net change in land cover [ha] 20000") Land cover 2006 Overview of land cover & change Polish landscape is dominated by (63%) and forest (3). The situation is characterized by consumption of agricultural areas (with a predominant share of arable
Land cover 2006 Overview of land cover & change Polish landscape is dominated by (63%) and forest (3). The situation is characterized by consumption of agricultural areas (with a predominant share of arable
The Blueprint and Council Conclusions:
 The Blueprint and Council Conclusions: Essential to address the challenges that threaten the water ecosystems and their services on which society depends Proposed solutions include assessment of the costs
SPATIAL ANALYSIS OF LAND COVER AND LAND USE CHANGES IN BULGARIA FOR THE PERIOD BASED ON IMAGE AND CORINE LAND COVER DATA
 Proceedings of the 2 nd Workshop of the EARSeL SIG on Land Use and Land Cover SPATIAL ANALYSIS OF LAND COVER AND LAND USE CHANGES IN BULGARIA FOR THE PERIOD 1990-2000 BASED ON IMAGE AND CORINE LAND COVER
1.2. Net change in land cover [ha] 12000
![1.2. Net change in land cover [ha] 12000](/thumbs/72/66539401.jpg "1.2. Net change in land cover [ha] 12000") Land cover 2006 Overview of land cover & change The change of landscape in Cyprus during is dominated by formation of artificial and forested land and on the other hand consumption of open spaces/bare
Land cover 2006 Overview of land cover & change The change of landscape in Cyprus during is dominated by formation of artificial and forested land and on the other hand consumption of open spaces/bare
IV. RESULT AND DISCUSSION
 IV. RESULT AND DISCUSSION The result of forest cover change simulation during 4 years was described. This process is done by using the information of land cover condition obtained from satellite imagery
Protection of wetlands as an element of water management in rural areas
 Protection of wetlands as an element of water management in rural areas Waldemar Mioduszewski, Monika Hardej Institute for Land Reclamation and Grassland Farming, IMUZ Falenty, Poland Actions associated
POLARIZATION OF AGRICULTURAL LANDSCAPES AS A PATH TO ENVIRONMENTAL STABILITY: CASE STUDY OF BREST PALESSE. Valery Maroz
 POLARIZATION OF AGRICULTURAL LANDSCAPES AS A PATH TO ENVIRONMENTAL STABILITY: CASE STUDY OF BREST PALESSE Valery Maroz Belarus State University, Av. Frantishaka Skaryny, 4, 220050, Minsk, Belarus, phone:
REALIZATION OF AGRI-ENVIRONMENTAL PROGRAM IN WESTERN POMERANIA IN THE YEARS
 REALIZATION OF AGRI-ENVIRONMENTAL PROGRAM IN WESTERN POMERANIA IN THE YEARS 2007-2013 Monika Pradziadowicz¹, PhD Abstract. This article presents the assumptions of agri-environmental program implemented
Tier 1 estimation of GHG emissions from organic soils in Cropland Management (CM) and Grazing Land Management (GM) at EU level
 and Grazing Land Management (GM) at EU level") Tier 1 estimation of GHG emissions from organic soils in Cropland Management (CM) and Grazing Land Management (GM) at EU level Simone Rossi, Roland Hiederer, Giacomo Grassi, Raul Abad Viñas Joint Research
Tier 1 estimation of GHG emissions from organic soils in Cropland Management (CM) and Grazing Land Management (GM) at EU level Simone Rossi, Roland Hiederer, Giacomo Grassi, Raul Abad Viñas Joint Research
Open Linked Data in Portugal
 Open Linked Data in Portugal Contribution for INSPIRE Implementation Maria José Vale, Rui Reis, Bruno M. Meneses, Raquel Saraiva, Paulo Patrício, Jesus Estrada Maria José Vale, Rui Reis, Bruno M. Meneses,
COMMISSION STAFF WORKING DOCUMENT. Review of greening after one year
 EUROPEAN COMMISSION Brussels, 22.6.2016 SWD(2016) 218 final PART 3/6 COMMISSION STAFF WORKING DOCUMENT Review of greening after one year EN EN Annex 2 Initial results of the implementation of green direct
ENVIRONMENTAL POLICIES AND SOCIAL IMPACTS WITH REGARD TO LAND AND SOIL MANAGEMENT by
 ENVIRONMENTAL POLICIES AND SOCIAL IMPACTS WITH REGARD TO LAND AND SOIL MANAGEMENT by University of Natural Resources and Applied Life Sciences, Vienna Department of Forest- and Soil Sciences Winfried E.
EVALUATION OF THE MULTIFUNCTIONALITY OF AGRICULTURAL AREAS AS PART OF AN INTEGRATED LAND USE PLANNING APPROACH Klaus Wagner 1
 EVALUATION OF THE MULTIFUNCTIONALITY OF AGRICULTURAL AREAS AS PART OF AN INTEGRATED LAND USE PLANNING APPROACH Klaus Wagner 1 1. INTRODUCTION - PROJECT OVERVIEW The INTERREG IIIB CADSES project Integrated
Land Use/Cover Change Different Spatial Level Study: Cognitive and Practical Value. Elena V. Milanova Moscow State University, Russia
 Land Use/Cover Change Different Spatial Level Study: Cognitive and Practical Value Elena V. Milanova Moscow State University, Russia IGU LUCC Conference Prague, Czech Republic, June 28- July 1,2010 The
Land use for agriculture
 Environment and agriculture 2018 Land use for agriculture More than half of Germany s surface (51.1 percent) is agricultural land: It is used as farmland, for the cultivation of permanent crops or as permanent
1.2. Net change in land cover [ha] 8000
![1.2. Net change in land cover [ha] 8000](/thumbs/72/66958110.jpg "1.2. Net change in land cover [ha] 8000") Land cover 2006 Overview of land cover & change Landscape in Bosnia and Herzegovina is covered mostly by forests (54%), pastures (34%) and semi-natural vegetation (7%). The overall development of land
Land cover 2006 Overview of land cover & change Landscape in Bosnia and Herzegovina is covered mostly by forests (54%), pastures (34%) and semi-natural vegetation (7%). The overall development of land
Southern Finland regional analysis
 Southern Finland regional analysis Background for the exercise Training example and data created originally for training of regional council of Southern Finland 2013 Aims at presenting a realitic, yet
Natura 2000: Benefits and Opportunities for Farmers. Małgorzata Siuta, CEEweb for Biodiversity and Olivia Lewis
 Natura 2000: Benefits and Opportunities for Farmers Małgorzata Siuta, CEEweb for Biodiversity and Olivia Lewis EU Biodiversity Committments HD Art. 6: avoid deterioration of species and habitats: implement
Detection of Grasland Conversion in the
 European Commission, 29 th April 2016, Brussels Detection of Grasland Conversion in the EU with GRAS Dr. Jan Henke, Dr. Norbert Schmitz, Mohammad Abdel-Razek GRAS Global Risk Assessment GmbH Content 1
EIONET 2010 Soil Organic Carbon data collection. Panos Panagos
 EIONET 2010 Soil Organic Carbon data collection Panos Panagos Outline Soil Organic Carbon Collection - Why? Country participation Overall Map Countries OCTOP model & EIONET data Reasons for the deviation
Questions and answers on the Thematic Strategy on soil protection
 MEMO/06/341 Brussels, 22 September 2006 Questions and answers on the Thematic Strategy on soil protection Why is soil important? Soil is literally one of the foundations for our economic prosperity and
Translation of the CORINE Land Cover nomenclature to the Land Cover Meta Language using LCCS3
 Translation of the CORINE Land Cover nomenclature to the Land Cover Meta Language using LCCS3 Vasco Nunes Remote Sensing Group (GDR) Portuguese Geographic Institute (IGP) http://www.igeo.pt/gdr/ Coordinator:
Survey on grassland ecosystem services in the CR. Exchange on TEEB Processes in European Countries 12 October 2011, Isle of Vilm
 Survey on grassland ecosystem services in the CR Exchange on TEEB Processes in European Countries 12 October 2011, Isle of Vilm Ecosystem services of grasslands in the CR survey conducted 2010 2011 consortium:
Between fallow land and land use competition - Land use changes and conflicts in rural and sub urban areas -
 Between fallow land and land use competition - Land use changes and conflicts in rural and sub urban areas - Prof. Dr.-Ing. Theo Kötter Institute of Geodesy and Geoinformation Department of Urban Planning
D.T REQUIREMENTS AND CHECKLIST FOR AN INTEGRATED ENVIRONMENTAL MANAGEMENT STRUCTURE
 D.T2.3.1 - REQUIREMENTS AND CHECKLIST FOR AN INTEGRATED ENVIRONMENTAL MANAGEMENT STRUCTURE Report on requirements and Checklist for an Integrated environmental management structure responsible for land
27 March 2014, Lefkosia (Nicosia), Cyprus
, Cyprus") Agriculture and forestry adaptation challenges of EU Eastern Partnership countries in the South Caucasus under the auspices of the Clima East project Mr Zsolt Lengyel, Team Leader & Key Expert 1. 27 March
Agriculture and forestry adaptation challenges of EU Eastern Partnership countries in the South Caucasus under the auspices of the Clima East project Mr Zsolt Lengyel, Team Leader & Key Expert 1. 27 March
6. Land take by intensive agriculture
 6. Land take by intensive agriculture Key message Intensive agriculture attributes mainly to South of Europe, particularly to Mediterranean region. Outside this region land areas taken by intensive agriculture
4.2.5 Afforestation and Reforestation
 Methods for estimation, measurement, monitoring and reporting of LULUCF activities under Articles 3.3 & 3.4 4.2.5 Afforestation and Reforestation This section elaborates on the general discussion of methods
Land & Ecosystem Accounts in Europe. Ronan Uhel & Jean-Louis Weber
 Land & Ecosystem Accounts in Europe Ronan Uhel & Jean-Louis Weber Why accounting for Land? Produce synthetic assessments, keeping track of the geographic differences Analyse the relation between changes
Building CSOs Capacity on EU Nature-related Policies EU Rural Development Policy
 Building CSOs Capacity on EU Nature-related Policies EU Rural Development Policy Mark Redman Valjevo, 27 October 2011 Total of 11 different seminatural plant communities can be identified in
Corine Land Cover and Land & Ecosystem Accounting tools
 Enrichment of the MedWet Inventory Method Exploring applications of Remote Sensing techniques and of Spatial Data Infrastructure Corine Land Cover and Land & Ecosystem Accounting tools Jean-Louis Weber
URBAN SMS Soil Management Strategy. Identification of scientific and practical needs for consideration of soil issues in planning processes
 URBAN SMS Soil Management Strategy Identification of scientific and practical needs for consideration of soil issues in planning processes S. Huber (Ed) October 23rd, 2009 Contents Introduction 2 General
Soil Erosion map of Europe based on high resolution input datasets
 Soil Erosion map of Europe based on high resolution input datasets Panagos Panos 1, Pasqualle Borrelli 1, Katrin Meusburger 2, Cristiano Ballabio 1, Christine Alewell 2 1 European Commision Joint Research
Trenches combined with living hedges or grass lines Rwanda - Imiringoti
 Trenches combined with living hedges or grass lines Rwanda - Imiringoti Trenches combined with living hedges or grass lines are slow-forming terraces to control soil erosion by changing the length of the
Habitat mapping for valuation of biodiversity and ecosystem functions in the Czech Republic
 Habitat mapping for valuation of biodiversity and ecosystem functions in the Czech Republic Pavel Cudlín 1, Ondřej Cudlín 1, Lenka Štěrbová 1, Jan Purkyt 1,2, Vilém Pechanec 3 1 Global Change Research
Rural land use. Workshop. Auditing Land Use and Development. Olivier Prigent Head of Task 18/10/2017
 18/10/2017 Workshop Rural land use Auditing Land Use and Development 15th EUROSAI WGEA Annual Meeting Parallel session Rural land Use Olivier Prigent Head of Task Rural land use Land use involves the management
Addressing the spatial resolution of agri-environmental indicators in Norway
 Addressing the spatial resolution of agri-environmental indicators in Norway WENDY FJELLSTAD, OSKAR PUSCHMANN AND GRETE STOKSTAD NORWEGIAN FOREST AND LANDSCAPE INSTITUTE ÅS, NORWAY Executive Summary In
Resolution of the Riigikogu General Principles of Climate Policy until 2050
 Resolution of the Riigikogu General Principles of Climate Policy until 2050 The Riigikogu decides on the basis on subsection 20 (1) of the State Budget Act: I. The vision and national target of climate
Land Cover / Land Use & Digital Elevation Maps. These are required for almost all coastal products involving the terrestrial side.
 Land Cover / Land Use & Digital Elevation Maps These are required for almost all coastal products involving the terrestrial side. Example Issues to be Addressed Risk and vulnerability assessment Urbanization
Conservation Agriculture:
 Conservation Agriculture: Its deliverables for effective Soil Conservation and comments on the SoCo findings Gottlieb Basch Soil threats: Erosion Decline in organic matter Soil contamination Soil sealing
FACTSHEET INTRODUCTION. help rebalance the water cycle, mitigate the effects of climate change and improve human health and livelihoods.
 1 FACTSHEET INTRODUCTION World Water Day, on 22 March every year, is about focusing attention on the importance of water. This year s theme, Nature for Water, explores nature-based solutions (NBS) to the
Approved VCS Methodology VM0021
 Approved VCS Methodology VM0021 Version 1.0, 16 November 2012 Soil Carbon Quantification Methodology 2012 The Earth Partners LLC. Methodology developed by: The Earth Partners LLC. Copyright 2012 The Earth
European environmental reporting and policy analysis
 EIONET NRC SOIL Ispra, ITALY 10-12 December 2012 Data requirements for NFP/Eionet Meeting 29 February 2012 European environmental reporting and policy analysis Geertrui Louwagie Ecosystems assessment group
Promoting PES in the Danube Basin
 Promoting PES in the Danube Basin Fostering PES projects in CEE and NIS Training Seminar, December 7-9 2006, Isle of Vilm Yanka Kazakova WWF Danube Carpathian Programme The Danube The most international
Image Classification I
 Image Classification I Classification is the process of labeling image pixels using predetermined categorical classes. Components: Image features Classification scheme Signatures Training Classifiers Classification
Ecosystem accounting at the European Environment Agency: a summary of progress 1
 Ecosystem accounting at the European Environment Agency: a summary of progress 1 Glenn-Marie Lange, The Earth Institute at Columbia University Jean-Louis Weber, European Environment Agency 25 October 2006
4.2.5 Afforestation and Reforestation
 Chapter : Supplementary Methods and Good Practice Guidance Arising from the Kyoto Protocol.. Afforestation and Reforestation This section elaborates on the general discussion of methods applicable to all
Soil Treats, Gaps, and Technical Assessment. Agricultural University of Athens Costas Kosmas
 Soil Treats, Gaps, and Technical Assessment Agricultural University of Athens Costas Kosmas Identified important threats to European soils The European Commission adopted a Soil Thematic Strategy (COM(2006)
Nature conservation & Sustainable Forestry
 Покрајински Завод за заштиту природе Institute for Nature Conservation in Vojvodina Province Nature conservation & Sustainable Forestry Alen Kiš, Marko Đapić NP Tara 2016 Introduction Institutional nature
EU Energy Winter Package (RED Recast) and Future of Forest Biomass Piotr Borkowski, EUSTAFOR s Executive Director
 and Future of Forest Biomass Piotr Borkowski, EUSTAFOR s Executive Director") EU Energy Winter Package (RED Recast) and Future of Forest Biomass Piotr Borkowski, EUSTAFOR s Executive Director Conference: The Need for Sectoral Education on the European path of B&H 9-10/2/2017, Kupres,
EU Energy Winter Package (RED Recast) and Future of Forest Biomass Piotr Borkowski, EUSTAFOR s Executive Director Conference: The Need for Sectoral Education on the European path of B&H 9-10/2/2017, Kupres,
PRIORITISATION OF TARGET AREAS FOR FOREST RESTORATION. Final Report. Produced by WCMC for WWF International
 PRIORITISATION OF TARGET AREAS FOR FOREST RESTORATION Final Report Produced by WCMC for WWF International May 2000 PRIORITISATION OF TARGET AREAS FOR FOREST RESTORATION Contents 1. Background... 1 2. Objectives...
CENTRAL EUROPE PROGRAMME Main inputs collected through partner dialogues
 CENTRAL EUROPE PROGRAMME 2020 Main inputs collected through partner dialogues Summary October 2013 Commissioned by: Central Europe Managing Authority City of Vienna, Municipal Department for EU-Strategy
ASSESSMENT AND SCENARIOS OF LAND USE CHANGE IN EUROPE
 ASSESSMENT AND SCENARIOS OF LAND USE CHANGE IN EUROPE Content: Layout: Illustrations: Published by: RIKS BV (November 28) RIKS BV RIKS BV RIKS BV RIKS BV This is a publication of the Research Institute
Enclosed farmland: Arable and Horticultural, Improved and Neutral Grasslands
 executive summary Executive summary 1 Countryside Survey 2000 (CS2000) and the Northern Ireland Countryside Survey 2000 (NICS2000) have been designed to provide detailed information about the habitats
Overview of land cover & change
 Note The results presented here are based on a change analysis of 44 land cover types mapped consistently on a 1:1. scale across Europe over the decade 199-2 - see Corine land cover programme for details.
A New Digital Georeferenced Database of Soil Degradation in Russia
 IIASA Inter national Institute for Applied Systems Analysis A- 2361 Laxenbur g Austr ia Tel: +43 2236 807 Fax: +43 2236 71313 E-mail: info@iiasa.ac.at Web: www.iiasa.ac.at INTERIM REPORT IR-97-084/November