The Spreadsheet Tool for Estimating Pollutant Load (STEPL)
|
|
|
- Magdalen Barber
- 5 years ago
- Views:
Transcription
1 The Spreadsheet Tool for Estimating Pollutant Load (STEPL) Introduction to STEPL March 20, 2018 Webinar Logistics To ask a question Type your question in the Q&A tool box on the right side of your screen and click the send icon. To report any technical issues (such as audio problems) Type your issue in the Q&A tool box on the right side of your screen and click the send icon and we will respond by posting an answer in that same box. 2 1
2 The Spreadsheet Tool for Estimating Pollutant Loads (STEPL) Introduction to STEPL March 20, 2018 Speakers Aileen Molloy, Tetra Tech, Inc. Mustafa Faizullabhoy, Tetra Tech, Inc. 2
3 Agenda Overview of STEPL Using the model Navigating worksheets Basic inputs & outputs Tools and Calculators Adding and Modifying BMPs STEPL Updates 5 STEPL OVERVIEW 6 3
4 What is STEPL? STEPL Spreadsheet Tool for Estimating Pollutant Load - an EPA model A customized MS Excel spreadsheet model designed to support planning level decision-making What are the average annual pollutant loadings from the non-point sources? How effective are BMPs in reducing pollutant loadings? 7 What is STEPL? Calculates nutrient (N, P, and BOD pollutants) and sediment loads by land use type and aggregated by watershed Calculates load reductions as a result of implementing BMPs Data driven and highly empirical Simple and easy to use Formulas and default parameter values can be modified by users (optional) with no programming required 8 4
5 Who are STEPL Users? Basic understanding of hydrology, erosion, and pollutant loading processes Hydrology > Curve Number approach Erosion > USLE and sediment delivery ratio, urban runoff concentration Pollutant load > runoff concentration Knowledge of environmental data (e.g., land use, agricultural statistics, and BMP efficiencies) Familiarity with MS Excel and Excel Formulas 9 How is STEPL Used? Originally developed to assist State NPS project managers report load reductions to EPA Performance measures for N, P, and Sediment Data entered into the Grant Reporting & Tracking System (GRTS) Also used by other federal/state/local partners, environmental consultants, researchers, etc. Primary model used for NPS project planning 10 5
6 Progression of STEPL Prior to v.4.4 First release Oct 2001 Enhancements over the years BMP calculator Ability to add custom BMPs Groundwater Gullies & streambanks Puerto Rico data LID practices 11 STEPL v.4.4 updates Expanded and updated weather data Added Manure application for pasture land Added tool for calculating average number of months for manure application Added reporting function (Export Input/Output Option) Expanded agricultural BMPs and updated pollutant efficiencies Added flow volume reductions for urban LID and infiltration practices Added Combined BMP Efficiency worksheet Added customized STEPL spreadsheet model for 10 watersheds with ability to determine size of BMP treatment area to meet load reduction target Added E. coli placeholder for possible future release 12 6
7 STEPL Basic Tools STEPL Calculates load for different sources at source and watershed level User can specify and update BMP list Urban BMP Tool for stormwater BMPs BMP calculator Calculates the combined efficiency of multiple BMPs use when more than 1 type of BMP is applied on a single land use type Input Data Server Map interface to generate input data for the model at the HUC12 level 13 STEPL Input Data Requirements Watershed-level data County & Weather Station Land use distribution Agricultural animal population and number of months manure applied Septic system information Land cover specific BMP type and % area applied Urban Land use types for urban BMPs 14 7
8 STEPL System Defaults Derived from user inputs, but can be modified Soil information (based on county) Curve Numbers (land use/soil group) Urban land use distribution Nutrient concentration in runoff/shallow groundwater 15 STEPL Process Steps Sources Cropland Groundwater Urban Runoff Pasture Load before BMP BMP Load after BMP Forest Erosion Feedlot Others STEP 1 STEP 2 STEP 3 STEP


9 System Requirements Windows operating system MS Excel 2010, 2013 or 2016 Not Compatible with Windows 7 operating system and MS Excel 2007 combination At least 30 MB hard disk space and memory >8GB RAM preferred 17 STEPL Website Download the latest STEPL program file from:

10 Alternate STEPL Access 19 STEPL Installation Run the STEPLSetup.exe to install must have admin rights Important: install STEPL in a folder you have write access to 20 10

11 New! Customized Spreadsheet Model Alternative to STEPLSetup.exe Download STEPL 4.4 Spreadsheet Model for 10 Watersheds, which does not require admin rights Allows user to start working in STEPL without using installation package Provides ability to populate the model with up to 10 watersheds and 100 gullies and streambanks 21 STEPL Resources STEPL Installation Package includes: STEPL User Guide BMP Definitions Sample Worksheets Release Notes BMP Calculator Guide Support Worksheets contain input reference data 22 11
12 STEPL Resources Also on the website: Frequently Asked Questions STEPL Slide Shows & Tutorials Alternative Models Document Region 5 Model and documentation STEPL Support: stepl@tetratech.com 23 How to use STEPL 24 12


13 Running STEPL Know before you begin: Number of watersheds Number of gullies/streambanks Tip: enter more than you need as placeholders Enable Macros In Excel 2010, 2013 or 2016, Click on File menu > Options > Trust Center > Trust Center Settings > Macro Settings Select Enable all macros 25 Macro Settings


14 STEPL Main Program 27 STEPL Spreadsheet Composed of four worksheets 28 14


15 Default File Location Data Input Type over Red text only Do not type in cells with black text 30 15

16 Data Input 31 Notes on Input Data Land use distribution is critical Modify inputs with current, local data where available Focus on sources being addressed by project For example, agricultural data will not impact results for urban BMPs Will affect total loads but not the load reduction 32 16


17 BMPs Worksheet Each land use type within each watershed can have one BMP % Area BMP Applied: calculate the proportion of acreage treated by the BMP for that land use 33 Total Load Worksheet Each row of results corresponds to a different watershed or project 34 17


18 Graphs Worksheet 35 Questions 36 18


19 STEPL Input Data Server 37 STEPL Model Input Data Server Data is available at HUC 12 watershed Generate data summaries 38 19

20 STEPL Model Input Data Server: Basic Report Data is summarized by HUC12 watershed 39 New! Manure Application 40 20
 A new table provides EMCs for pastureland based on six groups of livestock density (with and without manure) Default values for all six")

21 Manure Application STEPL v4.4 allows application of manure on Pasture land (Table 2) A new table provides EMCs for pastureland based on six groups of livestock density (with and without manure) Default values for all six categories are average EMC values from previous version STEPL 4.3 Will be updated on a later date based on the published literature and after review/approval by EPA 41 Manure Application STEPL v4.4 includes a new worksheet called ManureApplication Worksheet is accessed via the Manure Application button next to the weather selection pull down menu in the Input worksheet The worksheet can be used for both cropland and pastureland calculations of months of manure application Allows calculation of average number of months for manure application per year 42 21

22 Manure Application Can specify treatment subareas within a watershed in the ManureApplication worksheet Each subarea can have a specific number of months where manure is applied Calculates an area-weighted number of months when manure is applied across the watershed 43 Urban BMP Tool 44 22


23 Urban Land Use Distribution 45 Urban BMP Tool 46 23

24 Urban BMP Tool Select the watershed Select an urban land use to apply the BMP Select the BMP Enter the drainage area to the BMP 47 New! Flow Volume Reductions STEPL can now estimate flow volume reductions for Urban LID and Infiltration BMP practices The user enters the design runoff captured depth, percent imperviousness of the BMP drainage areas and BMP drainage area Pre-populated design storage depths for each of the available infiltration BMPs are included in the BMPList Worksheet Flow volume reductions represented as gallons/year by urban land use type in each watershed 48 24
 Table 6 provides the BMP surface area of number of units (e.g.")
, STEPL calculates Runoff")

25 Flow Volume Reductions Urban worksheet showing volume reductions from urban infiltration BMPs (Table 5 of Urban worksheet) Table 6 provides the BMP surface area of number of units (e.g. rain barrels) Urban LID and infiltration practices in STEPL version 4.4 with flow volume reductions 49 LID* BMPs For LID BMPs marked with an asterisk (*), STEPL calculates Runoff Volume (ac-ft/yr) reduced by the practice LID*/Cistern LID*/Cistern+Rain Barrel LID*/Rain Barrel STEPL calculates the baseline runoff If percentage runoff volume reduction is known, can apply this to determine runoff volume reduction amount Load reduction efficiency = % runoff volume reduced 50 25

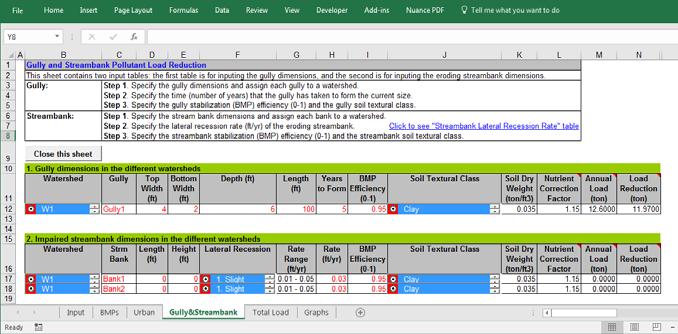
26 Gullies and Streambanks 51 Gullies and Streambanks 52 26
27 STEPL Gully Stabilization Load Average annual erosion during the life of the gully (ton/yr) = Volume x Soil Weight / Years Nutrient load = Annual Erosion x Soil Nutrient Conc. x Correction Factor Load reduction after implementing gully stabilization Specify reduction efficiency (95% efficiency by default) Reduction is equal to annual erosion x user-specified efficiency Volume = (Top Width +Bottom Width) / 2 x Depth x Length 53 Gully Stabilization Nutrient Correction Factor Smaller soil particles -> larger aggregated surface area -> more nutrients attached Soil Texture Nutrient Correction Factor Clay 1.15 Silt 1.00 Sand 0.85 Peat
28 Streambank Erosion Load (Channel Erosion) = Length * Height * Lateral Recession rate * Soil weight Load Reduction = Load * Load reduction efficiency Determining Lateral Recession Rate by Field Observation Lateral Recession Category Description Rate (ft/yr) Slight Some bare bank, no exposed roots Moderate Bank is mostly bare Severe Bank is bare with exposed roots 0.5+ Very Severe Bank is bare with fallen trees 55 Questions 56 28

29 New! Combined BMP Efficiency Pasture and Cropland 57 Combined BMP Efficiency Pasture and Cropland Tool calculates a combined BMP efficiency from multiple types of parallel management practices on the same land use category across the watershed The user selects total treated area by land use and BMP types and acreage of treatment for each treatment area in the watershed 58 29


30 Combined BMP Efficiency Pasture and Cropland The resulting area-weighted values in blue color should be added to Table 7 in the BMPs worksheet Combined BMPs Calculated should then be used in Tables 1 and 2 on the BMPs Worksheet. 59 Saving Combined BMP Scenarios The Copy to Log allows the user to keep a record of the various combination of the combined BMP efficiencies scenarios that are evaluated Creates a Word document (bmplog.docx) in the same location where the STEPL spreadsheet is located 60 30


31 Use the BMP Calculator for Multiple BMPs 61 BMP Calculator 62 31
32 BMP Calculator Calculates combined efficiency of a BMP treatment train for a given land use The use of BMP calculator requires the understanding of BMPs and their placement in the watershed Parallel Reduced tillage Series Conventional tillage Reduced tillage Filter strip Conventional tillage Reduced tillage Settling Basin Combination 63 When is BMP calculator needed? BMP Calculator Not needed - No combined efficiency calculation Needed - Each land use type uses more than one type of BMP 64 32


33 STEPL BMP Calculator Describe schematically the BMP configuration Number and linkages BMP type and efficiency Land use area Calculate combined efficiency Add BMP box Delete Connection Use source area or original load as the weighting factor Calculate combined efficiency Draw Connection 65 BMP Calculator Example Each box represents 100 ac Urban Grass Swale Urban Porous Pavement Load 66 33


34 BMP Calculator Example Each box represents 100 ac Forest Road Grass Planting Forest No On-site Road BMP Filter Strip Load 67 BMP Calculator Example Each box represents 100 ac Crop Regular Tillage Crop Reduced Tillage Filter Strip Load 68 34
35 Questions 69 Adding or Modifying BMPs 70 35


 New BMP added!")
36 Ability to Add BMPs In STEPL customized menu, click View/Edit BMP List BMPList worksheet is shown, add or delete BMPs Customized menu Example: New data inserted here 71 Add New Data to BMP List Update BMP button (BMPList Worksheet) New BMP added! (BMPs Worksheet) New BMP added! 72 36
37 Update BMP List 73 New BMPs and Updated Pollutant Efficiencies New BMPs for cropland and pastureland have been added to STEPL version 4.4 The cropland BMP list has been expanded from 6 BMPs to pastureland BMPs added (previous versions of STEPL did not have pastureland BMPs) Pollutant efficiency numbers for some existing cropland BMPs have been updated All the efficiencies are summarized in the BMPList worksheet New! 74 37

38 New BMPs available in STEPL version 4.4 for Cropland and Pastureland 75 STEPL Updates 76 38


 Integrated Surface Hourly (ISH) 77")
39 Weather Station Updates Increased spatial and temporal resolution of weather stations updated to increase the number of weather stations in STEPL from 493 to 4,998 Each stations has at least 30 years of data Quality controlled data from BASINS Includes data from NOAA NCDC s Summary of the Day (SOD) Hourly Precipitation Data (HPD) Integrated Surface Hourly (ISH) 77 Weather Station Updates 78 39
 is now included in the customized spreadsheets model Need to activate Excel Solver Add-In (follow instructions in the BMPs")
40 Export Input/Output Option An Export Data button has been added to the Input worksheet Allows four options to generate summary report into a MS Word Document for Input and/or Outputs 79 Customized Spreadsheet Model Solver A simple optimization algorithm (Run Solver) is now included in the customized spreadsheets model Need to activate Excel Solver Add-In (follow instructions in the BMPs worksheet to activate Excel Solver Add-In) Optimization is not available in the STEPL installation file version Allows the user to identify the extent of treatment areas to meet a load reduction target from the user selected BMP types The optimization algorithm only solves for non-urban BMPs The optimizer is intended to maximize the load reduction and minimize the treated land use area based on the suite of BMPs provided 80 40

41 Customized Spreadsheet Model Solver Example land uses with BMPs selected and constraints set 81 Summary STEPL is a simple model for estimating long term average pollutant load reductions to support watershed planning Can be applied at various scales from individual farm to large watershed or multiple watersheds STEPL is flexible but requires your input and judgment to apply it to your project Easy to add new data and to customize for site specific needs Seek assistance from your colleagues Questions & suggestions for improvement are always welcome 82 41
42 Contact Information To access STEPL, visit STEPL assistance To contact our speakers: Don Waye Aileen Molloy Mustafa Faizullabhoy 83 42
STEPL & Region 5 Models
 STEPL & Region 5 Models Presentation Overview of STEPL and R5 models Part 1: STEPL What is STEPL? Calculates nutrient (N, P, and BOD pollutants) and sediment loads by land use type and aggregated by watershed
Spreadsheet Tool for Estimating Pollutant Loads. Models & Decision Support Tools Forum Penn State, Harrisburg, PA August 1, 2011
 Spreadsheet Tool for Estimating Pollutant Loads Models & Decision Support Tools Forum Penn State, Harrisburg, PA August 1, 2011 What is STEPL? A customized MS Excel spreadsheet model Simple and easy to
User s Guide. Spreadsheet Tool for the Estimation of Pollutant Load (STEPL) Version 4.1. Developed for U.S. Environmental Protection Agency
 Version 4.1. Developed for U.S. Environmental Protection Agency") User s Guide Spreadsheet Tool for the Estimation of Pollutant Load (STEPL) Version 4.1 Developed for U.S. Environmental Protection Agency By Tetra Tech, Inc. 10306 Eaton Place, Suite 340 Fairfax, VA 22003
User s Guide Spreadsheet Tool for the Estimation of Pollutant Load (STEPL) Version 4.1 Developed for U.S. Environmental Protection Agency By Tetra Tech, Inc. 10306 Eaton Place, Suite 340 Fairfax, VA 22003
User s Guide. Spreadsheet Tool for the Estimation of Pollutant Load (STEPL) Version 4.0. Developed for U.S. Environmental Protection Agency
 Version 4.0. Developed for U.S. Environmental Protection Agency") User s Guide Spreadsheet Tool for the Estimation of Pollutant Load (STEPL) Version 4.0 Developed for U.S. Environmental Protection Agency By Tetra Tech, Inc. 10306 Eaton Place, Suite 340 Fairfax, VA 22003
User s Guide Spreadsheet Tool for the Estimation of Pollutant Load (STEPL) Version 4.0 Developed for U.S. Environmental Protection Agency By Tetra Tech, Inc. 10306 Eaton Place, Suite 340 Fairfax, VA 22003
User s Guide. Spreadsheet Tool for the Estimation of Pollutant Load (STEPL) Version 3.1. Developed for U.S. Environmental Protection Agency
 Version 3.1. Developed for U.S. Environmental Protection Agency") User s Guide Spreadsheet Tool for the Estimation of Pollutant Load (STEPL) Version 3.1 Developed for U.S. Environmental Protection Agency By Tetra Tech, Inc. 10306 Eaton Place, Suite 340 Fairfax, VA 22003
User s Guide Spreadsheet Tool for the Estimation of Pollutant Load (STEPL) Version 3.1 Developed for U.S. Environmental Protection Agency By Tetra Tech, Inc. 10306 Eaton Place, Suite 340 Fairfax, VA 22003
Theresa M. Possley Nelson, PE. Wisconsin Department of Natural Resources
 Theresa M. Possley Nelson, PE Wisconsin Department of Natural Resources WLWCA March 10, 2015 Aaron Ruesch Dave Evans Andrew Craig Adam Freihoefer Ann Hirekatur Impaired Waters & TMDLs Nonpoint Source Implementation
Models Overview: Purposes and Limitations
 Models Overview: Purposes and Limitations Pollutant load originates from: Point-source discharges (NPDES facilities) Info is available on the discharges (DMRs, etc.) Some are steady-flow, others are precip-driven
L-THIA Online and LID in a watershed investigation
 L-THIA Online and LID in a watershed investigation Larry Theller Agricultural and Biological Engineering, Purdue University Great Lakes Sedimentation Workshop Ann Arbor Mi. L-THIA On-line watershed delineation
Opti-Tool: A BMP Optimization Tool for Stormwater Management in EPA Region 1
 Opti-Tool: A BMP Optimization Tool for Stormwater Management in EPA Region 1 Mark Voorhees, EPA Region 1 Khalid Alvi, Tetra Tech April 20, 2016 Project Background Massachusetts (MA) MS4 General Permit
Agricultural and Biological Engineering May 2013
 Purdue University Agricultural and Biological Engineering May 2013 Bernie Engel, Head and Professor Larry Theller, YS Park Agricultural and Biological Engineering Purdue University L-THIA Long Term Hydrologic
BMPTRAINS MODEL: A TRAINING WORKSHOP B Y : M AR T Y W AN I E L I S T A, H AR V E Y H AR P E R AN D M I K E H AR D I N.
 BMPTRAINS MODEL: A TRAINING WORKSHOP B Y : M AR T Y W AN I E L I S T A, H AR V E Y H AR P E R AN D M I K E H AR D I N. PURPOSE OF TRAINING IS TO: Understand the theory essential for estimating annual nutrient
FieldDoc.org User Guide For 2017 NFWF Chesapeake Bay Stewardship Fund Applicants. Background 2. Step 1: Register for a FieldDoc account 3
 FieldDoc.org User Guide For 2017 NFWF Chesapeake Bay Stewardship Fund Applicants Table of Contents (click to go to page) Background 2 Step 1: Register for a FieldDoc account 3 Step 2: Create the Project
GreenPlan Modeling Tool User Guidance
 GreenPlan Modeling Tool User Guidance Prepared by SAN FRANCISCO ESTUARY INSTITUTE 4911 Central Avenue, Richmond, CA 94804 Phone: 510-746-7334 (SFEI) Fax: 510-746-7300 www.sfei.org Table of Contents 1.
APPENDIX 3A: WATERSHED MANAGEMENT MODELS. The L-THIA model provides the following output information: BASIC L-THIA IMPERVIOUS L-THIA
 APPENDIX 3A: WATERSHED MANAGEMENT MODELS Watershed models discussed to assist with Deer Creek Watershed planning efforts include the L-THIA model, the STEP-L model, the SWMM model, the SUSTAIN model and
Bernie Engel Larry Theller Youn Shik Park Purdue University GLRI Project Corps of Engineers 516(e) Program. May 17-18, 2011
 Program. May 17-18, 2011") Bernie Engel Larry Theller Youn Shik Park Purdue University y GLRI Project Corps of Engineers 516(e) Program. May 17-18, 2011 Collaboration with LID Hydrologic Analysis - CN Institute of Water Resources,
Bernie Engel Larry Theller Youn Shik Park Purdue University y GLRI Project Corps of Engineers 516(e) Program. May 17-18, 2011 Collaboration with LID Hydrologic Analysis - CN Institute of Water Resources,
Catchment Scale Stormwater Volume and Pollutant Loading Analyses. Guidance for Municipal Stormwater Program Assessment and Prioritization
 Catchment Scale Stormwater Volume and Pollutant Loading Analyses Guidance for Municipal Stormwater Program Assessment and Prioritization May 2016 Catchment Scale Stormwater Volume and Pollutant Loading
FieldDoc.org User Guide - for 2018 NFWF Chesapeake Bay Stewardship Fund Applicants -
 FieldDoc.org User Guide - for 2018 NFWF Chesapeake Bay Stewardship Fund Applicants - Table of Contents (click to go to page) Background 2 Step 1: Register for a FieldDoc account 3 Step 2: Create the Project
Modeling the Urban Stormwater (and the rest of the watershed) Katherine Antos, Coordinator Water Quality Team U.S. EPA Chesapeake Bay Program Office
 Katherine Antos, Coordinator Water Quality Team U.S. EPA Chesapeake Bay Program Office") Modeling the Urban Stormwater (and the rest of the watershed) Katherine Antos, Coordinator Water Quality Team U.S. EPA Chesapeake Bay Program Office May 13, 2010 Management Actions Chesapeake Bay Program
Modeling the Urban Stormwater (and the rest of the watershed) Katherine Antos, Coordinator Water Quality Team U.S. EPA Chesapeake Bay Program Office May 13, 2010 Management Actions Chesapeake Bay Program
Process-Based BMP Design Tool for Post-Construction. October 18, 2012
 Process-Based BMP Design Tool for Post-Construction October 18, 2012 EPA s Stated Goal + Reduce, through regulation, the impacts of new development and redevelopment storm water runoff to the Nation s
What is SWAT? SWAT GI-LID Module
 What is SWAT? Jeff Arnold SWAT GI-LID Module Jaehak Jeong, Roger Glick, Fouad Jaber Hydrologic and Water Quality System (HAWQS) Raghavan Srinivasan Soil and Water Assessment Tool (SWAT) Developed by USDA-ARS
BMPTRAINS MODEL: A TRAINING WORKSHOP B Y : M AR T Y W AN I E L I S T A, H AR V E Y H AR P E R, E R I C L I V I N G S T O N AN D M I K E H AR D I N.
 BMPTRAINS MODEL: A TRAINING WORKSHOP B Y : M AR T Y W AN I E L I S T A, H AR V E Y H AR P E R, E R I C L I V I N G S T O N AN D M I K E H AR D I N. PURPOSE OF TRAINING IS TO: Understand why nutrient removal
NUTRIENT TRACKING TOOL (NTT: 2 ND GEN.): AN APEX INTERFACE & A TOOL TO EVALUATE THE ECONOMIC AND ENVIRONMENTAL IMPACTS OF FARM MANAGEMENT PRACTICES
: AN APEX INTERFACE & A TOOL TO EVALUATE THE ECONOMIC AND ENVIRONMENTAL IMPACTS OF FARM MANAGEMENT PRACTICES") NUTRIENT TRACKING TOOL (NTT: 2 ND GEN.): AN APEX INTERFACE & A TOOL TO EVALUATE THE ECONOMIC AND ENVIRONMENTAL IMPACTS OF FARM MANAGEMENT PRACTICES (HTTP://NN.TARLETON.EDU/NTTG2) General Description and
NUTRIENT TRACKING TOOL (NTT: 2 ND GEN.): AN APEX INTERFACE & A TOOL TO EVALUATE THE ECONOMIC AND ENVIRONMENTAL IMPACTS OF FARM MANAGEMENT PRACTICES (HTTP://NN.TARLETON.EDU/NTTG2) General Description and
FieldDoc.io User Guide For 2016 NFWF Chesapeake Bay Stewardship Fund Applicants
 FieldDoc.io User Guide For 2016 NFWF Chesapeake Bay Stewardship Fund Applicants This guide provides step-by-step instructions for the use of FieldDoc.io to estimate nutrient and sediment load reductions
Appendix A. Compliance Calculator Guidance
 Compliance Calculator Guidance Appendix A Appendix A. Compliance Calculator Guidance A.1 Introduction The Center for Watershed Protection created the compliance calculator spreadsheet to allow a designer
Barry M. Evans*, David W. Lehning, Tatiana Borisova, Kenneth J. Corradini, and Scott A. Sheeder.
 A GENERIC TOOL FOR EVALUATING THE UTILITY OF SELECTED POLLUTION MITIGATION STRATEGIES WITHIN A WATERSHED Barry M. Evans*, David W. Lehning, Tatiana Borisova, Kenneth J. Corradini, and Scott A. Sheeder.
Using LID for TMDL Compliance: Stairway to Heaven or Highway to Hell? Dustin Bambic, PH Tetra Tech, Nashville TN
 Using LID for TMDL Compliance: Stairway to Heaven or Highway to Hell? Dustin Bambic, PH Tetra Tech, Nashville TN Jason Wright, PE Tetra Tech, Raleigh NC 1 Overview TMDL Compliance Planning for TMDL Compliance
Maryland Phase II WIP Strategies. MONTGOMERY Agriculture - Annual Practices
 Maryland Phase II Strategies MONTGOMERY Agriculture - Annual Practices BMP Name Conservation Tillage Acres/Year 28,436 27,984 27,677 Cover Crop Acres/Year 4,275 10,816 11,000 Cropland Irrigation Management
OVERVIEW OF RUSLE 2 DICK WOLKOWSKI DEPT. OF SOIL SCIENCE UW-MADISON
 OVERVIEW OF RUSLE 2 DICK WOLKOWSKI DEPT. OF SOIL SCIENCE UW-MADISON WHAT IS RUSLE 2 GREAT GRANDSON OF USLE MODEL TO PREDICT SOIL LOSS WHERE OVERLAND FLOW OCCURS COMPUTES ANNUAL SHEET/RILL EROSION COMPUTES
SWAT INPUT DATA:.OPS CHAPTER 33
 CHAPTER 33 SWAT INPUT DATA:.OPS The Scheduled Management Operations (.ops) file is an optional file which allows the simulation of non-reoccurring management related activities. The.ops file is particularly
The Role of Decision Support Systems in Sustainable Management of Water Resources
 The Role of Decision Support Systems in Sustainable Management of Water Resources Bernie Engel Purdue University Agricultural & Biological Engineering Introduction Overview of Talk Water resources decision
Hydromodification Computer Modeling
 Hydromodification Computer Modeling Douglas Beyerlein, P.E. Clear Creek Solutions, Inc. 15800 Village Green Drive #3 Mill Creek, WA 98012 beyerlein@clearcreeksolutions.com Phone: 425.892.6454 Introduction
Welcome to the MWON Advanced Webinar Series
 Welcome to the MWON Advanced Webinar Series Today s presentation: The Importance of Forests to Streams and Groundwater You will need to have speakers attached to your computer to hear the presenter. You
WWHM4 MODELING USING NATIONAL MAP
 WWHM4 MODELING USING NATIONAL MAP Clear Creek Solutions, Inc., 2010 How to create a project that uses national data. WWHM4 is one of the most powerful continuous simulation hydrologic models available.
CASE STUDIES: SWALE EFFECTIVENESS
 CASE STUDIES: SWALE EFFECTIVENESS B Y : M A R T Y W A N I E L I S T A A N D E R I C L I V I N G S T O N August, 2016 Escambia County ACKNOWLEDGEMENTS The Low Impact Design BMP workshops were presented
Project Name: Add a unique name that appropriately identifies the submission
 PTAPP Online Municipal Tracking Tool Instructions Project Name: Add a unique name that appropriately identifies the submission Municipal Project: Check this box if the project is part of municipal efforts
Bob Broz University of Missouri Extension
 Bob Broz University of Missouri Extension brozr@missouri.edu 573-882-0085 What is the purpose on the nutrient reduction committee? Reduce nutrient loading into the Mississippi River and into the Gulf of
Sustainable Urban Stormwater Best Management Practices with InfoSWMM Sustain plus InfoSWMM 2D and SWMMLive
 Sustainable Urban Stormwater Best Management Practices with plus InfoSWMM 2D and SWMMLive Contents 01 Introduction to Sustain What is and How Can it Help Evaluate BMPs and LIDs for sustainability goals?
WMS Tools For Computing Hydrologic Modeling Parameters
 WMS Tools For Computing Hydrologic Modeling Parameters Lesson 9 9-1 Objectives Use the drainage coverage as a basis for geometric parameters as well as overlaying coverages to compute important hydrologic
Appendix 12. Pollutant Load Estimates and Reductions
 Appendix 12. Pollutant Load Estimates and Reductions A pollutant loading is a quantifiable amount of pollution that is being delivered to a water body. Pollutant load reductions can be calculated based
Modeling Nutrient and Sediment Losses from Cropland D. J. Mulla Dept. Soil, Water, & Climate University of Minnesota
 Modeling Nutrient and Sediment Losses from Cropland D. J. Mulla Dept. Soil, Water, & Climate University of Minnesota Watershed Management Framework Identify the problems and their extent Monitor water
Sustainable STEM Series
 W 338-C Sustainable STEM Series Science, Technology, Engineering and Mathematics for a Sustainable Future All over the media are reports that the United States is falling behind other countries in the
BMPTRAINS MODEL: EXAMPLE APPLICATION AND NAVIGATION OF THE MODEL
 Pinellas County Stormwater Management Manual Training Workshop BMPTRAINS MODEL: EXAMPLE APPLICATION AND NAVIGATION OF THE MODEL BY: MARTY WANIELISTA, 2017 PURPOSE : Understand the basis of removal for
WMS 9.0 Tutorial GSSHA Applications Simulating Constituent Transport Model constituent transport in GSSHA
 v. 9.0 WMS 9.0 Tutorial GSSHA Applications Simulating Constituent Transport Model constituent transport in GSSHA Objectives Develop input parameters for and run a long-term model that simulates constituent
Nichole M. Embertson, Ph.D. Whatcom Conservation District. May 2, 2012 Abbotsford-Sumas Aquifer Groundwater Nitrate Science Forum Abbotsford, CN
 Nichole M. Embertson, Ph.D. Whatcom Conservation District May 2, 2012 Abbotsford-Sumas Aquifer Groundwater Nitrate Science Forum Abbotsford, CN Background ARM System Assessment Development Implementation
Pinellas County Stormwater Management Manual Training Workshop SMALL COMMERCIAL AREA CASE STUDY
 Pinellas County Stormwater Management Manual Training Workshop SMALL COMMERCIAL AREA CASE STUDY PRE POST (ACTUAL) WHICH IS THE APPROPRIATE PERFORMANCE STANDARD? Post = 90% of Pre vs. 55% N and 80% P reduction
Using Data to Support Watershed Protection and Restoration Decisions
 Using Data to Support Watershed Protection and Restoration Decisions CSI Watershed You found the (water) body. There were signs of a struggle. What happened? The evidence will come from lots of places...
Revisiting the BMP Removal Rate Adjustor Curves. Mike Hickman PA DEP
 Revisiting the BMP Removal Rate Adjustor Curves Mike Hickman PA DEP johickman@pa.gov BMP Enhancements Recommendations of the Expert Panel to Define Removal Rates for Urban Stormwater Retrofit Projects
CASE STUDIES: BMPTRAINS MODEL
 CASE STUDIES: BMPTRAINS MODEL B Y : M A R T Y W A N I E L I S T A A N D E R I C L I V I N G S T O N August, 2016 Escambia County ACKNOWLEDGEMENTS The Low Impact Design BMP workshops were presented on August
Stormwater Treatment Practice (STP) Calculator Instructions
 Calculator Instructions") Stormwater Treatment Practice (STP) Calculator Instructions The STP Calculator is a tool developed by the Department of Environmental Conservation (DEC) to estimate total phosphorus load reductions achieved
Stormwater Treatment Practice (STP) Calculator Instructions The STP Calculator is a tool developed by the Department of Environmental Conservation (DEC) to estimate total phosphorus load reductions achieved
WinSLAMM v 10 Theory and Practice
 WinSLAMM v 10 Theory and Practice Using WinSLAMM v10 to Meet Urban Stormwater Management Goals 1 We will cover... WinSLAMM Purpose, History and Unique Features Model Applications Small Storm Hydrology
Environment, Energy, Security & Sustainability (E2S2)
") Environment, Energy, Security & Sustainability (E2S2) Modeling Your Way Through EISA Patrick N. Deliman, PhD Environmental Laboratory US Army Engineer Research and Development Center US Army Corps of Engineers
Environment, Energy, Security & Sustainability (E2S2) Modeling Your Way Through EISA Patrick N. Deliman, PhD Environmental Laboratory US Army Engineer Research and Development Center US Army Corps of Engineers
Effectiveness of Non-Structural Measures in Watershed Restoration
 Effectiveness of Non-Structural Measures in Watershed Restoration Bill Frost, PE, D.WRE Sr. Water Resources Engineer KCI Technologies, Inc. Sparks, MD 2011 Low Impact Development Symposium Philadelphia,
Introduction. Definitions of Land Use Terms Used in Spreadsheets. Tar-Pamlico Stormwater Rule 15A NCAC 2B.0258 Last Modified 3/20/2017
 Tar-Pamlico Stormwater Rule 15A NCAC 2B.0258 Last Modified 3/20/2017 Introduction The set of worksheets included in this file will enable stormwater permit applicants to comply with, and local governments
Effect of Land Surface on Runoff Generation
 Effect of Land Surface on Runoff Generation Context: Hydrologic Cycle Runoff vs Infiltration Infiltration: Process by which water on the ground surface enters the soil Runoff: Water (from rain, snowmelt,
Appendix X: Non-Point Source Pollution
 Appendix X: Non-Point Source Pollution Sources Nonpoint source of pollution, unlike pollution from industrial and sewage treatment plants, comes from many different sources. Nonpoint source pollution is
Opti-Tool for Stormwater and Nutrient Management Mark Voorhees, US Environmental Protection Agency, Region 1
 Opti-Tool for Stormwater and Nutrient Management Mark Voorhees, US Environmental Protection Agency, Region 1 (voorhees.mark@epa.gov) What is Opti-Tool? Opti-Tool (Stormwater Management Optimization Tool)
Appendix F: Modeled Benefits for New Wet Weather Structural BMPs
 Appendix F: Modeled Benefits for New Wet Weather Structural BMPs APPENDIX F: MODELED BENEFITS FOR NEW WET WEATHER STRUCTURAL BMPS F.1 Introduction The purpose of this appendix is to document the methodology
User s Manual for the BMPTRAINS Model
 User s Manual for the BMPTRAINS Model Marty Wanielista, Harvey Harper, Eric Livingston, Mike Hardin, Przemyslaw Kuzlo. and Ikiensinma Gogo-Abite RETENTION BASIN WET DETENTION / MAP EXFILTRATION TRENCH
Overview of Proposed Amendments to NR 151
 MAMSWaP Quarterly Meeting Overview of Proposed Amendments to NR 151 Jim Bertolacini WDNR Storm Water Program Topics (discussion focused on non-ag elements of rule) Historical background Overview of current
Presented by: Andrew Craig DNR Nonpoint Source Planning Coordinator Nov 2016 National NPS Conference Boston, MA
 Presented by: Andrew Craig DNR Nonpoint Source Planning Coordinator Nov 2016 National NPS Conference Boston, MA Nonpoint source pollution continues to be the leading source of water quality impairments
A Primer on Stormwater Management, your Facility and the Chesapeake Bay. Tom Schueler Chesapeake Stormwater Network June
 A Primer on Stormwater Management, your Facility and the Chesapeake Bay Tom Schueler Chesapeake Stormwater Network June 5. 2017 Key Themes Why do we need to be concerned about Stormwater? What are all
STORMWATER MANAGEMENT DIVISION
 STORMWATER MANAGEMENT DIVISION Western Branch Restoration Plan Public Meeting January 28, 2019 Welcome from Jerry Maldonado Purpose of Meeting Review why watershed restoration plans are needed in Prince
TRUST. Technology Reporting Using Structured Templates for the FCH JU. User Manual for data providers. Version 1.00
 TRUST Technology Reporting Using Structured Templates for the FCH JU User Manual for data providers Version 1.00 Table of contents TRUST ----------------------------------------------------------------------------------------------------------------------------
SDHM 3.1 User Workshop Morning Session. Instructor: Doug Beyerlein, P.E., P.H., D.WRE Clear Creek Solutions, Inc.
 SDHM 3.1 User Workshop Morning Session Instructor: Doug Beyerlein, P.E., P.H., D.WRE Clear Creek Solutions, Inc. www.clearcreeksolutions.com SDHM 3.1 San Diego Hydrology Model Developed for: San Diego
How Climate Change Impacts Urban Runoff and Water Quality Design
 How Climate Change Impacts Urban Runoff and Water Quality Design by J. C. Hayes, C. Privette, III and S. J. Klaine AWRA Conference Anchorage, AK May 4-7, 2009 Presentation Outline Introduction: Why manage
PA Chesapeake Bay Phase II Watershed Implementation Plan Schuylkill County Planning Targets
 PA Chesapeake Bay Phase II Watershed Implementation Plan Schuylkill County Planning Targets What are Planning Targets? The Chesapeake Bay TMDL established regulatory waste load allocations and load allocations
Northern Chain of Lakes
 Northern Chain of Lakes Presented by Pat Conrad and Joe Pallardy on behalf of the Brown s Creek Watershed District Board of Managers w a t e r I e c o l o g y I c o m m u n i t y Lake by Lake Analysis
Blue Lake Stormwater Retrofit Analysis
 P a g e 1 Blue Lake Stormwater Retrofit Analysis Prepared by: Isanti Soil and Water Conservation District And Sherburne Soil and Water Conservation District P a g e 4 Executive Summary Blue Lake and its
BMP Planning to Address Urban Runoff Plaster Creek Watershed SUSTAIN Pilot
 BMP Planning to Address Urban Runoff Plaster Creek Watershed SUSTAIN Pilot December 31, 2012 Prepared for: U.S. Environmental Protection Agency -- Region 5 Michigan Department of Environmental Quality
PureSense. Irrigation Manager. User Guide
 PureSense Irrigation Manager User Guide 2011 PureSense Environmental, all rights reserved Michelle M. Frey, Brandon Riggenti February 2, 2012 Table of Contents Quick Steps to viewing the Readings for your
Using the Irrigation Calculator to schedule irrigation involves one-time set up, making a plan, and refining the plan. SETUP
 Getting Started with the CASP Irrigation Calculator Using the Irrigation Calculator to schedule irrigation involves one-time set up, making a plan, and refining the plan. SETUP o Weather: Select a CIMIS
How to Complete the NMP Appendix 4 Input Worksheet (Appendix 4 Crop & Manure Management, Appendix 5 P Index, Winter Manure Application Matrix)
") Purpose: This procedure describes the process to complete the App Input, (Appendix 4 Crop & Manure Management), Worksheet. All of the field or Crop Management Unit, (CMU), information is entered in one
Purpose: This procedure describes the process to complete the App Input, (Appendix 4 Crop & Manure Management), Worksheet. All of the field or Crop Management Unit, (CMU), information is entered in one
How is Water Quality Affected by Land Use?
 Watershed Connections Lesson Les4 3 How is Water Quality Affected by Land Use? Overview What are the benefits of a healthy watershed? What are examples of land uses? What types of pollution can come from
Water Resources Management Plan Appendix B
 B u r n s v i l l e M i n n e s o t a Water Resources Management Plan Appendix B Appendix B Page B-1 Burnsville, Minnesota STORM WATER LOW-IMPACT DEVELOPMENT GUIDE MANUAL SHORT ELLIOTT HENDRICKSON INC.
10/16/2013. The Big Picture of LID and Green Infrastructure. Learning Objectives
 Low impact development (LID) the basic idea behind LID is to manage stormwater in a way that imitates the natural hydrology of a site. Details Matter Selection, Design, and Implementation of Low Impact
National Agricultural Pesticide Risk Assessment (NAPRA) Web
 Web") The NAPRA Program 1 Acushla Antony 2, Indrajeet Chaubey, Bernard Engel, Natalie Carroll 2 Respectively, Graduate student, Professor, Professor and Head, and Professor, Department of Agricultural and Biological
The NAPRA Program 1 Acushla Antony 2, Indrajeet Chaubey, Bernard Engel, Natalie Carroll 2 Respectively, Graduate student, Professor, Professor and Head, and Professor, Department of Agricultural and Biological
History of Model Development at Temple, Texas. J. R. Williams and J. G. Arnold
 History of Model Development at Temple, Texas J. R. Williams and J. G. Arnold INTRODUCTION Then Model development at Temple A long history (1937-present) Many scientists participating in: Data collection
Conservation Practices. Conservation Choices. These five icons will show the benefits each practice offers... 6/4/2014
 Conservation Choices Your guide to conservation and environmental farming practices. Conservation Choices These five icons will show the benefits each practice offers... The practice reduces soil erosion
User s Manual for the BMP Trains 2020 Model
 User s Manual for the BMP Trains 2020 Model For BMP Trains 2020 Version 1.2.7 April 2019 Marty Wanielista, Ron Eaglin, Rich Magee, Harvey Harper, Eric Livingston, Mike Hardin, Przemyslaw Kuzlo, and Ikiensinma
Objectives of the Study
 Integration of AGNPS, GIS, and Remote Sensing for Estimating Nonpoint Source Pollution in the Saginaw Bay, Michigan Chansheng He Department of Geograophy Western Michigan University Kalamazoo, MI 49008
TABLE B.3 - STORMWATER BMP POLLUTANT REMOVAL EFFICIENCIES
 BMPS DESCRIPTION p p p p TSS TP Sol P TN Stormwater Ponds**, 8 Stormwater Wetland** and extended detention, and some elements of a shallow marsh equivalent capable of treating the full water quality volume.
The Source Loading and Management Model (SLAMM)
") The Source Loading and Management Model (SLAMM) A Water Quality Management Planning Model for Urban Stormwater Runoff Robert Pitt, P.E., Ph.D., DEE Department of Civil and Environmental Engineering, The
The Source Loading and Management Model (SLAMM) A Water Quality Management Planning Model for Urban Stormwater Runoff Robert Pitt, P.E., Ph.D., DEE Department of Civil and Environmental Engineering, The
WDNR - Using Snap-Plus to Quantify Phosphorus Trading Credits ( )
") WDNR - Using Snap-Plus to Quantify Phosphorus Trading Credits (10-23-) Purpose The purpose of this document is to provide technical assistance for using the P Trade report in SnapPlus to quantify Phosphorus
WDNR - Using Snap-Plus to Quantify Phosphorus Trading Credits (10-23-) Purpose The purpose of this document is to provide technical assistance for using the P Trade report in SnapPlus to quantify Phosphorus
City of San Diego Low Impact Development Design Manual
 City of San Diego Low Impact Development Design Manual Jason Wright, P.E. Jim Nabong, P.E. LID Symposium September 2011 1 Project Team City Staff: Sumer Hasenin James Nabong Garbini and Garbini Landscape
Linking Land Use to Water Quality
 Title Slide Title Slide Linking Land Use to Water Quality NEMO Intro/Credit Slide This educational slide show has been created by the NEMO Project at the University of Connecticut Cooperative Extension
MINIMIZING THE RISK OF MANURE RUNOFF THIS FALL/WINTER. Nichole Embertson, Ph.D. Whatcom Conservation District
 MINIMIZING THE RISK OF MANURE RUNOFF THIS FALL/WINTER Nichole Embertson, Ph.D. Whatcom Conservation District Whatcom Speaker Series October 16, 2014 What is on your mind right now?? Agronomics = Nutrient
WATERSHED. Maitland Valley. Report Card 201
 Maitland Valley WATERSHED Report Card 201 The Maitland Valley Conservation Authority has prepared this report card as a summary on the state of our forests, wetlands, surface water, and ground water resources.
Water Quality Ecosystem Services in the Urban Environment
 Water Quality Ecosystem Services in the Urban Environment Dianna Hogan and JV Loperfido ACES 2010 December 7, 2010 U.S. Department of the Interior U.S. Geological Survey Water Quality Ecosystem Services
WinSLAMM v 10.0 User s Guide. Stormwater Control Devices
 WinSLAMM v 10.0 User s Guide Stormwater Control Devices Control Devices Summary Biofiltration Catch Basins Cisterns Media Filters Other Control Device Porous Pavement Filter Strips Street t Cleaning Grass
Chesapeake Bay Program Indicator Analysis and Methods Document Reducing Pollution Indicators Updated May 2018
 1 Chesapeake Bay Program Indicator Analysis and Methods Document Reducing Pollution Indicators Updated May 2018 Indicator Title: Reducing Pollution Relevant Outcome(s): 2017 Watershed Implementation Plans
Swan Creek Workshop November 10, 2009
 Swan Creek Workshop November 10, 2009 Host: Toledo Metropolitan Area Council of Governments Workshop by: Institute of Water Research Michigan State University and Department of Agricultural and Biological
4. Ponds and infiltration BMPs can achieve 60 to 100% removal efficiencies for sediment.
 Landscape BMPs For the purposes of this project, preventive measures have been categorized into two categories: landscape BMPs and source prevention BMPs. Landscape BMPs includes both vegetative practices
Bronx River Pollutant Loading Model Summary
 Bronx River Pollutant Loading Model Summary Section of River Located in Bronx County Table of Contents Drainage Areas...2 Data Sets Used for Analysis...2 Land Use Statistics...3 Model Calculations...3
Project Priority List scoring worksheet - stormwater Guidance document
 www.pca.state.mn.us Project Priority List scoring worksheet - stormwater Guidance document PLEASE NOTE: THE MINNESOTA STATE FISCAL YEAR IS FROM JULY 1 JUNE 30 The first step towards receiving either a
GUIDELINES FOR STORMWATER BACTERIA REDUCTIONS THROUGH BMP IMPLEMENTATION NY/NJ HARBOR TMDL DEVELOPMENT
 GUIDELINES FOR STORMWATER BACTERIA REDUCTIONS THROUGH BMP IMPLEMENTATION NY/NJ HARBOR TMDL DEVELOPMENT Elevated bacteria in stormwater runoff in urban areas are well documented by many researchers. Monitoring
Water Quality Modeling for TMDLs: A Functional Overview. Kyle Hall Senior Water Resources Engineer October 14, 2015
 Water Quality Modeling for TMDLs: A Functional Overview Kyle Hall Senior Water Resources Engineer October 14, 2015 My Goal To provide a general overview of water quality modeling with two objectives: Be
Virginia Stormwater Regulations Proposed Changes. Planning Commission May 5, 2009
 Virginia Stormwater Regulations Proposed Changes Planning Commission May 5, 2009 WHY MANAGE STORMWATER ANYWAY?? ISSUES OF: 1. Pollution runoff from surfaces 2. Increased volumes of water 3. Increased velocities
Growing Greener Watershed Protection and AMD Set-Aside Goals and Accomplishments Worksheets
 COMMONWEALTH OF PENNSYLVANIA DEPARTMENT OF ENVIRONMENTAL PROTECTION Project Name Growing Greener Watershed Protection and AMD Set-Aside Goals and Accomplishments Worksheets Project County *Is this project
CHAPTER 2 EROSION CONTROL
 CHAPTER 2 EROSION CONTROL 2.1 EROSION AND EROSION CONTROL Understanding Erosion Erosion occurs when soil particles are detached from the land surface and carried downslope by moving water. Figure 2.1-1
Learn how to design inlet grates, detention basins, channels, and riprap using the FHWA Hydraulic Toolbox and WMS
 v. 11.0 WMS 11.0 Tutorial Learn how to design inlet grates, detention basins, channels, and riprap using the FHWA Hydraulic Toolbox and WMS Objectives Learn how to use several Hydraulic Toolbox calculators