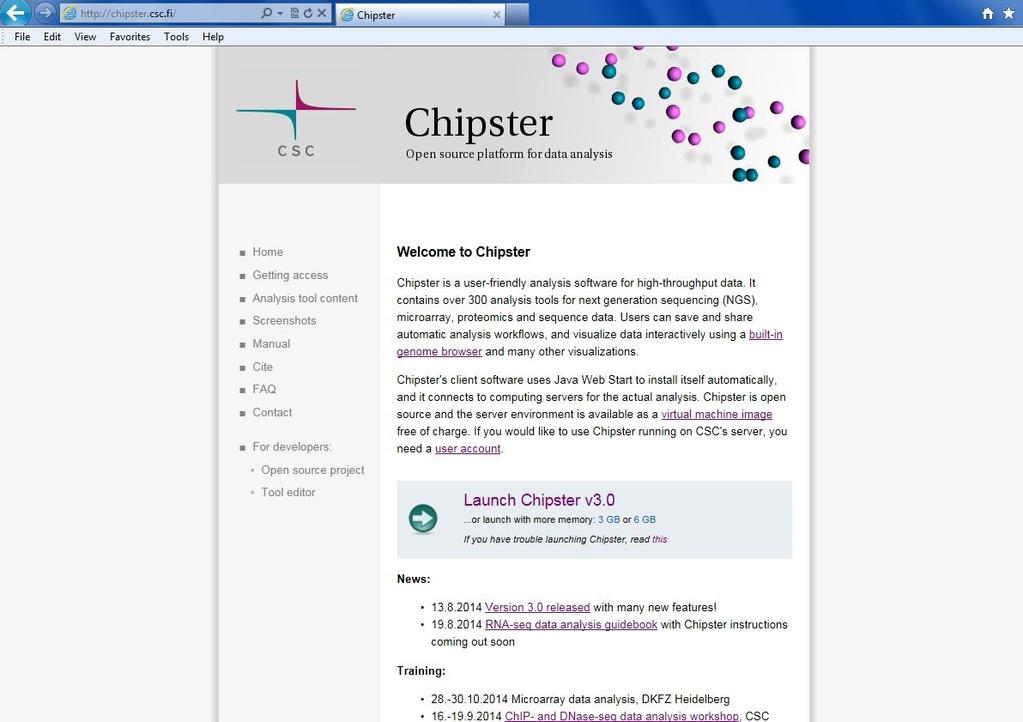
RNA-seq data analysis with Chipster. Eija Korpelainen CSC IT Center for Science, Finland
|
|
|
- Bernice West
- 6 years ago
- Views:
Transcription
1 RNA-seq data analysis with Chipster Eija Korpelainen CSC IT Center for Science, Finland
2 What will I learn? 1. What you can do with Chipster and how to operate it 2. What RNA-seq can be used for 3. The central steps in RNA-seq data analysis: how to check the quality of the reads remove bad quality data align RNA-seq reads to the reference genome visualize aligned reads in genomic context count reads per genes perform differential expression analysis
3 Outline 1. Introduction to Chipster 2. Introduction to RNA-seq 3. RNA-seq data analysis Quality control, preprocessing Alignment (=mapping) to reference genome Manipulation of alignment files Alignment level quality control Visualization of alignments in genome browser Quantitation Differential expression analysis
4 Introduction to Chipster
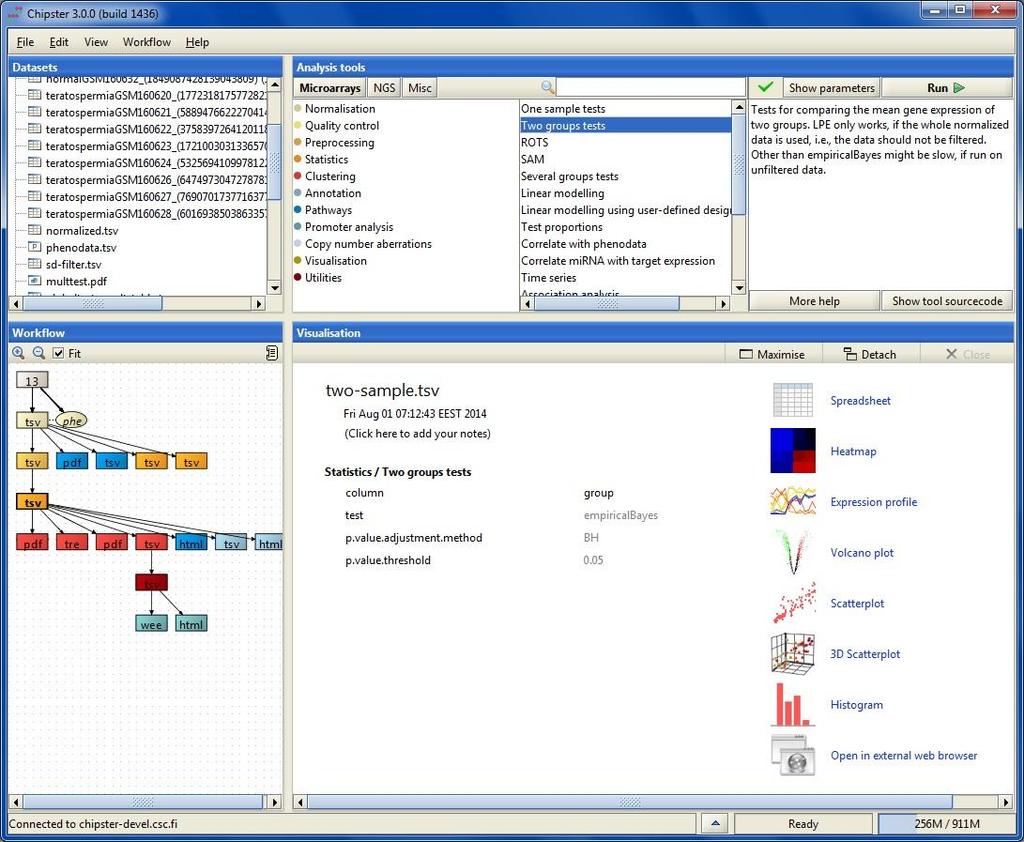
5 Chipster Provides an easy access to over 340 analysis tools No programming or command line experience required Free, open source software What can I do with Chipster? analyze and integrate high-throughput data visualize data efficiently share analysis sessions save and share automatic workflows
6
7
8 Interactive visualizations
9 Analysis tool overview 140 NGS tools for 140 microarray tools for RNA-seq gene expression mirna-seq mirna expression exome/genome-seq protein expression ChIP-seq acgh FAIRE/DNase-seq SNP MeDIP-seq integration of different data CNA-seq Metagenomics (16S rrna) 60 tools for sequence analysis BLAST, EMBOSS, MAFFT Phylip


10 Tools for QC, processing and mapping FastQC PRINSEQ FastX TagCleaner Trimmomatic Bowtie TopHat BWA Picard SAMtools BEDTools


11 RNA-seq tools Quality control RseQC Counting HTSeq express Transcript discovery Cufflinks Differential expression edger DESeq Cuffdiff DEXSeq Pathway analysis ConsensusPathDB
12 mirna-seq tools Differential expression edger DESeq Retrieve target genes PicTar mirbase TargetScan miranda Pathway analysis for targets GO KEGG Correlate mirna and target expression

13 Exome/genome-seq tools Variant calling Samtools Variant filtering VCFtools Variant annotation AnnotateVariant (Bioconductor)


14 ChIP-seq and DNase-seq tools Peak detection MACS F-seq Peak filtering P-value, no of reads, length Detect motifs, match to JASPAR MotIV, rgadem Dimont Retrieve nearby genes Pathway analysis GO, ConsensusPathDB
15 MeDIP-seq tools Detect methylation, compare two conditions MEDIPS
16 CNA-seq tools Count reads in bins Correct for GC content Segment and call CNA Filter for mappability Plot profiles Group comparisons Clustering Detect genes in CNA GO enrichment Integrate with expression
17 Metagenomics / 16 S rrna tools Taxonomy assignment with Mothur package Align reads to 16 S rrna template Filter alignment for empty columns Keep unique aligned reads Precluster aligned reads Remove chimeric reads Classify reads to taxonomic units Statistical analyses using R Compare diversity or abundance between groups using several ANOVA-type of analyses
18 Technical aspects Client-server system Enough CPU and memory for large analysis jobs Centralized maintenance Easy to install Client uses Java Web Start Server available as a virtual machine

19 Acknowledgements to users and contibutors

20 More info
21 Chipster: General functionality
 and click run View")
22 Mode of operation Select data Select tool category Select tool (set parameters if necessary) and click run View results

23 Analysis history is saved automatically -you can add tool source code to reports if needed

24 Task manager You can run many analysis jobs at the same time Use Task manager to view status cancel jobs view time view parameters
25 Analysis sessions In order to continue your work later, you have to save the analysis session. Saving the session will save all the files and their relationships. The session is packed into a single.zip file and saved on your computer (in the next Chipster version you can also save it on the server). Session files allow you to continue the work on another computer, or share it with a colleague. You can have multiple analysis sessions saved separately, and combine them later if needed.
")
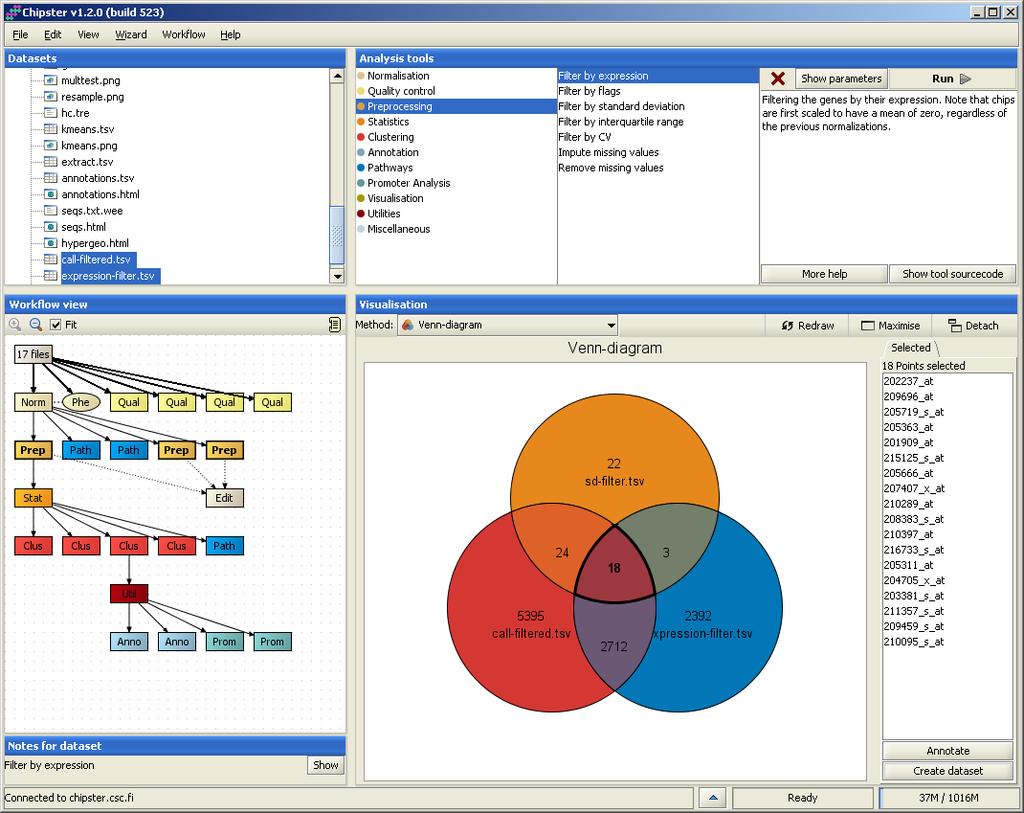
26 Workflow panel Shows the relationships of the files You can move the boxes around, and zoom in and out. Several files can be selected by keeping the Ctrl key down Right clicking on the data file allows you to Save an individual result file ( Export ) Delete Link to another data file Save workflow
27 Workflow reusing and sharing your analysis pipeline You can save your analysis steps as a reusable automatic macro, which you can apply to another dataset When you save a workflow, all the analysis steps and their parameters are saved as a script file, which you can share with other users

28 Saving and using workflows Select the starting point for your workflow Select Workflow/ Save starting from selected Save the workflow file on your computer with a meaningful name Don t change the ending (.bsh) To run a workflow, select Workflow->Open and run Workflow->Run recent (if you saved the workflow recently).
29 Problems? Send us a support request -request includes the error message and link to analysis session (optional)
30 Data visualizations
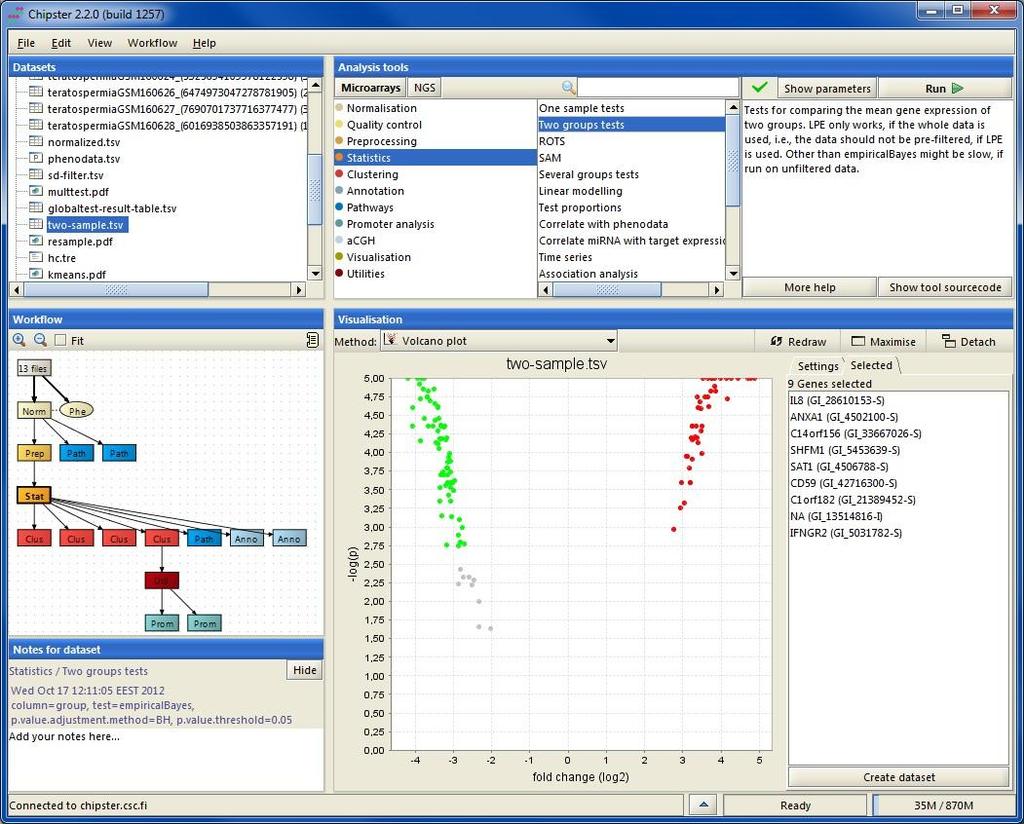
31 Visualizing the data Data visualization panel Maximize and redraw for better viewing Detach = open in a separate window, allows you to view several images at the same time Two types of visualizations 1. Interactive visualizations produced by the client program Select the visualization method from the pulldown menu Save by right clicking on the image 2. Static images produced by analysis tools Select from Analysis tools/ Visualisation View by double clicking on the image file Save by right clicking on the file name and choosing Export
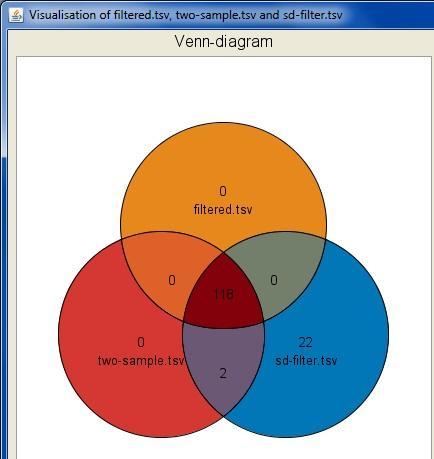
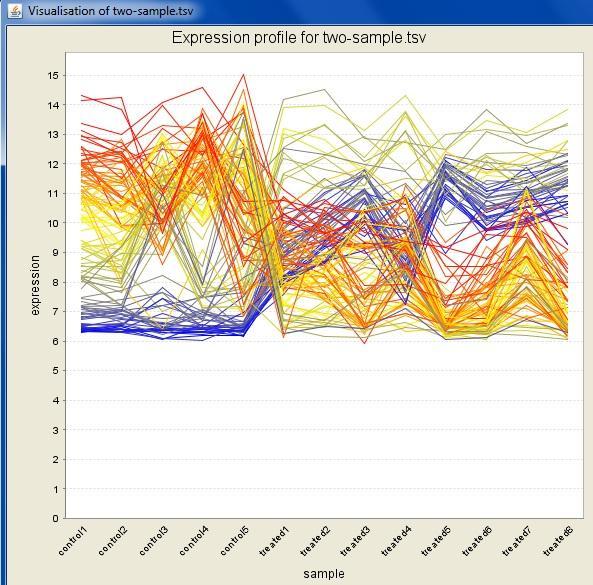
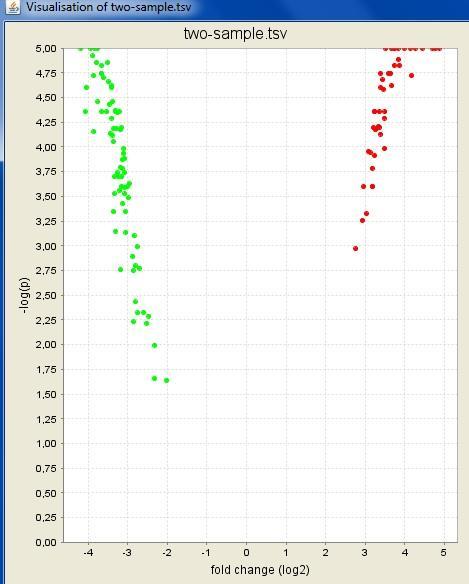
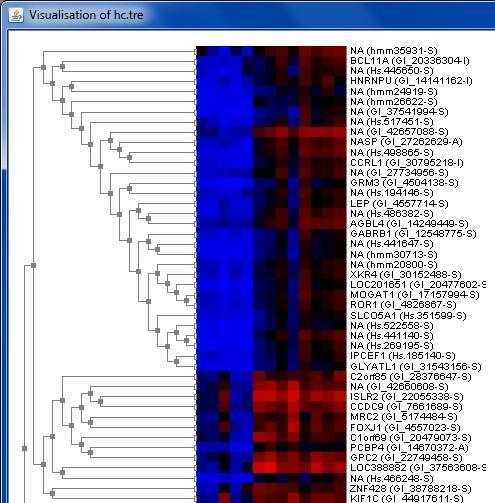
32 Interactive visualizations by the client Spreadsheet Histogram Venn diagram Scatterplot 3D scatterplot Volcano plot Expression profiles Clustered profiles Hierarchical clustering SOM clustering Genome browser Available actions: Select genes and create a gene list Change titles, colors etc Zoom in/out
33
34
35 Static images produced by R/Bioconductor Dispersion plot MA plot MDS plot Box plot Histogram Heatmap Idiogram Chromosomal position Correlogram Dendrogram K-means clustering SOM-clustering etc
36 Introduction to RNA-seq
37 What can I investigate with RNA-seq? Differential expression Isoform switching New genes and isoforms New transcriptomes Etc etc

38 Is RNA-seq better than microarrays? + Wider detection range + Can detect new genes and isoforms - Data analysis is not as established as for microarrays - Data is voluminous
39 Typical steps in RNA-seq
40 RNA-seq data analysis: typical steps Align reads to reference genome Match alignment positions with known gene positions Gene A Gene B Count how many reads each gene has A = 6 B = 11
41 RNA-seq data analysis: file formats Fastq (raw reads) BAM (aligned reads) Fasta (ref. genome) Gene A Gene B GTF (ref. annotation) A = 6 B = 11 tsv (count table)
42
43 RNA-seq data analysis workflow
44 RNA-seq data analysis workflow reads reference Align reads to reference (TopHat, STAR) Quality control, preprocessing (FastQC, PRINSEQ, Trimmomatic) De novo assembly (Trinity, Velvet+Oases) Reference based assembly to detect new transcripts and isoforms (Cufflinks) Align reads to transcripts (Bowtie) Annotation (Blast2GO) Quantitation (HTSeq, express, etc) Differential expression analysis (edger, DESeq, Cuffdiff)
45 RNA-seq data analysis workflow today reads reference Align reads to reference (TopHat, STAR) Quality control, preprocessing (FastQC, PRINSEQ, Trimmomatic) De novo assembly (Trinity, Velvet+Oases) Reference based assembly to detect new transcripts and isoforms (Cufflinks) Align reads to transcripts (Bowtie) Annotation (Blast2GO) Quantitation (HTSeq, express, etc) Differential expression analysis (edger, DESeq, Cuffdiff)
46 Things to take into account Non-uniform coverage along transcripts Biases introduced in library construction and sequencing polya capture and polyt priming can cause 3 bias random primers can cause sequence-specific bias GC-rich and GC-poor regions can be under-sampled Genomic regions have different mappabilities (uniqueness) Longer transcripts give more counts RNA composition effect due to sampling:
47 Quality control of raw reads
48 What and why? Potential problems low confidence bases, Ns sequence specific bias, GC bias adapters sequence contamination Knowing about potential problems in your data allows you to correct for them before you spend a lot of time on analysis take them into account when interpreting results
49 Software packages for quality control FastQC FastX PRINSEQ TagCleaner...
50 Raw reads: FASTQ file format Four lines per read: Line 1 begins with a '@' character and is followed by a sequence identifier. Line 2 is the sequence. Line 3 begins with a '+' character and can be followed by the sequence identifier. Line 4 encodes the quality values for the sequence, encoded with a single ASCII character for brevity. name GATTTGGGGTTCAAAGCAGTATCGATCAAATAGTAAATCCATTTGTTCAACTCACAGTTT + read name!''*((((***+))%%%++)(%%%%).1***-+*''))**55ccf>>>>>>ccccccc65
51 Base qualities If the quality of a base is 30, the probability that it is wrong is Phred quality score Q = -10 * log 10 (probability that the base is wrong) T C A G T A C T C G Encoded as ASCII characters so that 33 is added to the Phred score This Sanger encoding is used by Illumina 1.8+, 454 and SOLiD Note that older Illumina data uses different encoding Illumina1.3: add 64 to Phred Illumina : add 64 to Phred, ASCII 66 B means that the whole read segment has low quality

52 Base quality encoding systems
 good")
53 Per position base quality (FastQC) good ok bad

54 Per position base quality (FastQC)

55 Per position sequence content (FastQC)

56 Per position sequence content (FastQC) Sequence specific bias: Correct sequence but biased location, typical for Illumina RNA-seq data
57 Preprocessing: Filtering and trimming low quality reads
58 Filtering vs trimming Filtering removes the entire read Trimming removes only the bad quality bases It can remove the entire read, if all bases are bad Trimming makes reads shorter This might not be optimal for some applications Paired end data: the matching order of the reads in the two files has to be preserved If a read is removed, its pair has to removed as well


59 What base quality threshold should be used? No consensus yet Trade-off between having good quality reads and having enough sequence
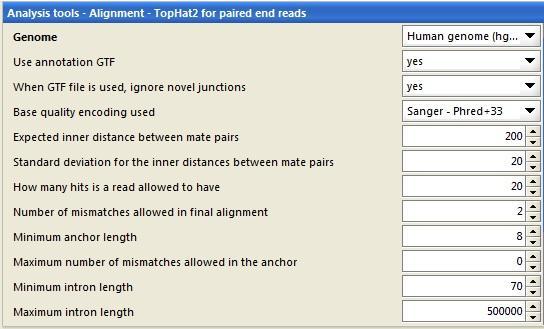
60 Software packages for preprocessing FastX PRINSEQ TagCleaner Trimmomatic Cutadapt TrimGalore!...
61 PRINSEQ filtering possibilities in Chipster Base quality scores Minimum quality score per base Mean read quality Ambiguous bases Maximum count/ percentage of Ns that a read is allowed to have Low complexity DUST (score > 7), entropy (score < 70) Length Minimum length of a read Duplicates Exact, reverse complement, or 5 /3 duplicates Copes with paired end data
62 PRINSEQ trimming possibilities in Chipster Trim based on quality scores Minimum quality, look one base at a time Minimum (mean) quality in a sliding window From 3 or 5 end Trim x bases from left/ right Trim to length x Trim polya/t tails Minimum number of A/Ts From left or right Copes with paired end data
63 Data set for exercises 1-11 We want to find genes which are differentially expressed between two human cell lines, h1-hesc and GM12878 Illumina data from the ENCODE project 75 b single-end reads For the interest of time, only a small subset of reads is used No replicates (Note: you should always have at least 3 replicates!)
64 Aligning reads to genome/transcriptome
65 Alignment to reference genome/transcriptome Goal is to find out where a read originated from Challenge: variants, sequencing errors, repetitive sequence Mapping to transcriptome allows you to count hits to known transcripts genome allows you to find new genes and transcripts Many organisms have introns, so RNA-seq reads map to genome non-contiguously spliced alignments needed Difficult because sequence signals at splice sites are limited and introns can be thousands of bases long

66 Tens of aligners are available

67 Splice-aware aligners TopHat (uses Bowtie) STAR GSNAP RUM MapSplice... Nature methods 2013 (10:1185)
68 Mapping quality Confidence in read s point of origin Depends on many things, including uniqueness of the aligned region in the genome length of alignment number of mismatches and gaps Expressed in Phred scores, like base qualities Q = -10 * log 10 (probability that mapping location is wrong)
69 Bowtie2 Fast and memory efficient aligner Can make gapped alignments (= can handle indels) Cannot make spliced alignments, but is used by TopHat2 which can Two alignment modes: End-to-end Local Read is aligned over its entire length Maximum alignment score = 0, deduct penalty for each mismatch (less for low quality base), N, gap opening and gap extension Read ends don t need to align, if this maximizes the alignment score Add bonus to alignment score for each match Reference (genome) is indexed to speed up the alignment process
 is available, builds a virtual transcriptome and aligns reads to that first Kim et al, Genome")
70 TopHat2 Relatively fast and memory efficient spliced aligner Performs several alignment steps Uses Bowtie2 end-to-end mode for aligning Low tolerance for mismatches If annotation (GTF file) is available, builds a virtual transcriptome and aligns reads to that first Kim et al, Genome Biology 2013

71 TopHat2 spliced alignment steps Kim et al, Genome Biology 2013
72
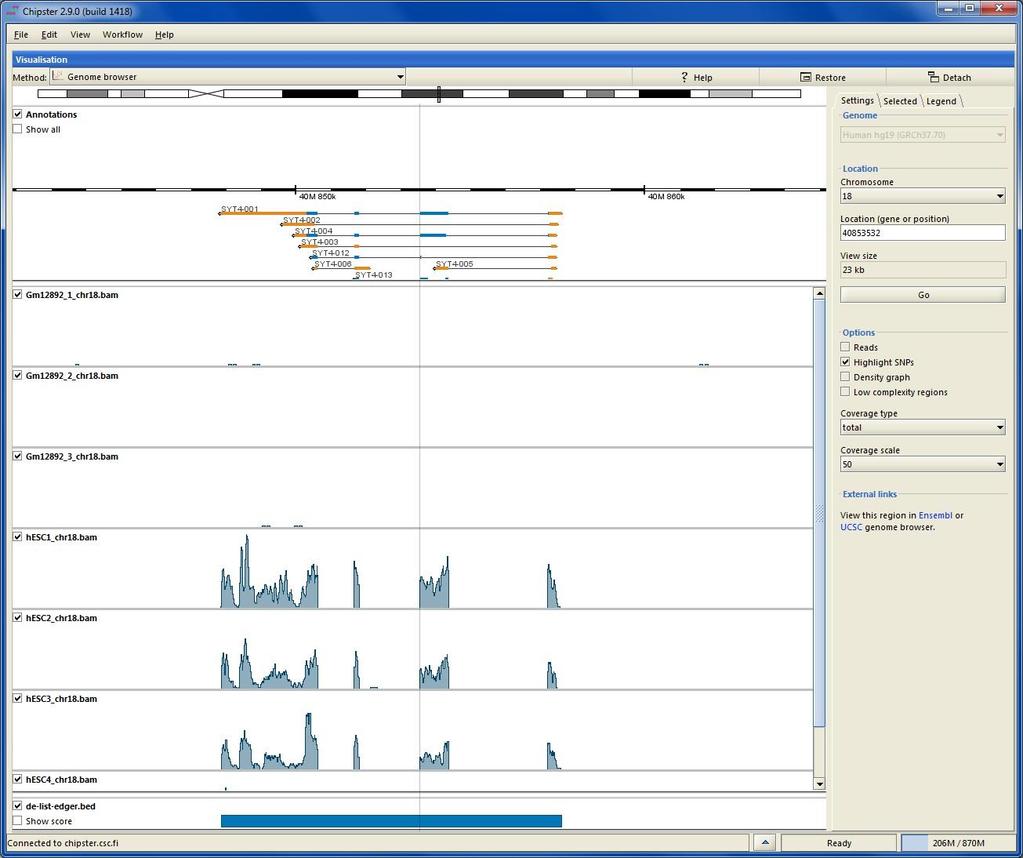
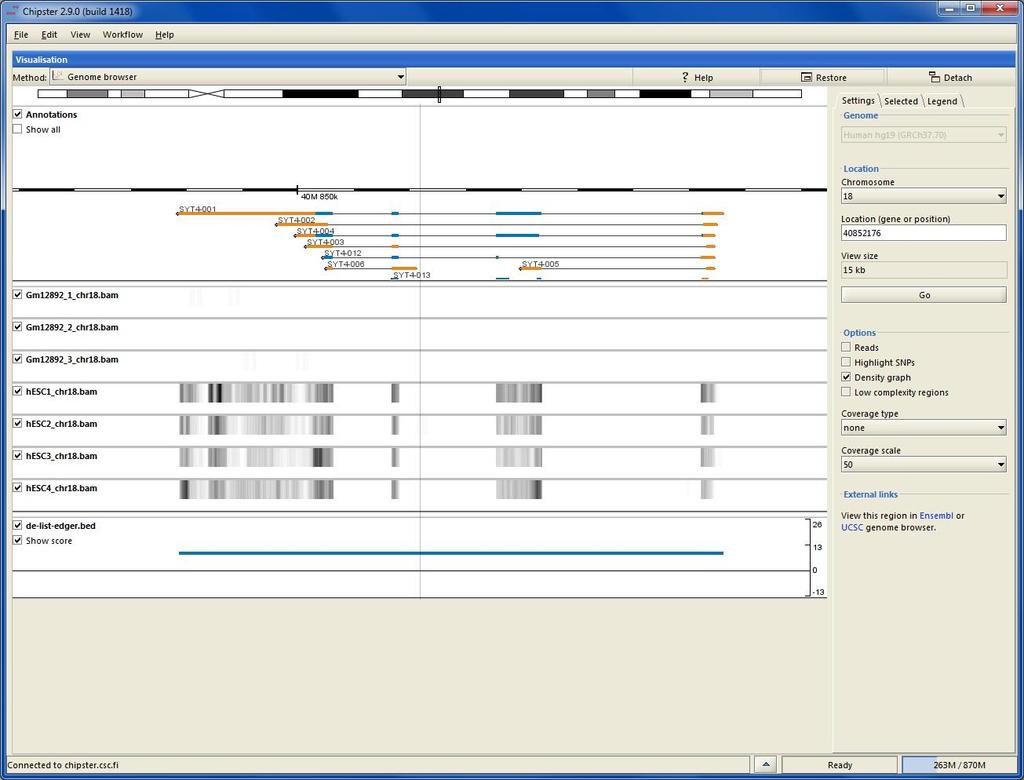
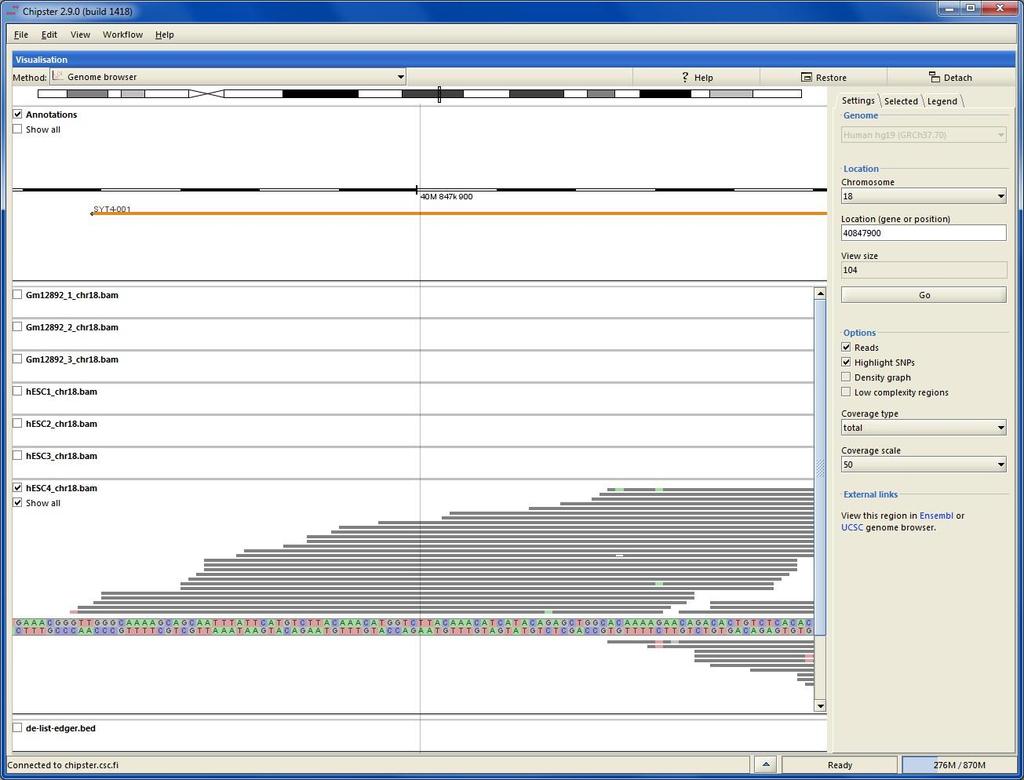
73 File format for aligned reads: BAM/SAM SAM (Sequence Alignment/Map) is a tab-delimited text file. BAM is a binary form of SAM. Optional header (lines starting One line for each alignment, with 11 mandatory fields: read name, flag, reference name, position, mapping quality, CIGAR, mate name, mate position, fragment length, sequence, base qualities CIGAR reports match (M), insertion (I), deletion (D), intron (N), etc VN:1.3 SN:ref LN:45 r ref M2I4M1D3M = TTAGATAAAGGATACTG * The corresponding alignment Ref AGCATGTTAGATAA**GATAGCTGTGCTAGTAGGCAGTCAGCGCCAT r001 TTAGATAAAGGATA*CTG
74
75 BAM file (.bam) and index file (.bai) BAM files can be sorted by chromosomal coordinates and indexed for efficient retrieval of reads for a given region. The index file must have a matching name. (e.g. reads.bam and reads.bam.bai) Genome browser requires both BAM and the index file. The alignment tools in Chipster automatically produce sorted and indexed BAMs. When you import BAM files, Chipster asks if you would like to preproces them (convert SAM to BAM, sort and index BAM).
76 Manipulating BAM files (SAMtools, Picard) Convert SAM to BAM, sort and index BAM Preprocessing when importing SAM/BAM, runs on your computer. The tool available in the Utilities category runs on the server. Index BAM Statistics for BAM How many reads align to the different chromosomes. Count alignments in BAM How many alignments does the BAM contain. Includes an optional mapping quality filter. Retrieve alignments for a given chromosome/region Makes a subset of BAM, e.g. chr1: , inc quality filter. Create consensus sequence from BAM

77 Region file formats: BED 5 obligatory columns: chr, start, end, name, score 0-based, like BAM

78 Region file formats: GFF/GTF 9 obligatory columns: chr, source, name, start, end, score, strand, frame, attribute 1-based
79 Quality control of aligned reads
80 Quality metrics for aligned reads How many reads mapped to the reference? How many of them mapped uniquely? How many pairs mapped? How many mapped concordantly? Mapping quality distribution? Saturation of sequencing depth Would more sequencing detect more genes and splice junctions? Read distribution between different genomic features Exonic, intronic, intergenic regions Coding, 3 and 5 UTR exons Protein coding genes, pseudogenes, rrna, mirna, etc Coverage uniformity along transcripts
 RNA-seqQC Qualimap Picards s")
81 Quality control programs for aligned reads RseQC (available in Chipster) RNA-seqQC Qualimap Picards s CollectRnaSeqMetrics
82 Visualization of reads and results in genomic context
83 Software packages for visualization Chipster genome browser IGV UCSC genome browser... Differences in memory consumption, interactivity, annotations, navigation,...
84 Chipster Genome Browser Integrated with Chipster analysis environment Automatic sorting and indexing of BAM, BED and GTF files Automatic coverage calculation (total and strand-specific) Zoom in to nucleotide level Highlight variants Jump to locations using BED, GTF and tsv files View details of selected BED and GTF features Several views (reads, coverage profile, density graph)
85
86
87
88 Quantitation
89 Software for counting aligned reads per genomic features (genes/exons/transcripts) HTSeq Cufflinks BEDTools Qualimap express...
90 HTSeq count Given a BAM file and a list of genomic features (e.g. genes), counts how many reads map to each feature. For RNA-seq the features are typically genes, where each gene is considered as the union of all its exons. Also exons can be considered as features, e.g., in order to check for alternative splicing. Features need to be supplied in GTF file Note that GTF and BAM must use the same chromosome naming 3 modes to handle reads which overlap several genes Union (default) Intersection-strict Intersection-nonempty

91 HTSeq count modes
92 Differential expression analysis
93 Things to take into account Biological replicates are important! Normalization is required in order to compare expression between samples Different library sizes RNA composition bias caused by sampling approach Model has to account for overdispersion in biological replicates negative binomial distribution Raw counts are needed to assess measurement precision Counts are the the units of evidence for expression Multiple testing problem
94
95 Software packages for DE analysis edger DESeq DEXSeq Cuffdiff Ballgown SAMseq NOIseq Limma + voom, limma + vst...
96
97 Comments from comparisons Methods based on negative binomial modeling have improved specificity and sensitivities as well as good control of false positive errors Cuffdiff performance has reduced sensitivity and specificity. We postulate that the source of this is related to the normalization procedure that attempts to account for both alternative isoform expression and length of transcripts
98 Differential gene expression analysis Normalization Dispersion estimation Log fold change estimation Statistical testing Filtering Multiple testing correction
99 Differential expression analysis: Normalization
100 Normalization For comparing gene expression between genes within a sample, normalize for Gene length Gene GC content For comparing gene expression between samples, normalize for Library size (number of reads obtained) RNA composition effect
 are able to maintain a reasonable false positive rate without any loss of")
101 FPKM and TC are ineffective and should be definitely abandoned in the context of differential analysis In the presence of high count genes, only DESeq and TMM (edger) are able to maintain a reasonable false positive rate without any loss of power
102 RPKM and FPKM Reads (or fragments) per kilobase per million mapped reads. 20 kb transcript has 400 counts, library size is 20 million reads RPKM = (400/20) / 20 = kb transcript has 10 counts, library size is 20 million reads RPKM = (10/0.5) / 20 = 1 Normalizes for gene length and library size Can be used only for reporting expression values, not for testing differential expression Raw counts are needed to assess the measurement precision correctly
103 Normalization by edger and DESeq Aim to make normalized counts for non-differentially expressed genes similar between samples Do not aim to adjust count distributions between samples Assume that Most genes are not differentially expressed Differentially expressed genes are divided equally between up- and down-regulation Do not transform data, but use normalization factors within statistical testing
104 Normalization by edger and DESeq how? DESeq(2) Take geometric mean of gene s counts across all samples Divide gene s counts in a sample by the geometric mean Take median of these ratios sample s normalization factor (applied to read counts) edger Select as reference the sample whose upper quartile is closest to the mean upper quartile Log ratio of gene s counts in sample vs reference M value Take weighted trimmed mean of M-values (TMM) normalization factor (applied to library sizes) Trim: Exclude genes with high counts or large differences in expression Weights are from the delta method on binomial data
105 Estimating gene expression at gene level - the isoform switching problem Trapnell et al. Nature Biotechnology 2013
106 Differential expression analysis: Dispersion estimation
107 Dispersion When comparing gene s expression levels between groups, it is important to know also its within-group variability Dispersion = (BCV) 2 BCV = gene s biological coefficient of variation E.g. if gene s expression typically differs from replicate to replicate by 20% (so BCV = 0.2), then this gene s dispersion is = 0.04 Note that the variance seen in counts is a sum of 2 things: Sample-to-sample variation (dispersion) Uncertainty in measuring expression by counting reads
108 How to estimate dispersion reliably? RNA-seq experiments typically have only a few replicates it is difficult to estimate within-group variance reliably Solution: pool information across genes which are expressed at similar level Different approaches edger DESeq DESeq2
109 Dispersion estimation by edger Estimates common dispersion for all genes using a conditional maximum likelyhood approach Trended dispersion: takes binned common dispersion and abundance, and fits a curve though these binned values Tagwise dispersion: uses empirical Bayes strategy to shrink gene-wise dispersions towards the common/trended one using a weighted likelyhood approach genes that are consistent between replicates are ranked more highly
110 Dispersion estimation by DESeq Models the observed mean-variance relationship for the genes using either parametric or local regression User can choose to use the fitted values always, or only when they are higher than the genewise value
111 Dispersion estimation by DESeq2 Estimates genewise dispersions using maximum likelyhood Fits a curve to capture the dependence of these estimates on the average expression strength Uses ebayes approach to shrink genewise values towards the curve. Shrinkage depends on sample size Outliers are not shrunk
112 Differential expression analysis: Statistical testing
113 Statistical testing DESeq and edger Two group comparisons Exact test for negative binomial distribution. Multifactor experiments DESeq2 Generalized linear model (GLM) likelyhood ratio test. GLM is an extension of linear models to non-normally distributed response data. Shrinks log fold change estimates toward zero using an ebayes method Shrinkage is stronger when counts are low, dispersion is high, or there are only a few samples GLM based Wald test for significance Shrunken estimate of log fold change is divided by its standard error and the resulting z statistic is compared to a standard normal distribution
114 Filtering Filter out genes which have little chance of showing evidence for significant differential expression genes which are not expressed genes which are expressed at very low level (low counts are unreliable) Reduces the severity of multiple testing adjustment Should be independent do not use information on what group the sample belongs to DESeq2 selects filtering threshold automatically

115 edger result table logfc = log2 fold change logcpm = the average log2 counts per million Pvalue = the raw p-value FDR = false discovery rate (Benjamini-Hochberg adjustment for multiple testing)

116 DESeq result table basemean = mean of the counts divided by the size factors for both conditions basemeana = mean of the counts divided by the size factors for condition A basemeanb= mean of the counts divided by the size factors for condition B fold change = the ratio meanb/meana log2foldchange = log2 of the fold change pval = the raw p-value padj = Benjamini-Hochberg adjusted p-value
 lfcse = standard error of log2 fold change stat = Wald statistic pvalue = raw p-value padj = Benjamini-Hochberg adjusted")
117 DESeq2 result table basemean = mean of counts (divided by size factors) taken over all samples log2foldchange = log2 fold change (FC = ratio meanb/meana) lfcse = standard error of log2 fold change stat = Wald statistic pvalue = raw p-value padj = Benjamini-Hochberg adjusted p-value
118 Data exploration using MDS plot edger outputs multidimensional scaling (MDS) plot which shows the relative similarities between samples Allows you to see if replicates are consistent and if you can expect to find differentially expressed genes Distances correspond to the logfc or biological coefficient of variation (BCV) between each pair of samples Calculated using 500 most heterogenous genes (that have largest tagwise dispersion treating all libraries as one group)
119 MDS plot by edger
120 Data set for exercises Drosophila data from RNAi knock-down of pasilla gene 4 untreated samples 2 sequenced single end 2 sequenced paired end 3 samples treated with RNAi 1 sequenced single end 2 sequenced paired end
RNA-seq data analysis with Chipster. Eija Korpelainen CSC IT Center for Science, Finland
 RNA-seq data analysis with Chipster Eija Korpelainen CSC IT Center for Science, Finland chipster@csc.fi What will I learn? How to operate the Chipster software Short introduction to RNA-seq Analyzing RNA-seq
RNA-seq data analysis. Eija Korpelainen, Maria Lehtivaara CSC IT Center for Science, Finland
 RNA-seq data analysis Eija Korpelainen, Maria Lehtivaara CSC IT Center for Science, Finland chipster@csc.fi Understanding data analysis - why? Bioinformaticians might not always be available when needed
ChIP-seq data analysis with Chipster. Eija Korpelainen CSC IT Center for Science, Finland
 ChIP-seq data analysis with Chipster Eija Korpelainen CSC IT Center for Science, Finland chipster@csc.fi What will I learn? Short introduction to ChIP-seq Analyzing ChIP-seq data Central concepts Analysis
RNA-Seq Analysis. Simon Andrews, Laura v
 RNA-Seq Analysis Simon Andrews, Laura Biggins simon.andrews@babraham.ac.uk @simon_andrews v2018-10 RNA-Seq Libraries rrna depleted mrna Fragment u u u u NNNN Random prime + RT 2 nd strand synthesis (+
Transcriptome analysis
 Statistical Bioinformatics: Transcriptome analysis Stefan Seemann seemann@rth.dk University of Copenhagen April 11th 2018 Outline: a) How to assess the quality of sequencing reads? b) How to normalize
Applications of short-read
 Applications of short-read sequencing: RNA-Seq and ChIP-Seq BaRC Hot Topics March 2013 George Bell, Ph.D. http://jura.wi.mit.edu/bio/education/hot_topics/ Sequencing applications RNA-Seq includes experiments
Sequencing applications. Today's outline. Hands-on exercises. Applications of short-read sequencing: RNA-Seq and ChIP-Seq
 Sequencing applications Applications of short-read sequencing: RNA-Seq and ChIP-Seq BaRC Hot Topics March 2013 George Bell, Ph.D. http://jura.wi.mit.edu/bio/education/hot_topics/ RNA-Seq includes experiments
Sequence Analysis 2RNA-Seq
 Sequence Analysis 2RNA-Seq Lecture 10 2/21/2018 Instructor : Kritika Karri kkarri@bu.edu Transcriptome Entire set of RNA transcripts in a given cell for a specific developmental stage or physiological
Introduction of RNA-Seq Analysis
 Introduction of RNA-Seq Analysis Jiang Li, MS Bioinformatics System Engineer I Center for Quantitative Sciences(CQS) Vanderbilt University September 21, 2012 Goal of this talk 1. Act as a practical resource
Experimental Design. Sequencing. Data Quality Control. Read mapping. Differential Expression analysis
 -Seq Analysis Quality Control checks Reproducibility Reliability -seq vs Microarray Higher sensitivity and dynamic range Lower technical variation Available for all species Novel transcript identification
Analysis of RNA-seq Data. Feb 8, 2017 Peikai CHEN (PHD)
") Analysis of RNA-seq Data Feb 8, 2017 Peikai CHEN (PHD) Outline What is RNA-seq? What can RNA-seq do? How is RNA-seq measured? How to process RNA-seq data: the basics How to visualize and diagnose your
Analysis of RNA-seq Data Feb 8, 2017 Peikai CHEN (PHD) Outline What is RNA-seq? What can RNA-seq do? How is RNA-seq measured? How to process RNA-seq data: the basics How to visualize and diagnose your
Transcriptomics analysis with RNA seq: an overview Frederik Coppens
 Transcriptomics analysis with RNA seq: an overview Frederik Coppens Platforms Applications Analysis Quantification RNA content Platforms Platforms Short (few hundred bases) Long reads (multiple kilobases)
Introduction to RNA sequencing
 Introduction to RNA sequencing Bioinformatics perspective Olga Dethlefsen NBIS, National Bioinformatics Infrastructure Sweden November 2017 Olga (NBIS) RNA-seq November 2017 1 / 49 Outline Why sequence
RNAseq Applications in Genome Studies. Alexander Kanapin, PhD Wellcome Trust Centre for Human Genetics, University of Oxford
 RNAseq Applications in Genome Studies Alexander Kanapin, PhD Wellcome Trust Centre for Human Genetics, University of Oxford RNAseq Protocols Next generation sequencing protocol cdna, not RNA sequencing
Sanger vs Next-Gen Sequencing
 Tools and Algorithms in Bioinformatics GCBA815/MCGB815/BMI815, Fall 2017 Week-8: Next-Gen Sequencing RNA-seq Data Analysis Babu Guda, Ph.D. Professor, Genetics, Cell Biology & Anatomy Director, Bioinformatics
ChIP-seq and RNA-seq. Farhat Habib
 ChIP-seq and RNA-seq Farhat Habib fhabib@iiserpune.ac.in Biological Goals Learn how genomes encode the diverse patterns of gene expression that define each cell type and state. Protein-DNA interactions
RNA-sequencing. Next Generation sequencing analysis Anne-Mette Bjerregaard. Center for biological sequence analysis (CBS)
") RNA-sequencing Next Generation sequencing analysis 2016 Anne-Mette Bjerregaard Center for biological sequence analysis (CBS) Terms and definitions TRANSCRIPTOME The full set of RNA transcripts and their
RNA-sequencing Next Generation sequencing analysis 2016 Anne-Mette Bjerregaard Center for biological sequence analysis (CBS) Terms and definitions TRANSCRIPTOME The full set of RNA transcripts and their
Analysis of RNA-seq Data. Bernard Pereira
 Analysis of RNA-seq Data Bernard Pereira The many faces of RNA-seq Applications Discovery Find new transcripts Find transcript boundaries Find splice junctions Comparison Given samples from different experimental
Introduction to RNAseq Analysis. Milena Kraus Apr 18, 2016
 Introduction to RNAseq Analysis Milena Kraus Apr 18, 2016 Agenda What is RNA sequencing used for? 1. Biological background 2. From wet lab sample to transcriptome a. Experimental procedure b. Raw data
RNA-Seq Module 2 From QC to differential gene expression.
 RNA-Seq Module 2 From QC to differential gene expression. Ying Zhang Ph.D, Informatics Analyst Research Informatics Support System (RISS) MSI Apr. 24, 2012 RNA-Seq Tutorials Tutorial 1: Introductory (Mar.
C3BI. VARIANTS CALLING November Pierre Lechat Stéphane Descorps-Declère
 C3BI VARIANTS CALLING November 2016 Pierre Lechat Stéphane Descorps-Declère General Workflow (GATK) software websites software bwa picard samtools GATK IGV tablet vcftools website http://bio-bwa.sourceforge.net/
How to deal with your RNA-seq data?
 How to deal with your RNA-seq data? Rachel Legendre, Thibault Dayris, Adrien Pain, Claire Toffano-Nioche, Hugo Varet École de bioinformatique AVIESAN-IFB 2017 1 Rachel Legendre Bioinformatics 27/11/2018
RNA-Seq analysis using R: Differential expression and transcriptome assembly
 RNA-Seq analysis using R: Differential expression and transcriptome assembly Beibei Chen Ph.D BICF 12/7/2016 Agenda Brief about RNA-seq and experiment design Gene oriented analysis Gene quantification
RNA-Seq de novo assembly training
 RNA-Seq de novo assembly training Training session aims Give you some keys elements to look at during read quality check. Transcriptome assembly is not completely a strait forward process : Multiple strategies
Galaxy for Next Generation Sequencing 初探次世代序列分析平台 蘇聖堯 2013/9/12
 Galaxy for Next Generation Sequencing 初探次世代序列分析平台 蘇聖堯 2013/9/12 What s Galaxy? Bringing Developers And Biologists Together. Reproducible Science Is Our Goal An open, web-based platform for data intensive
Quantifying gene expression
 Quantifying gene expression Genome GTF (annotation)? Sequence reads FASTQ FASTQ (+reference transcriptome index) Quality control FASTQ Alignment to Genome: HISAT2, STAR (+reference genome index) (known
VM origin. Okeanos: Image Trinity_U16 (upgrade to Ubuntu16.04, thanks to Alexandros Dimopoulos) X2go: LXDE
 X2go: LXDE") VM origin Okeanos: Image Trinity_U16 (upgrade to Ubuntu16.04, thanks to Alexandros Dimopoulos) X2go: LXDE NGS intro + Genome-Based Transcript Reconstruction and Analysis Using RNA-Seq Data Based on material
VM origin Okeanos: Image Trinity_U16 (upgrade to Ubuntu16.04, thanks to Alexandros Dimopoulos) X2go: LXDE NGS intro + Genome-Based Transcript Reconstruction and Analysis Using RNA-Seq Data Based on material
Mapping Next Generation Sequence Reads. Bingbing Yuan Dec. 2, 2010
 Mapping Next Generation Sequence Reads Bingbing Yuan Dec. 2, 2010 1 What happen if reads are not mapped properly? Some data won t be used, thus fewer reads would be aligned. Reads are mapped to the wrong
ChIP-seq and RNA-seq
 ChIP-seq and RNA-seq Biological Goals Learn how genomes encode the diverse patterns of gene expression that define each cell type and state. Protein-DNA interactions (ChIPchromatin immunoprecipitation)
1. Introduction Gene regulation Genomics and genome analyses
 1. Introduction Gene regulation Genomics and genome analyses 2. Gene regulation tools and methods Regulatory sequences and motif discovery TF binding sites Databases 3. Technologies Microarrays Deep sequencing
BST 226 Statistical Methods for Bioinformatics David M. Rocke. March 10, 2014 BST 226 Statistical Methods for Bioinformatics 1
 BST 226 Statistical Methods for Bioinformatics David M. Rocke March 10, 2014 BST 226 Statistical Methods for Bioinformatics 1 NGS Technologies Illumina Sequencing HiSeq 2500 & MiSeq PacBio Sequencing PacBio
RNA-seq Data Analysis
 Lecture 3. Clustering; Function/Pathway Enrichment analysis RNA-seq Data Analysis Qi Sun Bioinformatics Facility Biotechnology Resource Center Cornell University Lecture 1. Map RNA-seq read to genome Lecture
RNA
 RNA sequencing Michael Inouye Baker Heart and Diabetes Institute Univ of Melbourne / Monash Univ Summer Institute in Statistical Genetics 2017 Integrative Genomics Module Seattle @minouye271 www.inouyelab.org
Introduction to RNA-Seq. David Wood Winter School in Mathematics and Computational Biology July 1, 2013
 Introduction to RNA-Seq David Wood Winter School in Mathematics and Computational Biology July 1, 2013 Abundance RNA is... Diverse Dynamic Central DNA rrna Epigenetics trna RNA mrna Time Protein Abundance
Expression data analysis with Chipster. Eija Korpelainen, Massimiliano Gentile
 Expression data analysis with Chipster Eija Korpelainen, Massimiliano Gentile chipster@csc.fi Understanding data analysis - why? Bioinformaticians might not always be available when needed Biologists know
10/06/2014. RNA-Seq analysis. With reference assembly. Cormier Alexandre, PhD student UMR8227, Algal Genetics Group
 RNA-Seq analysis With reference assembly Cormier Alexandre, PhD student UMR8227, Algal Genetics Group Summary 2 Typical RNA-seq workflow Introduction Reference genome Reference transcriptome Reference
Introduction to transcriptome analysis using High Throughput Sequencing technologies. D. Puthier 2012
 Introduction to transcriptome analysis using High Throughput Sequencing technologies D. Puthier 2012 A typical RNA-Seq experiment Library construction Protocol variations Fragmentation methods RNA: nebulization,
Gene Expression analysis with RNA-Seq data
 Gene Expression analysis with RNA-Seq data C3BI Hands-on NGS course November 24th 2016 Frédéric Lemoine Plan 1. 2. Quality Control 3. Read Mapping 4. Gene Expression Analysis 5. Splicing/Transcript Analysis
Differential gene expression analysis using RNA-seq
 https://abc.med.cornell.edu/ Differential gene expression analysis using RNA-seq Applied Bioinformatics Core, August 2017 Friederike Dündar with Luce Skrabanek & Ceyda Durmaz Day 3 QC of aligned reads
Francisco García Quality Control for NGS Raw Data
 Contents Data formats Sequence capture Fasta and fastq formats Sequence quality encoding Quality Control Evaluation of sequence quality Quality control tools Identification of artifacts & filtering Practical
Introduction to NGS analyses
 Introduction to NGS analyses Giorgio L Papadopoulos Institute of Molecular Biology and Biotechnology Bioinformatics Support Group 04/12/2015 Papadopoulos GL (IMBB, FORTH) IMBB NGS Seminar 04/12/2015 1
Eucalyptus gene assembly
 Eucalyptus gene assembly ACGT Plant Biotechnology meeting Charles Hefer Bioinformatics and Computational Biology Unit University of Pretoria October 2011 About Eucalyptus Most valuable and widely planted
The first thing you will see is the opening page. SeqMonk scans your copy and make sure everything is in order, indicated by the green check marks.
 Open Seqmonk Launch SeqMonk The first thing you will see is the opening page. SeqMonk scans your copy and make sure everything is in order, indicated by the green check marks. SeqMonk Analysis Page 1 Create
NGS part 2: applications. Tobias Österlund
 NGS part 2: applications Tobias Österlund tobiaso@chalmers.se NGS part of the course Week 4 Friday 13/2 15.15-17.00 NGS lecture 1: Introduction to NGS, alignment, assembly Week 6 Thursday 26/2 08.00-09.45
Next Generation Sequencing
 Next Generation Sequencing Complete Report Catalogue # and Service: IR16001 rrna depletion (human, mouse, or rat) IR11081 Total RNA Sequencing (80 million reads, 2x75 bp PE) Xxxxxxx - xxxxxxxxxxxxxxxxxxxxxx
Bioinformatics in next generation sequencing projects
 Bioinformatics in next generation sequencing projects Rickard Sandberg Assistant Professor Department of Cell and Molecular Biology Karolinska Institutet May 2013 Standard sequence library generation Illumina
RNA-Seq. Joshua Ainsley, PhD Postdoctoral Researcher Lab of Leon Reijmers Neuroscience Department Tufts University
 RNA-Seq Joshua Ainsley, PhD Postdoctoral Researcher Lab of Leon Reijmers Neuroscience Department Tufts University joshua.ainsley@tufts.edu Day five Alternative splicing Assembly RNA edits Alternative splicing
Galaxy Platform For NGS Data Analyses
 Galaxy Platform For NGS Data Analyses Weihong Yan wyan@chem.ucla.edu Collaboratory Web Site http://qcb.ucla.edu/collaboratory http://collaboratory.lifesci.ucla.edu Workshop Outline ü Day 1 UCLA galaxy
NGS Data Analysis and Galaxy
 NGS Data Analysis and Galaxy University of Pretoria Pretoria, South Africa 14-18 October 2013 Dave Clements, Emory University http://galaxyproject.org/ Fourie Joubert, Burger van Jaarsveld Bioinformatics
Introduction to RNA-Seq in GeneSpring NGS Software
 Introduction to RNA-Seq in GeneSpring NGS Software Dipa Roy Choudhury, Ph.D. Strand Scientific Intelligence and Agilent Technologies Learn more at www.genespring.com Introduction to RNA-Seq In a few years,
Analysis of data from high-throughput molecular biology experiments Lecture 6 (F6, RNA-seq ),
,") Analysis of data from high-throughput molecular biology experiments Lecture 6 (F6, RNA-seq ), 2012-01-26 What is a gene What is a transcriptome History of gene expression assessment RNA-seq RNA-seq analysis
Analysis of data from high-throughput molecular biology experiments Lecture 6 (F6, RNA-seq ), 2012-01-26 What is a gene What is a transcriptome History of gene expression assessment RNA-seq RNA-seq analysis
RNA-Seq Workshop AChemS Sunil K Sukumaran Monell Chemical Senses Center Philadelphia
 RNA-Seq Workshop AChemS 2017 Sunil K Sukumaran Monell Chemical Senses Center Philadelphia Benefits & downsides of RNA-Seq Benefits: High resolution, sensitivity and large dynamic range Independent of prior
RNA-Seq with the Tuxedo Suite
 RNA-Seq with the Tuxedo Suite Monica Britton, Ph.D. Sr. Bioinformatics Analyst September 2015 Workshop The Basic Tuxedo Suite References Trapnell C, et al. 2009 TopHat: discovering splice junctions with
measuring gene expression December 5, 2017
 measuring gene expression December 5, 2017 transcription a usually short-lived RNA copy of the DNA is created through transcription RNA is exported to the cytoplasm to encode proteins some types of RNA
Statistical Genomics and Bioinformatics Workshop. Genetic Association and RNA-Seq Studies
 Statistical Genomics and Bioinformatics Workshop: Genetic Association and RNA-Seq Studies RNA Seq and Differential Expression Analysis Brooke L. Fridley, PhD University of Kansas Medical Center 1 Next-generation
CBC Data Therapy. Metatranscriptomics Discussion
 CBC Data Therapy Metatranscriptomics Discussion Metatranscriptomics Extract RNA, subtract rrna Sequence cdna QC Gene expression, function Institute for Systems Genomics: Computational Biology Core bioinformatics.uconn.edu
Parts of a standard FastQC report
 FastQC FastQC, written by Simon Andrews of Babraham Bioinformatics, is a very popular tool used to provide an overview of basic quality control metrics for raw next generation sequencing data. There are
RNA Seq: Methods and Applica6ons. Prat Thiru
 RNA Seq: Methods and Applica6ons Prat Thiru 1 Outline Intro to RNA Seq Biological Ques6ons Comparison with Other Methods RNA Seq Protocol RNA Seq Applica6ons Annota6on Quan6fica6on Other Applica6ons Expression
Differential expression analysis for sequencing count data. Simon Anders
 Differential expression analysis for sequencing count data Simon Anders Two applications of RNA-Seq Discovery find new transcripts find transcript boundaries find splice junctions Comparison Given samples
From Variants to Pathways: Agilent GeneSpring GX s Variant Analysis Workflow
 From Variants to Pathways: Agilent GeneSpring GX s Variant Analysis Workflow Technical Overview Import VCF Introduction Next-generation sequencing (NGS) studies have created unanticipated challenges with
Canadian Bioinforma3cs Workshops
 Canadian Bioinforma3cs Workshops www.bioinforma3cs.ca Module #: Title of Module 2 1 Module 3 Expression and Differen3al Expression (lecture) Obi Griffith & Malachi Griffith www.obigriffith.org ogriffit@genome.wustl.edu
Ecole de Bioinforma(que AVIESAN Roscoff 2014 GALAXY INITIATION. A. Lermine U900 Ins(tut Curie, INSERM, Mines ParisTech
 GALAXY INITIATION A. Lermine U900 Ins(tut Curie, INSERM, Mines ParisTech How does Next- Gen sequencing work? DNA fragmentation Size selection and clonal amplification Massive parallel sequencing ACCGTTTGCCG
RNAseq Differential Gene Expression Analysis Report
 RNAseq Differential Gene Expression Analysis Report Customer Name: Institute/Company: Project: NGS Data: Bioinformatics Service: IlluminaHiSeq2500 2x126bp PE Differential gene expression analysis Sample
RNA-Seq Software, Tools, and Workflows
 RNA-Seq Software, Tools, and Workflows Monica Britton, Ph.D. Sr. Bioinformatics Analyst September 1, 2016 Some mrna-seq Applications Differential gene expression analysis Transcriptional profiling Assumption:
RNA Sequencing: Experimental Planning and Data Analysis. Nadia Atallah September 12, 2018
 RNA Sequencing: Experimental Planning and Data Analysis Nadia Atallah September 12, 2018 A Next Generation Sequencing (NGS) Refresher Became commercially available in 2005 Construction of a sequencing
Analysis Datasheet Exosome RNA-seq Analysis
 Analysis Datasheet Exosome RNA-seq Analysis Overview RNA-seq is a high-throughput sequencing technology that provides a genome-wide assessment of the RNA content of an organism, tissue, or cell. Small
measuring gene expression December 11, 2018
 measuring gene expression December 11, 2018 Intervening Sequences (introns): how does the cell get rid of them? Splicing!!! Highly conserved ribonucleoprotein complex recognizes intron/exon junctions and
Introduction to Next Generation Sequencing
 The Sequencing Revolution Introduction to Next Generation Sequencing Dena Leshkowitz,WIS 1 st BIOmics Workshop High throughput Short Read Sequencing Technologies Highly parallel reactions (millions to
Introduction to RNA-Seq
 Introduction to RNA-Seq Monica Britton, Ph.D. Bioinformatics Analyst September 2014 Workshop Overview of Today s Activities Morning RNA-Seq Concepts, Terminology, and Work Flows Two-Condition Differential
Long and short/small RNA-seq data analysis
 Long and short/small RNA-seq data analysis GEF5, 4.9.2015 Sami Heikkinen, PhD, Dos. Topics 1. RNA-seq in a nutshell 2. Long vs short/small RNA-seq 3. Bioinformatic analysis work flows GEF5 / Heikkinen
Introduction to RNA-Seq
 Introduction to RNA-Seq Monica Britton, Ph.D. Sr. Bioinformatics Analyst March 2015 Workshop Overview of RNA-Seq Activities RNA-Seq Concepts, Terminology, and Work Flows Using Single-End Reads and a Reference
RNA-Sequencing analysis
 RNA-Sequencing analysis Markus Kreuz 25. 04. 2012 Institut für Medizinische Informatik, Statistik und Epidemiologie Content: Biological background Overview transcriptomics RNA-Seq RNA-Seq technology Challenges
RNA-Seq analysis workshop
 RNA-Seq analysis workshop Zhangjun Fei Boyce Thompson Institute for Plant Research USDA Robert W. Holley Center for Agriculture and Health Cornell University Outline Background of RNA-Seq Application of
Transcriptome Assembly, Functional Annotation (and a few other related thoughts)
") Transcriptome Assembly, Functional Annotation (and a few other related thoughts) Monica Britton, Ph.D. Sr. Bioinformatics Analyst June 23, 2017 Differential Gene Expression Generalized Workflow File Types
Transcriptome Assembly, Functional Annotation (and a few other related thoughts) Monica Britton, Ph.D. Sr. Bioinformatics Analyst June 23, 2017 Differential Gene Expression Generalized Workflow File Types
Systematic evaluation of spliced alignment programs for RNA- seq data
 Systematic evaluation of spliced alignment programs for RNA- seq data Pär G. Engström, Tamara Steijger, Botond Sipos, Gregory R. Grant, André Kahles, RGASP Consortium, Gunnar Rätsch, Nick Goldman, Tim
Whole Transcriptome Analysis of Illumina RNA- Seq Data. Ryan Peters Field Application Specialist
 Whole Transcriptome Analysis of Illumina RNA- Seq Data Ryan Peters Field Application Specialist Partek GS in your NGS Pipeline Your Start-to-Finish Solution for Analysis of Next Generation Sequencing Data
Exercises: Analysing ChIP-Seq data
 Exercises: Analysing ChIP-Seq data Version 2018-03-2 Exercises: Analysing ChIP-Seq data 2 Licence This manual is 2018, Simon Andrews. This manual is distributed under the creative commons Attribution-Non-Commercial-Share
Data Basics. Josef K Vogt Slides by: Simon Rasmussen Next Generation Sequencing Analysis
 Data Basics Josef K Vogt Slides by: Simon Rasmussen 2017 Generalized NGS analysis Sample prep & Sequencing Data size Main data reductive steps SNPs, genes, regions Application Assembly: Compare Raw Pre-
Introduction to transcriptome analysis using High Throughput Sequencing technologies. D. Puthier 2012
 Introduction to transcriptome analysis using High Throughput Sequencing technologies D. Puthier 2012 Transcriptome: the old school Cyanine 5 (Cy5) Cy-3: - Excitation 550nm - Emission 570nm Cy-5: - Excitation
Computational & Quantitative Biology Lecture 6 RNA Sequencing
 Peter A. Sims Dept. of Systems Biology Dept. of Biochemistry & Molecular Biophysics Sulzberger Columbia Genome Center October 27, 2014 Computational & Quantitative Biology Lecture 6 RNA Sequencing We Have
Reference genomes and common file formats
 Reference genomes and common file formats Overview Reference genomes and GRC Fasta and FastQ (unaligned sequences) SAM/BAM (aligned sequences) Summarized genomic features BED (genomic intervals) GFF/GTF
ChIP-seq analysis 2/28/2018
 ChIP-seq analysis 2/28/2018 Acknowledgements Much of the content of this lecture is from: Furey (2012) ChIP-seq and beyond Park (2009) ChIP-seq advantages + challenges Landt et al. (2012) ChIP-seq guidelines
Deep sequencing of transcriptomes
 1 / 40 Deep sequencing of transcriptomes An introduction to RNA-seq Michael Dondrup UNI BCCS 2. november 2010 2 / 40 Transcriptomics by Ultra-Fast Sequencing Microarrays have been the primary transcriptomics
Expression data analysis with Chipster. Eija Korpelainen, Massimiliano Gentile
 Expression data analysis with Chipster Eija Korpelainen, Massimiliano Gentile chipster@csc.fi Understanding data analysis - why? Bioinformaticians might not always be available when needed Biologists know
SCALABLE, REPRODUCIBLE RNA-Seq
 SCALABLE, REPRODUCIBLE RNA-Seq SCALABLE, REPRODUCIBLE RNA-Seq Advances in the RNA sequencing workflow, from sample preparation through data analysis, are enabling deeper and more accurate exploration
Measuring and Understanding Gene Expression
 Measuring and Understanding Gene Expression Dr. Lars Eijssen Dept. Of Bioinformatics BiGCaT Sciences programme 2014 Why are genes interesting? TRANSCRIPTION Genome Genomics Transcriptome Transcriptomics
Post-assembly Data Analysis
 Assembled transcriptome Post-assembly Data Analysis Quantification: the expression level of each gene in each sample DE genes: genes differentially expressed between samples Clustering/network analysis
Total RNA isola-on End Repair of double- stranded cdna
 Total RNA isola-on End Repair of double- stranded cdna mrna Isola8on using Oligo(dT) Magne8c Beads AAAAAAA A Adenyla8on (A- Tailing) A AAAAAAAAAAAA TTTTTTTTT AAAAAAA TTTTTTTTT TTTTTTTT TTTTTTTTT AAAAAAAA
Reference genomes and common file formats
 Reference genomes and common file formats Dóra Bihary MRC Cancer Unit, University of Cambridge CRUK Functional Genomics Workshop September 2017 Overview Reference genomes and GRC Fasta and FastQ (unaligned
UAB DNA-Seq Analysis Workshop. John Osborne Research Associate Centers for Clinical and Translational Science
 + UAB DNA-Seq Analysis Workshop John Osborne Research Associate Centers for Clinical and Translational Science ozborn@uab.,edu + Thanks in advance You are the Guinea pigs for this workshop! At this point
DATA FORMATS AND QUALITY CONTROL
 HTS Summer School 12-16th September 2016 DATA FORMATS AND QUALITY CONTROL Romina Petersen, University of Cambridge (rp520@medschl.cam.ac.uk) Luigi Grassi, University of Cambridge (lg490@medschl.cam.ac.uk)
Reads to Discovery. Visualize Annotate Discover. Small DNA-Seq ChIP-Seq Methyl-Seq. MeDIP-Seq. RNA-Seq. RNA-Seq.
 Reads to Discovery RNA-Seq Small DNA-Seq ChIP-Seq Methyl-Seq RNA-Seq MeDIP-Seq www.strand-ngs.com Analyze Visualize Annotate Discover Data Import Alignment Vendor Platforms: Illumina Ion Torrent Roche
Deep Sequencing technologies
 Deep Sequencing technologies Gabriela Salinas 30 October 2017 Transcriptome and Genome Analysis Laboratory http://www.uni-bc.gwdg.de/index.php?id=709 Microarray and Deep-Sequencing Core Facility University
Short Read Alignment to a Reference Genome
 Short Read Alignment to a Reference Genome Shamith Samarajiwa CRUK Summer School in Bioinformatics Cambridge, September 2018 Aligning to a reference genome BWA Bowtie2 STAR GEM Pseudo Aligners for RNA-seq
Course Presentation. Ignacio Medina Presentation
 Course Index Introduction Agenda Analysis pipeline Some considerations Introduction Who we are Teachers: Marta Bleda: Computational Biologist and Data Analyst at Department of Medicine, Addenbrooke's Hospital
Bioinformatics Monthly Workshop Series. Speaker: Fan Gao, Ph.D Bioinformatics Resource Office The Picower Institute for Learning and Memory
 Bioinformatics Monthly Workshop Series Speaker: Fan Gao, Ph.D Bioinformatics Resource Office The Picower Institute for Learning and Memory Schedule for Fall, 2015 PILM Bioinformatics Web Server (09/21/2015)
Why QC? Next-Generation Sequencing: Quality Control. Illumina data format. Fastq format:
 Why QC? Next-Generation Sequencing: Quality Control BaRC Hot Topics January 2017 Bioinformatics and Research Computing Whitehead Institute Do you want to include the reads with low quality base calls?
Next-Generation Sequencing: Quality Control
 Next-Generation Sequencing: Quality Control Bingbing Yuan BaRC Hot Topics January 2017 Bioinformatics and Research Computing Whitehead Institute http://barc.wi.mit.edu/hot_topics/ Why QC? Do you want to
QIAseq Targeted Panel Analysis Plugin USER MANUAL
 QIAseq Targeted Panel Analysis Plugin USER MANUAL User manual for QIAseq Targeted Panel Analysis 1.1 Windows, macos and Linux June 18, 2018 This software is for research purposes only. QIAGEN Aarhus Silkeborgvej
Combined final report: genome and transcriptome assemblies
 Combined final report: genome and transcriptome assemblies Nadia Fernandez- Trinity assembly, RSEM, Tophat and Cufflinks/Cuffmerge/Cuffdiff pipeline, and MAKER annotation Stephanie Gutierrez Avril Harder