Introduction to Bioinformatics analysis of Metabarcoding data
|
|
|
- Amber Bryant
- 5 years ago
- Views:
Transcription


1 Introduction to Bioinformatics analysis of Metabarcoding data Theoretical part Alvaro Sebastián Yagüe
2 Experimental design Sampling Sample processing Sequencing Sequence processing
3 Experimental design Sampling Sample processing Sequencing Sequence processing

 RNA-seq Mass")
4 What do we want to sequence? ChIP-seq Whole genome sequencing (WGS) Amplicon sequencing (AS) Whole exome sequencing (WES) RNA-seq Mass spectrometry
 Strategies for the systematic sequencing of complex genomes.")
5 How do we want to sequence? Green,E.D. (2001) Strategies for the systematic sequencing of complex genomes. Nat. Rev. Genet., 2,

6 Metagenomics - Shotgun sequencing
7 Metagenomics - High-throughput sequencing DNA extraction DNA fragmentation and sequencing Read mapping to reference genome De novo assembly Chimeras!
8 Metabarcoding - Amplicon sequencing 1. PCR amplification and sample tagging Barcode 1 Barcode 2 Barcode 3 2. Sequencing of PCR products 3. De-multiplexing of reads Barcode 1 Barcode 2 Barcode 3 Samples

9 Metabarcoding vs Metagenomics Kress, W. J., & Erickson, D. L. (2008). DNA barcodes: genes, genomics, and bioinformatics. Proceedings of the National Academy of Sciences of the United States of America, 105(8),
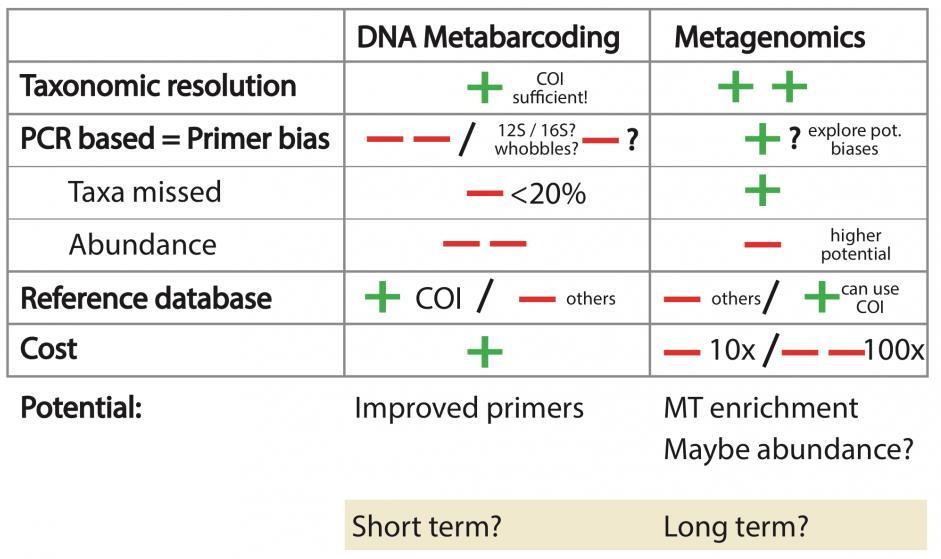
10 Metabarcoding vs Metagenomics
11 Experimental design Sampling Sample processing Sequencing Sequence processing


12 Where? Variability in abundance within soil and plant. Consider vertical and horizontal distribution of fungi. When? Temporal dynamics over short and long term. For complete community census, sample across multiple seasons. How many? How much? Perform power analysis to determine optimal sample size and quantity. Arbuscular mycorrhizal fungi Read about the sampling methods used in previous literature Hart,M.M. et al. (2015) Navigating the labyrinth: A guide to sequence-based, community ecology of arbuscular mycorrhizal fungi. New Phytol., 207,
13 Experimental design Sampling Sample processing Sequencing Sequence processing
14 Sample preservation Sample preservation methods may result in a significant loss of DNA. Snap-freezing in liquid nitrogen (fast and convenient in the lab but not in field) Other methods: Ethanol storage, silica-gel drying, freeze-drying, oven-drying at low heat, storage in DNA extraction buffer DNA/RNA isolation Traditional phenol/chloroform extraction. Modern extraction kits. Researcher fatigue may result in later samples being handled less efficiently. Samples processed early in the protocol will be exposed to variable conditions longer. Internal controls Internal standards, as a initial known quantity of DNA, will provide a measure of DNA yield. Especially important for samples that originate from different environments. Should be used to quantify DNA/RNA recovery. Will validate the accuracy of results from further analyses. A blank sample (negative control) will help to control contaminations during the process. Sometimes our DNA of interest will be rare compared with other DNAs present in the samples Hart,M.M. et al. (2015) Navigating the labyrinth: A guide to sequence-based, community ecology of arbuscular mycorrhizal fungi. New Phytol., 207,
15 Experimental design Sampling Sample processing Sequencing Sequence processing
16 What do we want to sequence? Metabarcoding or Amplicon sequencing (AS)

17 Metabarcoding - Amplicon sequencing Choose barcodes, design primers and add tags PCR amplification and sequencing Fwd Tag Rev Tag Barcode 1 Barcode 2 Barcode 3
18 Barcodes, markers and tags Fwd Tag DNA barcode / marker PCR PRODUCT Rev Tag A DNA BARCODE is a standardized short sequence of DNA ( bp) that in principle should be easily generated and characterized for all species on the planet. A massive on-line digital library of barcodes will serve as a standard to which any DNA barcode sequence of an unidentified environmental sample from sea, soil, air, etc. can be matched. Savolainen et al A GENETIC MARKER is a specific gene or DNA sequence that produces a detectable trait with a known location on a chromosome and that can be used to study family and population, identification of cells, species or individual. So a DNA barcode is a type of genetic marker. A DNA TAG is A unique short DNA sequence that identifies unambiguously a sample. DNA tags are usually ligated after PCR amplification or directly included in one or both primers.
19 Which barcode to choose? A perfect barcode should be present in all the organisms, in all the cells have variable sequence among different species be conserved among individuals of the same species be easy to amplify with conserved flanking sites be not too long for sequencing

20 Which barcode to choose? Ribosomes contain two major rrnas and 50 or more proteins. The ribosomal RNAs form two subunits, the large subunit (LSU) and small subunit (SSU). rrna is one of only a few gene products present in all organisms and in all cells. For this reason, genes that encode the rrna (rdna) are very good barcodes to identify an organism's taxonomic group, calculate related groups, and estimate rates of species divergence.
21 Which barcode to choose? small subunit large subunit prokaryotic rrna operon 16S (SSU) trna 23S (LSU) 5S eukaryotic rrna operon 18S (SSU) 5.8S ITS1 ITS2 28S (LSU) 5S tandem repeats internally transcribed spacers Type LSU SSU prokaryotic eukaryotic 5S bp 23S bp 5S bp 5.8S bp 28S bp 16S bp 18S bp
22 Which barcode to choose? small subunit large subunit prokaryotic rrna operon 16S (SSU) trna 23S (LSU) 5S eukaryotic rrna operon 18S (SSU) 5.8S ITS1 ITS2 28S (LSU) 5S tandem repeats internally transcribed spacers The ribosomal operon offers the greatest resolution when used as a whole. Unfortunately, the ribosomal operon is in excess of 5500 bp (prokaryotic), which is intractable for Sanger sequencing and for current NGS technologies.
23 Which barcode to choose? Kress,W.J. et al. (2014) DNA barcodes for ecology, evolution, and conservation. Trends Ecol. Evol., 30, Bacteria/ 16S RIF Archae CO1: cytochrome c oxidase subunit 1 ITS: internally transcribed spacer LSU: large subunit rrna D1/D2/D3: divergent domains RIF: DnaA replication initiation factor
24 Which barcode to choose? Ideally, a single DNA barcode (also called marker) would be used to recognize organisms at organizational levels from genotype to kingdom. In reality, there is no de facto best sequence target that would achieve all aims. Discriminating taxa at the species level requires a more variable sequence (barcode) than at the genus or family level. Most studies have focused only on identifying taxa, but protein-encoding genes with known functions may become important functional barcodes for future community surveys. Hart,M.M. et al. (2015) Navigating the labyrinth: A guide to sequence-based, community ecology of arbuscular mycorrhizal fungi. New Phytol., 207,

25 Primer design and barcoding Fwd Tag Rev Tag 16S rrna V3-V5 region Barcode Forward primer Reverse primer Microbial 16S rrna V3-V5 region CCGTCAATTCMTTTRAGT CTGCTGCCTCCCGTAGG Sample Forward tag Reverse tag S001 AACGCG AAGACA S002 TCACTC CGTCAC S003 CTTGGT TTGAGT S004 TGGAAC TAACAT S005 CGAATC GGTCGA


26 Which sequencing technology to choose? Sanger ABI Ion Torrent 454 Illumina -400 Illumina MiSeq 2nd 2 x x 10 7 (paired) 4-55 h 0.15 Rhoads,A. and Au,K.F. (2015) PacBio Sequencing and Its Applications. Genomics, Proteomics Bioinforma., 13,
27 What do we have after sequencing? Each sequencing technology outputs different kind of results. Technology Output format Description Sanger ABI ABI It contains the 'trace data' i.e. the probabilities of the 4 bases along the sequencing run, together with the sequence, as deduced from that data. 454 (Roche) SFF Binary format that provides flowgrams or measurements that estimate the length of the next homopolymer stretch in the sequence (i.e., in "AAATGG", "AAA" is a 3-mer stretch of A's). Ion Torrent Illumina BAM FASTQ Binary form of the SAM format. It contains the information for each sequence about where/how it aligns or not to a reference. Text-based format for storing both sequences and its corresponding quality scores. The most accepted NGS standard format is FASTQ.
28 FASTQ read format There are many tools to convert the different formats to FASTQ, e.g.: A FASTQ file has the following look: 1 st IDENTIFIER 2 nd line: SEQUENCE 3 rd line: + OPTIONAL 4 th line: TCACTCGAGTGTCATTTCTCCAACGGGACGGAGCGGGTGCGGTTCCTGGAGAGAC + CCGGAAGAGTGTCATTTCTCCAACGGGACGGAGCAGATACGGTTCCTGGACAGAT + 1:N:0:1 AACCGAGAGTGTCATTTCTCCAACGGGACGGAGCGGGTGCGGTTCCTGGACAGAT + GGHHGHHADGFGGDCFGDF@CEGCFFBGEFFHGFF<CFHFGDGDGE0/A>/HF@E
29 FASTQ read format There are many tools to convert the different formats to FASTQ, e.g.: A FASTQ file has the following look: 1 st IDENTIFIER 2 nd line: SEQUENCE 3 rd line: + OPTIONAL 4 th line: TCACTCGAGTGTCATTTCTCCAACGGGACGGAGCGGGTGCGGTTCCTGGAGAGAC + A2FHGGGGGGGGG?FE//><CGC>..-@CCD.<0=.<-;DGAACFBFB0?DGGGC 37 Each ASCII char represents 17a Phred quality score: 32 39

30 Sequencing quality score Phred quality score: Phred = 50 Phred = 10 Phred = 0 Phred Probability of incorrect base call 10 1 in 10 90% 20 1 in % Base call accuracy 30 1 in % 40 1 in 10, % 50 1 in 100, % 60 1 in 1,000, % Phred Wikipedia
31 454 and IonTorrent Reads do not have fix lengths: Read type and lengths >G4S72XW01AM8OM rank= x=147.0 y= length=89 TTCTCGACGATTCCTGCAGCAGATGATAGTTACATAGTCCAGGCAAGTTCTGCAAGCAGTTCAAAGCGGAGAGTTAAGCCGAATGAAGT >G4S72XW01ALTYX rank= x=131.0 y= length=86 CCGTCCACGATTCCTGCAGCAGATGATAGTTACATAGTCCAGGCAAGTTCTGCAAGCAGTTCAAGCGGAGAGTTAAGCCGAATCGA >G4S72XW01AVHCV rank= x=241.0 y= length=89 TTCTCGACGATTCCTGCAGCAGATGATAGTTACATAGTCCAGGCAAGTTCTGCAAGCAGTTCAAAGCGGAGAGTTAAGCCGAATACGTG >G4S72XW01AQG7N rank= x=184.5 y= length=65 CCGTCCATCTCCGTGTCCCGGCCCGTATCGCCTCCCTACTGTGCTTGAACACCCTGCGCTACGTG >G4S72XW01ANE2G rank= x=149.5 y= length=227 TTGCAAGCAGGTTGCTCAGGCCCACTTGGTCACTCTGTGCATTGCCCTTGGCAATCCGTGTGTTCCGTTTCCAATACCCCGGCCCCTCCTGCTCTATCCATGGC GCTCGCGGCTCCATCCTCGGCTTCGGGGCGTCGCTGTCAAAGCGCACGAACTGCGTGTCCTCCACATAGCCCACTTCCATATGCCGGGGCTCCCCTCCGGGGCC GGGACACGGAGGTACACTT >G4S72XW01ALTSD rank= x=131.5 y= length=260 TTCTCGGAGTGTCATTTCTCCAACGAGACGGAGCTGGTGCGGTTCCTGGAAAGATACATCTACAACCGGGAGGAGTACGTGCGCTTCGACAGCGACGTGGGGGA GTACCGCGCGGTGAGCGAGCTGGGGCGGCGGTCAGCCGAGTACTGGAACAGACAGAAGGACCTCCTGGAGCAGAAGCGGGGACAGGTGGACAACTACTGCCGAC ACAACTATGGGGTTGGTGAGAGCTTCACTGTGGAGCGGAGAGTTGACTGCTT >G4S72XW01APU23 rank= x=177.5 y= length=54 CCGCTCTCCGTGTCCCGGCCCTGAGCTATGTGCTTGAACACCCTGCGCGCTGGA >G4S72XW01AL62B rank= x=135.5 y= length=221 TTCTCGACCTCCGTGTCCCGGCCCGGAGGGAGCCCGGCATATGGAAGTGGGCTATGTGGAGGACACGCAGTTCGTGCGCTTTGACAGCGACGCCCCGAAGCCGA GGATGGAGCCGCGAGCGCCATAGATAGAGCAGGGGGCCGGGTAGTTGAACGGAACACACGGATTGCCAAGGGCGAATGCACAGAGTGACCAAGTGGGCCTGAGC AACCTGCGTTCCA >G4S72XW01AR49R rank= x=203.0 y= length=87 CCGTCCACGATTCCTGCAGCAGATGATAGTTACATAGTCCAGGCAAGTTCTGCAAGCAGTTCAAAGCGGAGAGTTAAGCCGAATCGA >G4S72XW01AO8U8 rank= x=170.0 y= length=229 TTGCAAGCGCAGGGTGTTCAAGCACATTCGGTGATTCTGTGCAGAGTTCTCGGAAATCCGTGTGTTTTGCTCCCAATACTCCGGACCCTCCAGCCCCATCCACG GCGCCCGCGGCTCCTGTCTGGGATTCTTTGCGTCGCTGTCGAAGCGCATGAACTGGGTGTCGTCCACGTAGCCCACGGAGATGAAGCGGGACTCCCGGAGGCCG GGCCGGGACACGGAGATGTAG
32 Read type and lengths Illumina Reads are fix length but usually are paired (two files): R1 file: >M01530:20: A89BL:1:1101:14684:1732 1:N:0:1 CTTGGTGAGTGTCATTTCTCCAACGGGACGGAGCGGGTGCGGCTCCTACACAGATACATCTACAACCGGGAGGAGGTCTCGC >M01530:20: A89BL:1:1101:18776:1733 1:N:0:1 TCAGAGGAGCGGGGGTCTCCACACCATACAATATGTTACCGGCTGTGACCTCCTGTCCGACGGGAGCGTCCGTGGATCCTT >M01530:20: A89BL:1:1101:15484:1734 1:N:0:1 GGGGACGTCGGCATGTTCTGGTTCCGATAAACAGACACTATTTACCGCCGCTACCGCGGGCAACGGCGACAACTTCACCA >M01530:20: A89BL:1:1101:18291:1819 1:N:0:1 AGTGTTGAGTGTCATTTCTCCAACGGGACGGAGCGGATACGGTTCCTGGACAGATACTTCTACAACCGGGAGGAGTACGTGCG R2 file: >M01530:20: A89BL:1:1101:14684:1732 2:N:0:1 TTGAGTTCACCTCTCCGCTCCACAGTGAAGCTCTCGACAACCCCATAGTTGTGTCTGCACACAGTGTCCACCTCGGCCCGC >M01530:20: A89BL:1:1101:18776:1733 2:N:0:1 AACCGATGCGCTCCAGCTCCTTCTGCCCGTATCCGACGTATTTCTGGAGCTCTTCCGGGCACTCGTGCTTCAGGTAATTCG >M01530:20: A89BL:1:1101:15484:1734 2:N:0:1 TCAGCAGTTTAATCACTGTTGCACTGGTCAACACTGGAATGGCGAGGCGCTGTACTTCTTCCAACAGCACTTTCACCATTAA >M01530:20: A89BL:1:1101:18291:1819 2:N:0:1 GAACTATCACCTCTCCGCTCCACAGTGAAGCTCTCAACAACCCCGTAGTTGTGTCGGCAGTAGTTGTCCACCGTGGCCCGC

33 Read type and lengths Illumina
34 Read type and lengths Illumina And read ends may overlap: R1 file / R2 file Reverse complementary >M01530:20: A89BL:1:1101:14684:1732 1:N:0:1 CTTGGTGAGTGTCATTTCTCCAACGGGACGGAGCGGGTGCGGCTCCTACACAGATACATCTACAACCGGGAGGAGGTCTCGC >M01530:20: A89BL:1:1101:14684:1732 2:N:0:1 GTCATTTCTCCAACGGGACGGAGCGGGTGCGGCTCCTACACAGATACATCTACAACCGGGAGGAGGTCTCGCCGTACGGCTA >M01530:20: A89BL:1:1101:18776:1733 1:N:0:1 TCAGAGGAGCGGGGGTCTCCACACCATACAATATGTTACCGGCTGTGACCTCCTGTCCGACGGGAGCGTCCGTGGATCCTT >M01530:20: A89BL:1:1101:18776:1733 2:N:0:1 GGTCTCCACACCATACAATATGTTACCGGCTGTGACCTCCTGTCCGACGGGAGCGTCCGTGGATCCTTCTAAGCCTCAGGCC >M01530:20: A89BL:1:1101:15484:1734 1:N:0:1 GGGGACGTCGGCATGTTCTGGTTCCGATAAACAGACACTATTTACCGCCGCTACCGCGGGCAACGGCGACAACTTCACCA >M01530:20: A89BL:1:1101:15484:1734 2:N:0:1 GTCGGCATGTTCTGGTTCCGATAAACAGACACTATTTACCGCCGCTACCGCGGGCAACGGCGACAACTTCACCACAGCGG >M01530:20: A89BL:1:1101:18291:1819 1:N:0:1 AGTGTTGAGTGTCATTTCTCCAACGGGACGGAGCGGATACGGTTCCTGGACAGATACTTCTACAACCGGGAGGAGTACGTGCG >M01530:20: A89BL:1:1101:18291:1819 2:N:0:1 TGTCATTTCTCCAACGGGACGGAGCGGATACGGTTCCTGGACAGATACTTCTACAACCGGGAGGAGTACGTGCGATTACCGCT

35 454 and IonTorrent Sequencing errors 1% of sequencing errors, mostly indels in homopolymer regions. Deletion Substitution Insertion Sometimes there are more reads with errors than without!!!!!
36 Sequencing errors Illumina <1% of sequencing errors, mostly random substitutions. Substitution As errors are random, the consensus sequence will be correct.

37 PCR errors Other errors Most commercially available Taq polymerases introduce errors at the rate of 1 point mutation every 1000 nts. Solution: higher fidelity polymerases such as Pfu or Phusion High-Fidelity generating times fewer errors respectively. Chimeras Chimeras are sequences formed from two or more biological sequences joined together. Solutions: - Reduce the number of PCR cycles. - Increase the annealing temperature.
38 Error correction strategies Filtering: removes suspicious reads Problem: we can lost most of the reads, and with them most of the information. Also we can discard correct reads by error. Clustering: corrects erroneous reads Problem: it can be hard to discriminate among erroneous reads and correct ones.
39 Experimental design Sampling Sample processing Sequencing Sequence processing
40 Operational taxonomic unit (OTU) Theoretically, an OTU is a taxonomic level of sampling selected by the user to be used in a study, such as individuals, populations, species, genera, or bacterial strains (Sokal and Sneath, 1963). Practically, an OTU is a cluster of similar sequence variants of the barcode (16S, ITS, etc.). Each of these cluster is intended to represent a taxonomic unit of a bacteria species or genus depending on the sequence similarity threshold. An OTU cluster is usually defined by variants with a 97% of sequence identity. Stackebrandt and Goebel (1994) BUT Some species have genes that are >97% similar, giving merged OTUs containing multiple species. A single species may have paralogs that are <97% similar, causing the species to be split across two or more OTUs. Some clusters, even a majority, may be spurious due to artifacts including read errors and chimeras.

41 Susan Huse. STAMPS 2016 Course. Introduction to OTU Clustering.
42 Analysis pipeline These are the general steps shared by the most used metagenomics analysis tools: UPARSE, QIIME, MOTHUR, MICCA and AmpliTAXO Read pre-processing Filtering of artefacts De-multiplexing Alignment to references De-replication Taxonomy annotation Clustering of variants Downstream analysis Oulas,A. et al. (2015) Metagenomics: tools and insights for analyzing next-generation sequencing data derived from biodiversity studies. Bioinform. Biol. Insights, 9,
43 Analysis pipeline These are the general steps shared by the most used metagenomics analysis tools: UPARSE, QIIME, MOTHUR, MICCA and AmpliTAXO Read pre-processing De-multiplexing De-replication Clustering of variants 1. Read pre-processing If reads are paired-end type (e.g. Illumina), an initial step consists of merging overlapping paired reads into single reads is required. Anomalous reads are removed and when reads have different lengths (e.g. 454) they are also trimmed to a fix length to make easier further processing (alignment and clustering). 2. De-multiplexing Organizes the multiplexed reads into amplicons (single PCR products) based on the different barcodes (primers) and tags (samples) used. 3. De-replication Redundant reads are annotated as unique sequences (variants) and their abundances (depths). 4. Clustering of variants Variants are clustered based on a user-defined similarity threshold. This step is crucial to group redundant sequences due to sequencing and PCR errors into unique variants that will be representative of single OTUs.
, an initial step consists of merging overlapping paired reads")

44 If reads are paired-end type (e.g. Illumina), an initial step consists of merging overlapping paired reads into single reads is required. Illumina paired read with overlap: Read pre-processing Illumina paired reads with staggered overlap:
45 Read pre-processing Detection and removal of suspicious reads. Primer: CCGTCAATTCMTTTRA Barcode: AATGGTAC >GQY1XT001A6MUA AATGGTACCCGTCAATTCATTTGATCTTGCGGTTCGTTTACGGCGTGGACTACCAGTCGCACTCCAGTCATACAGTTTCCAATG >GQY1XT001BTRWS AATGGTACCCGTCAATTCCTTTGATCTTGCGGGCCGTTTACGGCGTGGACTACCAGTCGCACTCGAGCTGCACAGTTTCCAAAGCAGTTCCGGGGTTGGG >GQY1XT001AK4J0 TCTAGCCGCACAGTTTCAAAAGCACTCCCAGGGTT >GQY1XT001BBPBR AATGGTACCCGTCAATTCATTTGACGTTGCCCCCCGTTTACTGTGCGGACTACCAGTCGCACTCAAGGCCCCCAGTTTCAACGG >GQY1XT001BDDE9 AATGGTACCCGTCAATTCCTTTAATCTTGCGGGTCGTTTACGGCGTGGACTACCAGTCGCACTCCAGTTACACAGTTTCCAGAG >GQY1XT001CIUF3 AATGGTACCCGTCAATTCCTTTGATCTTGCGGGCCTTTACGGCGTGGACTACCAGGCGCCCTCCAGCCCGGCAGTTTCCAGTGCAGTCCCGGGGTT >GQY1XT001BKRP5 AATGGTACCCGTCAATTCATTTAATCTCTCCCCCTTTCCCCCCCCCCCCCTTTCCCCCCCCCCCCCTTTCCCCCCCCCC >GQY1XT001B44ZE AATGGTACCCGTCAATTCATTTAACCTTGCGGGGTTTTACCGCGTGGACTACCAGGCGCCCTCAAGAAGAACAGTTTTGAACGCAGCTATGGGTT >GQY1XT001CIW3P AATGGTACCCGTCAATTCATTTGACGTTGCCTCTCGTTTACTGCGTGGACTACCAGTCGCACTCAAGGCCCCCA >GQY1XT001A731D AATGGTACCCGTCAATTCATTTAACGTTGCCCCCGTTACTGCGTGGACTACCAGGGGCAATCAAGACTGCCA
46 Read pre-processing Detection and removal of suspicious reads. Primer: CCGTCAATTCMTTTRA Barcode: AATGGTAC >GQY1XT001A6MUA AATGGTACCCGTCAATTCATTTGATCTTGCGGTTCGTTTACGGCGTGGACTACCAGTCGCACTCCAGTCATACAGTTTCCAATG >GQY1XT001BTRWS AATGGTACCCGTCAATTCCTTTGATCTTGCGGGCCGTTTACGGCGTGGACTACCAGTCGCACTCGAGCTGCACAGTTTCCAAAGCAGTTCCGGGGTTGGG >GQY1XT001AK4J0 TCTAGCCGCACAGTTTCAAAAGCACTCCCAGGGTT >GQY1XT001BBPBR AATGGTACCCGTCAATTCATTTGACGTTGCCCCCCGTTTACTGTGCGGACTACCAGTCGCACTCAAGGCCCCCAGTTTCAACGG >GQY1XT001BDDE9 AATGGTACCCGTCAATTCCTTTAATCTTGCGGGTCGTTTACGGCGTGGACTACCAGTCGCACTCCAGTTACACAGTTTCCAGAG >GQY1XT001CIUF3 AATGGTACCCGTCAATTCCTTTGATCTTGCGGGCCTTTACGGCGTGGACTACCAGGCGCCCTCCAGCCCGGCAGTTTCCAGTGCAGTCCCGGGGTT >GQY1XT001BKRP5 AATGGTACCCGTCAATTCATTTAATCTCTCCCCCTTTCCCCCCCCCCCCCTTTCCCCCCCCCCCCCTTTCCCCCCCCCC >GQY1XT001B44ZE AATGGTACCCGTCAATTCATTTAACCTTGCGGGGTTTTACCGCGTGGACTACCAGGCGCCCTCAAGAAGAACAGTTTTGAACGCAGCTATGGGTT >GQY1XT001CIW3P AATGGTACCCGTCAATTCATTTGACGTTGCCTCTCGTTTACTGCGTGGACTACCAGTCGCACTCAAGGCCCCCA >GQY1XT001A731D AATGGTACCCGTCAATTCATTTAACGTTGCCCCCGTTACTGCGTGGACTACCAGGGGCAATCAAGACTGCCA
47 When reads have different lengths they are trimmed to a fix length to make easier further processing (alignment and clustering). Primer: CCGTCAATTCMTTTRA Barcode: AATGGTAC Read pre-processing >GQY1XT001A6MUA AATGGTACCCGTCAATTCATTTGATCTTGCGGTTCGTTTACGGCGTGGACTACCAGTCGCACTCCAGTCATACAGTTTCCAATG >GQY1XT001BTRWS AATGGTACCCGTCAATTCCTTTGATCTTGCGGGCCGTTTACGGCGTGGACTACCAGTCGCACTCGAGCTGCACAGTTTCCAAAGCAGTTCCGGGGTTGGG >GQY1XT001AK4J0 TCTAGCCGCACAGTTTCAAAAGCACTCCCAGGGTT >GQY1XT001BBPBR AATGGTACCCGTCAATTCATTTGACGTTGCCCCCCGTTTACTGTGCGGACTACCAGTCGCACTCAAGGCCCCCAGTTTCAACGG >GQY1XT001BDDE9 AATGGTACCCGTCAATTCCTTTAATCTTGCGGGTCGTTTACGGCGTGGACTACCAGTCGCACTCCAGTTACACAGTTTCCAGAG >GQY1XT001CIUF3 AATGGTACCCGTCAATTCCTTTGATCTTGCGGGCCTTTACGGCGTGGACTACCAGGCGCCCTCCAGCCCGGCAGTTTCCAGTGCAGTCCCGGGGTT >GQY1XT001BKRP5 AATGGTACCCGTCAATTCATTTAATCTCTCCCCCTTTCCCCCCCCCCCCCTTTCCCCCCCCCCCCCTTTCCCCCCCCCC >GQY1XT001B44ZE AATGGTACCCGTCAATTCATTTAACCTTGCGGGGTTTTACCGCGTGGACTACCAGGCGCCCTCAAGAAGAACAGTTTTGAACGCAGCTATGGGTT >GQY1XT001CIW3P AATGGTACCCGTCAATTCATTTGACGTTGCCTCTCGTTTACTGCGTGGACTACCAGTCGCACTCAAGGCCCCCA >GQY1XT001A731D AATGGTACCCGTCAATTCATTTAACGTTGCCCCCGTTACTGCGTGGACTACCAGGGGCAATCAAGACTGCCA
48 When reads have different lengths they are trimmed to a fix length to make easier further processing (alignment and clustering). Primer: CCGTCAATTCMTTTRA Barcode: AATGGTAC Read pre-processing >GQY1XT001A6MUA AATGGTACCCGTCAATTCATTTGATCTTGCGGTTCGTTTACGGCGTGGACTACCAGTCGCACTCCAGTCATACAGTTTCCAATG >GQY1XT001BTRWS AATGGTACCCGTCAATTCCTTTGATCTTGCGGGCCGTTTACGGCGTGGACTACCAGTCGCACTCGAGCTGCACAGTTTCCAAAGCAGTTCCGGGGTTGGG >GQY1XT001AK4J0 TCTAGCCGCACAGTTTCAAAAGCACTCCCAGGGTT >GQY1XT001BBPBR AATGGTACCCGTCAATTCATTTGACGTTGCCCCCCGTTTACTGTGCGGACTACCAGTCGCACTCAAGGCCCCCAGTTTCAACGG >GQY1XT001BDDE9 AATGGTACCCGTCAATTCCTTTAATCTTGCGGGTCGTTTACGGCGTGGACTACCAGTCGCACTCCAGTTACACAGTTTCCAGAG >GQY1XT001CIUF3 AATGGTACCCGTCAATTCCTTTGATCTTGCGGGCCTTTACGGCGTGGACTACCAGGCGCCCTCCAGCCCGGCAGTTTCCAGTGCAGTCCCGGGGTT >GQY1XT001BKRP5 AATGGTACCCGTCAATTCATTTAATCTCTCCCCCTTTCCCCCCCCCCCCCTTTCCCCCCCCCCCCCTTTCCCCCCCCCC >GQY1XT001B44ZE AATGGTACCCGTCAATTCATTTAACCTTGCGGGGTTTTACCGCGTGGACTACCAGGCGCCCTCAAGAAGAACAGTTTTGAACGCAGCTATGGGTT >GQY1XT001CIW3P AATGGTACCCGTCAATTCATTTGACGTTGCCTCTCGTTTACTGCGTGGACTACCAGTCGCACTCAAGGCCCCCA >GQY1XT001A731D AATGGTACCCGTCAATTCATTTAACGTTGCCCCCGTTACTGCGTGGACTACCAGGGGCAATCAAGACTGCCA
49 When reads have different lengths they are trimmed to a fix length to make easier further processing (alignment and clustering). Primer: CCGTCAATTCMTTTRA Barcode: AATGGTAC Read pre-processing >GQY1XT001A6MUA AATGGTACCCGTCAATTCATTTGATCTTGCGGTTCGTTTACGGCGTGGACTACCAGTCGCACTCCAGTCATA >GQY1XT001BTRWS AATGGTACCCGTCAATTCCTTTGATCTTGCGGGCCGTTTACGGCGTGGACTACCAGTCGCACTCGAGCTGCA >GQY1XT001BBPBR AATGGTACCCGTCAATTCATTTGACGTTGCCCCCCGTTTACTGTGCGGACTACCAGTCGCACTCAAGGCCCC >GQY1XT001BDDE9 AATGGTACCCGTCAATTCCTTTAATCTTGCGGGTCGTTTACGGCGTGGACTACCAGTCGCACTCCAGTTACA >GQY1XT001CIUF3 AATGGTACCCGTCAATTCCTTTGATCTTGCGGGCCTTTACGGCGTGGACTACCAGGCGCCCTCCAGCCCGGC >GQY1XT001B44ZE AATGGTACCCGTCAATTCATTTAACCTTGCGGGGTTTTACCGCGTGGACTACCAGGCGCCCTCAAGAAGAAC >GQY1XT001CIW3P AATGGTACCCGTCAATTCATTTGACGTTGCCTCTCGTTTACTGCGTGGACTACCAGTCGCACTCAAGGCCCC >GQY1XT001A731D AATGGTACCCGTCAATTCATTTAACGTTGCCCCCGTTACTGCGTGGACTACCAGGGGCAATCAAGACTGCCA
50 Analysis pipeline These are the general steps shared by the most used metagenomics analysis tools: UPARSE, QIIME, MOTHUR, MICCA and AmpliTAXO Read pre-processing De-multiplexing De-replication Clustering of variants 1. Read pre-processing If reads are paired-end type (e.g. Illumina), an initial step consists of merging overlapping paired reads into single reads is required. Anomalous reads are removed and when reads have different lengths (e.g. 454) they are also trimmed to a fix length to make easier further processing (alignment and clustering). 2. De-multiplexing Organizes the multiplexed reads into amplicons (single PCR products) based on the different barcodes (primers) and tags (samples) used. 3. De-replication Redundant reads are annotated as unique sequences (variants) and their abundances (depths). 4. Clustering of variants Variants are clustered based on a user-defined similarity threshold. This step is crucial to group redundant sequences due to sequencing and PCR errors into unique variants that will be representative of single OTUs.
 and tags (samples) used.")
51 De-multiplexing Organizes the multiplexed reads into amplicons (single PCR products) based on the different barcodes (primers) and tags (samples) used. 1 Amplicon = 1 Sample
52 Analysis pipeline These are the general steps shared by the most used metagenomics analysis tools: UPARSE, QIIME, MOTHUR, MICCA and AmpliTAXO Read pre-processing De-multiplexing De-replication Clustering of variants 1. Read pre-processing If reads are paired-end type (e.g. Illumina), an initial step consists of merging overlapping paired reads into single reads is required. Anomalous reads are removed and when reads have different lengths (e.g. 454) they are also trimmed to a fix length to make easier further processing (alignment and clustering). 2. De-multiplexing Organizes the multiplexed reads into amplicons (single PCR products) based on the different barcodes (primers) and tags (samples) used. 3. De-replication Redundant reads are annotated as unique sequences (variants) and their abundances (depths). 4. Clustering of variants Variants are clustered based on a user-defined similarity threshold. This step is crucial to group redundant sequences due to sequencing and PCR errors into unique variants that will be representative of single OTUs.
53 De-replication Redundant reads are annotated as unique sequences (variants) and their abundances (depths). >GQY1XT001A6MUA AATGGTACCCGTCAATTCATTTGATCTTGCGGTTCGTTTACGGCGTGGACTACCAGTCGCACTCCAGTCATA >GQY1XT001BTRWS AATGGTACCCGTCAATTCCTTTGATCTTGCGGGCCGTTTACGGCGTGGACTACCAGTCGCACTCGAGCTGCA >GQY1XT001BBPBR AATGGTACCCGTCAATTCATTTGATCTTGCGGTTCGTTTACGGCGTGGACTACCAGTCGCACTCCAGTCATA >GQY1XT001BDDE9 AATGGTACCCGTCAATTCATTTGATCTTGCGGTTCGTTTACGGCGTGGACTACCAGTCGCACTCCAGTCATA >GQY1XT001CIUF3 AATGGTACCCGTCAATTCCTTTGATCTTGCGGGCCGTTTACGGCGTGGACTACCAGTCGCACTCGAGCTGCA >GQY1XT001B44ZE AATGGTACCCGTCAATTCATTTGATCTTGCGGTTCGTTTACGGCGTGGACTACCAGTCGCACTCCAGTCATA >GQY1XT001CIW3P AATGGTACCCGTCAATTCCTTTGATCTTGCGGGCCGTTTACGGCGTGGACTACCAGTCGCACTCGAGCTGCA >GQY1XT001A731D AATGGTACCCGTCAATTCATTTGATCTTGCGGTTCGTTTACGGCGTGGACTACCAGTCGCACTCCAGTCATA
54 De-replication Redundant reads are annotated as unique sequences (variants) and their abundances (depths). >GQY1XT001A6MUA AATGGTACCCGTCAATTCATTTGATCTTGCGGTTCGTTTACGGCGTGGACTACCAGTCGCACTCCAGTCATA >GQY1XT001BTRWS AATGGTACCCGTCAATTCCTTTGATCTTGCGGGCCGTTTACGGCGTGGACTACCAGTCGCACTCGAGCTGCA >GQY1XT001BBPBR AATGGTACCCGTCAATTCATTTGATCTTGCGGTTCGTTTACGGCGTGGACTACCAGTCGCACTCCAGTCATA >GQY1XT001BDDE9 AATGGTACCCGTCAATTCATTTGATCTTGCGGTTCGTTTACGGCGTGGACTACCAGTCGCACTCCAGTCATA >GQY1XT001CIUF3 AATGGTACCCGTCAATTCCTTTGATCTTGCGGGCCGTTTACGGCGTGGACTACCAGTCGCACTCGAGCTGCA >GQY1XT001B44ZE AATGGTACCCGTCAATTCATTTGATCTTGCGGTTCGTTTACGGCGTGGACTACCAGTCGCACTCCAGTCATA >GQY1XT001CIW3P AATGGTACCCGTCAATTCCTTTGATCTTGCGGGCCGTTTACGGCGTGGACTACCAGTCGCACTCGAGCTGCA >GQY1XT001A731D AATGGTACCCGTCAATTCATTTGATCTTGCGGTTCGTTTACGGCGTGGACTACCAGTCGCACTCCAGTCATA
55 De-replication Redundant reads are annotated as unique sequences (variants) and their abundances (depths). >GQY1XT001A6MUA DEPTH = 5 AATGGTACCCGTCAATTCATTTGATCTTGCGGTTCGTTTACGGCGTGGACTACCAGTCGCACTCCAGTCATA >GQY1XT001BTRWS DEPTH = 3 AATGGTACCCGTCAATTCCTTTGATCTTGCGGGCCGTTTACGGCGTGGACTACCAGTCGCACTCGAGCTGCA >GQY1XT001BBPBR AATGGTACCCGTCAATTCATTTGATCTTGCGGTTCGTTTACGGCGTGGACTACCAGTCGCACTCCAGTCATA >GQY1XT001BDDE9 AATGGTACCCGTCAATTCATTTGATCTTGCGGTTCGTTTACGGCGTGGACTACCAGTCGCACTCCAGTCATA >GQY1XT001CIUF3 AATGGTACCCGTCAATTCCTTTGATCTTGCGGGCCGTTTACGGCGTGGACTACCAGTCGCACTCGAGCTGCA >GQY1XT001B44ZE AATGGTACCCGTCAATTCATTTGATCTTGCGGTTCGTTTACGGCGTGGACTACCAGTCGCACTCCAGTCATA >GQY1XT001CIW3P AATGGTACCCGTCAATTCCTTTGATCTTGCGGGCCGTTTACGGCGTGGACTACCAGTCGCACTCGAGCTGCA >GQY1XT001A731D AATGGTACCCGTCAATTCATTTGATCTTGCGGTTCGTTTACGGCGTGGACTACCAGTCGCACTCCAGTCATA
56 Analysis pipeline These are the general steps shared by the most used metagenomics analysis tools: UPARSE, QIIME, MOTHUR, MICCA and AmpliTAXO Read pre-processing De-multiplexing De-replication Clustering of variants 1. Read pre-processing If reads are paired-end type (e.g. Illumina), an initial step consists of merging overlapping paired reads into single reads is required. Anomalous reads are removed and when reads have different lengths (e.g. 454) they are also trimmed to a fix length to make easier further processing (alignment and clustering). 2. De-multiplexing Organizes the multiplexed reads into amplicons (single PCR products) based on the different barcodes (primers) and tags (samples) used. 3. De-replication Redundant reads are annotated as unique sequences (variants) and their abundances (depths). 4. Clustering of variants Variants are clustered based on a user-defined similarity threshold. This step is crucial to group redundant sequences due to sequencing and PCR errors into unique variants that will be representative of single OTUs.
57 Clustering of variants Variants are clustered based on a user-defined similarity threshold. This step is crucial to group redundant sequences due to sequencing and PCR errors into unique variants that will be representative of single OTUs. >*S TACGTTTATCGCGTT-AGCTTCGCCAAGCACAGCATCCTGCGCTTAGCCAACGTACATCGTTTAGGGTGTGGACTAA >#S TACGTTTATCGCGTTTAGCTTCGCCAAGCACAGCATCCTGCGCTTAGCCAACGTACATCGTTTAGGGTGTGGACTAA >#S TACGTTTATCGCGTT-AGCTTCGCCAAGCACAGCATCCTGCGCTTAGCCAACGTACATCGT-TAGGGTGTGGACTAA >#S TACGTTTATCGCATT-AGCTTCGCCAAGCACAGCATCCTGCGCTTAGCCAACGTACATCGTTTAGG-TGTGGACTAA >*S GGCACTTAAAGCGTTAGCTACGGCGCAGAAACCACGGGTGG-CCCCCACACCTAGTGCCCAACGTTTACAGCGTGGT >#S GGCACTTAAAGCGTTAGCTACGGCGCAGAAACCACGGGTGGTCCCCCACACCTAGTGCCCAACGTTTACAGCGTGGG >#S GGCACTTAAAGCGTTAGCTACGGCGCAGAAACCACGGGTGG-CCCCCACACCTAGTGC-CAACGTTTACAGCGTGGT >*S TCGACTTAACGCGTTAGCTCCGGAAGCCACGCCTCAAGG-GCACAACCTCCAAGTCGACATCGTTTACGGCGTGGAT >#S TCGACTTAACGCGTTAGCTCCGGAAGCCACGCCTCAAGG-GCACAACCTCCAAGTCGACATCGT-TACGGCGTGGAT >#S TCGACTTAACGCGTTAGCTCCGGAAGCCACGCCTCAAGGGGCACAACCTCCAAGTCGACATCGTTTACGGCGTGGAT
58 Clustering of variants Variants are clustered based on a user-defined similarity threshold. This step is crucial to group redundant sequences due to sequencing and PCR errors into unique variants that will be representative of single OTUs. >*S TACGTTTATCGCGTT-AGCTTCGCCAAGCACAGCATCCTGCGCTTAGCCAACGTACATCGTTTAGGGTGTGGACTAA >#S TACGTTTATCGCGTTTAGCTTCGCCAAGCACAGCATCCTGCGCTTAGCCAACGTACATCGTTTAGGGTGTGGACTAA >#S TACGTTTATCGCGTT-AGCTTCGCCAAGCACAGCATCCTGCGCTTAGCCAACGTACATCGT-TAGGGTGTGGACTAA >#S TACGTTTATCGCATT-AGCTTCGCCAAGCACAGCATCCTGCGCTTAGCCAACGTACATCGTTTAGG-TGTGGACTAA >*S GGCACTTAAAGCGTTAGCTACGGCGCAGAAACCACGGGTGG-CCCCCACACCTAGTGCCCAACGTTTACAGCGTGGT >#S GGCACTTAAAGCGTTAGCTACGGCGCAGAAACCACGGGTGGTCCCCCACACCTAGTGCCCAACGTTTACAGCGTGGG >#S GGCACTTAAAGCGTTAGCTACGGCGCAGAAACCACGGGTGG-CCCCCACACCTAGTGC-CAACGTTTACAGCGTGGT >*S TCGACTTAACGCGTTAGCTCCGGAAGCCACGCCTCAAGG-GCACAACCTCCAAGTCGACATCGTTTACGGCGTGGAT >#S TCGACTTAACGCGTTAGCTCCGGAAGCCACGCCTCAAGG-GCACAACCTCCAAGTCGACATCGT-TACGGCGTGGAT >#S TCGACTTAACGCGTTAGCTCCGGAAGCCACGCCTCAAGGGGCACAACCTCCAAGTCGACATCGTTTACGGCGTGGAT
59 Clustering of variants Variants are clustered based on a user-defined similarity threshold. This step is crucial to group redundant sequences due to sequencing and PCR errors into unique variants that will be representative of single OTUs. >*S TACGTTTATCGCGTT-AGCTTCGCCAAGCACAGCATCCTGCGCTTAGCCAACGTACATCGTTTAGGGTGTGGACTAA >#S TACGTTTATCGCGTTTAGCTTCGCCAAGCACAGCATCCTGCGCTTAGCCAACGTACATCGTTTAGGGTGTGGACTAA >#S TACGTTTATCGCGTT-AGCTTCGCCAAGCACAGCATCCTGCGCTTAGCCAACGTACATCGT-TAGGGTGTGGACTAA >#S TACGTTTATCGCATT-AGCTTCGCCAAGCACAGCATCCTGCGCTTAGCCAACGTACATCGTTTAGG-TGTGGACTAA >*S GGCACTTAAAGCGTTAGCTACGGCGCAGAAACCACGGGTGG-CCCCCACACCTAGTGCCCAACGTTTACAGCGTGGT >#S GGCACTTAAAGCGTTAGCTACGGCGCAGAAACCACGGGTGGTCCCCCACACCTAGTGCCCAACGTTTACAGCGTGGG >#S GGCACTTAAAGCGTTAGCTACGGCGCAGAAACCACGGGTGG-CCCCCACACCTAGTGC-CAACGTTTACAGCGTGGT >*S TCGACTTAACGCGTTAGCTCCGGAAGCCACGCCTCAAGG-GCACAACCTCCAAGTCGACATCGTTTACGGCGTGGAT >#S TCGACTTAACGCGTTAGCTCCGGAAGCCACGCCTCAAGG-GCACAACCTCCAAGTCGACATCGT-TACGGCGTGGAT >#S TCGACTTAACGCGTTAGCTCCGGAAGCCACGCCTCAAGGGGCACAACCTCCAAGTCGACATCGTTTACGGCGTGGAT
60 Clustering of variants Variants are clustered based on a user-defined similarity threshold. This step is crucial to group redundant sequences due to sequencing and PCR errors into unique variants that will be representative of single OTUs. >*S DEPTH + 3 TACGTTTATCGCGTT-AGCTTCGCCAAGCACAGCATCCTGCGCTTAGCCAACGTACATCGTTTAGGGTGTGGACTAA >*S DEPTH + 2 GGCACTTAAAGCGTTAGCTACGGCGCAGAAACCACGGGTGG-CCCCCACACCTAGTGCCCAACGTTTACAGCGTGGT >*S DEPTH + 2 TCGACTTAACGCGTTAGCTCCGGAAGCCACGCCTCAAGG-GCACAACCTCCAAGTCGACATCGTTTACGGCGTGGAT >#S TACGTTTATCGCGTTTAGCTTCGCCAAGCACAGCATCCTGCGCTTAGCCAACGTACATCGTTTAGGGTGTGGACTAA >#S TACGTTTATCGCGTT-AGCTTCGCCAAGCACAGCATCCTGCGCTTAGCCAACGTACATCGT-TAGGGTGTGGACTAA >#S TACGTTTATCGCATT-AGCTTCGCCAAGCACAGCATCCTGCGCTTAGCCAACGTACATCGTTTAGG-TGTGGACTAA >#S GGCACTTAAAGCGTTAGCTACGGCGCAGAAACCACGGGTGGTCCCCCACACCTAGTGCCCAACGTTTACAGCGTGGG >#S GGCACTTAAAGCGTTAGCTACGGCGCAGAAACCACGGGTGG-CCCCCACACCTAGTGC-CAACGTTTACAGCGTGGT >#S TCGACTTAACGCGTTAGCTCCGGAAGCCACGCCTCAAGG-GCACAACCTCCAAGTCGACATCGT-TACGGCGTGGAT >#S TCGACTTAACGCGTTAGCTCCGGAAGCCACGCCTCAAGGGGCACAACCTCCAAGTCGACATCGTTTACGGCGTGGAT
61 Analysis pipeline These are the general steps shared by the most used metagenomics analysis tools: UPARSE, QIIME, MOTHUR and AmpliTAXO Filtering of artefacts Alignment to references Taxonomy annotation Downstream analysis 5. Filtering of artefacts Detection and removal of artefactual variants left after clustering: chimeras, contaminants, PCR errors 6. Alignment to references Clustered variants (OTUs) are aligned against a database of reference sequences, e.g. Greengenes, SILVA 7. Taxonomy annotation Taxonomy annotations from databases will be assigned to OTUs. In an ideal scenario, each OTU will correspond to a unique species taxonomy assignment. 8. Downstream analysis OTU table and taxonomy results can be subject of further analyses: alpha diversity measurements and rarefaction plots, beta diversity and ordination plots, taxonomy heatmaps
62 Filtering of artefacts Detection and removal of artefactual variants left after clustering: chimeras, contaminants >*16S depth=44 freq=2.42 TTCAGTCGCTCCCCTAGCTTTCGCACTTCAGCGTCAGTTGCCGTCCAGTGAACTATCTTCATCATCGGCATT CCTGCACATATCTACGAATTTCACCTCTACTCGTGCAGTTCCGTCCACCTCTCCAGCACTCTAGCCAAACAG >*16S depth=33 freq=1.82 TTCAATGTTTGCTCCCCACGCTTTCGAGCCTCAGCGTCAGTTACAAGCCAGAGAGCCGCTTTCGCCACCGGT GTTCCTCCATATATCTACGCATTTCACCGCTACACATGGAATTCCACTCTCCCCTCTTGCACTCAAGTTAAA >*16S depth=32 freq=1.76 TTCACGATACCCGCACCTTCGAGCTTAAGCGTCAGTGGCGCTCCCGTCAGCTGCCTTCGCAATCGGAGTTCT TCGTCATATCTAAGCATTTCACCGCTACACGACGAATTCCGCCAACGTTGTGCGTACTCAAGGAAACCAGTA >*16S depth=15 freq=0.83 TTCAACGTTCGCTCCCCTGGCTTTCGCGCCTCAGCGTCAGTTTTCGTCCAGAAAGTCGCCTTCGCCACTGGT GTTCTTCCTAATATCTACGCATTTCACCGCTACACTAGGAATTCCACTTTCCTCTCCGATACTCTAGATTGG >#16S depth=12 freq=0.66 TTCAGTCGCTCCCCTAGCTTTCGCACTTCAGCGTCAGTTGCCGTAAGCCAGAGAGCCGCTTTCGCCACCGGT GTTCCTCCATATATCTACGCATTTCACCGCTACACATGGAATTCCACTCTCCCCTCTTGCACTCAAGTTAAA >*16S depth=10 freq=0.55 TTTAGTCCTGTTCGCTCCCCACGCTTTCGCTCCTCAGCGTCAGTAACGGCCCAGAGACCCGCCTTCGCCACC GGTGTTCTTCCTGATATCTGCGCATTCCACCGCTACACCAGGAGTTCCAGCCTCCCCTACCGCACTCAAGCC >#16S depth=2 freq=0.11 TTCACGATACCCACGCTTTCGAGCATCAGCGTCAGTTGCGCTACAGTAAGCTGCCTTCGCAATCGGAGTTCT TCGTGATATCTAAGCATTTCACCGCTACACCACGAATTCCGCCTACTTTCGGCGCACTCAAGCCCCCCAGTT >#16S depth=1 freq=0.06 TTCAACGTTCGCTCCCCTGGCTTTCGCGCCTCAGCGTCAGTTTTCGTCCAGAAAGTCGCCTTCGCCACTGGT GTTCTTCCTAATATCTACGCATTTCACCGCTACACTAGGAATTCCACTTTCCTCTCCGATACTCTAGATCAG
63 Filtering of artefacts Detection and removal of artefactual variants left after clustering: chimeras, contaminants >*16S depth=44 freq=2.42 TTCAGTCGCTCCCCTAGCTTTCGCACTTCAGCGTCAGTTGCCGTCCAGTGAACTATCTTCATCATCGGCATT CCTGCACATATCTACGAATTTCACCTCTACTCGTGCAGTTCCGTCCACCTCTCCAGCACTCTAGCCAAACAG >*16S depth=33 freq=1.82 TTCAATGTTTGCTCCCCACGCTTTCGAGCCTCAGCGTCAGTTACAAGCCAGAGAGCCGCTTTCGCCACCGGT GTTCCTCCATATATCTACGCATTTCACCGCTACACATGGAATTCCACTCTCCCCTCTTGCACTCAAGTTAAA >*16S depth=32 freq=1.76 TTCACGATACCCGCACCTTCGAGCTTAAGCGTCAGTGGCGCTCCCGTCAGCTGCCTTCGCAATCGGAGTTCT TCGTCATATCTAAGCATTTCACCGCTACACGACGAATTCCGCCAACGTTGTGCGTACTCAAGGAAACCAGTA >*16S depth=15 freq=0.83 TTCAACGTTCGCTCCCCTGGCTTTCGCGCCTCAGCGTCAGTTTTCGTCCAGAAAGTCGCCTTCGCCACTGGT GTTCTTCCTAATATCTACGCATTTCACCGCTACACTAGGAATTCCACTTTCCTCTCCGATACTCTAGATTGG >#16S depth=12 freq=0.66 TTCAGTCGCTCCCCTAGCTTTCGCACTTCAGCGTCAGTTGCCGTAAGCCAGAGAGCCGCTTTCGCCACCGGT GTTCCTCCATATATCTACGCATTTCACCGCTACACATGGAATTCCACTCTCCCCTCTTGCACTCAAGTTAAA >*16S depth=10 freq=0.55 TTTAGTCCTGTTCGCTCCCCACGCTTTCGCTCCTCAGCGTCAGTAACGGCCCAGAGACCCGCCTTCGCCACC GGTGTTCTTCCTGATATCTGCGCATTCCACCGCTACACCAGGAGTTCCAGCCTCCCCTACCGCACTCAAGCC >#16S depth=2 freq=0.11 TTCACGATACCCACGCTTTCGAGCATCAGCGTCAGTTGCGCTACAGTAAGCTGCCTTCGCAATCGGAGTTCT TCGTGATATCTAAGCATTTCACCGCTACACCACGAATTCCGCCTACTTTCGGCGCACTCAAGCCCCCCAGTT >#16S depth=1 freq=0.06 TTCAACGTTCGCTCCCCTGGCTTTCGCGCCTCAGCGTCAGTTTTCGTCCAGAAAGTCGCCTTCGCCACTGGT GTTCTTCCTAATATCTACGCATTTCACCGCTACACTAGGAATTCCACTTTCCTCTCCGATACTCTAGATCAG
64 Filtering of artefacts Detection and removal of artefactual variants left after clustering: chimeras, contaminants >*16S depth=44 freq=2.42 TTCAGTCGCTCCCCTAGCTTTCGCACTTCAGCGTCAGTTGCCGTCCAGTGAACTATCTTCATCATCGGCATT CCTGCACATATCTACGAATTTCACCTCTACTCGTGCAGTTCCGTCCACCTCTCCAGCACTCTAGCCAAACAG >*16S depth=33 freq=1.82 TTCAATGTTTGCTCCCCACGCTTTCGAGCCTCAGCGTCAGTTACAAGCCAGAGAGCCGCTTTCGCCACCGGT GTTCCTCCATATATCTACGCATTTCACCGCTACACATGGAATTCCACTCTCCCCTCTTGCACTCAAGTTAAA >*16S depth=32 freq=1.76 TTCACGATACCCGCACCTTCGAGCTTAAGCGTCAGTGGCGCTCCCGTCAGCTGCCTTCGCAATCGGAGTTCT TCGTCATATCTAAGCATTTCACCGCTACACGACGAATTCCGCCAACGTTGTGCGTACTCAAGGAAACCAGTA >*16S depth=15 freq=0.83 TTCAACGTTCGCTCCCCTGGCTTTCGCGCCTCAGCGTCAGTTTTCGTCCAGAAAGTCGCCTTCGCCACTGGT GTTCTTCCTAATATCTACGCATTTCACCGCTACACTAGGAATTCCACTTTCCTCTCCGATACTCTAGATTGG >#16S depth=12 freq=0.66 Chimera TTCAGTCGCTCCCCTAGCTTTCGCACTTCAGCGTCAGTTGCCGTAAGCCAGAGAGCCGCTTTCGCCACCGGT GTTCCTCCATATATCTACGCATTTCACCGCTACACATGGAATTCCACTCTCCCCTCTTGCACTCAAGTTAAA >*16S depth=10 freq=0.55 TTTAGTCCTGTTCGCTCCCCACGCTTTCGCTCCTCAGCGTCAGTAACGGCCCAGAGACCCGCCTTCGCCACC GGTGTTCTTCCTGATATCTGCGCATTCCACCGCTACACCAGGAGTTCCAGCCTCCCCTACCGCACTCAAGCC >#16S depth=2 freq=0.11 Contaminations TTCACGATACCCACGCTTTCGAGCATCAGCGTCAGTTGCGCTACAGTAAGCTGCCTTCGCAATCGGAGTTCT TCGTGATATCTAAGCATTTCACCGCTACACCACGAATTCCGCCTACTTTCGGCGCACTCAAGCCCCCCAGTT >#16S depth=1 freq=0.06 TTCAACGTTCGCTCCCCTGGCTTTCGCGCCTCAGCGTCAGTTTTCGTCCAGAAAGTCGCCTTCGCCACTGGT GTTCTTCCTAATATCTACGCATTTCACCGCTACACTAGGAATTCCACTTTCCTCTCCGATACTCTAGATCAG
65 Analysis pipeline These are the general steps shared by the most used metagenomics analysis tools: UPARSE, QIIME, MOTHUR and AmpliTAXO Filtering of artefacts Alignment to references Taxonomy annotation Downstream analysis 5. Filtering of artefacts Detection and removal of artefactual variants left after clustering: chimeras, contaminants, PCR errors 6. Alignment to references Clustered variants (OTUs) are aligned against a database of reference sequences, e.g. Greengenes, SILVA 7. Taxonomy annotation Taxonomy annotations from databases will be assigned to OTUs. In an ideal scenario, each OTU will correspond to a unique species taxonomy assignment. 8. Downstream analysis OTU table and taxonomy results can be subject of further analyses: alpha diversity measurements and rarefaction plots, beta diversity and ordination plots, taxonomy heatmaps


66 Alignment to references After clustering and filtering variants, the retrieved OTUs are aligned against a database of reference sequences, e.g. Greengenes, SILVA >*16S depth=42 freq=2.31 TTCAACCTTGCGGTCGTACTCCCCAGGCGGAGTGCTTAATGCGTTAGCTGCGGCACTAAACCCCGGAAAGGGTCTAACACCTAGCACTCATCGTT TACGGCGTGGACTACCAGGGTATCTAATCCTGTTTGCTCCCCACGCTTTCGAGCCTCAGCGTCAGTTACAAGCCAGAGAGCCGCTTTCGCCACCG GTGTTCCTCCATATATCTACGCATTTCACCGCTACACATGGAATTCCACTCTCCCCTCTTGCACTCAAGTTAAACAGTTTCCAAAGCGTACTATG GTTAAGCCACAGCCTTTAACTTCAGACTTATCT >*16S depth=12 freq=0.66 TTCAGCCTTGCGGCCGTACTCCCCAGGCGGATTACTTATCGCATTCGCTTCGGCACAGACAGTCTTCCTGCCCACACCCAGTAATCATCGTTTAC GGCCGGGACTACCAGGGTATCTAATCCTGTTCGCTCCCCCGGCTTTCGCACTTCAGCGTCAGTTACCGTCCAGTGAACTATCTTCATCATCGGCA TTCCTGCACATATCTACGAATTTCACCTCTACTCGTGCAGTTCCGTCCACCTCTCCGGTACTCCAGCCTATCAGTTTCAAAGGCAGGCCTGCGGT TGAGCCGCAGGTTTTCACCCCTGACTTGAAAGG vs.
67 Alignment to references
68 Alignment to references Around 95-97% of identity is required in the alignment of an OTU sequence to a database reference
69 Analysis pipeline These are the general steps shared by the most used metagenomics analysis tools: UPARSE, QIIME, MOTHUR and AmpliTAXO Filtering of artefacts Alignment to references Taxonomy annotation Downstream analysis 5. Filtering of artefacts Detection and removal of artefactual variants left after clustering: chimeras, contaminants, PCR errors 6. Alignment to references Clustered variants (OTUs) are aligned against a database of reference sequences, e.g. Greengenes, SILVA 7. Taxonomy annotation Taxonomy annotations from databases will be assigned to OTUs. In an ideal scenario, each OTU will correspond to a unique species taxonomy assignment. 8. Downstream analysis OTU table and taxonomy results can be subject of further analyses: alpha diversity measurements and rarefaction plots, beta diversity and ordination plots, taxonomy heatmaps
70 Taxonomy annotation Taxonomy annotations from databases will be assigned to OTU sequences.

71 Taxonomy annotation In an ideal scenario, each OTU sequence will have a taxonomy assignment. OTU representative sequences OTU taxonomy assignments Samples and OTU frequencies
72 Analysis pipeline These are the general steps shared by the most used metagenomics analysis tools: UPARSE, QIIME, MOTHUR and AmpliTAXO Filtering of artefacts Alignment to references Taxonomy annotation Downstream analysis 5. Filtering of artefacts Detection and removal of artefactual variants left after clustering: chimeras, contaminants, PCR errors 6. Alignment to references Clustered variants (OTUs) are aligned against a database of reference sequences, e.g. Greengenes, SILVA 7. Taxonomy annotation Taxonomy annotations from databases will be assigned to OTUs. In an ideal scenario, each OTU will correspond to a unique species taxonomy assignment. 8. Downstream analysis OTU table and taxonomy results can be subject of further analyses: alpha diversity measurements and rarefaction plots, beta diversity and ordination plots, taxonomy heatmaps

73 Taxonomy summaries: Downstream analysis
74 Principal Coordinate Analysis (PCoA): Downstream analysis

75 Downstream analysis Alpha diversity measurements and rarefaction plots:
76 Interesting materials Materials from Strategies and Techniques for Analyzing Microbial Population Structure Course SSU Metagenomics (UPARSE) MOTHUR manual QIIME overview tutorial
77
CBC Data Therapy. Metagenomics Discussion
 CBC Data Therapy Metagenomics Discussion General Workflow Microbial sample Generate Metaomic data Process data (QC, etc.) Analysis Marker Genes Extract DNA Amplify with targeted primers Filter errors,
Introduction to taxonomic analysis of metagenomic amplicon and shotgun data with QIIME. Peter Sterk EBI Metagenomics Course 2014
 Introduction to taxonomic analysis of metagenomic amplicon and shotgun data with QIIME Peter Sterk EBI Metagenomics Course 2014 1 Taxonomic analysis using next-generation sequencing Objective we want to
dbcamplicons pipeline Amplicons
 dbcamplicons pipeline Amplicons Matthew L. Settles Genome Center Bioinformatics Core University of California, Davis settles@ucdavis.edu; bioinformatics.core@ucdavis.edu Microbial community analysis Goal:
dbcamplicons pipeline Amplicons
 dbcamplicons pipeline Amplicons Matthew L. Settles Genome Center Bioinformatics Core University of California, Davis settles@ucdavis.edu; bioinformatics.core@ucdavis.edu Microbial community analysis Goal:
Robert Edgar. Independent scientist
 Robert Edgar Independent scientist robert@drive5.com www.drive5.com Reads FASTQ format Millions of reads Many Gb USEARCH commands "UPARSE pipeline" OTU sequences FASTA format >Otu1 GATTAGCTCATTCGTA >Otu2
Applications of Next Generation Sequencing in Metagenomics Studies
 Applications of Next Generation Sequencing in Metagenomics Studies Francesca Rizzo, PhD Genomix4life Laboratory of Molecular Medicine and Genomics Department of Medicine and Surgery University of Salerno
Carl Woese. Used 16S rrna to develop a method to Identify any bacterium, and discovered a novel domain of life
 METAGENOMICS Carl Woese Used 16S rrna to develop a method to Identify any bacterium, and discovered a novel domain of life His amazing discovery, coupled with his solitary behaviour, made many contemporary
 choose MBL-REGISTER user: dm00834 password: dm00834 http://register.mbl.edu/ stamps.mbl.edu this uses the username and password on your STAMPS name badge Strategies for Analysis of Microbial Population
Carl Woese. Used 16S rrna to developed a method to Identify any bacterium, and discovered a novel domain of life
 METAGENOMICS Carl Woese Used 16S rrna to developed a method to Identify any bacterium, and discovered a novel domain of life His amazing discovery, coupled with his solitary behaviour, made many contemporary
Microbiomes and metabolomes
 Microbiomes and metabolomes Michael Inouye Baker Heart and Diabetes Institute Univ of Melbourne / Monash Univ Summer Institute in Statistical Genetics 2017 Integrative Genomics Module Seattle @minouye271
CM581A2: NEXT GENERATION SEQUENCING PLATFORMS AND LIBRARY GENERATION
 CM581A2: NEXT GENERATION SEQUENCING PLATFORMS AND LIBRARY GENERATION Fall 2015 Instructors: Coordinator: Carol Wilusz, Associate Professor MIP, CMB Instructor: Dan Sloan, Assistant Professor, Biology,
Sequencing techniques
 Sequencing techniques Workshop on Whole Genome Sequencing and Analysis, 2-4 Oct. 2017 Learning objective: After this lecture, you should be able to account for different techniques for whole genome sequencing
Introduction to metagenome assembly. Bas E. Dutilh Metagenomic Methods for Microbial Ecologists, NIOO September 18 th 2014
 Introduction to metagenome assembly Bas E. Dutilh Metagenomic Methods for Microbial Ecologists, NIOO September 18 th 2014 Sequencing specs* Method Read length Accuracy Million reads Time Cost per M 454
Infectious Disease Omics
 Infectious Disease Omics Metagenomics Ernest Diez Benavente LSHTM ernest.diezbenavente@lshtm.ac.uk Course outline What is metagenomics? In situ, culture-free genomic characterization of the taxonomic and
Lecture 7. Next-generation sequencing technologies
 Lecture 7 Next-generation sequencing technologies Next-generation sequencing technologies General principles of short-read NGS Construct a library of fragments Generate clonal template populations Massively
Experimental Design Microbial Sequencing
 Experimental Design Microbial Sequencing Matthew L. Settles Genome Center Bioinformatics Core University of California, Davis settles@ucdavis.edu; bioinformatics.core@ucdavis.edu General rules for preparing
Outline General NGS background and terms 11/14/2016 CONFLICT OF INTEREST. HLA region targeted enrichment. NGS library preparation methodologies
 Eric T. Weimer, PhD, D(ABMLI) Assistant Professor, Pathology & Laboratory Medicine, UNC School of Medicine Director, Molecular Immunology Associate Director, Clinical Flow Cytometry, HLA, and Immunology
ngs metagenomics target variation amplicon bioinformatics diagnostics dna trio indel high-throughput gene structural variation ChIP-seq mendelian
 Metagenomics T TM storage genetics assembly ncrna custom genotyping RNA-seq de novo mendelian ChIP-seq exome genomics indel ngs trio prediction metagenomics SNP resequencing bioinformatics diagnostics
What is metagenomics?
 Metagenomics What is metagenomics? Term first used in 1998 by Jo Handelsman "the application of modern genomics techniques to the study of communities of microbial organisms directly in their natural environments,
Joint RuminOmics/Rumen Microbial Genomics Network Workshop
 Joint RuminOmics/Rumen Microbial Genomics Network Workshop Microbiome analysis - Amplicon sequencing Dr. Sinéad Waters Animal and Bioscience Research Department, Teagasc Grange, Ireland Prof. Leluo Guan
Sequencing technologies. Jose Blanca COMAV institute bioinf.comav.upv.es
 Sequencing technologies Jose Blanca COMAV institute bioinf.comav.upv.es Outline Sequencing technologies: Sanger 2nd generation sequencing: 3er generation sequencing: 454 Illumina SOLiD Ion Torrent PacBio
NGS part 2: applications. Tobias Österlund
 NGS part 2: applications Tobias Österlund tobiaso@chalmers.se NGS part of the course Week 4 Friday 13/2 15.15-17.00 NGS lecture 1: Introduction to NGS, alignment, assembly Week 6 Thursday 26/2 08.00-09.45
Introduction to Microbial Sequencing
 Introduction to Microbial Sequencing Matthew L. Settles Genome Center Bioinformatics Core University of California, Davis settles@ucdavis.edu; bioinformatics.core@ucdavis.edu General rules for preparing
CBC Data Therapy. Metatranscriptomics Discussion
 CBC Data Therapy Metatranscriptomics Discussion Metatranscriptomics Extract RNA, subtract rrna Sequence cdna QC Gene expression, function Institute for Systems Genomics: Computational Biology Core bioinformatics.uconn.edu
Contact us for more information and a quotation
 GenePool Information Sheet #1 Installed Sequencing Technologies in the GenePool The GenePool offers sequencing service on three platforms: Sanger (dideoxy) sequencing on ABI 3730 instruments Illumina SOLEXA
NEXT GENERATION SEQUENCING. Farhat Habib
 NEXT GENERATION SEQUENCING HISTORY HISTORY Sanger Dominant for last ~30 years 1000bp longest read Based on primers so not good for repetitive or SNPs sites HISTORY Sanger Dominant for last ~30 years 1000bp
DATA FORMATS AND QUALITY CONTROL
 HTS Summer School 12-16th September 2016 DATA FORMATS AND QUALITY CONTROL Romina Petersen, University of Cambridge (rp520@medschl.cam.ac.uk) Luigi Grassi, University of Cambridge (lg490@medschl.cam.ac.uk)
Sequencing technologies. Jose Blanca COMAV institute bioinf.comav.upv.es
 Sequencing technologies Jose Blanca COMAV institute bioinf.comav.upv.es Outline Sequencing technologies: Sanger 2nd generation sequencing: 3er generation sequencing: 454 Illumina SOLiD Ion Torrent PacBio
mothur tutorial STAMPS, 2013 Kevin R. Theis Department of Zoology BEACON Center for the Study of Evolution in Action Michigan State University
 mothur tutorial STAMPS, 2013 Kevin R. Theis Department of Zoology BEACON Center for the Study of Evolution in Action Michigan State University mothur Mission to develop a single piece of open-source, expandable
mothur Workshop for Amplicon Analysis Michigan State University, 2013
 mothur Workshop for Amplicon Analysis Michigan State University, 2013 Tracy Teal MMG / ICER tkteal@msu.edu Kevin Theis Zoology / BEACON theiskev@msu.edu mothur Mission to develop a single piece of open-source,
Matthew Tinning Australian Genome Research Facility. July 2012
 Next-Generation Sequencing: an overview of technologies and applications Matthew Tinning Australian Genome Research Facility July 2012 History of Sequencing Where have we been? 1869 Discovery of DNA 1909
Welcome to the NGS webinar series
 Welcome to the NGS webinar series Webinar 1 NGS: Introduction to technology, and applications NGS Technology Webinar 2 Targeted NGS for Cancer Research NGS in cancer Webinar 3 NGS: Data analysis for genetic
Introduction to OTU Clustering. Susan Huse August 4, 2016
 Introduction to OTU Clustering Susan Huse August 4, 2016 What is an OTU? Operational Taxonomic Units a.k.a. phylotypes a.k.a. clusters aggregations of reads based only on sequence similarity, independent
Mate-pair library data improves genome assembly
 De Novo Sequencing on the Ion Torrent PGM APPLICATION NOTE Mate-pair library data improves genome assembly Highly accurate PGM data allows for de Novo Sequencing and Assembly For a draft assembly, generate
Metagenomics Computational Genomics
 Metagenomics 02-710 Computational Genomics Metagenomics Investigation of the microbes that inhabit oceans, soils, and the human body, etc. with sequencing technologies Cooperative interactions between
Incorporating Molecular ID Technology. Accel-NGS 2S MID Indexing Kits
 Incorporating Molecular ID Technology Accel-NGS 2S MID Indexing Kits Molecular Identifiers (MIDs) MIDs are indices used to label unique library molecules MIDs can assess duplicate molecules in sequencing
Next Gen Sequencing. Expansion of sequencing technology. Contents
 Next Gen Sequencing Contents 1 Expansion of sequencing technology 2 The Next Generation of Sequencing: High-Throughput Technologies 3 High Throughput Sequencing Applied to Genome Sequencing (TEDed CC BY-NC-ND
Sequencing technologies. Jose Blanca COMAV institute bioinf.comav.upv.es
 Sequencing technologies Jose Blanca COMAV institute bioinf.comav.upv.es Outline Sequencing technologies: Sanger 2nd generation sequencing: 3er generation sequencing: 454 Illumina SOLiD Ion Torrent PacBio
Experimental Design. Dr. Matthew L. Settles. Genome Center University of California, Davis
 Experimental Design Dr. Matthew L. Settles Genome Center University of California, Davis settles@ucdavis.edu What is Differential Expression Differential expression analysis means taking normalized sequencing
DNA. bioinformatics. genomics. personalized. variation NGS. trio. custom. assembly gene. tumor-normal. de novo. structural variation indel.
 DNA Sequencing T TM variation DNA amplicon mendelian trio genomics NGS bioinformatics tumor-normal custom SNP resequencing target validation de novo prediction personalized comparative genomics exome private
Next-Generation Sequencing. Technologies
 Next-Generation Next-Generation Sequencing Technologies Sequencing Technologies Nicholas E. Navin, Ph.D. MD Anderson Cancer Center Dept. Genetics Dept. Bioinformatics Introduction to Bioinformatics GS011062
Development of NGS metabarcoding. characterization of aerobiological samples. Lucia Muggia
 Development of NGS metabarcoding for the characterization of aerobiological samples Lucia Muggia Alberto Pallavicini, Elisa Banchi, Claudio G. Ametrano, David Stankovic, Silvia Ongaro, Enrico Tordoni,
Conducting Microbiome study, a How to guide
 Conducting Microbiome study, a How to guide Sam Zhu Supervisor: Professor Margaret IP Joint Graduate Seminar Department of Microbiology 15 December 2015 Why study Microbiome? ü Essential component, e.g.
COMPARING MICROBIAL COMMUNITY RESULTS FROM DIFFERENT SEQUENCING TECHNOLOGIES
 COMPARING MICROBIAL COMMUNITY RESULTS FROM DIFFERENT SEQUENCING TECHNOLOGIES Tyler Bradley * Jacob R. Price * Christopher M. Sales * * Department of Civil, Architectural, and Environmental Engineering,
BST 226 Statistical Methods for Bioinformatics David M. Rocke. March 10, 2014 BST 226 Statistical Methods for Bioinformatics 1
 BST 226 Statistical Methods for Bioinformatics David M. Rocke March 10, 2014 BST 226 Statistical Methods for Bioinformatics 1 NGS Technologies Illumina Sequencing HiSeq 2500 & MiSeq PacBio Sequencing PacBio
Next-generation sequencing technologies
 Next-generation sequencing technologies NGS applications Illumina sequencing workflow Overview Sequencing by ligation Short-read NGS Sequencing by synthesis Illumina NGS Single-molecule approach Long-read
Microbiome: Metagenomics 4/4/2018
 Microbiome: Metagenomics 4/4/2018 metagenomics is an extension of many things you have already learned! Genomics used to be computationally difficult, and now that s metagenomics! Still developing tools/algorithms
NGS in Pathology Webinar
 NGS in Pathology Webinar NGS Data Analysis March 10 2016 1 Topics for today s presentation 2 Introduction Next Generation Sequencing (NGS) is becoming a common and versatile tool for biological and medical
QIAseq Targeted Panel Analysis Plugin USER MANUAL
 QIAseq Targeted Panel Analysis Plugin USER MANUAL User manual for QIAseq Targeted Panel Analysis 1.1 Windows, macos and Linux June 18, 2018 This software is for research purposes only. QIAGEN Aarhus Silkeborgvej
Parts of a standard FastQC report
 FastQC FastQC, written by Simon Andrews of Babraham Bioinformatics, is a very popular tool used to provide an overview of basic quality control metrics for raw next generation sequencing data. There are
Data Basics. Josef K Vogt Slides by: Simon Rasmussen Next Generation Sequencing Analysis
 Data Basics Josef K Vogt Slides by: Simon Rasmussen 2017 Generalized NGS analysis Sample prep & Sequencing Data size Main data reductive steps SNPs, genes, regions Application Assembly: Compare Raw Pre-
Genomic resources. for non-model systems
 Genomic resources for non-model systems 1 Genomic resources Whole genome sequencing reference genome sequence comparisons across species identify signatures of natural selection population-level resequencing
Next-generation sequencing and quality control: An introduction 2016
 Next-generation sequencing and quality control: An introduction 2016 s.schmeier@massey.ac.nz http://sschmeier.com/bioinf-workshop/ Overview Typical workflow of a genomics experiment Genome versus transcriptome
Next Generation Sequencing. Tobias Österlund
 Next Generation Sequencing Tobias Österlund tobiaso@chalmers.se NGS part of the course Week 4 Friday 13/2 15.15-17.00 NGS lecture 1: Introduction to NGS, alignment, assembly Week 6 Thursday 26/2 08.00-09.45
Genome annotation & EST
 Genome annotation & EST What is genome annotation? The process of taking the raw DNA sequence produced by the genome sequence projects and adding the layers of analysis and interpretation necessary
Next- gen sequencing. STAMPS 2015 Hilary G. Morrison Joe Vineis, Nora Downey, Be>e Hecox- Lea, Kim Finnegan
 Next- gen sequencing STAMPS 2015 Hilary G. Morrison Joe Vineis, Nora Downey, Be>e Hecox- Lea, Kim Finnegan QuesIons What is the difference between standard and next- gen sequencing? How is next- gen sequencing
Novel methods for RNA and DNA- Seq analysis using SMART Technology. Andrew Farmer, D. Phil. Vice President, R&D Clontech Laboratories, Inc.
 Novel methods for RNA and DNA- Seq analysis using SMART Technology Andrew Farmer, D. Phil. Vice President, R&D Clontech Laboratories, Inc. Agenda Enabling Single Cell RNA-Seq using SMART Technology SMART
15:30-16:15 Sean Prosser New Developments for Natural History Collection Barcoding. DNA Barcoding Natural History Collections
 15:30-16:15 Sean Prosser New Developments for Natural History Collection Barcoding DNA Barcoding Natural History Collections Recap Barcoding Museum Specimens Age Target Amplicons Final Sequence Length
Quality Filtering of Illumina Sequences. Susan Huse Brown University August 6, 2015
 Quality Filtering of Illumina Sequences Susan Huse Brown University August 6, 2015 Illumina FASTQ Files File naming: NA10831_ATCACG_L002_R1_001.fastq.gz FA1_S1_L001_R1_001.fastq.gz Sample_Barcode/Index_Lane_Read#_Set#.fastq.gz
Microbiomics I August 24th, Introduction. Robert Kraaij, PhD Erasmus MC, Internal Medicine
 Microbiomics I August 24th, 2017 Introduction Robert Kraaij, PhD Erasmus MC, Internal Medicine r.kraaij@erasmusmc.nl Welcome to Microbiomics I Infection & Immunity MSc students Only first day no practicals
Introductie en Toepassingen van Next-Generation Sequencing in de Klinische Virologie. Sander van Boheemen Medical Microbiology
 Introductie en Toepassingen van Next-Generation Sequencing in de Klinische Virologie Sander van Boheemen Medical Microbiology Next-generation sequencing Next-generation sequencing (NGS), also known as
Microbiome Analysis. Research Day 2012 Ranjit Kumar
 Microbiome Analysis Research Day 2012 Ranjit Kumar Human Microbiome Microorganisms Bad or good? Human colon contains up to 100 trillion bacteria. Human microbiome - The community of bacteria that live
NEXT GENERATION SEQUENCING Whole Gene Sequencing
 NEXT GENERATION SEQUENCING Whole Gene Sequencing Ingrid Faé Educational Session 3: Next generation sequencing Stockholm, Friday, June 27 th 2014 Department for Blood Group Serology and Transfusion Medicine
Nature Biotechnology: doi: /nbt Supplementary Figure 1. MBQC base beta diversity, major protocol variables, and taxonomic profiles.
 Supplementary Figure 1 MBQC base beta diversity, major protocol variables, and taxonomic profiles. A) Multidimensional scaling of MBQC sample Bray-Curtis dissimilarities (see Fig. 1). Labels indicate centroids
DNA concentration and purity were initially measured by NanoDrop 2000 and verified on Qubit 2.0 Fluorometer.
 DNA Preparation and QC Extraction DNA was extracted from whole blood or flash frozen post-mortem tissue using a DNA mini kit (QIAmp #51104 and QIAmp#51404, respectively) following the manufacturer s recommendations.
SO YOU WANT TO DO A: RNA-SEQ EXPERIMENT MATT SETTLES, PHD UNIVERSITY OF CALIFORNIA, DAVIS
 SO YOU WANT TO DO A: RNA-SEQ EXPERIMENT MATT SETTLES, PHD UNIVERSITY OF CALIFORNIA, DAVIS SETTLES@UCDAVIS.EDU Bioinformatics Core Genome Center UC Davis BIOINFORMATICS.UCDAVIS.EDU DISCLAIMER This talk/workshop
I AM NOT A METAGENOMIC EXPERT. I am merely the MESSENGER. Blaise T.F. Alako, PhD EBI Ambassador
 I AM NOT A METAGENOMIC EXPERT I am merely the MESSENGER Blaise T.F. Alako, PhD EBI Ambassador blaise@ebi.ac.uk Hubert Denise Alex Mitchell Peter Sterk Sarah Hunter http://www.ebi.ac.uk/metagenomics Blaise
Introductory Next Gen Workshop
 Introductory Next Gen Workshop http://www.illumina.ucr.edu/ http://www.genomics.ucr.edu/ Workshop Objectives Workshop aimed at those who are new to Illumina sequencing and will provide: - a basic overview
Information on barcode decoding
 Information on barcode decoding The Bioneer version 1.0 haploid deletion library (Bioneer catalog number M-1030H) was supplied as glycerol frozen stocks in thirty-one 96-well plates. According to the information
Read Quality Assessment & Improvement. UCD Genome Center Bioinformatics Core Tuesday 14 June 2016
 Read Quality Assessment & Improvement UCD Genome Center Bioinformatics Core Tuesday 14 June 2016 QA&I should be interactive Error modes Each technology has unique error modes, depending on the physico-chemical
Module 6 Microbial Genetics. Chapter 8
 Module 6 Microbial Genetics Chapter 8 Structure and function of the genetic material Genetics science of o Study of what genes are, how they determine the characteristics of an organism, how they carry
TREE CODE PRODUCT BROCHURE
 TREE CODE PRODUCT BROCHURE Single Molecule, Real-Time (SMRT) Sequencing technology offers: Long read sequencing ~10 Gb with 20 kb average read lengths for WGS ~20 Gb with 40 kb average read length for
Francisco García Quality Control for NGS Raw Data
 Contents Data formats Sequence capture Fasta and fastq formats Sequence quality encoding Quality Control Evaluation of sequence quality Quality control tools Identification of artifacts & filtering Practical
RNA-Seq data analysis course September 7-9, 2015
 RNA-Seq data analysis course September 7-9, 2015 Peter-Bram t Hoen (LUMC) Jan Oosting (LUMC) Celia van Gelder, Jacintha Valk (BioSB) Anita Remmelzwaal (LUMC) Expression profiling DNA mrna protein Comprehensive
Using New ThiNGS on Small Things. Shane Byrne
 Using New ThiNGS on Small Things Shane Byrne Next Generation Sequencing New Things Small Things NGS Next Generation Sequencing = 2 nd generation of sequencing 454 GS FLX, SOLiD, GAIIx, HiSeq, MiSeq, Ion
SCGC Service Description For further information, go to scgc.bigelow.org Updated June 1, 2018
 SCGC Service Description For further information, go to scgc.bigelow.org Updated June 1, 2018 Single cell genomics unveils the genomic blueprints of the most fundamental units of life without the need
Advanced Technology in Phytoplasma Research
 Advanced Technology in Phytoplasma Research Sequencing and Phylogenetics Wednesday July 8 Pauline Wang pauline.wang@utoronto.ca Lethal Yellowing Disease Phytoplasma Healthy palm Lethal yellowing of palm
Gene Expression Technology
 Gene Expression Technology Bing Zhang Department of Biomedical Informatics Vanderbilt University bing.zhang@vanderbilt.edu Gene expression Gene expression is the process by which information from a gene
European Union Reference Laboratory for Genetically Modified Food and Feed (EURL GMFF)
") Guideline for the submission of DNA sequences derived from genetically modified organisms and associated annotations within the framework of Directive 2001/18/EC and Regulation (EC) No 1829/2003 European
Guideline for the submission of DNA sequences derived from genetically modified organisms and associated annotations within the framework of Directive 2001/18/EC and Regulation (EC) No 1829/2003 European
DNBseq TM SERVICE OVERVIEW Plant and Animal Whole Genome Re-Sequencing
 TM SERVICE OVERVIEW Plant and Animal Whole Genome Re-Sequencing Plant and animal whole genome re-sequencing (WGRS) involves sequencing the entire genome of a plant or animal and comparing the sequence
Integrated NGS Sample Preparation Solutions for Limiting Amounts of RNA and DNA. March 2, Steven R. Kain, Ph.D. ABRF 2013
 Integrated NGS Sample Preparation Solutions for Limiting Amounts of RNA and DNA March 2, 2013 Steven R. Kain, Ph.D. ABRF 2013 NuGEN s Core Technologies Selective Sequence Priming Nucleic Acid Amplification
Genome Sequencing. I: Methods. MMG 835, SPRING 2016 Eukaryotic Molecular Genetics. George I. Mias
 Genome Sequencing I: Methods MMG 835, SPRING 2016 Eukaryotic Molecular Genetics George I. Mias Department of Biochemistry and Molecular Biology gmias@msu.edu Sequencing Methods Cost of Sequencing Wetterstrand
High Throughput Sequencing the Multi-Tool of Life Sciences. Lutz Froenicke DNA Technologies and Expression Analysis Cores UCD Genome Center
 High Throughput Sequencing the Multi-Tool of Life Sciences Lutz Froenicke DNA Technologies and Expression Analysis Cores UCD Genome Center Complementary Approaches Illumina Still-imaging of clusters (~1000
Next Generation Sequencing Lecture Saarbrücken, 19. March Sequencing Platforms
 Next Generation Sequencing Lecture Saarbrücken, 19. March 2012 Sequencing Platforms Contents Introduction Sequencing Workflow Platforms Roche 454 ABI SOLiD Illumina Genome Anlayzer / HiSeq Problems Quality
Ecole de Bioinforma(que AVIESAN Roscoff 2014 GALAXY INITIATION. A. Lermine U900 Ins(tut Curie, INSERM, Mines ParisTech
 GALAXY INITIATION A. Lermine U900 Ins(tut Curie, INSERM, Mines ParisTech How does Next- Gen sequencing work? DNA fragmentation Size selection and clonal amplification Massive parallel sequencing ACCGTTTGCCG
Day 3. Examine gels from PCR. Learn about more molecular methods in microbial ecology
 Day 3 Examine gels from PCR Learn about more molecular methods in microbial ecology Genes We Targeted 1: dsrab 1800bp 2: mcra 750bp 3: Bacteria 1450bp 4: Archaea 950bp 5: Archaea + 950bp 6: Negative control
Practical Bioinformatics for Life Scientists. Week 14, Lecture 27. István Albert Bioinformatics Consulting Center Penn State
 Practical Bioinformatics for Life Scientists Week 14, Lecture 27 István Albert Bioinformatics Consulting Center Penn State No homework this week Project to be given out next Thursday (Dec 1 st ) Due following
Deep Sequencing technologies
 Deep Sequencing technologies Gabriela Salinas 30 October 2017 Transcriptome and Genome Analysis Laboratory http://www.uni-bc.gwdg.de/index.php?id=709 Microarray and Deep-Sequencing Core Facility University
TECHNIQUES FOR STUDYING METAGENOME DATASETS METAGENOMES TO SYSTEMS.
 TECHNIQUES FOR STUDYING METAGENOME DATASETS METAGENOMES TO SYSTEMS. Ian Jeffery I.Jeffery@ucc.ie What is metagenomics Metagenomics is the study of genetic material recovered directly from environmental
Aaron Liston, Oregon State University Botany 2012 Intro to Next Generation Sequencing Workshop
 Output (bp) Aaron Liston, Oregon State University Growth in Next-Gen Sequencing Capacity 3.5E+11 2002 2004 2006 2008 2010 3.0E+11 2.5E+11 2.0E+11 1.5E+11 1.0E+11 Adapted from Mardis, 2011, Nature 5.0E+10
Analytics Behind Genomic Testing
 A Quick Guide to the Analytics Behind Genomic Testing Elaine Gee, PhD Director, Bioinformatics ARUP Laboratories 1 Learning Objectives Catalogue various types of bioinformatics analyses that support clinical
Wheat CAP Gene Expression with RNA-Seq
 Wheat CAP Gene Expression with RNA-Seq July 9 th -13 th, 2018 Overview of the workshop, Alina Akhunova http://www.ksre.k-state.edu/igenomics/workshops/ RNA-Seq Workshop Activities Lectures Laboratory Molecular
Functional annotation of metagenomes
 Functional annotation of metagenomes Jeroen F. J. Laros Leiden Genome Technology Center Department of Human Genetics Center for Human and Clinical Genetics Introduction Functional analysis Objectives:
GENETICS - CLUTCH CH.15 GENOMES AND GENOMICS.
 !! www.clutchprep.com CONCEPT: OVERVIEW OF GENOMICS Genomics is the study of genomes in their entirety Bioinformatics is the analysis of the information content of genomes - Genes, regulatory sequences,
Introduction to Next Generation Sequencing (NGS)
") Introduction to Next eneration Sequencing (NS) Simon Rasmussen Assistant Professor enter for Biological Sequence analysis Technical University of Denmark 2012 Today 9.00-9.45: Introduction to NS, How it
Introduction to Next eneration Sequencing (NS) Simon Rasmussen Assistant Professor enter for Biological Sequence analysis Technical University of Denmark 2012 Today 9.00-9.45: Introduction to NS, How it
What is Bioinformatics?
 What is Bioinformatics? Bioinformatics is the field of science in which biology, computer science, and information technology merge to form a single discipline. - NCBI The ultimate goal of the field is
Evaluation of a Short-Term Scientific Mission (STSM) Cost Action ES1406 KEYSOM soil biodiversity of European transect
 Cost Action ES1406 KEYSOM soil biodiversity of European transect") Evaluation of a Short-Term Scientific Mission (STSM) Cost Action ES1406 KEYSOM soil biodiversity of European transect Name: KEYSOM soil biodiversity of European transect COST STSM Reference Number: COST-STSM-ES1406-35328
Evaluation of a Short-Term Scientific Mission (STSM) Cost Action ES1406 KEYSOM soil biodiversity of European transect Name: KEYSOM soil biodiversity of European transect COST STSM Reference Number: COST-STSM-ES1406-35328
SUPPLEMENTARY MATERIAL AND METHODS
 SUPPLEMENTARY MATERIAL AND METHODS Amplification of HEV ORF1, ORF2 and ORF3 genome regions Total RNA was extracted from 200 µl EDTA plasma using Cobas AmpliPrep total nucleic acid isolation kit (Roche,
Microbial sequencing solutions
 Microbial sequencing solutions Scalable, simple, fast TARGETED GENOME Sequencing f every lab, every budget, every application Ion Trent semiconduct sequencing Ion Trent technology has pioneered an entirely
Name: Ally Bonney. Date: January 29, 2015 February 24, Purpose
 Name: Ally Bonney Title: Genome sequencing and annotation of Pseudomonas veronii isolated from Oregon State University soil and 16S rrna characterization of Corvallis, OR soil microbial populations Date: