A Tree-Ring Based Assessment of Synchronous Extreme Streamflow Episodes in the Upper Colorado & Salt-Verde-Tonto River Basins.
|
|
|
- Godwin Jennings
- 6 years ago
- Views:
Transcription
1 A Tree-Ring Based Assessment of Synchronous Extreme Streamflow Episodes in the Upper Colorado & Salt-Verde-Tonto River Basins Final Report July 25 A Collaborative Project between The University of Arizona's Laboratory of Tree-Ring Research & The Salt River Project Katherine K. Hirschboeck & David M. Meko Laboratory of Tree-Ring Research The University of Arizona With the assistance from: Kiyomi Morino, Ela Czyzowska & Jennifer Lee Laboratory of Tree-Ring Research, The University of Arizona & The Salt River Project / Water Resource Operations ACKNOWLEDGEMENTS This project was been funded by The Salt River Project in collaboration with the City of Phoenix and the U.S. Bureau of Reclamation
2 A Collaborative Project Involving The Laboratory of Tree-Ring Research (LTRR) & The Salt River Project (SRP) A TREE-RING BASED HYDROCLIMATIC ASSESSMENT OF SYNCHRONOUS EXTREME STREAMFLOW EPISODES IN THE UPPER COLORADO AND SALT-VERDE RIVER BASINS Katherine K. Hirschboeck & David M. Meko Laboratory of Tree-Ring Research, The University of Arizona FINAL REPORT 1 July 13, 25 ABSTRACT Tree-ring reconstructions of total annual (water year) streamflow for gages in the Upper Colorado River Basin and Salt-Verde River Basin were computed and analyzed for the period These reconstructed flow series were used to identify years of extreme low flow (L) and high flow (H) discharge in each basin, based on.25 and.75 quantile thresholds, respectively. Synchronous extreme events in the same direction in both basins (LL and HH events) were much more frequent than LH or HL events, which turned out to be extremely rare occurrences. Extreme synchronous low flow (LL) and high flow (HH) events tended to cluster in time. The longest period of consecutive LL years in the record was 3 years. In terms of multi-year extremes, a scenario of 2 extreme years occurring anywhere within a 3-yr or 4-yr moving window was the most common. The overall conclusion based on the long-term record is that severe droughts and low flow conditions in one basin are unlikely to be offset by abundant streamflow in the other basin. INTRODUCTION Due to the recent severe and geographically extensive drought in western United States, many questions have emerged about the relationship between the water supplies of the Upper Colorado River Basin and the Salt-Verde River Basin. Are the two river systems relatively independent of each other due to different climate regimes? Is annual streamflow variability in the Salt-Verde Basin independent of annual streamflow variability in the Colorado Basin? Is drought in the Salt-Verde system unlikely to be accompanied by drought in the Colorado Basin, such that the latter's water supply can serve as a buffer for the former? How frequently do extreme events, such as the recent drought, occur in both basins at the same time? The purpose of this project was to use long term records of tree-ring reconstructions of annual streamflow to analyze variations of low flow and high flow extremes in the water supply of the Upper Colorado and Salt-Verde River basins over the past several hundred years. The central question guiding the research was: How frequently have extreme droughts or high flows occurred in both basins simultaneously in the past? Specifically the project goals were: to determine how streamflow extremes in each basin have co-varied over time, to assess the hydrometeorological and hydroclimatological causes of this past co-variation, to provide probabilistic estimates of the likelihood of various scenarios of synchronous lowflow and high-flow extremes, and to devise an assessment tool for implementing the project's results into operational water supply decision-making. 1 This report summarizes the results of work completed by the University of Arizona's Laboratory of Tree-Ring Research (LTRR) at the request of the Salt River Project (SRP). The project was funded by SRP in late 23 and the bulk of the research took place in 24. The project results also include a companion website containing the appendices, relevant data, and related links. It can be found at the following URL: 2
3 The project generated a large volume of data, documentation, statistics, and analytical results presented in both tables and figures. The bulk of this information is included in the appendices which can be found on the companion Project Website. An overview of the project methodology is shown at right. The work accomplished and the project findings will be presented in this report via a question/answer format that should be broadly applicable for use in a variety of settings such communicating with water managers, water resource scientists, water consumers, legislators and the general public. OVERVIEW OF PROJECT METHODOLOGY: (1) Use existing tree-ring data to refine and re-calibrate previous tree-ring reconstructions of streamflow; produce new reconstructions and compare with observed record (2) Develop procedure to identify extreme streamflow episodes: drought (low flow, L) and flood (high flow, H) in each basin (3) Define extreme streamflow scenarios: LL, HH, LH, HL in both the observed & reconstructed records (4) Determine likely weather & climate causes of scenarios (5) Develop climate-linked, probability-based assessment tool to transfer information into useful operational decision-making format 1 -- STREAMFLOW AND TREE-RING DATA USED IN THE PROJECT The main conclusions of this project are based on long-term time series of annual streamflow values for the Upper Colorado and Salt-Verde-Tonto River Basins reconstructed from networks of annual tree ring widths. Available tree-ring chronologies, gaged streamflow data, and existing streamflow reconstructions were gathered, assessed and re-computed to produce updated and consistently derived streamflow reconstructions for key river locations in the basin. (1-a) What river basins and streamflow gages were reconstructed? Table 1 lists the 8 rivers / gages for which streamflow reconstructions were completed. Appendix 1 provides additional information on the gages used, the data sources (e.g., for natural flow values), and the observed water-year average flows for these river systems. Figure 1 shows streamflow gaging sites, treering sites, and climatic stations that were used in the project. Table 1 -- Rivers reconstructed and statistics for observed flows (cfs) Statistics Std Code 1 River/gage 2 Coverage 3 Mean dev. cv skew A. Colorado at Lees Ferry B. Salt + Verde + Tonto C. Gila at head of Safford Valley D. Green at Green River, UT E. Colorado near Cisco, UT F. San Juan near Bluff, UT G. Salt + Tonto H. Verde Letter code for gage (used throughout report) 2 Name of river or gage (see Appendix 1 for details) 3 Start and end year of water-year totals used for statistics 4 Mean, standard deviation, coefficient of variation and skewness of the water-year average flows in cubic feet per second (cfs) 3

4 Figure 1 -- Project map showing watersheds, tree-ring, streamflow, and climate stations 4
 at a location (tree-ring site) (Fritts 1976).")
5 (1-b) What information obtained from tree rings is used to link tree growth with streamflow? The basic tree-ring data for this study consisted of site chronologies, which are dimensionless time series representing the annual tree-ring width variations from many trees (e.g., 1-2) at a location (tree-ring site) (Fritts 1976). A site chronology (see Figure 2) can be regarded as the proportion of normal growth in each year such that values above 1. represent higher than normal growth and values below 1. represent lower than normal growth. The minimum value that can occur theoretically is zero, or no growth in a given year. Figure 2 -- Example of a tree-ring site chronology with standardized index values representing ring widths (1-c) Why should there be a relationship between streamflow and tree growth in the arid and semi-arid western United States? Tree growth can be limited if there is not sufficient moisture in the soil. This can arise from either a lack of precipitation, or excessive evapotranspiration in warm, dry climates-- or both. Regionally, precipitation minus evaporation determines the amount of runoff available in rivers and streams. Hence both trees and streams can respond to weather and climate patterns that produce sustained drought condition. In the project study areas, the snow that falls in the winter prior to a tree's growing season is reflected in the tree's growth in spring and summer via soil moisture storage. (1-d) What's the benefit of using tree-rings to study past streamflow variation? Figure 3 -- Why tree growth and streamflow variations can be correlated (see Meko et al. 1995) Gage records for the Salt-Verde River system and the Upper Colorado watershed are some of the longest in the United States, yet they represent only a short segment of these rivers' long-term natural variability. Droughts and floods can have devastating impacts on people, but because they are rare events, even 1 years of instrumental streamflow records may not be long enough to capture the range of possible extreme streamflow episodes. Climate-sensitive tree-ring records can extend the record of climate and hydrologic variability back many centuries to provide important information unavailable in the gaged record. In one of the first statistical streamflow reconstructions from tree rings, Stockton (1975), Stockton and Jacoby (1976) demonstrated how unusually wet the early 2th century was in the Colorado River in comparison to the long-term mean. Water supply planning decisions made on the basis of unusually wet or dry episodes of a river s history may not properly represent the true nature of the supply. (1-e) How were the tree-ring sites selected for the analysis? The study used only pre-existing tree-ring chronologies. No field work or new chronology development was included due to the project s limited timeframe. In selecting the tree-ring data, sites inside the basins or within a buffer of about 2 km of the basin boundaries were considered a-priori as potentially useful for the analysis. An additional constraint was imposed that the tree-ring data at the site cover at least the period from the mid-166s through The end year was dictated by the collection dates of available chronologies and our preference to have a deeply replicated site network. The start year was selected such that even the shortest chronologies would sample the well-known Pueblo drought that occurred in the late 166s (Smith and Stockton 1981). 5
6 Figure 4 shows the locations of sites in the tree-ring networks used in the reconstructions for the Colorado at Lees Ferry (Fig 4a) and the Salt-Verde-Tonto (Fig 4b). The tree-ring network goes back to 1279 in the Upper Colorado Basin and 1199 in the Salt-Verde-Tonto Basin. However, the best reconstruction model for the Colorado at Lees Ferry emerged from a subset of well-replicated tree-ring sites whose records started in 1521 (sites indicated by symbol in Figure 4a.). Note that there is minimal overlap of sites in this subset of the Upper Colorado network with that of the Salt-Verde-Tonto network, thereby avoiding the problem of built-in correlations between the two basins due to the use of Figure 4 Locations of tree-ring sites used in the streamflow reconstructions. duplicate chronologies. The post-1521 sites in the Upper Colorado were last collected in Because of this, the Colorado streamflow reconstruction ends in 1964 and the period was designated as the common period for comparison between the two basins in our subsequent analysis of synchronous extreme flow episodes in the reconstructed time series. (1-f) What were the different sources of the tree-ring data? Tree-ring data were obtained from four sources: (1) The International Tree-ring Databank (ITRDB) which is the major repository of tree-ring data in North America; (2) a North American tree-ring network used in various studies of spatial patterns of drought (Meko et al. 1993; Cook et al. 1999; Cook et al. 24); (3) a network of tree-ring data used recently for 1-year reconstruction of precipitation and drought index for Arizona (Ni et al. 22); and (4) a network of chronologies from living trees augmented by archaeological samples and previously used in a 15-year reconstruction of annual streamflow of various rivers in Arizona (Graybill et al., in press). There is considerable redundancy among these four networks from which data were drawn. Where chronologies were available from multiple sources, priority was given first to the Ni et al. (22) dataset, as those chronologies had been specially processed to maximize retention of multi-decadal climate information and reduce possible effects of diminished sample size (number of trees) in the earlier years of the chronology. Standard chronologies, defined as dimensionless tree-ring indices not adjusted for removal of autocorrelation (Cook and Kairiukstis 199) were preferred for the study, but so called residual 6
7 chronologies were also acceptable, as the reconstruction method is fairly insensitive to pretreatment for autocorrelation. The complete network for this study includes 119 chronologies: 82 from the ITRDB, 11 from Ni et al (22), 23 from Meko et al. (1993), and three from Graybill et al. (in press). A complete listing of chronologies and sources is included in Appendix 2. Site locations are mapped in Figures 1 and 4. The network includes nine different species. Time coverage varies by chronology. The most recent chronology includes growth year 2, while the longest extends to B.C. However, no tree-ring data before A.D were used in the reconstructions to avoid basing conclusions on poorly replicated tree-ring data RECONSTRUCTING STREAMFLOW The streamflow reconstruction procedure used in this study had four stages (I- IV, see Figure 5). The procedure is a modification of a reconstruction method previously developed for reconstruction of precipitation from time-varying subsets of tree-ring indices (Meko 1997). (2-a) What guided the design of the streamflow reconstruction model? One objective was to obtain reconstructions that take advantage of the extensive replication provided by the dense network of available treering chronologies. Another goal was to make the model robust, i.e., free of uncertainties stemming from possible unknown factors in the past, or nonclimatic disturbances at individual sites. (2-b) What are the steps of a streamflow reconstruction procedure? Reconstruction Model I. Select tree-ring sites II. Single-site regression/reconstruction III. PCA data reduction IV. Multi-site regression/reconstruction Watershed boundary as guide Time coverage from target droughts Converts each chronology into separate estimate of the streamflow series using distributed-lag regression Condenses common modes of variability in the single-site reconstructions Run on the covariance matrix to retain importance of chronology differences in explained streamflow variance Weights the modes of variation in single-site reconstructions into best estimate of streamflow Figure 5 Stages in the streamflow reconstruction method Stage I -- Building the predictor pool The first stage identified the initial pool of predictor tree-ring chronologies, i.e. the set of chronologies potentially useful for reconstruction for a specific gage. This initial pool essentially comprised those chronologies from the full 119-site network (see above) that were within the watershed above the gage or roughly a 1-mile buffer around the watershed. Depending on the river, several subsets of predictor pools with different time coverage were assembled. Stage II -- Screening and filtering The second stage eliminated from the pool those chronologies statistically unrelated in a bivariate sense to streamflow, and filtered the remaining chronologies into individual estimates of the streamflow record. The screening and filtering was accomplished by multiple linear regression of the flow at time t on a tree-ring chronology at lags -3 to +1 years relative to the year of streamflow. We refer to these regression models as the single site regresson models. The predictand for a single-site regression model is the observed annual flow, either in original units or log-transformed (depending on an analysis of regression residuals). The pool of potential predictors is the chronology and its lagged values. A forward-stepwise regression on the full overlap of tree-ring data and streamflow was first run to identify the order of entry of predictors. 2 After estimating the full-calibrationperiod model and recording the order of entry of predictors, a split-sample calibration-validation procedure was done to check that the identified model was stable over time. The first and second halves of the full calibration period were designated A and B, respectively. The model was calibrated stepwise 2 The criterion for entry was that the F-value for entry of a predictor has a maximum p-value of.5. At each step the F-value for removal was also checked, and the maximum p-value a predictor can have without being removed from the equations was set at.1. 7
8 on A and validated on B, with statistics of calibration and validation accuracy recorded at each step. The process was then reversed calibrating on B and validation on A. The final step for the stepwise procedure was identified as the step beyond which an additional predictor led to a decrease in modeling accuracy as measured by the root-mean-square error of validation in either of the split-sample regressions. The stepwise regression model was then re-calibrated on the full calibration period with stepwise entry truncated at the appropriate step indicated by the split-sample modeling Substitution of the long-term tree-ring indices into the suite of resulting regression equations yielded a set of single-site reconstructions of streamflow. The single-site regression served as a screening tool to eliminate from further consideration any chronologies without a statistically significant correlation with the gaged streamflow record. The weakest single-site reconstructions (no significant relationship between the lagged tree-ring index and flow) were eliminated from further consideration. Stage III -- Data reduction The third stage of the reconstruction procedure used principle components analysis (PCA) to reduce the single-site reconstructions, which contain much redundancy, into a new set of orthogonal variables describing independent dominant modes of streamflow-related tree-ring variation 3. This principal components transformation was done for different sub-periods of tree-ring data coverage corresponding to target droughts. The most inclusive subset of chronologies covered the period back to the mid-166s, and was aimed at allowing assessment of the well-documented Pueblo drought that impacted Arizona around167 (Smith and Stockton 1981). An intermediate subset of chronologies targeted the period to A.D. 157, based on the severe late-15s drought identified by several researchers (e.g., Schulman 1956; Stockton and Jacoby 1976; Stahle et al. 2). The longest subset extended to the late A.D. 11s in an attempt to capture the Great Drought believed to have impacted the Anazazi civilization (Schulman 1956). Only some of the basins used in this study have tree-ring coverage for this earliest period. Stage IV -- Multi-site Regression / Reconstruction The fourth stage of the reconstruction procedure was multiple linear regression (MLR) of streamflow on the scores of the principal components of the singlesite reconstructions. The estimated regression coefficients weighted the principal-component scores into final estimates of flow. The predictand for the MLR was the observed annual flow series and the predictors were the principal component (PC) scores of the single-site reconstructions. Initial runs of the model were later adjusted to produce the final streamflow reconstructions. 4-5 Complete details of the reconstruction modeling for each gage (A through H, see Table 1) are provided in APPENDIX 3. 3 The principal components analysis for this data-reduction step was run on the covariance matrix, rather than the correlation matrix, of the single-site reconstructions because it was desirable to retain the information inherent to the differences in variances of those reconstructions: the variance of a single site reconstruction is proportional to the variance of flow explained by the chronology and its lagged values. 4 In our initial runs, only the most important PCs, as measured by the eigenvalues from the PCA, were included as potential predictors in a stepwise forward model. To be included in the pool, the eigenvalue was required to be larger than the mean eigenvalue of all PCs. This criterion is analogous to an eigenvalue of 1 selection criterion when the PCA is run on the correlation matrix (Mardia et al. 198). Experience showed that this rule was generally too conservative, and was later relaxed to allow any PC explaining more than 5% of the variance of the single-site reconstructions to be included. (To avoid confusion, however, we kept the mean eigenvalue threshold for the Salt+Verde+Tonto model because the reconstructions by the two methods differed only slightly and much further analysis had already been done on the earlier version). Regardless of which rule was used to initially truncate the PCs, the number of predictors in the pool was not allowed to exceed 25 percent of the number of observations for calibrating the model. The 25% rule is a conservative application of a guideline suggested by Haan (22). 5 The predictors were entered stepwise (same p-enter and p-remove thresholds as single-site models) and the model was cross-validated at each step by a leave-m-out procedure, where m was set to one plus the maximum number of positive and negative lags used in any of the single-site regression models. This modification of leave-1-out crossvalidation of Michaelsen 1987 was implemented to retain the independence of the calibration and validation subsets (see Meko 1997). The cross-validation was used in conjuction with a stopping rule that entry of predictors be terminated whenever cross-validation error as measured by the root-mean-square error of validation started to increase. 8
 values in the 2th century. (3-a) How good are the tree-ring based reconstructions of flow when compared to the gaged record?")
9 3 THE COLORADO AND SALT-VERDE-TONTO STREAMFLOW RECONSTRUCTIONS Figure 6 compares the water year streamflow reconstructions of the Upper Colorado at Lees Ferry and the Salt-Verde-Tonto Basins with corresponding annual observed (gaged) values in the 2th century. (3-a) How good are the tree-ring based reconstructions of flow when compared to the gaged record? The reconstructions track the timing of high and low flow years quite well and do a good job of capturing the magnitudes of the flow, especially in the dry years. The reconstruction models explain 77.4 % of the variance for the Colorado at Lees Ferry (r =.88) and 57.8 % of the variance for the Salt-Verde-Tonto (r =.76). The magnitudes of extreme wet years are reconstructed more accurately in the large Colorado basin than in the Salt-Verde-Tonto basin, in part because of the latter smaller basin s flashier streamflow. The multi-site calibration and cross-validation statistics for each basin s reconstruction can be found in APPENDIX 3. APPENDIX 4 provides a detailed assessment of other models that have been used to reconstruct Colorado and Salt-Verde-Tonto streamflow time series. (3-b) Are the gaged and reconstructed records comparable in terms of mean? Note in Figure 6 that in both basins, the mean of the observed period is higher than the longterm reconstructed mean. This indicates that, in general, the 2th century has been wetter in both basins than in previous centuries. (The recent drought years of the late 199s and early 2 s were not included in this analysis, however, and their inclusion would lower the observed-record mean.) Figure 6 Comparison of observed and reconstructed flows in the Upper Colorado and Salt-Verde-Tonto Basins (3-c) What do the plots of the entire reconstructed streamflow records look like? Figures 7a and 7b (next page) show the long-term reconstructed time series plots for averaged annual water year streamflow (in cubic feet per second) for each basin, with error bars shown in red. The 5% confidence interval indicated by the red bars is based on the root-mean-square error from the cross- 9


10 validation procedure (Stage II). When comparing the two basins it is important to note the large difference in scaling of vertical axes seen in Figures 7a and 7b. In order to plot and compare high and low observed and reconstructed streamflow episodes for both basins on the same axis, the discharge was converted to percent of normal flow, and is plotted as such in several of the subsequent graphs. Figure 7a -- Reconstructed annual water year flows, Colorado River at Lees Ferry. Figure 7b -- Reconstructed annual flows, Salt+Verde+Tonto Rivers, Arizona 1

11 4 THRESHOLD IDENTIFICATION OF INDIVIDUAL AND SYNCHRONOUS EXTREME STREAMFLOW EPISODES IN BASINS (4-a) What criteria were used to define extreme streamflow episodes in each basin? Through discussions with SRP Water Resource Operations specialists, a thresholdbased procedure was developed to identify the extreme low and high flow years in each basin. The thresholds used are quantiles of water-year annual discharge (compared to the mean). High flow years (H) are those with flow >.75 quantile and Low flow years (L) are those with flow <.25 quantile. At a later stage of the analysis, thresholds of >.9 and <.1 were also examined in order to assess the most extreme years. Table 2 displays the quantile thresholds used in each basin along with corresponding streamflow units for each basin. Table 2 Thresholds for determining low (L) & high (H) flow extremes in each basin. THRESHOLDS OF OBSERVED & RECONSTRUCTED FLOW FOR HH / LL ANALYSIS H , ,772 Key episodes of extreme low flow and high Observed flow in the basins were identified in both the gaged and reconstructed streamflow records. Upper.25 and Lower.75 thresholds were selected and applied to water year mean discharge in both the observed and reconstructed records. Figure 8 shows the plotted threshold levels for each basin. Note that the thresholds differ somewhat between the observed and reconstructed series due to differences in the mean and standard deviation of the two series. BASIN Lees Ferry S + V+ T (Salt + Verde + Tonto) L H L QUANTILE % MEAN CFS 15,91 16,326 24,649 23, Reconstructed Base period for quantiles: water years Means: A. Colorado R at Lees Ferry: 2,564 cfs 19,589 cfs B. Salt, Verde and Tonto: 1,687 cfs 1,45 cfs Thousands of Acre-Feet 11,526 11,827 17,857 16, ,55 1,283 Figure 8 Comparison plot of quantile thresholds for observed & reconstructed time series 11
12 (4-b) What types of synchronous extreme streamflow scenarios have occurred in both the observed and reconstructed record? Four synchronous scenarios are possible when comparing the Upper Colorado and the Salt-Verde-Tonto River systems and are indicated by a two-letter code. (For consistency, the first letter will always refer to the Upper Colorado and the second to the Salt-Verde-Tonto): When the two basins are responding in the same direction: HH = High flow (H) in the Colorado at the same time as high flow (H) in the Salt-Verde-Tonto LL = Low flow (L) in the Colorado at the same time as low flow (L) in the Salt-Verde-Tonto When the two basins are responding in the opposite direction: HL = High flow (H) in the Colorado at the same time as low flow (L) in the Salt-Verde-Tonto LH = Low flow (L) in the Colorado at the same time as high flow (H) in the Salt-Verde-Tonto (4-c) What were the results? The graphical results of the quantile threshold analysis -- including the number of HH, LL, HL and LH events -- are displayed in Figures 9 and 1 for the observed record and Figures 11 and 12 for the reconstructed record. In both the observed and reconstructed records, HH and LL events were much more frequent than HL and LH events, especially in the long, 444-year reconstructed time series. In fact, no HL events at all occurred in the reconstructed record, and only 2 LH events occurred. In the observed record, only 3 HL events and no LH events occurred. In order to examine some LH-like scenarios in the observed record, the Colorado threshold was relaxed to <.5, yielding LH events. Due in part to the quantile method, the number of LL events tends to be counterbalanced by the number of HH events, but overall in both the observed and reconstructed records LL events are more frequent occurrences than HH events. A year-by-year listing of the HH, LL, HL and LH events, color coded by each year s streamflow threshold (>.9, >.75, <.25, <.1) is presented in APPENDIX 5. (4-d) Were these results expected? A widely held working hypothesis is that the Upper Colorado River Basin (UCRB) can serve as a buffer to compensate for extreme low flow in the Salt-Verde-Tonto Basin during drought periods. One reason this is plausible is because of the size of the UCRB basin and the overall magnitude of its discharge. It has also been assumed that streamflows in the two river systems are relatively independent of each other due to a difference in the climatic regimes influencing each basin (e.g. R. Sedlacek and R. Siegal, unpublished report). While the above presumptions sound logical, our analysis did not substantiate them. We found that the simple correlation between the annual flow values of the two 444-year reconstructed time series was r =.599 ( r 2 =.359), which is a statistically significant correlation, given the large sample size. Far more compelling with respect to extreme events, however, was the overwhelming dominance of HH and LL events in comparison to extremes where the basins responded in the opposite direction. (4-e) What are the implications of these results? These results suggest that annual streamflow variability in the Salt-Verde Basin especially extreme streamflow is not independent of annual streamflow variability in the Colorado Basin. Therefore it is not unlikely that severe drought in one basin will be accompanied by severe drought in the other basin, such as has occurred during the western drought scenario of the late 199s and early 2 s. It should be noted that the immense water supply of the large Upper Colorado basin may allow it to continue to serve as a buffer even when it is in a low flow scenario because a little flow can go a long way in a smaller watersheds such as the Salt-Verde-Tonto, however ever-increasing demand on the water supply of the UCRB by many stakeholders is likely to reduce the size of this buffer in the future. 12

13 Figure 9 2th century HH and LL water years based on observed-record quantile thresholds Figure 1 2th century HL and LH water years based on observed-record quantile thresholds [NOTE: LH years were identified only by relaxing the Colorado L threshold to.5] 13

14 Reconstructed flows: LL & HH events Mean Daily Flow (% of normal) High on Colorado R. at Lees Ferry High on S+V+T Low on Colorado R. at Lees Ferry Low on S+V+T LL and HH years, SRP Revised Reconstructed Flows, The more typical scenario with respect to extremes in the long-term record Colorado R. at Lees Ferry S+V+T Water Year HH = HIGH on Colo & HIGH on SVT (blue symbols) Probability (HH) = 57 / 444 =.1284 LL = LOW on Colo & LOW on SVT (red symbols) Probability (LL) = 66 / 444 =.1486 Figure 11 HH and LL water years based on reconstructed-record quantiles from Figure 12 HL and LH water years based on reconstructed-record quantiles from
15 (4-f) Is the observed frequency of occurrence of HH and LL years greater than can be expected by chance? A hypergeometric test (see box) indicates that the probability of the observed numbers of joint HH and LL years is less than one in a billion if the extreme streamflow in the two basins were indeed independent of one another! Hypergeometric Test Using the.25 and.75 quantiles of reconstructed flow for the full 444-year overlap of the SVT and Lees Ferry reconstructions as thresholds for dry years and wet years, we designate by definition 444/4 = 111 low-flow years and 111 high-flow years in each basin. A count indicates that in 66 years flows were low in both rivers (66 LL years) and in 57 years flows were high on both rivers (57 HH years). The hypergeometric distribution can be used to show that 66 LL years or 57 HH years is much greater than expected if flows in the two rivers were independent of one another. The hypergeometric distribution gives the probability of drawing up to x of a possible k items in n drawings without replacement from a group of m objects. Assume the items are defined as low-flow years in the Lees Ferry reconstruction, and that the drawings are samples from the Lees Ferry reconstruction in years with low flow on the SVT reconstruction. The problem for the LL case is set up as follows: k=111 is the number of possible items (low-flow years in Lees Ferry record) n=111 is the number of drawings, or years of low flow in the SVT record m=444 is the number of objects, the total number of years in the Lees Ferry record x=65 is one less than the number of number of successful drawings, or the number of drawings that results in one of the k items (in other words, an LL year) The cumulative distribution function of the hypergeometric distribution gives the probability of x or * fewer successful drawings. If this probability is given by p, then * p = 1 p is the probability of more than x successful drawings. For the example above, p is the probability of getting 66 or more LL years if the occurrence of low-flow years on the two rivers is indeed unrelated. The estimated chance probabilities for 66 or more LL years and 57 or more HH years are listed below k n m x p* p LL > <1E-12 HH E-12 In summary, the probability of the observed numbers of LL and HH years is less than one in a billion if the two flow record were indeed independent of one another. 15
16 (4-g) What s the probability of different lengths of LL and HH sequences? To address this question, probabilities of HH and LL events were empirically derived based on the number of their occurrences in the 444- year reconstructed times series. In addition, a moving-window procedure (see Figure 13) was used to determine the number of HH and LL events in a moving n-year window, both sequentially and non-sequentially. The results displayed in Table 3 indicate that there is > 1% chance that a single year could be an extreme LL year or an extreme HH year. There is also a 1% chance that 2 LL years (or HH years) could occur in any given 4-year period and a > 5 % chance that 2 years out of a moving 3-year window will be extreme LL years (or HH years). Figure 13 Moving window probability count procedure Most probable *** * ** *** * Table 3 -- Probability Counts of LL & HH Event Scenarios Over the period Individual 1-yr events Consecutive Sequences 2 consecutive years (within a moving 2-yr window) 3 consecutive years (within a moving 3-yr window) Clustered Sequences 2yrs (within a moving 3-yr window) 2 yrs (within a moving 4-yr window) 3 yrs (within a moving 4-yr window) 3 yrs (within a moving 5-yr window) 4 yrs (within a moving 5-yr window) 4 yrs (within a moving 6-yr window) 5 yrs (within a moving 6-yr window) LL # events/ # possible (probability) 66 / 444 (.149) 1 / 443 (.23) 1 / 442 (.2) 22 / 442 (.5) 45 / 441 (.12) 5 / 441 (.11) 13 / 44 (.3) HH # events / # possible (probability 57 / 444 (.128) 14 / 443 (.32) 3 / 442 (.7) 29 / 442 (.66) 47 / 441 (.17) 9 / 441 (.2) 16 / 44 (.36) 1 / 44 / 44 (.2) 1 / 439 / 439 (.2) / 439 / 439 *** = probability > 1% ** = probability > 5% * = probability > 2% 16
17 Figure 14 illustrates another perspective on the tendency for HH and LL events and episodes to cluster, using a smoothed time series approach. It demonstrates the cumulative effect that short-term clusters of extreme years can have over longer time periods. (4-h) What are the implications of this tendency for extreme years to occur in sequences or clusters? It is possible that if the number of wet extreme years is about equal to the number of dry extreme years, that the two extremes could cancel each other on a year-to-year basis such that there would be little long-term stress on water supply operations. However, because of the clustering tendency of extreme events, it is more probable that episodes of sustained drought or sustained high flow will persist, placing more of a burden on water systems management and operations. In other words, reservoir storage will buffer water supplies in the Upper Colorado River Basin and Salt-Verde-Tonto region during single year droughts, but supplies are increasingly strained as droughts extend over multi-year periods. 17
18 (4-i) How else can the existence of a linkage in multi-year drought occurrence in the two basins be supported statistically? Monte Carlo Study of Simultaneously Low Moving Average Flows To summarize multi-year simultaneous drought, the reconstructed flow series for the Colorado River at Lees Ferry and the Salt-Verde-Tonto (SVT) were analyzed as moving averages, or running means, using the.25 quantile of running means for the base period as a relative drought threshold. A count of running means below the respective threshold on both rivers represents the frequency of joint drought for any given length of moving average. The single year analysis, which yielded 66 LL events and 57 HH events, can be thought of in this sense as a one-year moving average. We have generalized this method of tabulating drought (LL events) to moving averages of length 1, 2, 3,, 2 years. It is useful to compare counts of LL events to the expected number of events given no relationship between the flow series for the Colorado and the SVT, but a theoretical expected frequency is not straightforward to calculate because once the time series has been smoothed into a moving average the independence of successive observations is compromised. We therefore took the following Monte Carlo approach: 1. Convert the annual reconstructed flows, , to moving averages and count the number of LL events 2. Repeat the count for the SVT against 1 simulated reconstructed flow series for the Colorado at Lees Ferry 3. Compare the observed count of joint low-flow events to the cumulative empirical distribution of counts from the Monte Carlo simulation. For the Monte Carlo simulations, the reconstructed flow series for Lees Ferry was modeled as a first-order autoregressive (AR(1)) process. The model is given by yt =.28yt 1 + e t where yt is the flow in year t expressed as a departure from the mean, and et is a random sample a standard normal distribution. A total of 1 simulations were generated in this way, and each was subsequently scaled to the same mean and variance as the reconstructed flow series. The results of the Monte Carlo analysis are summarized in Table 4 (next page), which lists for each length of moving average the number of LL events in the reconstructed flows and threshold number of LL events with empirical non-exceedance probability.5,.95,.99 and.999 by chance. For example, for the 7-year moving average, the Lees Ferry reconstruction and SVT were simultaneously below their drought thresholds in 62 years, which is far more than expected by chance: the Monte Carlo tally indicates the probability is p =.999 of fewer than 5 LL events if the flows on the Colorado and the SVT are unrelated. The expected number of chance events, given by the p =.5 probability point is only 27. In summary, none of the observed LL counts (column labeled N 3 ) has a greater than.1 probability of occurring by chance alone. Since there were only 1 simulations done for the analysis, it is also true no simulation had a count of LL events as large as for the reconstructed series themselves. The results strongly support a linkage in multi-year drought occurrence in the two basins. 18
19 Table 4. Monte Carlo summary of frequency of jointly low reconstructed moving-average flows on the Colorado River at Lees Ferry and the Salt-Verde-Tonto Rivers. Threshold 2 Flow (cfs) Events 3 Probability Point M 1 Lees F SVT N 1 N 2 N Length of moving average (yr) 2 Threshold for low-flow event, defined as.25 quantiles of the moving-average annual reconstructed flows, Number of moving averages in series (N 1 ), number of moving averages below threshold in each series(n 2 ), and number of simultaneous low flows (N 3 ) 4 Threshold number of joint droughts with specified probability of not being exceeded, based on 1 Monte Carlo simulations (4-j) How have low and high streamflow episodes in each basin individually varied from century-tocentury? How have the numbers of LL and HH years varied from century-to-century? Figure 15 (and APPENDIX 5) display a century-by-century record of extreme streamflow events in the Upper Colorado and the Salt-Verde-Tonto River basins. The 19th century experienced more LL years than any other in the record (22 events) and the 18th and 2th centuries (prior to 1965) experienced the most HH years (14 events). Figures 16 and 17 display century-by-century timelines of extreme LL and HH events showing the individual-year discharge values associated with the extreme events and their tendency to cluster. Figures 18 and 19 show similar plots, but for sub-basins of the Upper Colorado (Green, Dolores and San Juan Rivers) and the Verde, Salt + Tonto, and Gila Basins in Arizona. The sub-basin plots provide more detailed spatial information on where the extreme streamflow events were concentrated in each watershed. 19
20 Figure 15 LL and HH water years with quantile time series Extreme High and Low Flow Years in Upper Colorado & Salt-Verde Basins based on Reconstructed Streamflow* < 1th Percentile < 25th and 1th Percentile 25th and 75th Percentile > 75th and 9th Percentile > 9th Percentile Upper Colorado River Basin (UCRB) LL = 11 HH = 11 Salt -Verde -Tonto River Basin (SVT) UCRB 16s LL = 11 HH = UCRB SVT 17s LL = 13 HH = SVT UCRB SVT * * 18s LL = 22 HH = * Reconstructed annual water year discharge UCRB HH years (high flow in both basins) LL years (low flow in both basins) LL = 8 HH = 14 SVT * LH = Low in UCRB / High in SVT HL = High in UCRB / Low in SVT (no occurrences) 2
21 Figure 16 Low discharge events in each basin by century, showing tendency to cluster UPPER COLORADO RIVER BASIN ANNUAL DISCHARGE FOR EXTREME LOW FLOW WATER YEARS Plotted: years with annual discharge below thresholds SALT-VERDE-TONTO RIVER BASIN ANNUAL DISCHARGE FOR EXTREME LOW FLOW WATER YEARS Plotted: years with annual discharge below thresholds <.1 percentile <.25 quantile - corresponding LL years Years Years Departure Years Departure Years Departure Years Departure Years Departure Departure Years Years Departure Departure Years Years Departure Departure
22 Figure 17 High discharge events in each basin by century, showing tendency to cluster UPPER COLORADO RIVER BASIN ANNUAL DISCHARGE FOR EXTREME HIGH FLOW WATER YEARS Plotted: years with annual discharge below thresholds SALT-VERDE-TONTO RIVER BASIN ANNUAL DISCHARGE FOR EXTREME HIGH FLOW WATER YEARS Plotted: years with annual discharge below thresholds >.9 percentile >.75 quantile - corresponding HH years Departure Years Departure Years Departure Years Departure Years Departure Years Departure Years Departure Years Departure Years Departure Years 22 Departure Years
23 Figure 18 Sub-basin comparison of low discharge events by century, showing tendency to cluster Plotted: annual discharge of years below threshold in individual watersheds <.1 percentile <.25 quantile UPPER COLORADO RIVER SUB-BASIN COMPARISON SALT-VERDE-TONTO & GILA RIVERS SUB-BASIN COMPARISON 4 Green 4 Cisco 4 San Juan Years 3 Verde 3 Salt-Tonto 3 Gila Years Green 4 4 Cisco 4 San Juan Years 3 Verde 3 Salt-Tonto 3 Gila Years 4 Green 4 Cisco 4 San Juan Years 3 Verde 3 Salt-Tonto 3 Gila Years 4 Green 4 Cisco 4 San Juan Years 3 Verde 3 Salt-Tonto 3 Gila Years 4 Green 4 Cisco 4 San Juan Years 23 3 Verde 3 Salt-Tonto 3 Gila Years
24 Figure 19 Sub-basin comparison of high discharge events by century, showing tendency to cluster Plotted: annual discharge of years above threshold in individual watersheds >.9 percentile >.75 quantile UPPER COLORADO RIVER SUB-BASIN COMPARISON SALT-VERDE-TONTO & GILA RIVERS SUB-BASIN COMPARISON Green River 7 7 Cisco San Juan Years 2 Verde Salt - Tonto 2 Gila Years Green River Cisco San Juan Verde Salt - Tonto Gila Years Years Green River Cisco San Juan Verde Salt - Tonto Gila Years Years Green River Cisco San Juan Verde Salt - Tonto Gila Years Years Green River 7 7 Cisco San Juan Years 24 2 Verde Salt - Tonto 2 Gila Years

25 5 CLIMATIC CONTEXT OF SCENARIOS LEADING TO INDIVIDUAL AND SYNCHRONOUS EXTREME EVENTS (5-a) Does the precipitation record substantiate the project findings of synchronous extreme events in the two basins? The instrumental record of precipitation supports the finding to a certain degree. Figure 2 shows percentiles of 2th century annual precipitation in the Upper Colorado and Salt-Verde-Tonto Basins, based on divisional precipitation data. There are differences between the two basins such that not all of the driest and wettest years are shared indicating a difference in storm track location, etc. However, many of the most extreme dry (<.1) years are regional events. A contingency table of joint occurrence of precipitation extremes (Table 5) strongly suggests that when one basin is extremely wet, so is the other and vice versa for dry years. Table 5 Joint occurrence of quantile-based divisional precipitation t JOINT OCCURRENCE OF 1 driest years, < 1 th percentile; PRECIPITATION EXTREMES IN UPPER COLORADO & SALT-VERDE-TONTO 5 wettest years, > 9 th percentile 2 dry years, between 1 th & 25 th percentiles; 3 average years, between 25 th & 75 th percentiles; 4 wet years, between 75 th & 9 th percentiles, C-at-LF-an-avr (Based on divisional data roughly coinciding with each basin) SVT-an-avr sum sum Shaded boxes = basins in sync 18 25


.")
 arise when the Pacific storm track appears")

 Seasonal Composite Circulation Anomaly Patterns Observed Record HH Water")
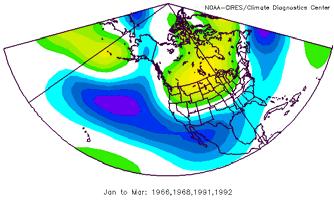
26 (5-b) What atmospheric circulation patterns lead to the LL, HH, LH and HL scenarios? Seasonal composites of upper level (5 mb geopotential height) circulation anomalies for each type of extreme event scenario (based on the observed record) are shown in Figure 21a and 22b. The characteristic circulation pattern for LL events is higher-than-normal upper level pressure over the west in early winter (Oct -Dec) and over the North Pacific ocean storm track region in mid- to late winter (Jan - Mar). The inverse of this pattern leads to HH events. LH and HL scenarios (Figure 21b) arise when the Pacific storm track appears to shift to an anomalous poleward (HL) or equatorward (LH) location. Seasonal Composite Circulation Anomaly Patterns Observed Record LL Water Years Oct -Dec Jan - Mar Apr - Jun Jul - Sep 5 mb geopotential hgt anomalies (m) Seasonal Composite Circulation Anomaly Patterns Observed Record HH Water Years Oct -Dec Jan - Mar Apr - Jun Jul - Sep 5 mb geopotential hgt anomalies (m) Figure 21a Composite circulation anomaly patterns for LL and HH years 26

 Oct -Dec Jan - Mar Apr -")
 Anomaly Patterns")


27 Seasonal Composite Circulation Anomaly Patterns Observed Record HL Water Years (with relaxed threshold on Colo R) Oct -Dec Jan - Mar Apr - Jun Jul - Sep 5 mb geopotential hgt anomalies (m) Seasonal Composite Circulation Anomaly Patterns Observed Record LH Water Years (with relaxed threshold on Colo R) Oct -Dec Jan - Mar Apr - Jun Jul - Sep 5 mb geopotential hgt anomalies (m) Figure 21b Composite circulation anomaly patterns for HL and LH years 27
, and the Atlantic Multidecadal Oscillation (AMO) suggest linkage to some but")
28 (5-c) Are there any linkages of these anomaly patterns to climate-scale driving mechanisms such as sea surface temperature anomalies, El Niño, La Niña, etc.? Preliminary examination of El Niño, La Niña influences and ocean indices such as the Pacific Decadal Oscillation (PDO), and the Atlantic Multidecadal Oscillation (AMO) suggest linkage to some but not all LL years in the observed record (Figure 22). A University of Arizona M.S. thesis is in preparation to examine this in more detail. A cross-spectral analysis was completed to examine the possibility of low- variability and possible driving mechanisms (see APPENDIX frequency 6). Extreme LL & HH YEARS: Pacific Decadal Oscillation (PDO) Atlantic Multidecadal Oscillation (AMO) + AMO.3.2 AMO v SOI AMO + AMO (warm North Atlantic) AMO v PDO AMO (cool North -.4 Atlantic) PDO (cool Tropical Pacific) + PDO (warm Tropical Pacific) PDO LL Years HH Years PDO / AMO hypothesis supported in many, but not all, LL events of last century AMO AMO El Nino SOI LL Years HH Years La Nina Relationships less clear w/ other indices PDO PDO v SOI + PDO PDO El Nino SOI La Nina LL Years HH Years Figure 22 Extreme years and PDO / AMO / ENSO ibili 28
29 (5-d) Is the recent drought unprecedented in severity? Extended periods of below-normal streamflow and low reservoir levels in the late 199s and early 2s clearly mark the most recent decade or so as one of the driest in the period of observed streamflow records in the Salt-Verde watershed. The Salt+Verde+Tonto reconstruction, A.D , allows us to put this recent period into an 8-year context. First, it is useful to put the recent drought quantitatively in historical perspective using the observed flow record itself. Data for the gage on the Salt River near Roosevelt, Arizona, cover water years The annual (water-year) totals for that gage clearly mark the recent drought as exceptional. The annual flows, as well as running means of length 5, 11 and 15 years are plotted in Figure 23 as percentages of the mean. The lowest point of each curve in the recent drought is marked with a horizontal line extended back over the length of the full gaged record. This line serves as a baseline for comparing severity of past droughts and the current drought. The annual flows began an extended dive in water-year 1994 that culminated in single-year flows for 2 and 22 lower than any previously experienced in the observed record (Figure 23a, top left). The 5-year, 11-year and 15-year running means reached their recent low points in the periods ending with water year 24. As a 5-year running mean, the recent drought is about as severe as the lowest-flow period in the 195s. The same is true of the 11-year running mean, suggesting that the period commencing with the decline in water year 1994 and continuing through water year 24 ranks with the driest conditions in the entire gaged record. When the running mean is extended to 15 years (Figure 23a, lower right), the recent drought no longer ranks among the most severe; the reason for this is the wet sequence of years in the early 199s enters the moving average. But up to an averaging period of 11 years, it appears the recent drought is at least comparable in severity to any earlier drought in the gaged record. The tree-ring reconstruction for the Salt+Verde+Tonto (SVT) ends in 1988, and so does not cover the recent drought. Nevertheless that reconstruction does sample the 195s drought, and because the 195s drought was characterized by flow departure of roughly the same magnitude as the recent drought, we can use the lowest reconstructed flows of the 195s to indirectly evaluate the relative severity of the recent drought in the context of the reconstruction to A.D A plot of 11-year running means of the SVT reconstruction with the baseline marked as the low point in the 195s suggests that the current drought was exceeded in severity several times in the past 8 years (Figure 23b). Eight distinct periods before the start of the gaged record show lower 11-year mean flow than the lowest reconstructed value of the 195s. The most severe of the tree-ring droughts was in the late 15s, during the well-documented mega-drought of North America (Stahle et al. 2), when 11-year average flow is reconstructed about 1 cfs below the lowest flows of the 195s. The recent drought, while severe, does not appear to be unprecedented when viewed in a multi-century context. 29
 Severity of recent drought in terms of single years worst")
 was just 62% of normal.")


30 Figure 23a The recent drought in context Severity of Current Drought in Context of Observed Record Running-Mean Flows* of Salt River near Roosevelt (in terms of average flow over most recent 1, 5, 11 and 15 water years, ending with water year 24) Severity of recent drought in terms of single years worst on record As a 5-yr event, 195s drought at least as severe as recent drought Even during 195s drought, occasional 1-year breaks of above normal flow not unusual Driest single years of current drought have had less than 25% of normal flow 11-year average of recent drought ( ) was just 62% of normal. So reasonable to talk about the recent drought as an 11-year drought As a 15-year event, recent drought still pales in comparison with 195s 195s drought at least as severe as current drought *average over water years, plotted at ending year Severity of Current Drought in Context of Reconstructed Record: Figure 23b Salt + Verde + Tonto Reconstruction Record ends in 1988 Several Reconstructed Periods Were Drier than the 195s -- Current drought was about as severe as 195s in terms of flows averaged over 11 years -- 8 other droughts were as severe, according the tree-ring record -- Late 15s megadrought was much more severe 3
A Tree-Ring Based Assessment of Synchronous Extreme Streamflow Episodes in the Upper Colorado & Salt-Verde-Tonto River Basins
 A Tree-Ring Based Assessment of Synchronous Extreme Streamflow Episodes in the Upper Colorado & Salt-Verde-Tonto River Basins Press Information August 18, 2005 A Collaborative Project between The University
Updated Streamflow Reconstructions for the. Upper Colorado River Basin
 Updated Streamflow Reconstructions for the Upper Colorado River Basin Connie A. Woodhouse NOAA National Climatic Data Center, Boulder CO Stephen T. Gray U.S. Geological Survey, Desert Laboratory, Tucson
Warming may create substantial water supply shortages in the Colorado River basin
 Click Here for Full Article GEOPHYSICAL RESEARCH LETTERS, VOL. 34, L22708, doi:10.1029/2007gl031764, 2007 BAK680 Warming may create substantial water supply shortages in the Colorado River basin Gregory
Disentangling the Influence of Temperature and Antecedent Soil Moisture on Colorado River Water Resources
 Disentangling the Influence of Temperature and Antecedent Soil Moisture on Colorado River Water Resources Project start and duraon: September 1, 2014, 24 months Funder: U.S. Department of the Interior,
Collaborative Research on Upper Colorado River Basin Streamflow and Drought. Designing and Implementing User-driven Research
 Collaborative Research on Upper Colorado River Basin Streamflow and Drought Designing and Implementing User-driven Research Connie Woodhouse School of Geography and Development University of Arizona With
Paleohydrology of the Lower Colorado River Basin and Implications for Water Supply Availability
 Paleohydrology of the Lower Colorado River Basin and Implications for Water Supply Availability Jeffrey J. Lukas Lisa Wade Balaji Rajagopalan October 2012 Completion Report No. 223 Acknowledgements Funding
Stanley J. Woodcock, Michael Thiemann, and Larry E. Brazil Riverside Technology, inc., Fort Collins, Colorado
 7.5 FRASER RIVER EXTENDED STREAMFLOW PREDICTION SYSTEM Stanley J. Woodcock, Michael Thiemann, and Larry E. Brazil Riverside Technology, inc., Fort Collins, Colorado Esther Vincent and Andy Pineda * Northern
21st Century Climate Change In SW New Mexico: What s in Store for the Gila? David S. Gutzler University of New Mexico
 21st Century Climate Change In SW New Mexico: What s in Store for the Gila? David S. Gutzler University of New Mexico gutzler@unm.edu Silver City, NM June 5, 2008 Global Warming in the 20th/Early 21st
A simple model for low flow forecasting in Mediterranean streams
 European Water 57: 337-343, 2017. 2017 E.W. Publications A simple model for low flow forecasting in Mediterranean streams K. Risva 1, D. Nikolopoulos 2, A. Efstratiadis 2 and I. Nalbantis 1* 1 School of
UNIT HYDROGRAPH AND EFFECTIVE RAINFALL S INFLUENCE OVER THE STORM RUNOFF HYDROGRAPH
 UNIT HYDROGRAPH AND EFFECTIVE RAINFALL S INFLUENCE OVER THE STORM RUNOFF HYDROGRAPH INTRODUCTION Water is a common chemical substance essential for the existence of life and exhibits many notable and unique
Modeling Your Water Balance
 Modeling Your Water Balance Purpose To model a soil s water storage over a year Overview Students create a physical model illustrating the soil water balance using glasses to represent the soil column.
Climate Change Impact Assessments: Uncertainty at its Finest. Josh Cowden SFI Colloquium July 18, 2007
 Climate Change Impact Assessments: Uncertainty at its Finest Josh Cowden SFI Colloquium July 18, 27 Global Climate Modeling Emission Scenarios (SRES) A1 very rapid economic growth global population that
Southwest Climate Science Center FINAL TECHNICAL REPORT
 Southwest Climate Science Center FINAL TECHNICAL REPORT 1. USGS GRANT/COOP AGREEMENT G14AP00152 2. PROJECT TITLE: Disentangling the Influence of Antecedent Temperature and Soil Moisture on Colorado River
Spring Forecast Based Operations, Folsom Dam, California
 Spring Forecast Based Operations, Folsom Dam, California Paul E. Pugner, P.E. Chief, Water Management Section Sacramento District U.S. Army 1325 J Street, Room 1126 Sacramento, CA 95814-2922 Tel: (916)
Appendix VI: Illustrative example
 Central Valley Hydrology Study (CVHS) Appendix VI: Illustrative example November 5, 2009 US Army Corps of Engineers, Sacramento District Prepared by: David Ford Consulting Engineers, Inc. Table of contents
IPCC WG II Chapter 3 Freshwater Resources and Their Management
 IPCC WG II Chapter 3 Freshwater Resources and Their Management Impacts increasingly harmful & more costly to adapt as global temperature increases May imperil sustainable development goals Semi-arid /
Changes in Water Use under Regional Climate Change Scenarios (Project 4263) 2013 Water Research Foundation. ALL RIGHTS RESERVED.
 2013 Water Research Foundation. ALL RIGHTS RESERVED.") Changes in Water Use under Regional Climate Change Scenarios (Project 4263) www.waterrf.org Advances in Water Research Changes in Water Use under Regional Climate Change Scenarios Project 4263 Presentation
Changes in Water Use under Regional Climate Change Scenarios (Project 4263) www.waterrf.org Advances in Water Research Changes in Water Use under Regional Climate Change Scenarios Project 4263 Presentation
Trends in Illinois River Streamflow and Flooding
 Trends in Illinois River Streamflow and Flooding H. Vernon Knapp, Interim Director Center for Watershed Science Illinois State Water Survey Institute of Natural Resource Sustainability University of Illinois
ANNUAL PLATTE RIVER SURFACE WATER FLOW SUMMARY
 ANNUAL PLATTE RIVER SURFACE WATER FLOW SUMMARY 4/3/213 Platte River Recovery Implementation Program 213 ANNUAL SURFACE WATER FLOW SUMMARY DRAFT Prepared by staff of the Platte River Recovery Implementation
Norman Maclean Snowmelt Flow rate Storm flows fs (c flow m a tre S
 Eventually, all things merge into one, and a river runs through it. Norman Maclean Understanding Streamflow ADEQ SW Short Course June 13, 213 Phoenix, AZ Hydrographs Discharge (Q) USGS flow data & plots
CHAPTER FIVE Runoff. Engineering Hydrology (ECIV 4323) Instructors: Dr. Yunes Mogheir Dr. Ramadan Al Khatib. Overland flow interflow
 Instructors: Dr. Yunes Mogheir Dr. Ramadan Al Khatib. Overland flow interflow") Engineering Hydrology (ECIV 4323) CHAPTER FIVE Runoff Instructors: Dr. Yunes Mogheir Dr. Ramadan Al Khatib Overland flow interflow Base flow Saturated overland flow ١ ٢ 5.1 Introduction To Runoff Runoff
Engineering Hydrology (ECIV 4323) CHAPTER FIVE Runoff Instructors: Dr. Yunes Mogheir Dr. Ramadan Al Khatib Overland flow interflow Base flow Saturated overland flow ١ ٢ 5.1 Introduction To Runoff Runoff
Simulation and Modelling of Climate Change Effects on River Awara Flow Discharge using WEAP Model
 ANALELE UNIVERSITĂŢII EFTIMIE MURGU REŞIŢA ANUL XXIV, NR. 1, 2017, ISSN 1453-7397 Simulation and Modelling of Climate Change Effects on River Awara Flow Discharge using WEAP Model Oyati E.N., Olotu Yahaya
Colorado River Basin Water Supply and Demand Study. WRRC 2013 Conference University of Arizona Tucson, AZ March 5, 2013
 Colorado River Basin Water Supply and Demand Study WRRC 2013 Conference University of Arizona Tucson, AZ March 5, 2013 Colorado River Basin Water Supply and Demand Study Study Objective Assess future water
Uncertainty in projected impacts of climate change on water
 1928 2000 Uncertainty in projected impacts of climate change on water Ed Maurer Civil Engineering Cambio Climático y Políticas Públicas Centro de Cambio Global Universidad Católica de Chile 23 abril 2009
Hydrologic Implications of Climate Change for the Western U.S., Pacific Northwest, and Washington State
 Hydrologic Implications of Climate Change for the Western U.S., Pacific Northwest, and Washington State Alan F. Hamlet JISAO/CSES Climate Impacts Group Dept. of Civil and Environmental Engineering University
TRACKING THE GAS TEMPERATURE EFFECT IN A DISTRIBUTION SYSTEM
 TRACKING THE GAS TEMPERATURE EFFECT IN A DISTRIBUTION SYSTEM Eric Kelner, P.E. - Letton-Hall Group, San Antonio, TX Bryan Niebergall, P.E. - Questar Gas, Salt Lake City, UT AGA Operations Conference, Nashville,
Colorado River Basin Water Supply and Demand Study. Navigating the Future of the Colorado River Natural Resources Law Center June 9, 2011
 Colorado River Basin Water Supply and Demand Study Navigating the Future of the Colorado River Natural Resources Law Center June 9, 2011 Colorado River Basin Water Supply and Demand Study Overview and
SNAMP water research. Topics covered
 SNAMP water research SNAMP water team UC Merced Topics covered Objectives, goals & overview What & why the water component of SNAMP Pre-treatment Observations Water Quality Water Quantity Modeling & Scenarios:
Attachment E2. Drought Indices Calculation Methods and Applicability to Colfax County
 Attachment E2 Drought Indices Calculation Methods and Applicability to Colfax County Attachment E2. Drought Indices Methodology and Applicability to Colfax County E2.1 Palmer Drought Severity Index E2.1.1
Current Methods for Flood Frequency Analysis
 Current Methods for Flood Frequency Analysis US Army Corps of Engineers Beth Faber, PhD, PE USACE, Hydrologic Engineering Center Workshop on Non-Stationarity, Hydrologic Frequency Analysis, and Water Management
Simulation of Climate Change Impact on Runoff Using Rainfall Scenarios that Consider Daily Patterns of Change from GCMs
 Simulation of Climate Change Impact on Runoff Using Rainfall Scenarios that Consider Daily Patterns of Change from GCMs F.H.S. Chiew a,b, T.I. Harrold c, L. Siriwardena b, R.N. Jones d and R. Srikanthan
Uncertainty in hydrologic impacts of climate change: A California case study
 Uncertainty in hydrologic impacts of climate change: A California case study Ed Maurer Civil Engineering Dept. Santa Clara University Photos from USGS Motivating Questions What are potential impacts of
TECHNICAL MEMORANDUM Summerhill Rd Texarkana, Texas fax
 TECHNICAL MEMORANDUM 5930 Summerhill Rd Texarkana, Texas 75503 903 838 8533 fax 903 832 4700 TO: Becky Griffith, Jon Jarvis FROM Spandana Tummuri SUBJECT: Technical Memorandum on IP Analysis PROJECT: Sulphur
Change for Western North America. Hydrologic Implications of Climate. and the Columbia River Basin. Dennis P. Lettenmaier. Alan F.
 Hydrologic Implications of Climate Change for Western North America and the Columbia River Basin Alan F. Hamlet, Philip W. Mote, Dennis P. Lettenmaier JISAO/CSES Climate Impacts Group Dept. of Civil and
Leveraging Smart Meter Data & Expanding Services BY ELLEN FRANCONI, PH.D., BEMP, MEMBER ASHRAE; DAVID JUMP, PH.D., P.E.
 ASHRAE www.ashrae.org. Used with permission from ASHRAE Journal. This article may not be copied nor distributed in either paper or digital form without ASHRAE s permission. For more information about ASHRAE,
REFINEMENTS IN THE Z-T METHOD OF EXTREME VALUE ANALYSIS FOR SMALL WATERSHEDS
 REFINEMENTS IN THE Z-T METHOD OF EXTREME VALUE ANALYSIS FOR SMALL WATERSHEDS Lloyd W. Swift, Jr., Jack B. Waide, and David L. White Coweeta Hydrologic Laboratory Southeastern Forest Experiment Station,
Hydrological And Water Quality Modeling For Alternative Scenarios In A Semi-arid Catchment
 Hydrological And Water Quality Modeling For Alternative Scenarios In A Semi-arid Catchment AZIZ ABOUABDILLAH, ANTONIO LO PORTO METIER Final Conference: Brussels, Belgium-4-6 November 2009 Outline Problem
Planning Beyond the Supply/Demand Gap: Water Supply Vulnerabilities in New Mexico Presented by NM Universities Working Group on Drought
 Planning Beyond the Supply/Demand Gap: Water Supply Vulnerabilities in New Mexico Presented by NM Universities Working Group on Drought 1 Janie Chermak, David Gutzler, Peggy Johnson, J. Phillip King, Lee
Relationships between low-flow characteristics of South African streams
 Relationships between low-flow characteristics of South African streams VY Smakhtin * and M Toulouse Institute for Water Research, Rhodes University, PO Box 94, Grahamstown, 64, South Africa Ecole Nationale
The Fourth Assessment of the Intergovernmental
 Hydrologic Characterization of the Koshi Basin and the Impact of Climate Change Luna Bharati, Pabitra Gurung and Priyantha Jayakody Luna Bharati Pabitra Gurung Priyantha Jayakody Abstract: Assessment of
Iowa Climate Change Adaptation and Resilience: Applying Climate Data to Plans & Ordinances
 Iowa Climate Change Adaptation and Resilience: Applying Climate Data to Plans & Ordinances Christopher J. Anderson, PhD Assistant Director, Climate Science Program Iowa State University Integrating Hazard
Comparison of Recharge Estimation Methods Used in Minnesota
 Comparison of Recharge Estimation Methods Used in Minnesota by Geoffrey Delin, Richard Healy, David Lorenz, and John Nimmo Minnesota Ground Water Association Spring Conference Methods for Solving Complex
Improved Water Supply Forecasts for the Kootenay Basin
 Improved Water Supply Forecasts for the Kootenay Basin Randal T. Wortman Hydraulic Engineer August 4, 2005 Columbia Basin Water Management Division, U.S. Army Corps PO Box 2870, Portland, OR 97208-2870
Water Supply Board Briefing. Water Operations Department March 22, 2016
 Water Supply Board Briefing Water Operations Department March 22, 2016 Water Supply Briefing California Water Supply District Water Supply Water Supply Projections Water Supply Schedule 2 California Water
M.L. Kavvas, Z. Q. Chen, M. Anderson, L. Liang, N. Ohara Hydrologic Research Laboratory, Civil and Environmental Engineering, UC Davis
 Assessment of the Restoration Activities on Water Balance and Water Quality at Last Chance Creek Watershed Using Watershed Environmental Hydrology (WEHY) Model M.L. Kavvas, Z. Q. Chen, M. Anderson, L.
A hydro-ecological assessment method for temporary rivers. The Candelaro river case study (SE, Italy)
") SWAT 2013 Conference Toulouse France July 17th-19th, 2013 A hydro-ecological assessment method for temporary rivers. The Candelaro river case study (SE, Italy) A.M. De Girolamo 1 F. Gallart 2 G.Pappagallo
SWAT 2013 Conference Toulouse France July 17th-19th, 2013 A hydro-ecological assessment method for temporary rivers. The Candelaro river case study (SE, Italy) A.M. De Girolamo 1 F. Gallart 2 G.Pappagallo
Hydrologic Pathways: Precipitation, ET, Storage, Runoff & Recharge. Joe Magner, MPCA
 Hydrologic Pathways: Precipitation, ET, Storage, Runoff & Recharge Joe Magner, MPCA Concrete! Sluice gates Channels What was the consequence Loss of 60,000 fishing jobs Initial 20 % loss of lake volume,
The Impacts of Climate Change on Portland s Water Supply
 The Impacts of Climate Change on Portland s Water Supply Richard Palmer and Margaret Hahn University of Washington Department of Civil and Environmental Engineering Joe Dvorak, Dennis Kessler, Azad Mohammadi
Chehalis Basin Strategy Causes of Extreme Flooding. October 11, 2016 Policy Workshop
 Chehalis Basin Strategy Causes of Extreme Flooding October 11, 2016 Policy Workshop Agenda Hydrology o Precipitation o Flow Climate Change Effects Land Use o Channel straightening and incision o Riparian
Impact of Future Climate Change on the Water Resources System of Chungju Multi-purpose Dam in South Korea
 2012 International SWAT Conference Impact of Future Climate Change on the Water Resources System of Chungju Multi-purpose Dam in South Korea 19 July 2012 PARK, Jong-Yoon* / JUNG, In-Kyun / Jang, Cheol-Hee
M.L. Kavvas, Z. Q. Chen, M. Anderson, L. Liang, N. Ohara Hydrologic Research Laboratory, Civil and Environmental Engineering, UC Davis
 Assessment of the Restoration Activities on Water Balance and Water Quality at Last Chance Creek Watershed Using Watershed Environmental Hydrology (WEHY) Model M.L. Kavvas, Z. Q. Chen, M. Anderson, L.
5.5 Improving Water Use Efficiency of Irrigated Crops in the North China Plain Measurements and Modelling
 183 5.5 Improving Water Use Efficiency of Irrigated Crops in the North China Plain Measurements and Modelling H.X. Wang, L. Zhang, W.R. Dawes, C.M. Liu Abstract High crop productivity in the North China
IRRIGATION SCHEDULING OF ALFALFA USING EVAPOTRANSPIRATION. Richard L. Snyder and Khaled M. Bali 1 ABSTRACT
 IRRIGATION SCHEDULING OF ALFALFA USING EVAPOTRANSPIRATION Richard L. Snyder and Khaled M. Bali 1 ABSTRACT This paper describes the Irrigation Scheduling Alfalfa (ISA) model, which is used to determine
How to Get More Value from Your Survey Data
 Technical report How to Get More Value from Your Survey Data Discover four advanced analysis techniques that make survey research more effective Table of contents Introduction..............................................................3
APRIL 23, Capacity Value of Wind Assumptions and Planning Reserve Margin
 APRIL 23, 2014 Capacity Value of Wind Assumptions and Planning Reserve Margin Executive Summary Effective Load Carrying Capacity (ELCC), or capacity value, of variable generation and required planning
Agenda. Evaluation of Lake Superior Regulation Plans Using Robustness and Climate Informed Risk
 2/6/22 Evaluation of Lake Superior Regulation Plans Using Robustness and Climate Informed Risk Paul Moody 3 Feb 22 Agenda Overview and Background Decision Scaling Process Climate Response Function Application
BAEN 673 / February 18, 2016 Hydrologic Processes
 BAEN 673 / February 18, 2016 Hydrologic Processes Assignment: HW#7 Next class lecture in AEPM 104 Today s topics SWAT exercise #2 The SWAT model review paper Hydrologic processes The Hydrologic Processes
Underlying any discussion of the long-term
 UNIVERSITIES COUNCIL ON WATER RESOURCES, ISSUE 126, PAGES 48-53, NOVEMBER 2003 Respecting the Drainage Divide: A Perspective on Hydroclimatological Change and Scale Katherine K. Hirschboeck University
Settlement Agreement Report
 Settlement Agreement Report Fourth Quarter October December 2010 Prepared for the Technical Oversight Committee February 15, 2011 Prepared by: Cheol Mo, Violeta Ciuca, and Stuart Van Horn Restoration Sciences
COORDINATING DEMAND FORECASTING AND OPERATIONAL DECISION-MAKING WITH ASYMMETRIC COSTS: THE TREND CASE
 COORDINATING DEMAND FORECASTING AND OPERATIONAL DECISION-MAKING WITH ASYMMETRIC COSTS: THE TREND CASE ABSTRACT Robert M. Saltzman, San Francisco State University This article presents two methods for coordinating
2
 1 2 3 4 5 6 The program is designed for surface water hydrology simulation. It includes components for representing precipitation, evaporation, and snowmelt; the atmospheric conditions over a watershed.
Here is an overview of the material I will present over the next 20 minutes or so. We ll start with statistics, move on to physics, and look at
 1 Here is an overview of the material I will present over the next 20 minutes or so. We ll start with statistics, move on to physics, and look at climate change issues. Then we will move onto discussion
Attachment 1. Categorical Summary of BMP Performance Data for Solids (TSS, TDS, and Turbidity) Contained in the International Stormwater BMP Database
 Contained in the International Stormwater BMP Database") Attachment 1 Categorical Summary of BMP Performance Data for Solids (TSS, TDS, and Turbidity) Contained in the International Stormwater BMP Database Prepared by Geosyntec Consultants, Inc. Wright Water
Attachment 1 Categorical Summary of BMP Performance Data for Solids (TSS, TDS, and Turbidity) Contained in the International Stormwater BMP Database Prepared by Geosyntec Consultants, Inc. Wright Water
Climate change in the Mid-Atlantic Region
 Climate change in the Mid-Atlantic Region Raymond Najjar Department of Meteorology and Atmospheric Science The Pennsylvania State University Monitoring and Assessing Impacts of Changes in Weather Patterns
Ch 18. Hydrologic Cycle and streams. Tom Bean
 Ch 18. Hydrologic Cycle and streams Tom Bean Wednesday s outline 1. the hydrologic cycle reservoirs cycling between them Evaporation and the atmosphere 2. Surface hydrology infiltration and soil moisture
Error Analysis and Data Quality
 Error Analysis and Data Quality B-1 Error Analysis The overall accuracy of water budget calculations depends on the relative accuracy of the input data. A simplified example is discussed as follows to
Water Supply Discussion - Demands Inflows/Pass-Thru Requirements of Agreed Order. Council Presentation August 30, 2016
 Water Supply Discussion - Demands Inflows/Pass-Thru Requirements of Agreed Order Council Presentation August 30, 2016 1 Today s Presentation Alternative Demand Projection Kristi Shaw (HDR) Fresh Water
Practical Needs and Approaches for Water Resources Adaptation to Climate Uncertainty
 Practical Needs and Approaches for Water Resources Adaptation to Climate Uncertainty Rolf Olsen, PhD Senior Lead, Climate Change Institute for Water Resources U.S. Army Corps of Engineers Alexandria, Virginia
WaterSim: Supply and Demand Simulation Model for Metropolitan Phoenix
 WaterSim: Supply and Demand Simulation Model for Metropolitan Phoenix Teacher s Guide to Using WaterSim on the Web http://watersim.asu.edu Global Institute of Sustainability, Arizona State University Introduction:
Tutorial Segmentation and Classification
 MARKETING ENGINEERING FOR EXCEL TUTORIAL VERSION v171025 Tutorial Segmentation and Classification Marketing Engineering for Excel is a Microsoft Excel add-in. The software runs from within Microsoft Excel
The Texas A&M University and U.S. Bureau of Reclamation Hydrologic Modeling Inventory (HMI) Questionnaire
 Questionnaire") The Texas A&M University and U.S. Bureau of Reclamation Hydrologic Modeling Inventory (HMI) Questionnaire May 4, 2010 Name of Model, Date, Version Number Dynamic Watershed Simulation Model (DWSM) 2002
The Texas A&M University and U.S. Bureau of Reclamation Hydrologic Modeling Inventory (HMI) Questionnaire May 4, 2010 Name of Model, Date, Version Number Dynamic Watershed Simulation Model (DWSM) 2002
Climate and Water Supply in the Santa Ana River Watershed
 Climate and Water Supply in the Santa Ana River Watershed Will surface water supply decrease? Annual surface water is likely to decrease over the future periods. Precipitation shows somewhatlong term decreasing
Conservation Strategies for Lawn Irrigation During Drought A Colorado Experience
 Conservation Strategies for Lawn Irrigation During Drought A Colorado Experience Brent Q. Mecham 1 CID, CIC, CLIA, CGIA Background: Colorado experienced its worst drought in recorded history during 2002.
The Pressure Is Still On: Deep Well Injection Performance for RO Concentrate Disposal. Abstract
 The Pressure Is Still On: Deep Well Injection Performance for RO Concentrate Disposal Christopher J. Stillwell, PE CDM Smith 555 17th Street, Suite 1100 Denver, Colorado 80204 stillwellcj@cdmsmith.com
Modeling framework for water resources management under uncertain conditions: a case study
 Milestone Workshop 11 April 213, Nogales AZ Modeling framework for water resources management under uncertain conditions: a case study NOAA Climate and Societal Interactions Sectoral Applications Research
Regionalization of SWAT Model Parameters for Use in Ungauged Watersheds
 Water 21, 2, 849-871; doi:1.339/w24849 OPEN ACCESS water ISSN 273-4441 www.mdpi.com/journal/water Article Regionalization of SWAT Model Parameters for Use in Ungauged Watersheds Margaret W. Gitau 1, *and
Recent RiverWare and RiverSMART applications on the Colorado River Basin RiverWare User Group Meeting August 24, 2016
 Recent RiverWare and RiverSMART applications on the Colorado River Basin 2016 RiverWare User Group Meeting August 24, 2016 Overview of Recent RiverWare and RiverSMART applications on the Colorado River
CALMAC Study ID PGE0354. Daniel G. Hansen Marlies C. Patton. April 1, 2015
 2014 Load Impact Evaluation of Pacific Gas and Electric Company s Mandatory Time-of-Use Rates for Small and Medium Non-residential Customers: Ex-post and Ex-ante Report CALMAC Study ID PGE0354 Daniel G.
Water Resources Research Report
 THE UNIVERSITY OF WESTERN ONTARIO DEPARTMENT OF CIVIL AND ENVIRONMENTAL ENGINEERING Water Resources Research Report City of London: Vulnerability of Infrastructure to Climate Change Background Report #1
Climate Change in the Columbia Basin. Stephanie Smith Manager of Hydrology, BC Hydro
 Climate Change in the Columbia Basin Stephanie Smith Manager of Hydrology, BC Hydro June 20, 2017 Outline Climate change in the Columbia River basin What has happened? What could happen? What can we do
Supplementary Figure 1. Comparisons of actual tree-ring chronologies (solid line) with
 with") Supplementary Figure 1. Comparisons of actual tree-ring chronologies (solid line) with simulated chronologies from VS-Lite modeling (dashed line) for each site in the period 1953-2000. The inputs to the
Supplementary Figure 1. Comparisons of actual tree-ring chronologies (solid line) with simulated chronologies from VS-Lite modeling (dashed line) for each site in the period 1953-2000. The inputs to the
Exploring Drought in the San Antonio Area Between 1700 and 1979
 Exploring Drought in the San Antonio Area Between 1700 and 1979 by Raymond P. Mauldin Prepared for: Edwards Aquifer Authority 1615 N. St. Mary s Street San Antonio, Texas 2003 Prepared by: Center for Archaeological
Contribution of Irrigation Seepage to Groundwater-Surface Water Interactions on the Eastern Snake River Plain
 Contribution of Irrigation Seepage to Groundwater-Surface Water Interactions on the Eastern Snake River Plain Rob Van Kirk, HSU Department of Mathematics http://www.humboldt.edu/henrysfork/ BSU Geosciences
A comparative study of the methods for estimating streamflow at ungauged sites
 22nd International Congress on Modelling and Simulation, Hobart, Tasmania, Australia, 3 to 8 December 2017 mssanz.org.au/modsim2017 A comparative study of the methods for estimating streamflow at ungauged
Overview of NRCS (SCS) TR-20 By Dr. R.M. Ragan
 TR-20 By Dr. R.M. Ragan") Overview of NRCS (SCS) TR-20 By Dr. R.M. Ragan TR-20 is a computer program for the simulation of runoff occurring from a single storm event. The program develops flood hydrographs from runoff and routes
Overview of NRCS (SCS) TR-20 By Dr. R.M. Ragan TR-20 is a computer program for the simulation of runoff occurring from a single storm event. The program develops flood hydrographs from runoff and routes
Lecture 9A: Drainage Basins
 GEOG415 Lecture 9A: Drainage Basins 9-1 Drainage basin (watershed, catchment) -Drains surfacewater to a common outlet Drainage divide - how is it defined? Scale effects? - Represents a hydrologic cycle
Transactions. American Geophysical Union Volume 28, Number 1 February 1947
 Transactions. American Geophysical Union Volume 28, Number 1 February 1947 EFFECT OF REMOVAL OF STREAM-BANK VEGETATION UPON WATER YIELD Earl G. Dunford and P. W. Fletcher Abstract--This is a preliminary
Uncertainty in Hydrologic Modelling for PMF Estimation
 Uncertainty in Hydrologic Modelling for PMF Estimation Introduction Estimation of the Probable Maximum Flood (PMF) has become a core component of the hydrotechnical design of dam structures 1. There is
Chief, Hydrological Sciences Laboratory NASA Goddard Space Flight Center
 Detection of Extreme Events with GRACE and Data Assimilation, Ph.D. Chief, Hydrological Sciences Laboratory NASA Goddard Space Flight Center Gravity Recovery and Climate Experiment (GRACE) Soil Moisture
Coincidence Factor Study Residential and Commercial & Industrial Lighting Measures. Prepared for; New England State Program Working Group (SPWG)
") Coincidence Factor Study Residential and Commercial & Industrial Lighting Measures Prepared for; New England State Program Working Group (SPWG) For use as an Energy Efficiency Measures/Programs Reference
Coincidence Factor Study Residential and Commercial & Industrial Lighting Measures Prepared for; New England State Program Working Group (SPWG) For use as an Energy Efficiency Measures/Programs Reference
Section 2: Hydrology. Introduction. What is the Return Period? Intensity-Duration-Frequency Data. Generating a runoff hydrograph 85 Minutes
 Section 2: Hydrology Generating a runoff hydrograph 85 Minutes Press Space, PageDown, or Click to advance. Press PageUp to reverse. Esc to exit. Right-Click for other options. Copyright 2004 HydroCAD Software
Emerging Issues: Adapting To Climate Change
 Emerging Issues: Adapting To Climate Change G. Tracy Mehan, III, The Cadmus Group, Inc. DISCLAIMER: The opinions presented by the author do not necessarily reflect the policies or opinions of the U.S.
Rock Creek Floodplain Analysis
 Rock Creek Floodplain Analysis www.co.washington.or.us By Jon Franczyk 1996 Flood, www.co.washington.or.us 1996 Flood, www.co.washington.or.us Project Outline Project Goals Introduction Background Study
The Confluence Model. Presentation to Modeling and Forecasting Working Group January 21, 2015
 The Confluence Model Presentation to Modeling and Forecasting Working Group January 21, 2015 Introductions Presenter: Gary Fiske Working Group Water Department staff Objective: Penetrate the Black Box
EVALUATION OF HYDROLOGIC AND WATER RESOURCES RESPONSE TO METEOROLOGICAL DROUGHT IN THESSALY, GREECE
 EVALUATION OF HYDROLOGIC AND WATER RESOURCES RESPONSE TO METEOROLOGICAL DROUGHT IN THESSALY, GREECE A. LOUKAS*, AND L. VASILIADES Laboratory of Hydrology and Water Systems Analysis,, Volos, Greece *E-mail:
Rainfall, Runoff and Peak Flows: Calibration of Hydrologic Design Methods for the Kansas City Area
 Rainfall, Runoff and Peak Flows: Calibration of Hydrologic Design Methods for the Kansas City Area Bruce McEnroe, Bryan Young, Ricardo Gamarra and Ryan Pohl Department of Civil, Environmental, and Architectural
Application of a Basin Scale Hydrological Model for Characterizing flow and Drought Trend
 Application of a Basin Scale Hydrological Model for Characterizing flow and Drought Trend 20 July 2012 International SWAT conference, Delhi INDIA TIPAPORN HOMDEE 1 Ph.D candidate Prof. KOBKIAT PONGPUT
Wheat Pricing Guide. David Kenyon and Katie Lucas
 Wheat Pricing Guide David Kenyon and Katie Lucas 5.00 4.50 Dollars per bushel 4.00 3.50 3.00 2.50 2.00 81 82 83 84 85 86 87 88 89 90 91 92 93 94 95 96 97 Year David Kenyon is Professor and Katie Lucas
PRE-PRODUCTION COPY. Colorado River Basin Water Supply and Demand Study. Executive Summary
 Colorado River Basin Water Supply and Demand Study Executive Summary U. S. Department of the Interior Bureau of Reclamation December 2012 Executive Summary Spanning parts of the seven states of Arizona,
Agence Nationale de la Météorologie du Sénégal
 Using INSTAT software with daily rainfall data to estimate best sowing dates for farmers in Saint Louis of Senegal By Elarion Sambou Agence Nationale de la Météorologie du Sénégal (A.N.A.M.S.) BP 8257,