MONGOLIA: COAL AND DERIVED FUELS
|
|
|
- Everett Boyd
- 6 years ago
- Views:
Transcription
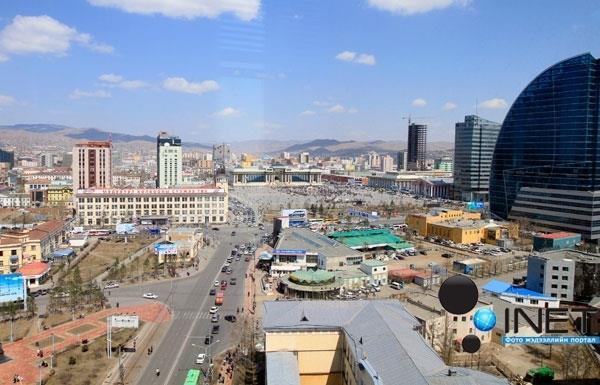
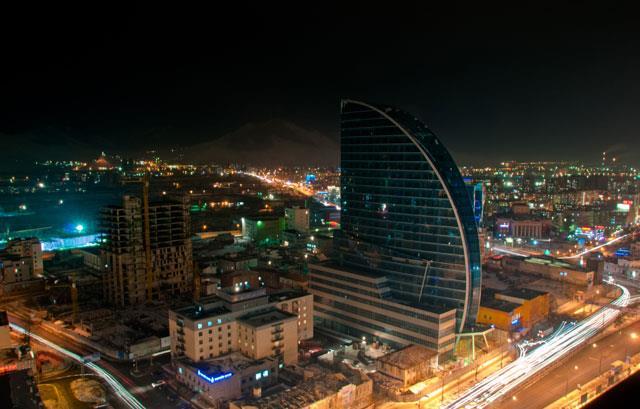
1 International Workshop on Energy Statistics and Energy Balances MONGOLIA: COAL AND DERIVED FUELS (DATA COLLECTION AND PROCESSING) Ariunaa Khurelbaatar Senior Officer of Macro Economics Statistics Department, NRSO, Mongolia May 2016
2 Content Brief introduction about Mongolia Data source and classification Collection period and frequency Data collection, processing and validation Data dissemination
 Population density: 1.8 per square km Economic growth: 2.3% (2015) GDP: USD 4.2 thous.")
3 Mongolia in figures Territory: 1.5 million square kms (19th largest in the World) The total length of border: 8.2 thous.km of which: with Russia 3.5 thous.km with China 4.7 thousand km Population: 3.0 million (2015) Population density: 1.8 per square km Economic growth: 2.3% (2015) GDP: USD 4.2 thous.$ (2015) Major industries: Agriculture, mining Natural resources: Copper,coal, gold, iron, silver, molybdenum, tin, zinc, wolfram, fluorspar, and petroleum 3


4 Temperatures in the winter -15 C -40 C, in the summer +10 C +35 C
5 Coal Mining in Mongolia Coal statistics usually include primary (hard coal and lignite) and derived fuels. Resources (2013) Coal (bln.t) 175.5
6 DATA COLLECTION AND PROCESSING Compilation of data Send survey questionnaire to companies Check& validete data other administrative data Coal and derived fuels statistics Receive questionnaire from companies Verification and editing of data Quality control of questionnaire 6
7 Processing and data validation Verification includes logical, range, variance and consistency checks Validation edits Logical edits Consistency edits Range edits Variance edits to check the validity of basic identification of classificatory items in unit data ensure that two or more data items do not have contradictory values. check to ensure that precise and correct arithmetic relationships exist between two or more data items. identify whether or not a data item value falls inside a determined acceptable range. involve looking for suspiciously high variances at the output edit stage. 7
8 METHODOLOGY, CLASSIFICATION Guidelines/Methodologies: Classification: Data source: Methodology on Estimation of Energy Balance, approved by NSO, 2008 ISIC 4.0 CPC 2.0 Coal, coal product classification (MNS6457: 2014) Official statistics (companies) Administrative data Ministry of Mining Data of Customs office
9 CALCULATE FOLLOWING BALANCES EVERY YEAR Since 1965 BALANCE OF ELECTRICITY Since 1965 BALANCE OF COAL Since 1995 BALANCE OF THERMAL ENERGY
10 COLLECTION PERIOD AND FREQUENCY Name of questionnaire Frequency SCOPE Source Number Of Entities Number of indicators Disseminatio n INDUSTRIAL MONTHLY REPORT PRODUCER PRICE INDEX Monthly Full Companies Monthly Sample Companies 5 1 Monthly bulletin & yearbook Monthly bulletin & yearbook BALANCE OF COAL Annual Full Companies Yearbook ANNUAL ENTREPRISE SURVEY Annual Full Companies Yearbook SUT Annual Sample Companies 42 1 Year book
11 DATA DISSEMINATION BALANCE OF COAL Indicators thous.t Resources- Total Stock at the beginning of the year Produced State owned mining company Private sector's mining company Import Consumption-Total Consumed by thermal power stations Distributed to establishments and households for fuel purposes Industry & construction Transport & communication Agriculture Communal housing of which: household Other Manufacturing Export Losses during transportation and storage Stock at the end of the year
12 GROSS INDUSTRIAL OUTPUT*, by international standard industrial classification Divisions Total Mining and quarrying Mining of coal and lignite Extraction of crude petroleum Mining of metal ores ** bln.tog Manufacturing Manufacture of coke and refined petroleum products
13 COMPOSITION OF GROSS INDUSTRIAL OUTPUT*, by international standard industrial classification, by percentage share to total Divisions ** Percentage share to total Total Mining and quarrying Mining of coal and lignite Extraction of crude petroleum Mining of metal ores Manufacturing Manufacture of coke and refined petroleum products
14 COAL PRODUCTION AND EXPORT Commodities Unit * Coal production thous.t Export- coal thous.t Coal per capita t
15 SUPPLY TABLE at basic prices, including a transformation into purchasers' prices, bln.tog Products ISIC Mining of coal and lignite Manufactur e of coke and refined petroleum products DOMESTIC OUTPUT, at basic prices Import TOTAL SUPPLY, at basic prices Valuation TOTAL SUPPLY, at purchasers ' prices A C CPC Coal and lignite; peat Electricity, town gas, steam and hot water Grain mill products, starches and starch products; other food products Coke oven products; refined 23 petroleum products; nuclear fuel Wholesale trade services Retail trade services Accommodation, food and beverage 42 services Passenger transport services Freight transport services Supporting transport services Electricity, gas and water distribution 48 (on own account) Real estate services Leasing or rental services without operator Other professional, technical and business services Support services to agriculture, hunting, forestry, fishing, mining and 57 utilities 69 TOTAL OUTPUT at basic prices
16 USE TABLE at purchasers' prices, bln.tog No Description CPC Mining of coal and lignite Manufacture of coke and refined petroleum products INTERMEDIATE CONSUMPTION Final consumption Gross Capital Formation Export TOTAL USE, at purchasers' prices A B C Coke oven products; 33 refined petroleum products; nuclear fuel Passenger transport services Freight transport services Supporting transport services Electricity, gas and water 69 distribution (on own account) Financial and related services Leasing or rental services without operator Other professional, 83 technical and business services Support services Support services to 86 agriculture, hunting, forestry, fishing, mining and utilities TOTAL Compensation of 74 D11 employees Other net taxes on 75 D29 production Consumption of fixed 76 capital Operating surplus, net B3g VALUE ADDED at basic prices 79 OUTPUT at basic prices
17 Thank you for you attention
UN List of Industrial Products
 UN List of Industrial Products United Nations Statistics Division Workshop on Classifications, Montevideo, Uruguay, 14-18 March 2005 25/04/2005 1 History UN list of industrial products was developed in
MINISTRY OF PLANNING AND INVESTMENT LAO STATISTICS BUREAU
 Workshop on Energy Statistics for ASEAN Countries Kuala Lumpur, Malaysia 21-23 November 2016 Data Collection On Energy Statistics and Using Data to Establish The Supply and Use Table Sypaseut NAVONGSA
NACE: Statistical Classification of Economic Activities
 NACE: Statistical Classification of Economic Activities NACE Rev.1 : To use until the 2008 operation included Section A Agriculture, hunting and forestry 01 Agriculture, hunting and related service activities
Chapter 5 Flows, stocks and related concepts
 Draft annotated outline of Chapter 5 Chapter 5 Flows, stocks and related concepts Below is an annotated draft of Chapter 5. The text contains a number of issues which need to be discussed to guide further
Gross Domestic Product of Georgia in 2010
 Gross Domestic Product of Georgia in 2010 The real growth of Gross Domestic Product (GDP) of Georgia in 2010 amounted to 6.4 percent and deflator grew by 8.7 percent year-on-year. In the same period the
PHILIPPINES. Sectoral Activities Department. Agriculture & Fishing. Fig. 1: Employment by Major Economic Activity ('000s),
,") PHILIPPINES 35,000 30,000 25,000 20,000 15,000 10,000 Fig. 1: Employment by Major Economic Activity ('000s), 2001-2008 Agriculture, Hunting and Fishing Mining and Quarrying Electricity, Gas and Water Supply
PHILIPPINES 35,000 30,000 25,000 20,000 15,000 10,000 Fig. 1: Employment by Major Economic Activity ('000s), 2001-2008 Agriculture, Hunting and Fishing Mining and Quarrying Electricity, Gas and Water Supply
PERU. Sectoral Activities Department. Wholesale & Retail Trade. Fig. 1: Employment by Major Economic Activity ('000s),
,") PERU 4,500 Fig. 1: Employment by Major Economic Activity ('000s), 2002-2008 Wholesale & Retail Trade 4,000 3,500 3,000 2,500 2,000 1,500 1,000 500 0 2002 2004 2006 2008 Source: ILO Laborsta; Persons aged
PERU 4,500 Fig. 1: Employment by Major Economic Activity ('000s), 2002-2008 Wholesale & Retail Trade 4,000 3,500 3,000 2,500 2,000 1,500 1,000 500 0 2002 2004 2006 2008 Source: ILO Laborsta; Persons aged
1. Economy. Economic Aggregates. Merchandise Foreign Trade. Prices. Financial Statistics. Government Finance. Wages and Compensation
 1. Economy Economic Aggregates Merchandise Foreign Trade Prices Financial Statistics Government Finance Wages and Compensation Foreign Investment 12 Statistical Yearbook of Abu Dhabi 2015 Statistical Yearbook
The growth rates of agriculture, forestry & fishing, mining & manufacturing and electricity, gas & water supply increased.
 PRESS RELEASE Embargoed until release at 12:00 P.M., July 22, 2017 2017-7-22 Kang Chang Ku : 82-2-759-4368 changku.kang@bok.or.kr Gross Domestic Product Estimates * for North Korea in 2017 * Direct comparisons
Table 1. Gross Domestic Product of Bangladesh at Current Prices, to
 Table 1. Gross Domestic Product of Bangladesh at Current Prices, 2010-11 to 2014-15 (Million Taka) A. Agriculture 1,539,506 1,707,064 1,857,524 2,062,758 2,240,810 1. AGRICULTURE AND FORESTRY 1,254,686
Chapter 23: Classifications
 Chapter 23: Classifications Regrouping and coding of industries (A) and products (P) The classifications of activities and products to be used are NACE Rev. 2 and CPA 2008. The corresponding aggregations
INDONESIA. Manufacturing: Food & Beverages. Sectoral Activities Department
 INDONESIA Manufacturing: Food & Beverages Key Labour Market Indicators (2009) Economically Active Population Total: 113,740,000 13,000 12,500 12,000 11,500 11,000 10,500 10,000 Fig.1: Employment in Manufacturing
Accounts for primary material flows by branches and material categories
 Accounts for primary material flows by branches and material categories -methodological concepts, results and applications- Paper presented at the 9 th London Group Meeting in Copenhagen 22 24 September
COMBINED PRESENTATIONS
 COMBINED PRESENTATIONS Leila Rohd-Thomsen United Nations Statistics Division (Based on a presentation by Sjoerd Schenau, Statistics Netherlands) 25 February 2016, Chiba, Japan Content Integrating information
CHILE. Sectoral Activities Department. Community, Social & Personal Services. Fig. 1: Employment by Major Economic Activity ('000s),
,") CHILE 7,000 6,000 5,000 Fig. 1: Employment by Major Economic Activity ('000s), 2000-2008 Agriculture, Hunting, Forestry and Fishing Mining and Quarrying Community, Social & The community, social and personal
CHILE 7,000 6,000 5,000 Fig. 1: Employment by Major Economic Activity ('000s), 2000-2008 Agriculture, Hunting, Forestry and Fishing Mining and Quarrying Community, Social & The community, social and personal
Economic Surveys Results. Release Date : Oct 2015
 Economic Surveys Results 2014 Release Date : Oct 2015 Table of Contents Introduction 4 Key Points 5 Analysis of Results 6 3.1 Value added 6 3.2 Total production 7 3.3 Gross fixed capital formation 8 3.4
The Gross National Product (GNP) is GDP added by net foreign income. National Income is GNP deducted by indirect net taxes (net) and depreciation.
 is GDP added by net foreign income. National Income is GNP deducted by indirect net taxes (net) and depreciation.") M E T A D A T A BASIC INFORMATION 1 Data Category : Gross Domestic Product (GDP) 2 Statistics Disseminator : Statistics Department, Bank Indonesia 3 Address : Jl. M.H. Thamrin No. 2 Jakarta 4 Contact :
M E T A D A T A BASIC INFORMATION 1 Data Category : Gross Domestic Product (GDP) 2 Statistics Disseminator : Statistics Department, Bank Indonesia 3 Address : Jl. M.H. Thamrin No. 2 Jakarta 4 Contact :
Energy and Resources-- Cuba
 Energy and Resources-- Cuba EarthTrends Country Profiles Energy Production and Consumption Cuba Central America & Caribbean World (in thousand metric tons of oil equivalent) {a} Total energy production,
DEFINITIONS FOR SMALL AND MEDIUM ENTERPRISES IN MALAYSIA. (Approved for Adoption by National SME Development Council on 9 June 2005)
") DEFINITIONS FOR SMALL AND MEDIUM ENTERPRISES IN MALAYSIA (Approved for Adoption by National SME Development Council on 9 June 2005) Issued by: Secretariat to National SME Development Council Bank Negara
DEFINITIONS FOR SMALL AND MEDIUM ENTERPRISES IN MALAYSIA (Approved for Adoption by National SME Development Council on 9 June 2005) Issued by: Secretariat to National SME Development Council Bank Negara
INDONESIA. Sectoral Activities Department. Agriculture. Fig. 1: Employment by Major Economic Activity ('000s)
") INDONESIA 100,000 80,000 60,000 40,000 20,000 2,500,000 2,000,000 1,500,000 1,000,000 500,000 0 0 Fig. 1: Employment by Major Economic Activity ('000s) 2000-2008 2000 2002 2004 2006 2008 Fig. 2: Sectoral
INDONESIA 100,000 80,000 60,000 40,000 20,000 2,500,000 2,000,000 1,500,000 1,000,000 500,000 0 0 Fig. 1: Employment by Major Economic Activity ('000s) 2000-2008 2000 2002 2004 2006 2008 Fig. 2: Sectoral
Production in the agriculture, forestry & fishing sector grew by 1.2% in 2014(+1.9% in
 PRESS RELEASE Embargoed until release at 12:00 P.M., July 17, 2015 2015-7-17 Kim Young Hwan : 82-2-759-4394 yhkim@bok.or.kr Gross Domestic Product Estimates * for North Korea in 2014 * Direct comparisons
INDONESIA'S EXPERIENCES IN THE COMPILATION OF ENVIRONMENTAL ECONOMIC ACCOUNTS
 BPS Statistics Indonesia INDONESIA'S EXPERIENCES IN THE COMPILATION OF ENVIRONMENTAL ECONOMIC ACCOUNTS Etjih Tasriah (tasriah@bps.go.id) BPS Statistics Statistics Indonesia HISTORY OF SUSTAINABLE INDICTORS
CANADA. Sectoral Activities Department. Wholesale & Retail Trade. Fig. 1: Employment by Major Economic Activity ('000s),
,") CANADA Fig. 1: Employment by Major Economic Activity ('000s), 2000-2008 20,000 18,000 16,000 14,000 12,000 10,000 8,000 6,000 4,000 2,000 0 2000 2002 2004 2006 2008 Agriculture, Forestry, Fishing Mining
CANADA Fig. 1: Employment by Major Economic Activity ('000s), 2000-2008 20,000 18,000 16,000 14,000 12,000 10,000 8,000 6,000 4,000 2,000 0 2000 2002 2004 2006 2008 Agriculture, Forestry, Fishing Mining
Inclusion of Informal Sector Estimates in SUTs
 United Nations Economic Commissions for Africa Regional Seminar on Compilation and Application of Supply-Use Tables in Africa 5-8 February 2018, Addis Ababa, Ethiopia Inclusion of Informal Sector Estimates
A Suggestion for SEEA Standard Tables on Energy
 London Group Meeting on Environmental and Economic Accounting 29 September 3 October 2008 EUROSTAT, Brussels, Belgium A Suggestion for SEEA Standard Tables on Energy Ole Gravgård Pedersen Statistics Denmark
ENERGY BALANCE COMPILATION
 ENERGY BALANCE COMPILATION Study tour on Energy statistics and Energy balances under INOGATE programme Sofia, 5-7 November 2013 Maria Georgieva OVERVIEW INTRODUCTION DATA SOURCES FOR ENERGY BALANCES STRUCTURE
The United Republic of Tanzania GROSS DOMESTIC PRODUCT 2017
 The United Republic of Tanzania GROSS DOMESTIC PRODUCT 2017 National Bureau of Statistics Ministry of Finance and Planning March, 2018 1.0 Introduction Gross Domestic Product (GDP) is measured as the value
A Comparison of Contributions to the Canadian Economy of Key Bulk Commodity Shippers and Rail Freight Carriers
 Policy and Economic Analysis Program Rotman School of Management University of Toronto 140 St. George St., Ste 325 Toronto, Ontario M5S 3G6 Final Report October 2009 A Comparison of Contributions to the
PHYSICAL ENERGY FLOW ACCOUNTS AND ENVIRONMENTAL TAXES IN MONGOLIA
 JOINT OECD/UNECE SEMINAR ON IMPLEMENTATION OF SEEA Session 2 Guidelines for SEEA implementation and new ways to generate data PHYSICAL ENERGY FLOW ACCOUNTS AND ENVIRONMENTAL TAXES IN MONGOLIA B. Ankhzaya,
PRESS RELEASE. Industrial Production Price Index
 ROMANIA Press Office 16 Libertăţii Avenue, Sector 5, Bucharest Tel/Fax: 318 18 69; Fax: 312 48 75 e-mail: romstat@insse.ro; biroupresa@insse.ro PRESS RELEASE No. 48 of March 4, 2013 Industrial Production
Iran. Farzad Taheripour. 1. Data Source
 Iran Farzad Taheripour The Iranian input-output table in the GTAP 7 Data Base is constructed from the 2001 inputoutput table supplied by the Statistical Center of Iran (SCI) 1 and some supporting tables
Leonardo Rocha Souza. International Workshop on Energy Statistics May 2016 Beijing, China.
 Leonardo Rocha Souza International Workshop on Energy Statistics 23-25 May 2016 Beijing, China http://unstats.un.org/unsd/energy Classifications Provide clear definitions of objects to be measured Provide
Workshop on Environment Statistics for East and North-East Asian countries March 2017
 Workshop on Environment Statistics for East and North-East Asian countries 13-15 March 2017 1 Outline Scope of energy flow accounts Principles governing energy flow accounts The supply-use chain Energy
2015 EDMC Handbook of Japan s & World Energy & Economic Statistics CONTENTS
 2015 EDMC Handbook of Japan s & World Energy & Economic Statistics CONTENTS Japan Chapter I. Energy and Economics 1. Economic Indicators... 4 ( 1 ) GDP and Major Energy Related Indicators... 5 ( 2 ) National
How energy statistics are used in measuring economic performance. Thomas Olsen Senior adviser, National accounts division Statistics Denmark
 How energy statistics are used in measuring economic performance Thomas Olsen Senior adviser, National accounts division Statistics Denmark >> >> Outline The use of energy statistics Economic performance:
International Recommendations for Energy Statistics. International Recommendations for Energy Statistics
 International Recommendations for Energy Statistics Environment and Energy Statistics Workshop for the Arab Region Amman, Jordan 8-12 September 2013 Environment and Energy Statistics Branch United Nations
CO2 EMISSIONS EMBODIED IN INTERNATIONAL TRADE
 CO2 EMISSIONS EMBODIED IN INTERNATIONAL TRADE Norihiko Yamano OECD Directorate for Science, Technology and Innovation OECD Steel Committee the 82 nd session 23-24 March 2017 Territorial-based CO 2 emissions
การจ ดประเภทมาตรฐานอ ตสาหกรรมประเทศไทย ป 2552
 Thailand Standard Industrial Classification : TSIC-2009 การจ ดประเภทมาตรฐานอ ตสาหกรรมประเทศไทย ป 2552 Employment Promotion Division Department of Employment Ministry of Labour MAY 22, 2014 International
This paper describes the production of a 44 sector input-output table for Kuwait for 2005.
 1. Abstract This paper describes the production of a 44 sector input-output table for Kuwait for 2005. Kuwait David Green The Kuwait Central Statistics Office and Ministry of Planning have produced a detailed
Energy sector in Mongolia. Contents Brief of energy sector Energy sector policy Future trend
 Energy sector in Mongolia Contents Brief of energy sector Energy sector policy Future trend 1 Energy sector in Mongolia Contents Brief of energy sector Energy sector policy Future trend 2 Mongolia-Socioeconomic
Estimated Employment Multipliers for the City of Johannesburg
 Estimated Employment Multipliers for the City of Johannesburg Undertaken by Trade & Industrial Policy Strategies (TIPS) for The City of Johannesburg Metro 2015 Estimation of employment multipliers for
ANNUAL QUALITY REPORT
 REPUBLIC OF SLOVENIA ANNUAL QUALITY REPORT FOR THE SURVEY GROSS INVESTMENTS IN FIXED ASSETS (INV-1, INV-3) FOR 2012 Prepared by: Edita Glinšek Date: January 2014 1/1 0 Table of Contents 0 Methodological
Chinese Copper Market Study
 Shanghai Metals Market The Leading Metals Information Provider in China Metal Bulletin Research (MBR) and SMM Information Technology Co., Ltd. (SMM) jointly launch: Chinese Copper Market Study 2010-2015
Physical Flow Accounts: Overview
 Physical Flow Accounts: Overview SEEA Training Seminar for ESCAP February 23-26, 2016 Chiba, Japan Joe St. Lawrence Statistics Canada The Economy and The Environment -Natural Resources -Ecosystem Services
China Steel Yearbook 2010
 China Steel Yearbook 2010 SBB is proud to bring you the China Steel Yearbook 2010. A bestseller for over 20 years in Chinese and now published in English for the fourth year, this book is the Bible for
How do prices of primary energy carriers influence the competitiveness of the Polish economy
 How do prices of primary energy carriers influence the competitiveness of the Polish economy Michał Przybyliński University of Łódź 17 th INFORUM World Conference, Jurmala 2009 Previous research General
Session 4: Energy accounts
 1 E-TRAINING ON THE COMPILATION ANDAPPLICATION OF ENVIRONMENTALLY EXTENDED SUPPLY-USE TABLES (EE-SUTS) IN AFRICA March-April 2018 Session 4: Energy accounts Dr. Michael Vardon Expert and Advisor michael.vardon@anu.edu.au
THEME Country profile Current state of energy sector Outlook of energy demand and supply The energy policy Documents and its implementation. Short ter
 IEEJ : June 2012 NATIONAL DISPATCHING CENTER OF POWER SYSTEMS,MONGOLIA TRAINING AND DIALOGUE PROGRAMS OF JICA www.energy.mn COUNTRY PRESENTATION: MONGOLIA ENERGY POLICY (B) THEME Country profile Current
STATE OF HAWAI'I. No. of. Total Average Rep. Units Average Quarterly Quarterly Industry March Employment Wages Wages January February March
 STATE OF HAWAI'I TOTAL, including government 37,439 598,205 6,028,316,620 10,077 596,822 598,744 599,049 TOTAL GOVERNMENT 6 123,628 1,526,182,323 12,345 121,692 123,988 125,205 Federal 1 32,650 483,102,256
STATE OF HAWAI'I. No. of. Total Average Rep. Units Average Quarterly Quarterly Industry September Employment Wages Wages July August September
 STATE OF HAWAI'I TOTAL, including government 37,044 581,957 6,080,565,857 10,448 581,677 578,368 585,826 TOTAL GOVERNMENT 6 118,031 1,532,738,257 12,986 118,907 114,660 120,525 Federal 1 34,864 560,380,978
Business-Facts Summary Dublin city, CA ( )
") 3 Digit NAICS Top Ten Summary Healthcare and Social Assistance Ambulatory Health Care Retail Trade Professional, Scientific, and Technical Other (except Public Administration) Retail Trade Retail Trade
3 Digit NAICS Top Ten Summary Healthcare and Social Assistance Ambulatory Health Care Retail Trade Professional, Scientific, and Technical Other (except Public Administration) Retail Trade Retail Trade
MATERIAL FLOW ACCOUNTS OF MONGOLIA ( ) J.Terbish, National Statistical Office of Mongolia
 J.Terbish, National Statistical Office of Mongolia") MATERIAL FLOW ACCOUNTS OF MONGOLIA (2005-2013) J.Terbish, National Statistical Office of Mongolia 1 CONTENTS 1. Brief overview Types of environmental accounts 2. Material flow accounts Objective, importance
MATERIAL FLOW ACCOUNTS OF MONGOLIA (2005-2013) J.Terbish, National Statistical Office of Mongolia 1 CONTENTS 1. Brief overview Types of environmental accounts 2. Material flow accounts Objective, importance
Census of Economic Establishments in Ethiopia
 Census of Economic Establishments in Ethiopia 1. Introduction In general, it is obvious that, availability of relevant, reliable and up to date statistical data is considered indispensable for the evaluation
IEA Coal Questionnaire Joint Rosstat IEA Energy Statistics Workshop Moscow, February 2012
 IEA Coal Questionnaire Joint Rosstat IEA Energy Statistics Workshop Moscow, February 2012 Robert Schnapp Energy Data Centre Coal, Renewables, Electricity and Heat Section Head OVERVIEW The Importance of
Republic of Korea LEAP Modeling Effort
 Republic of Korea LEAP Modeling Effort David F. von Hippel Nautilus Institute Spent Fuel and Reduction of Radiological Risk after Fukushima and Deep Borehole and Spent Fuel in East Asia WORKING GROUP MEETING
Annual GDP by production approach in current and constant prices: main issues 1
 Annual GDP by production approach in current and constant prices: main issues 1 Introduction This paper continues the series dedicated to extending the contents of the Handbook Essential SNA: Building
Nigerian Gross Domestic Product Report
 Issue 01 Quarter: One Year: 2014 Nigerian Gross Domestic Product Report Quarter One 2014 NATIONAL BUREAU OF STATISTICS Overview of GDP in Quarter One 2014 In the first quarter of 2014, Nigeria s Nominal
GUIDANCE FOR THE ACCREDITATION OF HEALTH AND SAFETY MANAGEMENT SYSTEM CERTIFICATION BODIES
 GUIDANCE FOR THE ACCREDITATION OF HEALTH AND SAFETY MANAGEMENT SYSTEM CERTIFICATION BODIES ΕΣΥ GA-H&S/01/02/08-07-2010 1 ΕΣΥ GA-H&S Issue: 01 Revision: 02 Issue Date: 11-07-2003 Revision Date: 08-07-2010
China. Li Shantong and He Janus Data Source. 2. Sector Classification
 China Li Shantong and He Janus 1 1. Data Source The source of the initial input-output (I-O) table for China is "Input-Output Table of China - 2002 from the Department of National Economy Accounting, State
& ECONOMIC STATISTICS
 2011 EDMC HANDBOOK of ENERGY & ECONOMIC STATISTICS in JAPAN CONTENTS Japan Chapter I. Energy and Economics 1.Economic Indices... 4 ( 1 ) GDP and Major Energy Related Indicators... 5 ( 2 ) National Accounts
Statistical experience in compiling the input-output tables (IOT) based on the Chilean National Accounts 2008 Benchmark Compilation 1
 based on the Chilean National Accounts 2008 Benchmark Compilation 1") Statistical experience in compiling the input-output tables (IOT) based on the Chilean National Accounts 2008 Benchmark Compilation 1 Simón Guerrero H. 1 This paper is based on the methodological developments
Statistical experience in compiling the input-output tables (IOT) based on the Chilean National Accounts 2008 Benchmark Compilation 1 Simón Guerrero H. 1 This paper is based on the methodological developments
2011 Input-Output Tables for Japan
 2011 Input-Output Tables for Japan Joint Compilation Ministry of Internal Affairs and Communications Cabinet Office Financial Services Agency Ministry of Finance Ministry of Education, Culture, Sports,
Meta Informations PUBLICATION OF DATA
 Response statistics for Public consultation on the initiative "Reforming the internal market for industrial products" from Commission Work Programme 2013 Status : Active Start date : 2013-01-22 End date
Industrial production indices - global developments
 Industry, trade and services Author: Digna AMIL Statistics in focus 61/8 Industrial production indices - global developments A great deal has been written about the internationalisation of the world economy,
China Copper Industry Chain Analysis,
 Shanghai Metals Market The Leading Metals Information Provider in China China Copper Industry Chain Analysis, 2011- Hot topic China copper supply and demand in 2011 from copper resources to final products.
The Real Economy. Chapter-2
 2.1 The Bangladesh economy experienced an impressive growth in FY18, underpinned by strong domestic and external demand, as reflected in buoyant public and private investment and consumption, driven by
Table of contents for Statistics Denmark s input-output tables, 69 industries including two preliminary years. New edition in English, June 2016.
 Table of contents for Statistics Denmark s input-output tables, 69 industries including two preliminary years. New edition in English, June 2016. Matricer Name Row Col From To DZB_fyy 69 69 Danish industries
17.INDUSTRIES 17.1 RESULTS OF ANNUAL SURVEY OF INDUSTRIES IN VELLORE DISTRICT (FACTORY SECTOR )
") 17.INDUSTRIES 17.1 RESULTS OF ANNUAL SURVEY OF INDUSTRIES 212-13 IN VELLORE DISTRICT (FACTORY SECTOR ) Sl No. Subject Value 1 No. of factories 274 2 Factories in Operation 741 In lakhs 3 Fixed Capital
17.INDUSTRIES 17.1 RESULTS OF ANNUAL SURVEY OF INDUSTRIES 212-13 IN VELLORE DISTRICT (FACTORY SECTOR ) Sl No. Subject Value 1 No. of factories 274 2 Factories in Operation 741 In lakhs 3 Fixed Capital
FLIN FLON AND REGION Economic Profile
 FLIN FLON AND REGION Economic Profile This report contains demographic, job and business data. The data in this report provide basic information about the economy of the region in order to inform the strategic
Introduction to Supply and Use Tables, part 2 Data Sources and Compilation 1
 Introduction to Supply and Use Tables, part 2 Data Sources and Compilation 1 Introduction This paper continues the series dedicated to extending the contents of the Handbook Essential SNA: Building the
Mini-presentation on Turnover/Output for Water Transportation in Poland
 24 rd Voorburg Group Meeting Oslo, Norway September 14 th to September 18 th, 2009 Mini-presentation on Turnover/Output for Water Transportation in Poland Central Statistical Office of Poland Trade and
Business-Facts Summary - 3 Digit NAICS Summary
 - 3 Digit NAICS Summary Title Page Title Page Data Version: 2018 Feb (Internal) Report Generation Method: Single Analysis Area: 1789 STATE ST, SAN DIEGO, CA, 92101-2530 Reporting Detail: As Selected Include
Volume measures in national accounts. IMF Statistics Department
 Volume measures in national accounts IMF Statistics Department Outline of this lecture Why volume measures? Volume measures in SNA main principles Methods for deriving volume measures by transaction category
Overview. UNSD Annual Questionnaire on Energy Statistics. UNSD data collection. Revision of UNSD Annual Questionnaire on Energy Statistics
 UNSD Annual Questionnaire on Energy Statistics Environment and Energy Statistics Workshop for the Arab Region Amman, Jordan 8-12 September 2013 Environment and Energy Statistics Branch United Nations Statistics
Physical Flow Accounts: Overview
 Physical Flow Accounts: Overview UNSD SEEA Training of Trainers Seminar 7-10 July 2015, Santiago Joe St. Lawrence Statistics Canada The Economy and The Environment -Natural Resources -Ecosystem Services
TREND OF THE TOTAL FACTOR PRODUCTIVITY GROWTH OF THE INDONESIAN ECONOMIC SECTORS
 TREND OF THE TOTAL FACTOR PRODUCTIVITY GROWTH OF THE INDONESIAN ECONOMIC SECTORS MAMAN SETIAWAN 1 CENTER FOR ECONOMICS AND DEVELOPMENT STUDIES UNIVERSITAS PADJADJARAN GUNTUR SUGIYARTO ASIAN DEVELOPMENT
TABLE 2. SUPPLY, TRANSFORMATION, ENERGY SECTORS AND END USE. 13 energy products 60 flows divided into 6 sections Supply Transformation Sector
 TABLE 2. SUPPLY, TRANSFORMATION, ENERGY SECTORS AND END USE Country Geothermal Solar Thermal Industrial Waste (nonrenewable) MUNICIPAL WASTE SOLID BIOMASS BIOGAS LIQUID BIOFUELS Renewable Non-Renewable
& ECONOMIC STATISTICS
 2012 EDMC HANDBOOK of ENERGY & ECONOMIC STATISTICS in JAPAN CONTENTS Japan Chapter I. Energy and Economics 1.Economic Indices... 4 ( 1 ) GDP and Major Energy Related Indicators... 5 ( 2 ) National Accounts
Federal Statistical Office Germany
 Accounts for primary material flows by branches and material categories -methodological concepts, results and applications- Paper presented at the 9 th London Group Meeting in Copenhagen 22 24 September
Outlook for Bulk Commodities John Barber Bureau of Resources and Energy Economics. bree.gov.au
 Outlook for Bulk Commodities John Barber Bureau of Resources and Energy Economics bree.gov.au Overview Outlook for China Steel and iron ore markets Electricity and thermal coal China s economy is still
THE ECONOMIC IMPACT OF INFORMATION TECHNOLOGIES AFTER THE FINANCIAL CRISIS
 THE ECONOMIC IMPACT OF INFORMATION TECHNOLOGIES AFTER THE FINANCIAL CRISIS Dale W. Jorgenson, Harvard University http://economics.harvard.edu/faculty/jorgenson/ Keynote Lecture to the Annual Conference
Analysis of household final consumption with a focus on the domestic market and the impact on employment
 Analysis of household final consumption with a focus on the domestic market and the impact on employment OCTOBER 2012 Národná banka Slovenska www.nbs.sk Imricha Karvaša 1 813 25 Bratislava milan_gylanik@nbs.sk
Mini-presentation on Turnover/Output for Office Administrative and Support Activities (ISIC 8210) in Poland
 in Poland") 30 th Voorburg Group Meeting Sydney, Australia September 21 st to September 25 th, 2015 Mini-presentation on Turnover/Output for Office Administrative and Support Activities (ISIC 8210) in Poland Central
30 th Voorburg Group Meeting Sydney, Australia September 21 st to September 25 th, 2015 Mini-presentation on Turnover/Output for Office Administrative and Support Activities (ISIC 8210) in Poland Central
ANNUAL QUALITY REPORT
 REPUBLIC OF SLOVENIA ANNUAL QUALITY REPORT FOR THE SURVEY STRUCTURAL BUSINESS STATISTICS FOR YEAR 2007 Prepared by: Barbara Dremelj Ribič, Nataša Pušlar Car Date: 24.05.2010 1/8 Table of contents 0 Basic
WORLD KLEMS AND ASIA KLEMS
 WORLD KLEMS AND ASIA KLEMS By Dale W. Jorgenson Harvard University First Asia KLEMS Conference Asian Development Bank Institute Tokyo, Japan July 27, 2011 http://economics.harvard.edu/faculty/jorgenson/
Fatal injuries. Total Goods producing
 Total 120 100.0 82 100.0 12 100.0 26 100.0 Goods producing 51 42.5 39 47.6 -- -- 9 34.6 Natural resources and mining 22 18.3 18 22.0 -- -- 4 15.4 Agriculture, forestry, fishing and hunting 14 11.7 10 12.2
Table 1 shows the general form of China 2010 I-O Table:
 China Liu Yu 1 and Jie Chen The original 2010 Input-Output Table doesn t have multi-product sector. After some adjustments, the data tables are reclassified and re-balanced to provide the matrices required
Draft proposed core tables for energy
 Draft proposed core tables for energy Alessandra Alfieri and Sokol Vako UNSD Draft version prepared for the London Group meeting on Environmental Accounting London, UK, 12-14 November, 2013 DRAFT Proposed
PRESS RELEASE. PRODUCER PRICE INDEX IN INDUSTRY: July 2018, y-o-y increase of 8.2%
 HELLENIC REPUBLIC HELLENIC STATISTICAL AUTHORITY Piraeus, 30 August 2018 PRESS RELEASE PRODUCER PRICE INDEX IN INDUSTRY: July 2018, y-o-y increase of 8.2% The Overall Producer Price Index (PPI) in Industry
Country paper: Bangladesh
 UN Workshop on International Economic and Social Classifications 24-27 November, 2008 Bangkok, Thailand. Country paper: Bangladesh Md. Nurul Islam, Director Bangladesh Bureau of Statistics (BBS): Bangladesh
The FAO-UNIDO Agro-Industry Project Potential Next Steps
 The FAO-UNIDO Agro-Industry Project Potential Next Steps Sangita Dubey FAO, Statistics Division (ESS) FAO-UNIDO Expert Group Meeting on Agro-Industry Measurement 22-23 November 2015 Project Content Description:
Geology, Mining and Petroleum Sector
 Geology, Mining and Petroleum Sector JIGJID Rentsendoo MINISTER FOR MINING OF MONGOLIA Ulaanbaatar 2015 1 Content Current status - Contribution of the mining sector to the Mongolian Economy - Legal Reforms
Pesticide Use in Developing Countries Development Economics Research Group (DECRG) World Bank
 World Bank") Pesticide Use in Developing Countries Development Economics Research Group (DECRG) World Bank Official Name Socialist Republic of Vietnam Geography Located in Southeastern Asia, bordering the Gulf of Thailand,
Pesticide Use in Developing Countries Development Economics Research Group (DECRG) World Bank Official Name Socialist Republic of Vietnam Geography Located in Southeastern Asia, bordering the Gulf of Thailand,
Schedule of Accreditation issued by United Kingdom Accreditation Service 2 Pine Trees, Chertsey Lane, Staines-upon-Thames, TW18 3HR, UK
 2 Pine Trees, Chertsey Lane, Staines-upon-Thames, TW18 3HR, UK P.O.B 619-182 Taiji Commercial Building No. 211 Bei Si Huan Zhong Lu Haidian District Beijing 100083 P.R. China Contact: Mr Wang Xuefeng Tel:
MONGOLIA S TRADE DIVERSIFICATION
 MONGOLIA S TRADE DIVERSIFICATION by D.Nachin Senior Officer, Foreign Investment and Foreign Trade Agency of Mongolia ESCAP/UNCTAD/WTO/ARTNet Research Work shop on Trade Diversification in the Context of
Environmental Statistics WASTEWATER STATISTICS
 Environmental Statistics WASTEWATER STATISTICS Sebahattin SARI Head of Environment, Energy and Transport Statistics Department, TURKSAT 20-22 March 2017 QATAR Contents Concepts, Definitions and Classifications
Slicing Up Global Value Chains
 Slicing Up Global Value Chains Marcel Timmer a Abdul Azeez Erumban a Bart Los a Robert Stehrer b Gaaitzen de Vries a (a) Groningen Growth and Development Centre, University of Groningen (b) The Vienna
Indonesia PEFA and Air Emission Account: Summary of Findings
 Indonesia PEFA and Air Emission Account: Summary of Findings outline! Process of Compilation! Physical Energy Flow Account (PEFA)! Air Emission Accounts! Technical issues faced and resolutions Background
Monthly Report on the Corporate Goods Price Index ( Preliminary Figures for July 2013 )
") Research and Statistics Department Bank of Japan Report on the Corporate Goods Price Index The Domestic Corporate Goods Price Index rose 0.5 percent from the previous. The index excluding extra charges
Research and Statistics Department Bank of Japan Report on the Corporate Goods Price Index The Domestic Corporate Goods Price Index rose 0.5 percent from the previous. The index excluding extra charges
ENERGY BALANCES A useful tool for Energy planning & Economic Development. Mohamed Al Badrawy Senior Statistician Economic Analysis Division, ESCWA
 ENERGY BALANCES A useful tool for Energy planning & Economic Development Mohamed Al Badrawy Senior Statistician Economic Analysis Division, ESCWA OBJECTIVE Developing an appropriate methodology for building