Deliverable. Due date of deliverable: Actual submission date:
|
|
|
- Adrian Emory Charles
- 6 years ago
- Views:
Transcription

1 LIFE + Environment Policy and Governance Project name: Participatory monitoring, forecasting, control and socio-economic impacts of eutrophication and algal blooms in River Basin Districts (GISBLOOM) Project reference: LIFE09 ENV/FI/ Duration: October 1 st, 2010 September 30 th, 2013 Deliverable Sub-action 3.1 Report on the production of water quality and algal blooming forecasts for the public with the WSFS-VEMALA- LakeState model and the forecast production system Beneficiary: Finnish Environment Institute (SYKE) Contributors: Markus Huttunen, Inese Huttunen, Vanamo Seppänen, Marie Korppoo, Bertel Vehviläinen(SYKE) Due date of deliverable: Actual submission date: With the contribution of the LIFE financial instrument of the European Community Page 1/26
2 Content Introduction... 3 Methodology... 3 Phosphorus model development... 3 Nitrogen model development... 6 Nutrient and chlorophyll-a forecast production Delivery of the forecasts Examples of the forecasts References Appendix 1: Nash Sutcliffe coefficients RR for chlorophyll-a simulation Page 2/26
3 Introduction The WSFS-Vemala model simulates hydrology and water quality for all river basins in Finland. The simulated water quality parameters are total phosphorus, total nitrogen and suspended solids. The model simulates on a daily time-step nutrient leaching from land areas, incoming loads to each one hectare or larger lakes, nutrient transport in rivers and finally loading into the sea. Each agricultural plot is simulated separately taking into account slope, soil type and plant of the field. The model is used for real time simulation and forecasting of water quality. In the action 3.1 the WSFS-Vemala model and LakeState chlorophyll-a simulation model were integrated. The resulting integrated model is run daily for providing chlorophyll-a forecasts for all lakes about, which includes all 1 ha and larger lakes in Finland. A set of important and well observed lakes was selected among all lakes and forecast for those lakes are provided for the public. The nutrient and chlorophyll-a forecasts for all lakes are provided for experts in the user interface of the integrated WSFS-Vemala-LakeState model. Methodology The work in action 3.1 includes the further development of the WSFS-Vemala model for phosphorus and nitrogen simulations, the integration of the WSFS-Vemala with the LakeState model, the production of nutrient and chlorophyll-a forecasts and the delivery of the forecasts to the experts and to the public. In the WSFS-Vemala model phosphorus simulations were developed further by integrating WSFS-Vemala with the field-scale Icecream model, which was also further developed from its original version. For the nitrogen simulation, WSFS-Vemala was developed further towards a process based model including nitrate (NO 3 ) and organic nitrogen. WSFS-Vemala was then integrated with the LakeState model. WSFS-Vemala produces simulated and forecasted nitrogen and phosphorus concentrations in the lakes and based on these the LakeState model simulates chlorophyll-a concentrations in the lakes. Chlorophyll-a concentrations are used as an indicator for the risk of algal blooms. With the integrated WSFS-Vemala-LakeState model daily nutrient and chlorophyll-a forecasts were produced for all lakes. Forecasts for a selected set of lakes are provided to the public via several interfaces and the forecasts for all the lakes are provided only for experts via the user interface of the model. Phosphorus model development Phosphorus (P) is simulated with the ICECREAM model, which has been coupled with WSFS- Vemala. ICECREAM is a field-scale model, simulating nutrient leaching from arable land. It is based on CREAMS (Knisel 1980) and GLEAMS (Knisel 1993) models, applied to Finnish conditions by Rekolainen and Posch (1993), and further developed for simulation of phosphorus leaching by Page 3/26

4 Tattari et al. (2001), Yli-Halla et al. (2005), Bärlund et al. (2009) and Jaakkola et al. (2012). A schematic presentation of the phosphorus transformations in the model is shown in figure 1. Figure 1. Simulation of phosphorus flows in the ICECREAM model. In order to better simulate leaching of phosphorus from the 1,100,000 field plots in Finland, some equations in ICECREAM have been modified to statistical equations representing Finnish fields. The initial inorganic P content of the soil is calculated according to the following equation: (1) where soil inorganic P is in mg kg -1, Plab is labile phosphorus in mg kg -1 and clay% is the percentage of clay in the soil. The change in the soil P-test value over a year, which is used for calculating the balance between different P pools is calculated as follow: (2) where STP is the soil P-test value (mg kg -1 ) at the end of the year, STP 0 is the soil P-test value at the beginning of the year and P bal is the change in the total P content of the soil during the year (kg ha - 1 ). The dissolved P concentration in surface runoff is calculated according to equation 3 and depends on the soil P-test value. (3) where Pw is the phosphorus concentration in surface runoff (mg L -1 ). The materials for deriving equations 1, 2 and 3 are shown in table 1. Page 4/26
5 Table 1. Data for deriving equations 1-3. Use of the data Data References Equation 1: Initial inorganic phosphorus content in the soil Equation 2: Change in the soil P-test value over a year Equation 3: Dissolved P concentration in surface runoff Total inorganic phosphorus, acid ammonium acetate extractable phosphorus, and clay content of 23 mineral soils in Finland Change in soil P-test values during 8-14 years lasting field trials including 18 non-fertilized fields, removal of P in crop yield Acid ammonium acetate extractable P from 15 Finnish mineral soils, dissolved P concentration in runoff from rainfall simulations of the soils Peltovuori 2002, Saarela et al Saarela et al. 2003, Saarela et al Uusitalo and Aura 2005 For coupling ICECREAM with WSFS-Vemala the hydrological simulation needed to give similar results in both models. For this purpose, the total evapotranspiration for ICECREAM is now partly calculated by WSFS-VEMALA. During the growing season transpiration and evaporation are calculated by ICECREAM but corrected with a correction factor in order to reach the same yearly total evapotranspiration as in WSFS-VEMALA. Also snow water equivalent and precipitation / snow melt are inputs from WSFS-VEMALA. The effect of soil frost has been emphasized by reducing the soil infiltration during the frost period. Further minor changes have been made to the model. These changes affect the length of the frost period, the functioning of soil macropore flow, the movement of labile phosphorus in the soil, the growth of winter wheat and grass, the erosion of grass covered soil and the calculation of plant transpiration. For calibration and development of the ICECREAM model, experimental data from four Finnish agricultural fields has been used. These experiments have been published by Turtola and Kemppainen (1998), Koskiaho et al. (2002), Puustinen et al. (2005), Uusitalo et al. (2007) and Turtola et al. (2007). Most of the parameters used are adopted from the previous versions of ICECREAM (Tattari et al. 2004, Bärlund et al. 2009). The ICECREAM model is originally designed for simulating mineral soils only. However, in some pilot areas peat is a common soil type of agricultural fields. For example, in Lapuanjoki and Karvianjoki areas, a fourth of the arable land is peat. For this reason, it is necessary to be able to simulate phosphorus loading also from organic fields. ICECREAM s extension for simulating peat soils is under development. Page 5/26
6 Nitrogen model development In this project, a new version of the nitrogen model, VEMALA-N, was developed. In the new model, nitrate (NO 3 - ) and organic nitrogen are described separately. Ammonium (NH 4 + ) leaching is neglected in the VEMALA-N model at the moment. Ammonium loading represents a small fraction (around 6%) of total nitrogen (TN) loading on average from Finnish river catchments (Mattsson et al. 2005). Although, NH 4 + leaching is neglected, the NH 4 + storage in the soil is modelled and linked to organic nitrogen and nitrate in the soil. Nitrate is simulated using a semi-process based model. In the VEMALA-N model, six land uses / crop classes are defined: spring cereals, winter cereals, grassland, root crops, green fallow and forest. The nitrogen processes included in the soil model are mineralization, nitrification, denitrification, immobilization, plant uptake, fertilizer input and decay and nitrogen leaching. The schematic presentation of the VEMALA-N and conceptual hydrological model is presented in the Figure 2. Most of the nitrogen processes in the soil are simulated as first order kinetic processes that depend on the mass of the nitrogen fractions in the soil, soil temperature and soil moisture (Table 2). The most appropriate function relating mineralization and soil temperature is a logistic function, which has an S-shape as suggested by Dessureault-Rompre et al. (2010). According to this function, mineralization is low at low soil temperatures around 0 C, mineralization rises rapidly between 5 and 15 C to finally reach a plateau around 20 C. A parabolic function is used to describe the effect of soil moisture on mineralization as suggested by Myers et al. (1982) and Paasonen-Kivekäs et al. (2009). The maximum rate of mineralization is found around field capacity. In VEMALA-N, denitrification depends on the NO 3 - availability and soil moisture in the soil. Soil temperature is not included yet in this version, mainly to be able to reach high denitrification values during low temperature periods as reported by Martikainen et al. (2002).According to them, emissions of N 2 O (originating from nitrification and denitrification) during winter can be on average 57 % of the annual flux. Both mineral and organic soils have substantial N 2 O production close to zero temperatures. The immobilization process in the model varies with inorganic N storages in the soil (NO 3 - and NH 4 + ), soil moisture and soil temperature. However, Martikainen et al. (2002) reported that immobilization responded weakly to soil temperature changes between +0.5 C and +15 C. The growth of the plants biomass is related to air temperature sums over the vegetative season (Rekolainen and Posch 1993). Nitrogen uptakes by plants are simulated using a daily nitrogen demand taking into account daily plant biomass growth and soil moisture stress. Mass balances in the soil of NO 3 - and NH 4 + are simulated for each time step by the equations found in Table 2. NO 3 - concentration in the soil solution is simulated by assuming that all the NO 3 - storage is dissolved in the soil water of the simulated soil layer. The NO 3 - concentration in the groundwater is assumed to be constant in time, but different for agricultural and non-agricultural areas. Further developments of the VEMALA-N model include the simulation of ammonium leaching from agricultural and non-agricultural areas. Page 6/26

7 The organic nitrogen model was modified from the concentration-runoff relationship model to a model better linked to the conceptual hydrological model. Indeed, in the new version, subsurface and base flow are characterised by different organic nitrogen concentrations. VEMALA-N model simulates total nitrogen (TN) concentrations and loads on a daily basis for all Finnish catchments including Gisbloom pilot areas Example of the simulated and observed TN concentrations for Vantaanjoki are presented in Figure 3. Figure 2. Schematic presentation of VEMALA-N and hydrological model Page 7/26
8 Figure 3. Example of simulated and observed TN concentrations in Vantaanjoki ( ) Page 8/26
9 Table 2. VEMALA-N model processes Process Equation Reference Parameter Definition Value Mineralization Wade et al.(2002), Johnsson (1990) Page 9/26 M org k min k temp k soilm Mass of organic Nitrogen mineralization rate coefficient of temperature effect coefficient of soil moisture effect Nitrfication Wade et al.(2002) M NH4 Mass of Ammonium k nitr nitrfification rate Denitrification This study k denitr denitrification rate k soilmden coefficient of soil moisture effect for denitrification Immobilization NO 3 = Wade et al.(2002) M NO3 Mass of Nitrate k immobn immobilization rate of Nitrate Immobilization NH 4 = Wade et al.(2002) k immoba immobilization rate of Ammonium Soil temperature coef. k temp Q = Tsoil T , ift soil T 1 Rankinen et al. (2004) Q 10 change of rate with a 10 o C change in soil temperature This study T soil soil temperature kg ha -1 for agriculture 2500 k ha -1 for forest day -1 for agriculture day -1 for forest day -1 for agriculture, day -1 for forest day -1 for agriculture day -1 for forest 1.0 if relative soil moisture >80%, 0.0 if relative soil moisture 80% day -1 for agriculture for forest day -1 for agriculture for forest T 1 threshold temperature 20 C Soil moisture coef. Myers et al. (1982) b parameter of curvature 2.1 = ) soil moist soil moisture from hydrological model, mm wilting p soil moisture content at wiliting point mm field c soil moisture content at field capasity mm Biomass growth Rekolainen and B mat Biomass at maturity input data, kg/m 2 Posch (1993) w plant dependent growth parameter for cereals, 1.0 for grass, 3.0 for root crops NO - 3 plant uptake ( - ) Knisel (1993) C N Nitrogen content of the crop biomass input data, % NH + 4 plant uptake )( - ) Knisel (1993) k NO3 Ratio of plant uptake of NO This study k soilmplup coefficient of soil moisture effect for plant uptake
10 Process Equation Reference Parameter Definition Value NO - 3 fertilizer appl. Karvonen and Varis F undis,no3 NO 3 fertilizer in undissolved form = (1992) k d dissolution rate 0.15 day -1 NH 4 + fertilizer appl. = Karvonen and Varis (1992) F undis,nh4 NH 4 fertilizer in undissolved form NO - 3 mass balance = + This study Dep NO3 NO 3 atmospheric deposition input data NH + 4 mass balance = This study Dep NH4 NH4 atmospheric deposition input data Subsurface leaching This study PUW Plant unavailable water mm subs flow subsurface flow from hydrological model, mm US upper water storage from hydrological model, mm Groundwater leaching mg l -1 for agriculture, This study c gw NO3 concentration in groundwater flow = mg l -1 for forest gw flow groundwater flow from hydrological model, mm Page 10/26
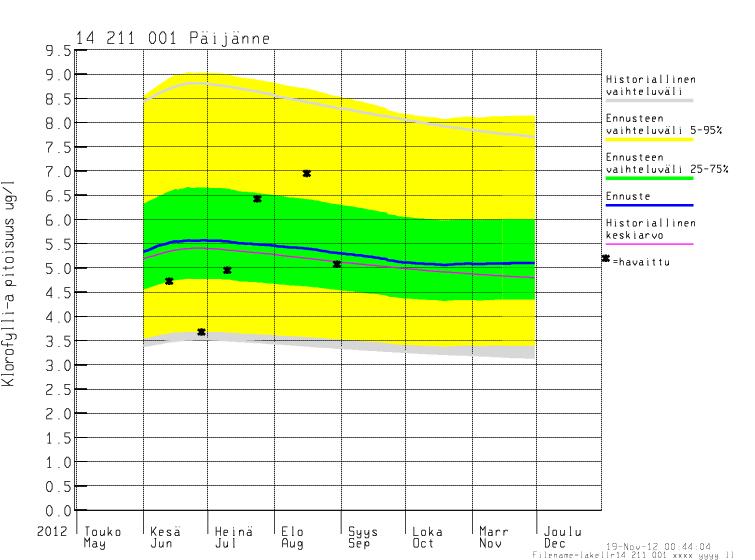
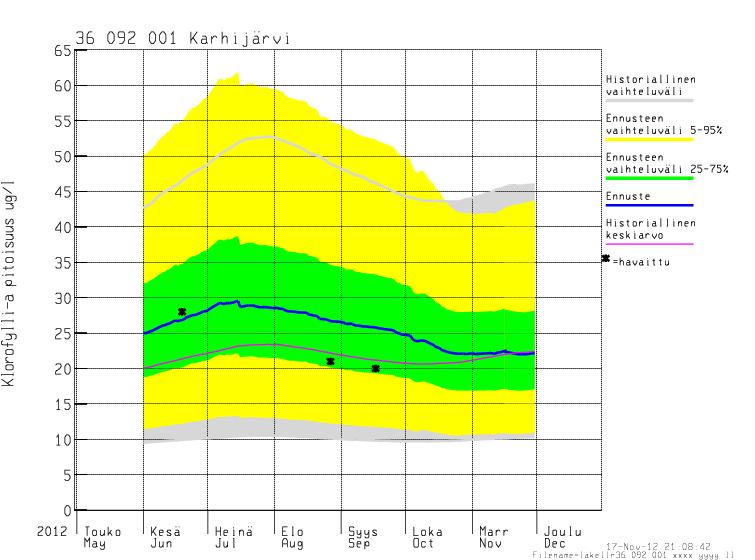
11 Nutrient and chlorophyll-a forecast production Nutrient forecasts are produced for a 6 months forecast period. The weather input for the first 15 days is based on ECMWF weather forecast. The weather input for the rest of the 6 months period is based on historical climatology. The forecast period is simulated with 50 different weather inputs, which provide a variation of different possible weather patterns for the forecast period. After processing nutrient forecasts the LakeState model is run for each lake using the daily simulated total phosphorus and total nitrogen as an input. The LakeState model is a hierarchical, linear mixed effects regression model model and it gives probability limits for the simulated chlorophyll-a concentration (Fig. 4). The hierarchy of the model means that it uses both the data from the study lake and from the lakes of same type to make the predictions. The main basis for the usage of the hierarchical model is that lakes within the same type are assumed to have similar chlorophyll a response to changing nutrient concentrations. It is also assumed that data from one lake type covers a wider range of observation values than that from a single lake. The dataset used for constructing LakeState chlorophyll-a model parameter estimates consists of 2246 Finnish lakes with all together in-lake observations of growing season chlorophyll a, total nitrogen and total phosphorus concentrations from years 1990 to The dataset covers large scale of trophic states and different sizes of water bodies. See Malve 2007 for detailed model description. Over the historical period the probability range is due to the uncertainty in the parameterization of the LakeState model. Over the forecast period the probability range is due to the parameterization and the uncertainty in the phosphorus and nitrogen input concentrations (Figs. 5 and 6). The weather observations, temperature and precipitation are updated daily from the Finnish Meteorological Institute (FMI). The weather forecast from ECMWF is updated twice per day. As an input, the model uses also weather radar data from FMI and hydrological observations from SYKE. The nutrient and chlorophyll-a forecasts are updated daily and therefore they show also responses of sudden weather phenomena, such as heavy rainfall which brings nutrients into lakes and causes risk of algae bloom.

12 Figure 4: An example of the chlorophyll-a simulation. Figure 5: An example of the nitrogen simulation and forecast. Page 12/26

13 Figure 6: An example of the phosphorus simulation and forecast. Delivery of the forecasts The forecasts are delivered on several platforms in order to reach the public. The used platforms are Vesinetti, SYKE s hydrological forecasts www-pages and JärviWiki. Vesinetti (Fig. 7) is implemented in the GISBLOOM project and nutrient and chlorophyll-a results are presented there with other results from GISBLOOM. SYKE s www-pages for hydrological forecasts (Fig. 8) are traditionally used for delivering real time hydrological forecasts. The main page of the hydrological forecasts is visited over times per year and therefore also nutrient and chlorophyll-a forecasts have a good visibility there. JärviWiki (Fig. 9) is a site for general information on lakes and algal bloom observations are also provided. For the public, the forecasts are provided for a set of lakes, which are well observed and where the model simulation is reliable. For the experts, simulation results and forecasts are provided for all lakes on the user interface. In order to use model results for example for a small lake where no nutrient or chlorophyll-a observations are available, an expert evaluation of the goodness and reliability of the results is needed. Therefore not all results can be provided to the public automatically. This expert interface (Fig. 10) is the same user interface as for the hydrological forecasts. The user interface is already available for all users in the environmental administration and for about 200 users outside the environmental administration. Page 13/26


14 Figure 7: An example of the nutrient and chlorophyll-a forecasts in the Vesinetti. Figure 8: Main page of the SYKE's hydrological forecasts Page 14/26


15 Figure 9: Chlorophyll-a forecasts in the JärviWiki. Figure 10: User interface of the WSFS-Vemala model. Page 15/26

16 Examples of the forecasts In the following pictures there are examples of the chlorophyll-a simulations for the summer In these pictures, the grey background shows the historical variation and the violet line represents the daily mean of the historical variation. The mean of the year 2012 simulation is presented as a blue line. The green area shows the variation of 50% of the simulated values and the 90 % variation is presented in yellow. These pictures represent mostly the historical simulation, forecast is only provided at the end of November. Black dots represent observed values, in most of the cases observations are within 50 % variation limits of the model. In Appendix 1 the goodness of fit values are presented for the best simulated lakes. Page 16/26

17 Page 17/26

18 Page 18/26

19 Page 19/26

20 Page 20/26
21 References Bärlund, I., Tattari, S., Puustinen, M., Koskiaho, J. Yli-Halla, M. & Posch, M Soil parameter variability affecting simulated fieldscale water balance, erosion and phosphorus losses. Agricultural and Food Science 18: Dessureault-Rompre,J., Zebarth,B.J., Georgallas,A., Burton,D.L., Grant,C.a. and Drury,C.F Temperature dependence of soil nitrogen mineralization rate: Comparison of mathematical models, reference temperatures and origin of the soils. Geoderma, 157, Jaakkola, E., Tattari, S., Ekholm, P., Pietola, L., Posch, M., Bärlund, I Simulated effects of gypsum amendment on phosphorus losses from agricultural soils. Agricultural and Food Science 21: Karvonen, T., Varis, E., Mathematical models in crop production. University of Helsinki Department of plant production: 218. Knisel, W., ed CREAMS, A field-scale model for chemicals, runoff, and erosion from agricultural management systems. Conservation Research Report 26. Washington, D.C.: USDA. Knisel, W GLEAMS: Groundwater loading effects of agricultural management systems. Version Publication No. 5. Athens, Georgia: University of Georgia, Department of Biological and Agricultural Engineering, Coastal Plain Experiment Station. Koskiaho, J., Kivisaari, S., Vermeulen, S., Kauppila, R., Kallio, K. & Puustinen, M Reduced tillage: Influence on erosion and nutrient losses in a clayey field in southern Finland. Agricultural and Food Science in Finland 11: Malve O Water quality prediction for river basin management. PhD. thesis, Helsinki University on Technology. 126 s. Martikainen, P.J., Regina, K., Syväsalo, E., Laurila, T., Lohila, A., Aurela, M., Silvola J., Kettunen, R., Saarnio, S., Koponen, H., Jaakkola, T., Pärnä, A., Silvennoinen, H., Lehtonen, H., Peltola, J., Sinkkonen, M. & Esala, M Agricultural soils as a sink and source of greenhouse gases: A research Page 21/26
22 consortium (AGROGAS). Finnish Global Change Research Programme FIGARE: ISBN Myers, R.J.K., C.A. Campbell, and K.L. Weier Quantitative relationship between net nitrogen mineralization and moisture content of soils. Can. J. Soil Sci. 62: Paasonen-Kivekäs, M., Peltomaa, R., Vakkilainen P., & Äijö, H Maan vesi- ja ravinnetalous ojitus, kastelu ja ympäristö: 452 p., ISBN Peltovuori, T Phosphorus extractability in surface soil samples as affected by mixing with subsoil. Agricultural and Food Science in Finland 11: Puustinen, M., Koskiaho, J. & Peltonen, K Influence of cultivation methods on suspended solids and phosphorus concentrations in surface runoff on clayey sloped fields in boreal climate. Agriculture, Ecosystems and Environment 105: Rankinen, K., Karvonen, T., Butterfield, D A simple model for predicting soil temperature in snow-covered and seasonally frozen soil: model description and testing Hydrology and Earth System Sciences 8 (4), Rekolainen, S. & Posch, M Adapting the CREAMS model for Finnish conditions. Nordic Hydrology 24(5): Saarela, I., Järvi, A., Hakkola, H. & Rinne, K Phosphorus status of diverse soils in Finland as influenced by long-term P fertilization 1. Native and previously applied P at 24 experimental sites. Agricultural and Food Science in Finland 12: Saarela, I., Järvi, A., Hakkola, H. & Rinne, K Phosphorus status of diverse soils in Finland as influenced by long-term P fertilization 2. Changes of soil test values in relation to P balance with references to incorporation depth of residual and freshly applied P. Tattari, S., Bärlund, I., Rekolainen, S., Posch, M., Siimes, K., Tuhkanen, H-R. & Yli-Halla, M Modeling sediment yield and phosphorus transport in Finnish clayey soils. Transactions of the ASAE 44(2): Page 22/26
23 Turtola, E. & Kemppainen, E Nitrogen and phosphorus losses in surface runoff and drainage water after application of slurry and mineral fertilizer to perennial grass ley. Agricultural and Food Science in Finland 7: Turtola, E., Alakukku, L., Uusitalo, R. & Kaseva, A Surface runoff, subsurface drainflow and soil erosion as affected by tillage in a clayey Finnish soil. Agricultural and Food Science 16: Uusitalo, R. & Aura, E A rainfall simulation study on the relationships between soil test P versus dissolved and potentially bioavailable particulate phosphorus forms in runoff. Agricultural and Food Science 14: Uusitalo, R., Turtola, E. & Lemola, R Phosphorus losses from a subdrained clayey soil as affected by cultivation practices. Agricultural and Food Science 16: Wade, A.J., Durand, P., Beaujouan, V., Wessel, W. W., Raat, K. J., Whitehead, P. G., Butterfield, D., Rankinen, K. and Lepisto, A., A nitrogen model for European catchments: INCA, new model structure and equations. Hydrol. Earth Syst. Sci., 6, Yli-Halla, M., Tattari, S., Bärlund, I., Tuhkanen, H.-R., Posch, M., Siimes, K. & Rekolainen, S Simulating processes of soil phosphorus in geologically young acidic soils of Finland. Transactions of the ASAE 48(1): Page 23/26
24 Appendix 1: Nash Sutcliffe coefficients RR for chlorophyll-a simulation Nash Sutcliffe model efficiency coefficients for the best simulated lakes. Maximum value of the coefficient is 1. Lake ID Lake name Chlorophyll-a RR Kuopasjärvi Iso-Petäinen Suuri Hietajärvi Kuusijärvi Savijärvi Saamainen Juumajärvi Palonselkä Matalajärvi Karhujärvi Toplanen Moksjärvi Mekrijärvi Kaljasjärvi Heräjärvi Kumpunen Poikkeusjärvi Kutemainen Villasenjärvi Kilpijärvi Saapunki Mallos Vehkajärvi Saarisjärvi Niemenjärvi Märkjärvi Suolajärvi Puolankajärvi Valkjärvi Pieni-Myhi Iso-Torava 0.23 Page 24/26
25 Lake ID Lake name Chlorophyll-a RR Gålisjön Ylimmäinen Ilomantsinjärvi Kirventeenjärvi Hämeenjärvi Rautajärvi Hunttijärvi Jaurakaisjärvi Iso Siikajärvi Kousanjärvi-Keskinen Näläntöjärvi Muonionjärvi Kytäjärvi Halijärvi Vessanjärvi Hepolampi Jäljänjärvi Lievestuoreenjärvi Saraavesi Humalalampi Koskio Alaset Halmejärvi, Lohnajärvi Kerteselkä Källträsket Haapajärvi Petäjäjärvi Huuhtjärvi Elämäjärvi Oijusluoma Poosjärvi Kanteleenjärvi Sonnanjärvi Iso-Koirajärvi Salajärvi Sääksjärvi Alajärvi Iso-Haaranen 0.09 Page 25/26
26 Lake ID Lake name Chlorophyll-a RR Vuojärvi Syntymäinen 0.09 Page 26/26
Effects of climate change and agricultural adaptation on nitrogen loading from Finnish watersheds simulated by VEMALA model
 Effects of climate change and agricultural adaptation on nitrogen loading from Finnish watersheds simulated by VEMALA model Inese Huttunen 1, Heikki Lehtonen 2, Markus Huttunen 1, Vanamo Piirainen 1, Bertel
Modelling agricultural nutrient loading from Finnish watersheds
 Modelling agricultural nutrient loading from Finnish watersheds Inese Huttunen, Markus Huttunen, Marie Korppoo, Bertel Vehviläinen, SYKE Maataloustieteen päivät 2018 10-11.1.2018 Viikki, Helsinki Contents
The national-level nutrient loading estimation tool for Finland: Watershed Simulation and Forecasting System WSFS-Vemala
 The national-level nutrient loading estimation tool for Finland: Watershed Simulation and Forecasting System WSFS-Vemala Markus Huttunen, Finnish Environment Institute SYKE, HELCOM workshop on transboundary
NJF Report Vol. 2 No
 NJF Report Vol. 2 No 5 2006 NJF Seminar 373 Transport and retention of pollutants from different production systems. Tartu, Estonia, 11 14 June 2006 NJF Report Vol.2 No 5, 2006 NJF Seminar 373 Transport
Modelling of inorganic N load from anthropogenic sources in a boreal river basin
 Geophysical Research Abstracts, Vol. 7, 07161, 2005 SRef-ID: 1607-7962/gra/EGU05-A-07161 European Geosciences Union 2005 Modelling of inorganic N load from anthropogenic sources in a boreal river basin
NJF Report Vol. 2 No
 NJF Report Vol. 2 No 5 2006 NJF Seminar 373 Transport and retention of pollutants from different production systems. Tartu, Estonia, 11 14 June 2006 NJF Report Vol.2 No 5, 2006 NJF Seminar 373 Transport
Adaptation to Climate Change by Agri- Environmental Policy in Finland
 International Congress on Environmental Modelling and Software Brigham Young University BYU ScholarsArchive 6th International Congress on Environmental Modelling and Software - Leipzig, Germany - July
Method for estimating soil carbon stock changes in Finnish mineral cropland and grassland soils
 The following supplements accompany the article Method for estimating soil carbon stock changes in Finnish mineral cropland and grassland soils Taru Palosuo 1,*, Jaakko Heikkinen 2 and Kristiina Regina
MMEA, WP5.2.7 Mining Deliverable D
 Research Report Helsinki August 2015 Panu Juntunen (SYKE) MMEA, WP5.2.7 Mining Deliverable D5.2.7.8 Water balance modeling using weather forecast CLEEN LTD ETELÄRANTA 10 P.O. BOX 10 FI-00130 HELSINKI FINLAND
Mathematical models in predicting the fate of Lake Pyhäjärvi waters
 Mathematical models in predicting the fate of Lake Pyhäjärvi waters Pori 22.10.2014 Timo Huttula, Inese Huttunen, Olli Malve, Anita Pätynen and Janne Ropponen SYKE Recent projects and modelling (besides
The GisBloom Project. GisBloom. Layman s Report on the Results of the Project EU LIFE+ Life 09 ENV/FI/000569
 EU LIFE+ GisBloom Life 09 ENV/FI/000569 The GisBloom Project Layman s Report on the Results of the Project Reija Jokipii/SYKE Milla Popova/ SYKE Matti Siivonen/Plugi.fi Reija Jokipii/SYKE Pentti Sormunen/Plugi.fi
National Agricultural Pesticide Risk Assessment (NAPRA) Web
 Web") The NAPRA Program 1 Acushla Antony 2, Indrajeet Chaubey, Bernard Engel, Natalie Carroll 2 Respectively, Graduate student, Professor, Professor and Head, and Professor, Department of Agricultural and Biological
The NAPRA Program 1 Acushla Antony 2, Indrajeet Chaubey, Bernard Engel, Natalie Carroll 2 Respectively, Graduate student, Professor, Professor and Head, and Professor, Department of Agricultural and Biological
MODELING SEDIMENT AND PHOSPHORUS YIELDS USING THE HSPF MODEL IN THE DEEP HOLLOW WATERSHED, MISSISSIPPI
 MODELING SEDIMENT AND PHOSPHORUS YIELDS USING THE HSPF MODEL IN THE DEEP HOLLOW WATERSHED, MISSISSIPPI Jairo Diaz-Ramirez, James Martin, William McAnally, and Richard A. Rebich Outline Background Objectives
Novel methods for reducing agricultural nutrient loading and eutrophication
 Novel methods for reducing agricultural nutrient loading and eutrophication 14-16 June 2010, Jokioinen COST869, Working groups 2 and 3 Field excursions K. Rasa (Ed.) 1 Monday, June 14, MTT. Kotkanoja experimental
Assessing the Effects of Agricultural Change on Nitrogen Fluxes Using the Integrated Nitrogen CAtchment (INCA) Model
 Model") International Congress on Environmental Modelling and Software Brigham Young University BYU ScholarsArchive 2nd International Congress on Environmental Modelling and Software - Osnabrück, Germany - June
International Congress on Environmental Modelling and Software Brigham Young University BYU ScholarsArchive 2nd International Congress on Environmental Modelling and Software - Osnabrück, Germany - June
Should we focus only on P load when aiming to reduce eutrophication in a P-limited aquatic system?
 Should we focus only on P load when aiming to reduce eutrophication in a P-limited aquatic system? Petri Ekholm & Jouni Lehtoranta Finnish Environment Institute (SYKE) International Phosphorus Workshop
NJF Report Vol. 2 No
 NJF Report Vol. 2 No 5 2006 NJF Seminar 373 Transport and retention of pollutants from different production systems. Tartu, Estonia, 11 14 June 2006 NJF Report Vol.2 No 5, 2006 NJF Seminar 373 Transport
Agricultural phosphorus losses and eutrophication in Nordic-Baltic countries
 Agricultural phosphorus losses and eutrophication in Nordic-Baltic countries Petri Ekholm Finnish Environment Institute (SYKE) NJF 401: Phosphorus management in Nordic-Baltic agriculture - reconciling
GISBLOOM Project Hand in hand for healthy surface and coastal waters
 Project reference: LIFE09 ENV/FI/000569 GISBLOOM Project Hand in hand for healthy surface and coastal waters Dr. Olli Malve Finnish Environment Institute Life Environment & Resource-efficiency training
Web based map service VESINETTI to integrate data and models for participatory river basin management 5 th Nordic WFD meeting, Iceland
 Web based map service VESINETTI to integrate data and models for participatory river basin management 5 th Nordic WFD meeting, Iceland Olli Malve 1, Anita Etholen 1, Sanna Helttunen 3, Tuomo Kauranne 2,
Soil and Water Assessment Tool. R. Srinivasan Texas A&M University
 Soil and Water Assessment Tool R. Srinivasan Texas A&M University Model Philosophy Readily available input Physically based Comprehensive Process Interactions Simulate Management ARS Modeling History Time
NJF Report Vol. 2 No
 NJF Report Vol. 2 No 5 2006 NJF Seminar 373 Transport and retention of pollutants from different production systems. Tartu, Estonia, 11 14 June 2006 NJF Report Vol.2 No 5, 2006 NJF Seminar 373 Transport
Environmental Science Energy Flow in Ecosystems
 Environmental Science Energy Flow in Ecosystems Name: Date: 1. Match the following fill in the blanks 1. Biodegration 2. Biomass 3. Consumer 4. Decomposers 5.Decomposition 6. Energy Flow 7. Food Chains
Phosphorus Dynamics and Mitigation in Soils
 Phosphorus Dynamics and Mitigation in Soils Umass Extension - Managing Phosphorus in Organic Residuals Applied to Soils: Composts, Biosolids, Manures and Others November 2, 2016 - Marlborough, MA Jennifer
Tillage systems for the benefit of agriculture and the environment Nordic Agricultural Academy, Odense, Denmark, May 2006
 NJF Seminar 378 Tillage systems for the benefit of agriculture and the environment Extended abstracts Arranged by NJF section I: Soil, water and environment Nordic Agricultural Academy, Odense, Denmark,
Distributed hydrological modelling within SCARCE Project: integrating water, sediment, quality and vegetation
 Distributed hydrological modelling within SCARCE Project: integrating water, sediment, quality and vegetation Introduction SCARCE Project: Global change impacts on water availably, water quality and ecosystems
WASA Quiz Review. Chapter 2
 WASA Quiz Review Chapter 2 Question#1 What is surface runoff? part of the water cycle that flows over land as surface water instead of being absorbed into groundwater or evaporating Question #2 What are
Nutrient Cycling & Soils
 Nutrient Cycling & Soils tutorial by Paul Rich Outline 1. Nutrient Cycles What are nutrient cycles? major cycles 2. Water Cycle 3. Carbon Cycle 4. Nitrogen Cycle 5. Phosphorus Cycle 6. Sulfur Cycle 7.
GLOBAL ESTIMATION OF THE EFFECT OF FERTILIZATION ON NITRATE LEACHING
 GLOBAL ESTIMATION OF THE EFFECT OF FERTILIZATION ON NITRATE LEACHING YOSHITO SUGA Institute of Industrial Science, The University of Tokyo, 4-6-1 Komaba, Meguro-ku, Tokyo 153-8505, Japan SHINJIRO KANAE
Cycling and Biogeochemical Transformations of N, P, S, and K
 Cycling and Biogeochemical Transformations of N, P, S, and K OCN 401 - Biogeochemical Systems 24 September 2013 Reading: Schlesinger & Bernhardt, Chapter 6 1. Nitrogen cycle Soil nitrogen cycle Nitrification
NITRATE MONITORING RESULTS IN AGRICULTURAL CATCHMENTS
 Environmental Engineering NITRATE MONITORING RESULTS IN AGRICULTURAL CATCHMENTS Latvia University of Agriculture e-mail: ainis.lagzdins@llu.lv Abstract The paper deals with monitoring results of nitrate
New Practices for Nutrient Reduction: STRIPs and Saturated Buffers. Matthew Helmers and Tom Isenhart Iowa State University
 New Practices for Nutrient Reduction: STRIPs and Saturated Buffers Matthew Helmers and Tom Isenhart Iowa State University Situation Increasing concern for local and regional waters Substantial demand for
Ecosystems: Nutrient Cycles
 Ecosystems: Nutrient Cycles Greeks, Native Peoples, Buddhism, Hinduism use(d) Earth, Air, Fire, and Water as the main elements of their faith/culture Cycling in Ecosystems the Hydrologic Cycle What are
4R Phosphorus Management for Sustainable Crop Nutrition
 MVTL 2018 Agronomy Update New Ulm, MN February 1, 2018 4R Phosphorus Management for Sustainable Crop Nutrition Heidi Peterson Phosphorus Program Director Stillwater, Minnesota hpeterson@ipni.net The International
Cycling and Biogeochemical Transformations of N, P and S
 Cycling and Biogeochemical Transformations of N, P and S OCN 401 - Biogeochemical Systems Reading: Schlesinger,, Chapter 6 1. Nitrogen cycle Soil nitrogen cycle Nitrification Emissions of N gases from
Chapter 34 Nature of Ecosystems. Copyright The McGraw-Hill Companies, Inc. Permission required for reproduction or display.
 Chapter 34 Nature of Ecosystems 1 Copyright The McGraw-Hill Companies, Inc. Permission required for reproduction or display. 34.1 The Biotic Components of Ecosystems Ecosystems Abiotic components include
Objectives: Define the term biogeochemical cycles. Compare and contrast how carbon, phosphorus, nitrogen, and water cycle through the environment.
 Objectives: Define the term biogeochemical cycles. Compare and contrast how carbon, phosphorus, nitrogen, and water cycle through the environment. Explain how human impact is affecting biogeochemical cycles
Particulate Soil Phosphorus and Eutrophication in Lakes and Streams
 Particulate Soil Phosphorus and Eutrophication in Lakes and Streams Paul R. Bloom Soil, Water, & Climate Department University of Minnesota With contributions by John Moncrief, Carl Rosen and David Mulla
Toward a Great Lakes Watershed Ecological Sustainability Strategy (GLWESS): Modeling Workshop. Lansing, MI May 3, 2012
: Modeling Workshop. Lansing, MI May 3, 2012") Toward a Great Lakes Watershed Ecological Sustainability Strategy (GLWESS): Modeling Workshop Lansing, MI May 3, 2012 Presentation Outline Overview of ecological concerns General modeling overview How
Toward a Great Lakes Watershed Ecological Sustainability Strategy (GLWESS): Modeling Workshop Lansing, MI May 3, 2012 Presentation Outline Overview of ecological concerns General modeling overview How
7.014 Lecture 20: Biogeochemical Cycles April 1, 2007
 Global Nutrient Cycling - Biogeochemical Cycles 7.14 Lecture 2: Biogeochemical Cycles April 1, 27 Uptake Bioelements in Solution Weathering Precipitation Terrestrial Biomass Decomposition Volatile Elements
PHOSPHORUS DYNAMICS & POLLUTION
 PHOSPHORUS DYNAMICS & POLLUTION (Source of some of the notes Zaimes & Shultz 2002 Phosphorus literature review Sharpley et al. 1999 Agricultural phosphorus & eutrophication) Introduction A major player
Modelling, GIS and remote sensing
 Modelling, GIS and remote sensing Part 1 Integrated catchment modelling 05 November 2008 Andrew Wade (a.j.wade@reading.ac.uk) Department of Geography The University of Reading, UK University of Reading
The effect of gypsum on phosphorus losses at the catchment scale
 THE FINNISH ENVIRONMENT 33 211 The effect of gypsum on phosphorus losses at the catchment scale ENVIRONMENTAL YMPÄRISTÖN- PROTECTION SUOJELU Petri Ekholm, Elina Jaakkola, Mikko Kiirikki, Kirsti Lahti,
Simulating Water Use and Nitrogen Fate in a Woody Biomass Production Ecosystem
 Simulating Water Use and Nitrogen Fate in a Woody Biomass Production Ecosystem Ying Ouyang, Research Hydrologist USDA Forest Service, Center for Bottomland Hardwoods Research, Southern Research Station
Experiences from the use of sensors for assessing water quality in rivers in Finland
 Experiences from the use of sensors for assessing water quality in rivers in Finland HELCOM workshop on total uncertainties in the input estimates, 18-19.5.2015 Uppsala, Sweden Sirkka Tattari Finnish Environment
Soil greenhouse gas emissions and carbon pools in afforested agricultural fields
 Soil greenhouse gas emissions and carbon pools in afforested agricultural fields Jyrki Hytönen (1, Päivi Mäkiranta (1, Marja Maljanen (3, Jukka Laine (2, Pertti J. Martikainen (3, Kari Minkkinen (, Antti
Cycling and Biogeochemical Transformations of N, P and S
 Cycling and Biogeochemical Transformations of N, P and S OCN 401 - Biogeochemical Systems Reading: Schlesinger, Chapter 6 1. Nitrogen cycle Soil nitrogen cycle Nitrification Emissions of N gases from soils
SIMULATION OF DAILY RUNOFF AND WATER LEVEL FOR THE LAKE BUTRNIEKS
 SIMULATION OF DAILY RUNOFF AND WATER LEVEL FOR THE LAKE BUTRNIEKS Ansis Ziverts Faculty of Rural Engineering Latvian University of Agriculture Akademijas 19, Jelgava LV-3001, Latvia E-mail: aziverts@apollo.lv
Digestate - Maximizing its Value and Use
 Digestate - Maximizing its Value and Use Compost Matters Workshop February 4, 2016 Christine Brown - OMAFRA Digestate use for Agriculture Land Sources Farm - manure-based with other feedstocks Municipal
Ch. 5 - Nutrient Cycles and Soils
 Ch. 5 - Nutrient Cycles and Soils What are Nutrient (biogeochemical) Cycles? a process by which nutrients are recycled between living organisms and nonliving environment. The three general types of nutrient
Streamside Management. How the area around your pond effects the water.
 Streamside Management Zones and Water Quality How the area around your pond effects the water. Stream(pond)side Management Zone A streamside management zone (SMZ) is a strip of land immediately adjacent
Objective 1: Manage the demonstration site using common agricultural practices and monitor runoff quantity and quality.
 Appendix B Objectives/Tasks Accomplishments By J. Kjaersgaard, South Dakota State University. Objective 1: Manage the demonstration site using common agricultural practices and monitor runoff quantity
The Biosphere Chapter 3. What Is Ecology? Section 3-1
 The Biosphere Chapter 3 What Is Ecology? Section 3-1 Interactions and Interdependence Ecology is the scientific study of interactions among organisms and between organisms and their environment, or surroundings.
Nutrient Cycles. Nutrient cycles involve flow of high quality energy from the sun through the environment & of elements.
 Nutrient Cycles Nutrient cycles (= biogeochemical cycles): natural processes that involve the flow of nutrients from the environment (air, water, soil, rock) to living organisms ( ) & back again. Nutrient
Phosphorus for the Ontario CCA 4R Nutrient Management Specialty
 Ontario CCA 4R Nutrient Management Workshop Wednesday, 18 January 2017 Woodstock, Ontario, Canada Phosphorus for the Ontario CCA 4R Nutrient Management Specialty Tom Bruulsema, Phosphorus Program Director
River transport and chemistry
 OCN 401 Biogeochemical Systems (10.15.15) (Schlesinger & Bernhardt: Chapter 8) River transport and chemistry Lecture Outline 1. Introduction - Overview 2. Soil Hydraulics & Stream Hydrology 3. Stream Load
II. Needs of Organisms. Biosphere A. All parts of the earth that contains and support life 1. Geosphere 2. Atmosphere 3.
 I. Earth s Spheres A. Hydrosphere: Water part of the planet B. Atmosphere: Gas part of the earth C. Biosphere: Life part of the earth D. Geosphere: Rock/Soil part of the earth E. Mr. Wright s famous saying,
The Netherlands. Nitrate problem in the Netherlands. Compare California and the Netherlands
 The Netherlands National Institute for Public Health and the Environment Dico Fraters and Leo Boumans (RIVM) Joan Reijs and Ton van Leeuwen (LEI) Relationship between surplus and nitrate on sandy soils
Integrating wetlands and riparian zones in regional hydrological modelling
 Integrating wetlands and riparian zones in regional hydrological modelling Fred Hattermann, Valentina Krysanova & Joachim Post Potsdam Institute for Climate Impact Research Outline Introduction Model concept:
LABEL AND EXPLAIN THE PROCESSES AT EACH NUMBER IN THE DIAGRAM ABOVE
 HYDROLOGIC CYCLE 3 4 5 2 5 1B 6B 1A 6A 7 6C LABEL AND EXPLAIN THE PROCESSES AT EACH NUMBER IN THE DIAGRAM ABOVE 1A. Evaporation of water from oceans 1B. Evaporation of water from land sources (water and
Improvements and Scientific Validation of CLM in the framework of the Terrestrial Systems Modeling Platform (TerrSysMP)
") TR32 Improvements and Scientific Validation of CLM in the framework of the Terrestrial Systems Modeling Platform (TerrSysMP) P. Shrestha 1, M. Sulis 1, S. Kollet 2,3, C. Simmer 1,3 1 Meteorological Institute,
TR32 Improvements and Scientific Validation of CLM in the framework of the Terrestrial Systems Modeling Platform (TerrSysMP) P. Shrestha 1, M. Sulis 1, S. Kollet 2,3, C. Simmer 1,3 1 Meteorological Institute,
CENTRAL PLATTE NATURAL RESOURCES DISTRICT NITROGEN MANAGEMENT CERTIFICATION TEST
 CENTRAL PLATTE NATURAL RESOURCES DISTRICT NITROGEN MANAGEMENT CERTIFICATION TEST NAME: CERT #: ADDRESS: CITY: Section A: The Nitrate Contamination Concern 1) The U.S. Environmental Protection Agency s
Afternoon Lecture Outline
 Afternoon Lecture Outline 1. Northern Prairies watershed hydrology 2. Solute mass balance in lakes and ponds 3. Simple mass balance simulation using MS Excel 4. Effects of sediment-water exchange on lake
Combining Dynamic Economic Analysis and Environmental Impact Modelling: Addressing Uncertainty and Complexity of Agricultural Development
 Combining Dynamic Economic Analysis and Environmental Impact Modelling: Addressing Uncertainty and Complexity of Agricultural Development Heikki Lehtonen a, Ilona Bärlund b, Sirkka Tattari b and Mikael
Cycling and Biogeochemical Transformations of N, P, S, and K
 Cycling and Biogeochemical Transformations of N, P, S, and K OCN 401 - Biogeochemical Systems 18 September 2012 Reading: Schlesinger, Chapter 6 1. Nitrogen cycle Soil nitrogen cycle Nitrification Emissions
SPACE ASSISTED WATER QUALITY FORECASTING PLATFORM
 SPACE-O WORKSHOP ON USING WATER QUALITY FORECASTING INDECISION MAKING SPACE ASSISTED WATER QUALITY FORECASTING PLATFORM FOR OPTIMIZED DECISION MAKING IN WATER SUPPLY SERVICES TZIMAS APOSTOLOS PROJECT COORDINATOR
Controlled drainage - a SCIEN drainage technology
 Controlled drainage - a SCIEN drainage technology Controlled drainage can be used as a tool to reduce the outlet of nutrients from agricultural fields to the aquatic environment. This presentation describes
CHAPTER ONE : INTRODUCTION
 CHAPTER ONE : INTRODUCTION WHAT IS THE HYDROLOGY? The Hydrology means the science of water. It is the science that deals with the occurrence, circulation and distribution of water of the earth and earth
Ecology and Animal Health
 Ecosystem Health and Sustainable Agriculture 2 Ecology and Animal Health Editors: Leif Norrgren and Jeffrey M. Levengood CSD Uppsala. Centre for sustainable development Eutrophication 6 Lennart Gladh World
Afternoon Lecture Outline. Northern Prairie Hydrology
 Afternoon Lecture Outline 1. Northern Prairies watershed hydrology 2. Solute mass balance in lakes and ponds 3. Simple mass balance simulation using MS Excel 4. Effects of sediment-water exchange on lake
Gypsum-based management practises to prevent phosphorus transportation
 Gypsum-based management practises to prevent phosphorus transportation Liisa Pietola Research Centre Hanninghof, Yara Yara Suomi Mechelininkatu 1a PO Box 900 FIN-00181 Helsinki NJF seminar 401 on Phosphorus
Ecosystems. Trophic relationships determine the routes of energy flow and chemical cycling in ecosystems.
 AP BIOLOGY ECOLOGY ACTIVITY #5 Ecosystems NAME DATE HOUR An ecosystem consists of all the organisms living in a community as well as all the abiotic factors with which they interact. The dynamics of an
Appendix X: Non-Point Source Pollution
 Appendix X: Non-Point Source Pollution Sources Nonpoint source of pollution, unlike pollution from industrial and sewage treatment plants, comes from many different sources. Nonpoint source pollution is
Ecosystem. Ecosystems. Consumers. Simple Ecosystem Model. Trophic Levels. Food Chain marsh hawk
 Ecosystem Ecosystems Chapter 47 An association of organisms and their physical environment, interconnected by ongoing flow of energy and a cycling of materials Simple Ecosystem Model energy input from
Cycling and Biogeochemical Transformations of N, P, S, and K
 Cycling and Biogeochemical Transformations of N, P, S, and K OCN 401 - Biogeochemical Systems 19 September 2016 Reading: Schlesinger & Bernhardt, Chapter 6 2017 Frank Sansone Outline 1. Nitrogen cycle
Afternoon Lecture Outline. Northern Prairie Hydrology
 Afternoon Lecture Outline 1. Northern Prairies watershed hydrology 2. Solute mass balance in lakes and ponds 3. Simple mass balance simulation using MS Excel 4. Effects of sediment-water exchange on lake
Land Modeling II - Biogeochemistry: Ecosystem Modeling and Land Use Dr. Peter Lawrence
 Land Modeling II - Biogeochemistry: Ecosystem Modeling and Land Use Dr. Peter Lawrence Project Scientist Terrestrial Science Section Climate and Global Dynamics Division (With thanks to TSS and IAM groups
Phosphorus for the Ontario CCA 4R Nutrient Management Specialty
 Ontario CCA 4R Nutrient Management Workshop Thursday, July 21, 2016 Holiday Inn, Guelph Phosphorus for the Ontario CCA 4R Nutrient Management Specialty Tom Bruulsema, Phosphorus Program Director Lake Erie
Ecosystem ecology ECOSYSTEM ECOLOGY. Thermodynamics. Energy moves through ecosystems. Energy 11/25/2017
 ECOSYSTEM ECOLOGY Ecosystem ecology Chapter 55 Study of biological communities and abiotic environment Thermodynamics First Law of Thermodynamics - Energy is neither created nor destroyed Second Law of
Lesson Overview. Cycles of Matter. Lesson Overview. 3.4 Cycles of Matter
 Lesson Overview 3.4 THINK ABOUT IT A handful of elements combine to form the building blocks of all known organisms. Organisms cannot manufacture these elements and do not use them up, so where do essential
Part B: Phosphorus Loss Potential due to Management Practices and P Source Characteristics
 not suffer from such impacts. Surface waters having high water quality may require the implementation of policies and management practices to protect them from deterioration due to excess inputs of nutrients.
The rest of this article describes four biogeochemical cycles: the water cycle, carbon cycle, nitrogen cycle, and phosphorous cycle.
 BIOGEOCHEMICAL CYCLES The chemical elements and water that are needed by living things keep recycling over and over on Earth. These cycles are called biogeochemical cycles. They pass back and forth through
Cycles of Ma,er. Lesson Overview. Lesson Overview. 3.4 Cycles of Matter
 Lesson Overview Cycles of Ma,er Lesson Overview 3.4 Cycles of Matter THINK ABOUT IT A handful of elements combine to form the building blocks of all known organisms. Organisms cannot manufacture these
13.1 Ecologists Study Relationships. KEY CONCEPT Ecology is the study of the relationships among organisms and their environment.
 KEY CONCEPT Ecology is the study of the relationships among organisms and their environment. Ecologists study environments at different levels of organization. Ecology is the study of the interactions
Alum and Gypsum Treated Poultry Manure and Fertilizer Phosphorus Losses with Runoff with or without Incorporation into the Soil
 Alum and Gypsum Treated and Phosphorus Losses with Runoff with or without Incorporation into the Soil Final Project Report to the Iowa Egg Council Antonio P. Mallarino and Mazhar U. Haq Department of Agronomy,
Nitrogen Pollution and its Impacts
 Nitrogen Pollution and its Impacts OUTLINE: Background forms and cycling Sources Cycling, transport dynamics and loadings from watersheds Landuse and N exports Management Options to reduce N Effects and
Nutrient Management for Vegetable Production
 Nutrient Management for Vegetable Production Richard Smith, Farm Advisor Monterey County Farm Water Quality Planning Project UC Cooperative Extension/ USDA Natural Resources Conservation Service Fertilizers
River transport and chemistry. Lecture Outline
 OCN 401 Biogeochemical Systems (10.12.17) (Schlesinger & Bernhardt: Chapter 8) River transport and chemistry Lecture Outline 1. Introduction Overview 2. Soil Hydraulics & Stream Hydrology 3. Stream Load
Impact and causes of decreasing nitrate contents in the groundwater of the canton of Berne
 Eidgenössisches Volkswirtschaftsdepartement EVD Forschungsanstalt Agroscope Reckenholz-Tänikon ART Impact and causes of decreasing nitrate contents in the groundwater of the canton of Berne Ernst Spiess
Nutrient Sources, are not all Equal. John Lauzon
 Nutrient Sources, are not all Equal John Lauzon Managing Organic Sources of Nutrients Organic forms of nitrogen aregenerally not plant available Need an understanding of if, and how much plant available
Balt-HYPE: a tool for high resolution hydrological modelling of the Baltic basin
 Balt-HYPE: a tool for high resolution hydrological modelling of the Baltic basin Assoc. Prof., Dr. Berit Arheimer Head of Hydrological Research Swedish Meteorological and Hydrological Institute (SMHI)
Impact analysis of the decline of agricultural land-use on flood risk and material flux in hilly and mountainous watersheds
 Proc. IAHS, 370, 39 44, 2015 doi:10.5194/piahs-370-39-2015 Author(s) 2015. CC Attribution 3.0 License. Impact analysis of the decline of agricultural land-use on flood risk and material flux in hilly and
Cycling and Biogeochemical Transformations of N, P, S, and K
 Cycling and Biogeochemical Transformations of N, P, S, and K OCN 401 - Biogeochemical Systems 23 September 2014 Reading: Schlesinger & Bernhardt, Chapter 6 2014 Frank Sansone 1. Nitrogen cycle Soil nitrogen
Lecture 11: Water Flow; Soils and the Hydrologic Cycle
 Lecture 11: Water Flow; Soils and the Hydrologic Cycle Water Flow in Soils Types of Water Flow in Soil Saturated flow: Soil pores completely filled with water; controlled by the hydrostatic potential After
The Development of the Indicator of Risk of Water Contamination by Nitrate in Canadian Agricultural Soils
 The Development of the Indicator of Risk of Water Contamination by Nitrate in Canadian Agricultural Soils C.F. Drury, J.Y. Yang, R. De Jong, X.M. Yang, and K. Reid Agriculture & Agri-Food Canada Harrow,
Water balance in soil
 Technische Universität München Water balance Water balance in soil Arno Rein Infiltration = + precipitation P evapotranspiration ET surface runoff Summer course Modeling of Plant Uptake, DTU Wednesday,
SOIL AND THE HYDROLOGIC CYCLE
 GEOLOGY 408/508 SOIL AND THE HYDROLOGIC CYCLE CHAPTER 6 Brady & Weil, Rev. 14th ed. THE HYDROLOGIC CYCLE (FIGURE 6.2) WATER BALANCE EQUATION Watershed - an area of land drained by a single stream system
Unit 3: Ecology II Section 1: Environmental Systems and Nutrient Cycling
 Unit 3: Ecology II Section 1: Environmental Systems and Nutrient Cycling Systems in the Environment are not Independent of one Another Central Case Study: The Vanishing Oysters of the Chesapeake Bay Chesapeake
NOTEBOOK. Table of Contents: 9. Properties of Water 9/20/ Water & Carbon Cycles 9/20/16
 NOTEBOOK Table of Contents: 9. Properties of Water 9/20/16 10. Water & Carbon Cycles 9/20/16 NOTEBOOK Assignment Page(s): Agenda: Tuesday, September 20, 2016 Properties of Water Water & Carbon Cycles 1.
Chapter 3 Ecosystem Ecology. Tuesday, September 19, 17
 Chapter 3 Ecosystem Ecology Reversing Deforestation in Haiti Answers the following: Why is deforestation in Haiti so common? What the negative impacts of deforestation? Name three actions intended counteract