Engineering Units. Multiples Micro ( ) = 10-6 Milli (m) = 10-3 Kilo (k) = Mega (M) = 10 +6
|
|
|
- Linette McGee
- 6 years ago
- Views:
Transcription


1
2 Engineering Units Multiples Micro ( ) = 10-6 Milli (m) = 10-3 Kilo (k) = Mega (M) = Imperial Units SI Units Length feet (ft) meter (m) Area square feet (ft 2 ) square meter (m 2 ) Force pounds (p) Newton (N) Pressure/Stress pounds/foot 2 (psf) Pascal (Pa) = (N/m 2 ) Multiple Units Length inches (in) millimeter (mm) Area square feet (ft2) square millimeter (mm 2 ) Force ton (t) kilonewton (kn) Pressure/Stress pounds/inch 2 (psi) kilonewton/meter 2 kpa) tons/foot 2 (tsf) meganewton/meter 2 (MPa) Conversion Factors Force: 1 ton = 9.8 kn 1 kg = 9.8 N Pressure/Stress 1kg/cm 2 = 100 kpa = 100 kn/m 2 = 1 bar 1 tsf = 96 kpa (~100 kpa = 0.1 MPa) 1 t/m 2 ~ 10 kpa 14.5 psi = 100 kpa 2.31 foot of water = 1 psi 1 meter of water = 10 kpa Derived Values from Friction ratio: R f = (f s /q t ) x 100% Corrected cone resistance: q t = q c + u 2 (1-a) Net cone resistance: q n = q t vo Excess pore pressure: u = u 2 u 0 Pore pressure ratio: Bq = u / q n Normalized excess pore pressure: U = (u t u 0 ) / (u i u 0 ) where: u t is the pore pressure at time t in a dissipation test, and u i is the initial pore pressure at the start of the dissipation test
3 Guide to Cone Penetration Testing for Geo-Environmental Engineering By P. K. Robertson and K.L. Cabal (Robertson) Gregg Drilling & Testing, Inc. 2nd Edition December 2008
4 Gregg Drilling & Testing, Inc. Corporate Headquarters 2726 Walnut Avenue Signal Hill, California Telephone: (562) Fax: (562) Website: The publisher and the author make no warranties or representations of any kind concerning the accuracy or suitability of the information contained in this guide for any purpose and cannot accept any legal responsibility for any errors or omissions that may have been made. Copyright 2008 Gregg Drilling & Testing, Inc. All rights reserved.
5 TABLE OF CONTENTS Basic Glossary i Introduction 1 Risk Based Site Characterization 2 Expedited Site Assessment 3 Role of the 5 Cone Penetration Test () 7 Introduction 7 History 8 Test Equipment and Procedures 11 Pushing Equipment 12 Depth of Penetration 16 Test Procedures 16 Basic Soil Mechanics 19 Interpretation 26 Sensors to Screen for Contaminants 36 Sampling Devices 51 Small Diameter Wells & Piezometers 59 Sealing and Decontamination 62 Summary 65 Appendix A 67 Main References 84
6
7 Glossary Basic Glossary This glossary contains the most commonly used terms related to and are presented in alphabetical order. Cone penetration test. U Cone penetration test with pore pressure measurement piezocone test. Cone The part of the cone penetrometer on which the cone resistance is measured. Cone penetrometer The assembly containing the cone, friction sleeve, and any other sensors and measuring systems, as well as the connections to the push rods. Cone resistance, q c The force acting on the cone, Q c, divided by the projected area of the cone, A c. q c = Q c / A c Corrected cone resistance, q t The cone resistance q c corrected for pore water effects. q t = q c + u 2 (1- a n ) (a n = net area ratio) Data acquisition system The system used to record the measurements made by the cone penetrometer. Dissipation test A test when the decay of the pore pressure is monitored during a pause in penetration. Filter element The porous element inserted into the cone penetrometer to allow transmission of pore water pressure to the pore pressure sensor, while maintaining the correct dimensions of the cone penetrometer. Friction ratio, R f The ratio, expressed as a percentage, of the sleeve friction, f s, to the cone resistance, q t, both measured at the same depth. R f = (f s /q t ) x 100% i
8 Glossary Friction reducer A local enlargement on the push rods placed a short distance above the cone penetrometer, to reduce the friction on the push rods. Friction sleeve The section of the cone penetrometer upon which the sleeve friction is measured. Normalized cone resistance, Q t The cone resistance expressed in a non-dimensional form and taking account of the in-situ vertical stresses. Q t = (q t σ vo ) / σ' vo Normalized cone resistance, Q tn The cone resistance expressed in a non-dimensional form taking account of the in-situ vertical stresses and where the stress exponent (n) varies with soil type. When n = 1, Q tn = Q t. n qt σ vo Pa Q tn = P a2 σ ' vo Net cone resistance, q n The corrected cone resistance minus the vertical total stress. q n = q t σ vo Excess pore pressure (or net pore pressure), Δu The measured pore pressure less the in-situ equilibrium pore pressure. Δu = u 2 u 0 Pore pressure The pore pressure generated during cone penetration and measured by a pore pressure sensor: u 1 when measured on the cone u 2 when measured just behind the cone. Pore pressure ratio, B q The net pore pressure normalized with respect to the net cone resistance. B q = Δu / q n Push rods Thick-walled tubes used to advance the cone penetrometer Sleeve friction, f s The frictional force acting on the friction sleeve, F s, divided by its surface area, A s. f s = F s / A s ii
9 Introduction Introduction In recent years there has been a steady increase in geo-environmental projects where geotechnical engineering has been combined with environmental concerns. Many of these projects involve some form of ground contaminant which can take the form of vapors, liquids and solids. Hence, there has been a change in site characterization techniques to accommodate these environmental issues related to contaminants. Traditional drilling techniques generally produce considerable disturbance to the materials surrounding the drill hole, which can have a significant effect on subsequent sample quality. With increasing application of data quality management, drilling and sampling techniques are becoming less acceptable. In addition, drilling methods produce cuttings of the material removed from the drill hole which may require special handling and costly disposal methods. The most rapidly developing site characterization techniques for geoenvironmental purposes involve direct push technology, specifically cone penetration tests. Direct push devices generate essentially no cuttings, produce little disturbance and reduce contact between field personnel and contaminants, since the penetrometer push rods can be decontaminated during retrieval. The most popular direct push logging test for geoenvironmental investigations in soil is the Cone Penetration Test (). The provides a rapid, repeatable, reliable and cost effective method of continuous measurement. The purpose of this guide is to provide a concise resource for the application of the for geo-environmental projects. This guide is a supplement to the book in Geotechnical Practice by Lunne, Robertson and Powell (1997). This guide is applicable primarily to data obtained using a standard electronic cone with a 60-degree apex angle and either a diameter of 35.7 mm or 43.7 mm (10 or 15 cm 2 cross-sectional area). Recommendations are provided on applications of data for soil profiling, material identification, evaluation of geotechnical parameters and application of technology to geo-environmental projects. This guide provides only the basic recommendations for the application of the for geo-environmental projects. 1
10 Risk Based Site Characterization Risk Based Site Characterization Risk and uncertainty are characteristics of the ground and are never fully eliminated. The extent and level of an investigation should be based on the risk of the project. Risk analysis answers three basic questions, namely: What can go wrong? How likely is it? What are the consequences? In general, projects can be classified as either, low, moderate or high risk projects, depending on the probability of the associated hazards occurring and the associated consequences. Low-risk projects could be projects with few hazards, low probability of occurrence, and limited consequences, whereas high risk projects could be projects with many hazards, a high probability of occurrence, and severe consequences. The level of sophistication in a site investigation is also a function of the project objectives and the potential for cost savings. 2
11 Expedited Site Assessment Expedited Site Assessment Expedited site assessment (ESA) is a framework for rapidly characterizing site conditions for input into corrective active decisions. It involves field generated data and on-site interpretation, a flexible sampling and analytical program and experienced staff in the field who are authorized to make sampling and analytical decisions. A summary of the ESA process is shown in Figure 1. Figure 1 Summary of the Expedited Site Assessment Process 3
12 Expedited Site Assessment A comparison between ESA and conventional site assessment is shown in Table 1. Process Component Conventional Site Assessments Expedited Site Assessments Number of phases of investigation Multiple Single Technical Strategy Focus on plan view map; sampling location based on limited information. Sampling locations are predetermined Use of multiple complementary technologies; sampling locations depend on existing data; minimal well installation Work plan Rigid plan Flexible plan Data analysis Interpretation of data is weeks or months later Regular (hourly/daily) interpretation of data Innovative technologies (i.e. direct push and field analytical methods) May or may not be used; not integrated into process Standard practice, onsite interactive process Table 1 Comparison between ESA and Conventional Site Assessment The and associated sampling equipment are ideal to collect and evaluate on-site data in an ESA program. 4
13 Role of the Role of the The objectives of any subsurface investigation are to determine the following: Nature and sequence of the subsurface strata (geologic regime) Groundwater conditions (hydrologic regime) Physical and mechanical properties of the subsurface strata For geo-environmental site investigations where contaminants are possible, the above objectives have the additional requirement to determine: Distribution and composition of contaminants The contaminants can exist in vapor, liquid and solid forms. The above requirements are a function of the proposed project and the associated risks. The variety in geological conditions and range in project requirements make the subject complex. There are many techniques available to meet the objectives of a site investigation and these include both field and laboratory testing. An ideal investigation program would likely include a mix of field and laboratory tests depending on the risk of the project. For geo-environmental projects where potential contaminants are identified, long term monitoring and sampling maybe required for both design and either remediation or containment. Hence, the objectives for geoenvironmental site characterization can be quite different from those for a more traditional geotechnical site characterization. 5
14 Role of the The Cone Penetration Test () and its enhanced versions with additional sensors have extensive applications in a wide range of soils. Although the is limited primarily to softer soils, with modern large pushing equipment and more robust cones, the can be performed in stiff to very stiff soils, and in some cases soft rock. Advantages of : Fast and continuous profiling Repeatable and reliable data (operator-independent) Economical and productive Strong theoretical basis for interpretation Additional sensors Disadvantage of : High capital investment Requires skilled operators No soil sample Penetration can be restricted in gravel/cemented layers Sensors have been developed to identify certain contaminants. Although a disadvantage is that no soil sample is obtained during a, it is possible to obtain soil samples using pushing equipment. Samples can be obtained of solids, liquid and vapor. The continuous nature of results provides detailed stratigraphic profiles to guide in selective sampling appropriate for the project. The recommended approach is to first perform several soundings to define the stratigraphic profile and to provide initial estimates of soil and groundwater conditions and then follow with selective sampling. The type and amount of sampling will depend on the project requirements and risk as well as the stratigraphic profile. Typically sampling will be focused in the critical zones as defined by the. Several soil, fluid and vapor samplers are available that can be pushed in to the ground using pushing equipment. Details on various sampling methods are provided in later sections. 6
15 Introduction Cone Penetration Test () In the Cone Penetration Test (), a cone on the end of a series of rods is pushed into the ground at a constant rate and continuous measurements are made of the resistance to penetration of the cone and of a surface sleeve. Figure 2 illustrates the main terminology regarding cone penetrometers. The total force acting on the cone, Q c, divided by the projected area of the cone, A c, produces the cone resistance, q c. The total force acting on the friction sleeve, F s, divided by the surface area of the friction sleeve, A s, produces the sleeve friction, f s. In a piezocone, pore pressure is also measured, as shown in Figure 2. Figure 2 Terminology for cone penetrometers 7

16 History 1932 The first cone penetrometer tests were made using a 35 mm outside diameter gas pipe with a 15 mm steel inner push rod. A cone tip with a 10 cm 2 projected area and a 60 o apex angle was attached to the steel inner push rods, as shown in Figure 3. Figure 3 Early Dutch mechanical cone (After Sanglerat, 1972) 1935 Delf Soil Mechanics Laboratory designed the first manually operated 10 ton (100 kn) cone penetration push machine, see Figure 4. Figure 4 Early Dutch mechanical cone (After Delft Geotechnics) 8
17 1948 The original Dutch mechanical cone was improved by adding a conical part just above the cone. The purpose of the geometry was to prevent soil from entering the gap between the casing and inner rods. The basic Dutch mechanical cones, shown in Figure 5, are still in use in some parts of the world. Figure 5 Dutch mechanical cone penetrometer with conical mantle 1953 A friction sleeve ( adhesion jacket ) was added behind the cone to include measurement of the local sleeve friction (Begemann, 1953), see Figure 6. Measurements were made every 8 inches (20 cm), and for the first time, friction ratio was used to classify soil type (see Figure 7). Figure 6 Begemann type cone with friction sleeve 9
18 Figure 7 First soil classification for Begemann mechanical cone 1965 Fugro developed an electric cone, of which the shape and dimensions formed the basis for the modern cones and the International Reference Test and ASTM procedure. The main improvements relative to the mechanical cone penetrometers were: Elimination of incorrect readings due to friction between inner rods and outer rods and weight of inner rods. Continuous testing with continuous rate of penetration without the need for alternate movements of different parts of the penetrometer and no undesirable soil movements influencing the cone resistance. Simpler and more reliable electrical measurement of cone resistance and sleeve friction Cone penetrometers that could also measure pore pressure (piezocone) were introduced. Early design had various shapes and pore pressure filter locations. Gradually the practice has become more standardized so that the recommended position of the filter element is close behind the cone at the u 2 location. With the measurement of pore water pressure it became apparent that it was necessary to correct the cone resistance for pore water pressure effects (q t ), especially in soft clay. 10

19 Test Equipment and Procedures Cone Penetrometers Cone penetrometers come in a range of sizes with the 10 cm 2 and 15 cm 2 probes the most common and specified in most standards. Figure 8 shows a range of cones from a mini-cone at 2 cm 2 to a large cone at 40 cm 2. The mini cones are used for shallow investigations, whereas the large cones can be used in gravely soils. Figure 8 Range of probes (from left: 2 cm 2, 10 cm 2, 15 cm 2, 40 cm 2 ) 11

20 Pushing Equipment Pushing equipment consists of push rods, a thrust mechanism and a reaction frame. On Land Pushing equipment for land applications generally consist of specialty built units that are either truck or track mounted. s can also be carried out using an anchored drill-rig. Figures 9 to 12 show a range of on land pushing equipment. Figure 9 Truck mounted 25 ton unit 12


21 Figure 10 Track mounted 20 ton unit Figure 11 Small anchored drill-rig unit 13

22 Figure 12 Portable ramset for inside buildings or limited access 14

, see Figures 13 and 14.")
23 Over Water There is a variety of pushing equipment for over water investigations depending on the depth of water. Floating or Jack-up barges are common in shallow water (depth less than 100 feet/30m), see Figures 13 and 14. Figure 13 Mid-size jack-up boat Figure 14 Quinn Delta ship with spuds 15
24 Depth of Penetration s can be performed to depths exceeding 300 feet (100m) in soft soils and with large capacity pushing equipment. To improve the depth of penetration, the friction along the push rods should be reduced. This is normally done by placing an expanded coupling (friction reducer) a short distance (typically 3 feet, ~1m) behind the cone. Penetration will be limited if either very hard soils, gravel layers or rock are encountered. It is common to use 15 cm 2 cones to increase penetration depth, since 15 cm 2 cones are more robust and have a slightly larger diameter than the 10 cm 2 push rods. Test Procedures Pre-drilling For penetration in fills or hard soils it may be necessary to pre-drill in order to avoid damaging the cone. Pre-drilling, in certain cases, may be replaced by first pre-punching a hole through the upper problem material with a solid steel dummy probe with a diameter slightly larger than the cone. It is also common to hand auger the first 5 feet (1.5m) in urban areas to avoid underground utilities. Verticality The thrust machine should be set up so as to obtain a thrust direction as near as possible to vertical. The deviation of the initial thrust direction from vertical should not exceed 2 degrees and push rods should be checked for straightness. Modern cones have simple slope sensors incorporated to enable a measure of the non-verticality of the sounding. This is useful to avoid damage to equipment and breaking of push rods. For depths less than 50 feet (15m), significant non-verticality is unusual, provided the initial thrust direction is vertical. Reference Measurements Modern cones have the potential for a high degree of accuracy and repeatability (0.2% of full-scale output). Tests have shown that the zero load 16
25 output of the sensors can be sensitive to changes, such as temperature. It is common practice to record zero load readings of all sensors to track these changes. Rate of Penetration The standard rate of penetration is 2 cm/sec (approximately 1 inch per second). Hence, a 60 foot (20m) sounding can be completed (start to finish) in about 30 minutes. The cone results are generally not sensitive to slight variations in the rate of penetration. Interval of readings Electric cones typically produce continuous analogue data. Most systems convert the data to digital form at selected intervals. Newer cones convert the signal to digital form downhole in the cone for improved transmission quality. Most standards require the data collection interval to be no more than 8 inches (200mm). In general, most systems collect data at intervals of between 1 to 2 inches (25-50mm), with 2 inches (50 mm) being the most common. Dissipation Tests During a pause in penetration, any excess pore pressure generated around the cone will start to dissipate. The rate of dissipation depends upon the coefficient of consolidation, which in turn, depends on the compressibility and permeability of the soil. The rate of dissipation also depends on the diameter of the probe. A dissipation test can be performed at any required depth by stopping the penetration and measuring the decay of pore pressure with time. If equilibrium pore pressures are required, the dissipation test should continue until no further dissipation is observed. This can occur rapidly in sands, but may take many hours in plastic clays. Dissipation rate increases as probe size decreases. Calibration and Maintenance Calibrations should be carried out at regular intervals (approximately every 6 months). For major projects, check calibrations can be carried out before and after the field work, with functional checks during the work. Functional 17
26 checks should include recording and evaluating the zero load measurements (baseline). With careful design, calibration, and maintenance, strain gauge load cells and pressure transducers can have an accuracy and repeatability of better than +/- 0.2% of full scale reading. Table 2 shows a summary of checks and recalibrations for the Maintenance Start of Project Start of Test End of Test End of Day Once a Month Every 6* months Wear x x x O-ring seals x x Push-rods x x Pore pressure-filter x x Calibration x Computer Cone x x Zero-load x x Cables x x Table 2 Summary of checks and recalibrations for the * depending on stability of zero-load readings Pore water effects In soft clays and silts and in over water work, the measured q c must be corrected for pore water pressures acting on the cone geometry, thus obtaining the corrected cone resistance, q t : q t = q c + u 2 (1 a n ) where a n is the net area ratio determined from laboratory calibration with a typical value of between 0.80 to In sandy soils q c = q t. 18
27 Basic Soil Mechanics Introduction A soil can be visualized as a skeleton of solid particles enclosing continuous voids containing water and/or air. For the range of stresses usually encountered in practice the individual solid particles and water can be considered incompressible. The volume of the soil skeleton as a whole can change due to rearrangement of the solid particles into new positions, mainly by rolling and sliding, with the corresponding change in the forces acting between particles. In a fully saturated soil, a reduction in volume is possible only if some of the water can escape from the voids. Groundwater Groundwater is the water occurring beneath the earth s surface that fills (saturates) the void space of sediments. In a soil environment, coarse soils such as sand and gravel deposits usually provide good flow of water and are referred to as aquifers; whereas, the finer-grained clay and silt deposits provide relatively poor flow of water and are referred to as aquitards. Groundwater and surface water are connected physically in the hydrologic cycle. The two most important physical properties for groundwater flow are porosity, n, (void ratio is more commonly used in geotechnical engineering) and hydraulic conductivity, k, (which is often expressed as the coefficient of permeability). Porosity (n) is the ratio of the volume of the voids in sediments to the total volume of the material, whereas void ratio (e) is the ratio of the volume of the voids to the volume of the solids. The two are linked by: n = e / (1+e) Porosity is usually expressed as a percentage, e.g. when n = 50%, e = 1.0. The term effective porosity refers to the degree of interconnectedness of the pore spaces. For coarse sediments, such as, sand and gravel, the effective porosity can be equal to the overall porosity. However, in fine-grained sediments, such as clay, the effective porosity can be low due to water that is tightly held in the small pore spaces and the bound water held by the surface chemistry of clay particles. 19
28 Hydraulic conductivity (k), is a measure of a sediments ability to transmit water. The size, shape, and interconnectedness of pore spaces affect hydraulic conductivity. The presence of a small percentage of fines in a coarse-grained soil results in a value of permeability significantly lower than for the same soil without the fines. If a soil is stratified the permeability for flow parallel to the direction of stratification is higher than that for flow perpendicular to the direction of stratification. Hydraulic conductivity is expressed in units of length/time: feet/day, meters/day, cm/sec, etc. The values of k for different types of soil are typically within the range of 1 to m/s (i.e. ten orders of magnitude). In most depositional environments, coarse-grained deposits are interbedded with finer-grained deposits creating a series of aquifers and aquitards. When a saturated aquifer is bounded on top by an aquitard (also known as a confining layer), the aquifer is called a confined aquifer. Under these conditions, the water is under pressure so that it will rise above the top of the aquifer if the aquitard is penetrated by a well. The elevation to which the water rises is known as the potentiometric (or piezometric) surface. When an aquifer is not bounded on top by an aquitard, the aquifer is said to be unconfined. In an unconfined aquifer, the pressure on the top surface of the groundwater is equal to that of the atmosphere (i.e. the pore water pressure is zero). This surface is known as the water table or phreatic surface. The arrangement of aquifers and aquitards in the subsurface is referred to as hydrostratigraphy. When a well penetrates a confined aquifer with a potentiometric (piezometric) surface that is higher than the land surface, water will flow naturally to the surface. This is known as artesian flow, and results from pressure within the aquifer. The pressure results when the recharge area for the aquifer is at a higher elevation than the point at which discharge is occurring. The confining layer prevents the groundwater from returning to the surface until that layer is penetrated by a well. When a penetrates a confined aquifer, equilibrium pore pressure measured by the will be higher than hydrostatic pressure below the water table, due to the elevated piezometric surface. Hence, the equilibrium pore pressure measured during a pause in a defines the piezometric surface at that depth. 20

29 Figure 15 is an example of variable piezometric surfaces as defined from three dissipation tests that show a downward flow. Figure 15 Example of different piezometric surfaces defined from (Note: 1 psi = 2.31 feet of water) Below the water table the soil is assumed to be fully saturated although it is likely that, due to the presence of small volumes of entrapped gas, the degree of saturation will be slightly less than 100%, especially near to the water table. The level of the water table changes according to climatic conditions and human activity. A perched water table can occur locally, contained by soil of low permeability, above the normal water table level. The region immediately above the water table can be essentially saturated due to capillary tension in the small pore spaces. The zone of saturated soil above the water table can be large in fine-grained soils and small in coarse-grained soils. Above the saturated zone the soil is unsaturated and is referred to as the vadose zone, due to the vapor (gas) in the interconnected pore spaces. 21
30 Movement of Groundwater - Seepage Movement of groundwater is controlled by the difference in total hydraulic head, which is the combination of elevation and pressure head. In an unconfined aquifer, the water table elevation represents the hydraulic head, while in a confined aquifer the potentiometric (piezometric) surface represents the hydraulic head. Water moves in response to the difference in hydraulic head from the point of highest energy (head) towards the lowest. On a regional scale this results in flow of groundwater from recharge areas to discharge areas. The rate of groundwater flow depends on the hydraulic conductivity (k) and the rate of change of hydraulic head over some distance. Below the water table the pore water may be static, with the hydrostatic pressure increasing with depth below the water table, or the pore water could be seeping through the soil under a hydraulic gradient. When the water is moving (flowing) Bernoulli's theorem applies to the pore water. Since seepage velocities in soil are normally small, the velocity head can be neglected. Thus: h = u /γ w + z where: h = total hydraulic head, u = pore water pressure, γ w = unit weight of water (9.81 kn/m 3 or 62.4 lb/ft 3 ), and z = elevation head above a chosen datum. In one dimension, water flows through a fully saturated soil in accordance with Darcy's empirical law: or q = A k i v = q /A = k i where: q = volume of water flowing per unit time, A = cross-sectional area of soil corresponding to the flow q, k = coefficient of permeability, i = hydraulic gradient, and v = discharge velocity. 22
31 The units of the coefficient of permeability are those of velocity (m/s or ft/s). The hydraulic gradient is given by: i = Δh / L where: Δh = total hydraulic head loss, and L = the length of flow over which the hydraulic head loss occurs. The hydraulic head loss is the difference in total hydraulic head over the zone of flow (Δh = h 2 h 1 ). Note that under hydrostatic conditions, where no flow is occurring, the total hydraulic head is constant (i.e. the hydraulic head loss is zero, Δh = 0) but the pore pressure increases with depth (i.e. elevation). The Principle of Effective Stress Shear stresses can only be resisted by the skeleton of solid particles, by means of forces developed at the interparticle contacts. Normal stress can be resisted by the soil skeleton through an increase in the interparticle forces. If the soil is fully saturated, the water filling the voids can also withstand normal stress by an increase in pressure. Soil behavior is controlled by the effective interparticle stress defined as: σ' = σ - u where: σ' = the effective normal stress, representing the stress transmitted through the soil skeleton only σ = the total normal stress, representing the force per unit area transmitted in a normal direction across the soil imagined as a solid material u = the pore pressure, the pressure of the water filling the void space between the solid particles. The pore pressure acts equally in every direction. Figure 16 illustrates the concept of effective stress. 23

32 Figure 16 Principle of effective stress in soil Consider a soil mass having a horizontal surface and with the water table at the surface level. The total vertical stress (i.e. the total normal stress on a horizontal plane) at depth z is equal to the weight of all material (solids + water) per unit area above that depth, i.e. σ v = γ sat z The pore water pressure at any depth will be hydrostatic since the void space between the solid particles is continuous, therefore at depth z: u = γ w z Hence, the vertical effective stress at depth z will be: 24
33 σ' v = σ v u σ' v = (γ sat γ w ) z = γ' z where γ' is the buoyant unit weight of the soil. When the water table is not at the ground surface, the vertical effective stress is the difference between the total vertical stress and the pore pressure. The total vertical stress is the weight of all the material (solid + water) per unit area above the depth in question. The pore pressure is the equilibrium water pressure corresponding to the depth below the water table. Typically this is the hydrostatic pressure, however, depending on the groundwater regime; the equilibrium water pressure may not be hydrostatic. The principle of effective stress is very important, since all soil behavior is controlled by the effective stress. The responds to the mechanical characteristics of the soil, which in turn, is controlled by the effective stress. Hence, data are often normalized using the vertical effective stress. 25
34 Interpretation Numerous semi-empirical correlations have been developed to estimate geotechnical parameters from the for a wide range of soils. These correlations vary in their reliability and applicability. Because the has additional sensors (e.g. pore pressure-u and seismic-s), the applicability to estimate soil parameters varies. Since with pore pressure measurements (U) is commonly available, Table 3 shows an estimate of the perceived applicability of the U to estimate soil parameters. If seismic is added, the ability to estimate soil stiffness (E, G & G o ) improves further. Soil Type D r Ψ K o OCR S t s u φ' E,G * M G 0 * k c h Sand Clay Table 3 Perceived applicability of U for deriving soil parameters 1=high, 2=high to moderate, 3=moderate, 4=moderate to low, 5=low reliability, Blank=no applicability, * improved with S Where: D r Relative density φ' Friction angle Ψ State Parameter K 0 In-situ stress ratio E, G Young s and Shear moduli G 0 Small strain shear moduli OCR Over consolidation ratio M Compressibility s u Undrained shear strength S t Sensitivity c h Coefficient of consolidation k Permeability A summary of methods for the interpretation of geotechnical soil parameters is given in the Appendix. Details for soil profiling and estimating soil permeability are provided in the next sections. 26
35 Soil Profiling and Classification The major application of the is for soil profiling and classification. Typically, the cone resistance, (q t ) is high in sands and low in clays, and the friction ratio (R f = f s /q t ) is low in sands and high in clays. classification charts cannot be expected to provide accurate predictions of soil type based on grain size distribution but provide a guide to the mechanical characteristics of the soil, or the Soil Behavior Type (SBT). data provides a repeatable index of the aggregate behavior of the in-situ soil in the immediate area of the probe. Hence, prediction of soil type based on is referred to as Soil Behavior Type (SBT). Non-Normalized Charts The most commonly used soil behavior type method is the chart suggested by Robertson et al. (1986) and shown in Figure 17. This chart uses the basic parameters of cone resistance, q t and friction ratio, R f. The chart is global in nature and can provide reasonable predictions of soil behavior type for soundings up to about 60ft (20m) in depth. The chart identifies general trends in ground response such as, increasing relative density (D r ) for sandy soils, increasing stress history (OCR), soil sensitivity (S t ) and void ratio (e) for cohesive soils. Overlap in some zones should be expected and the zones should be adjusted somewhat based on local experience. Normalized Charts Since both the penetration resistance and sleeve friction increase with depth due to the increase in effective overburden stress, the data requires normalization for overburden stress for very shallow and/or very deep soundings. A popular soil classification chart based on normalized data is that proposed by Robertson (1990) and shown in Figure 18. A zone has been identified in which the results for most young, un-cemented, insensitive, normally consolidated soils will fall. Again the chart is global in nature and provides only a guide to soil behavior type (SBT). Overlap in some zones should be expected and the zones should be adjusted somewhat based on local experience. 27
36 Zone Soil Behavior Type 1 Sensitive fine grained 2 Organic material 3 Clay 4 Silty Clay to clay 5 Clayey silt to silty clay 6 Sandy silt to clayey silt 7 Silty sand to sandy silt 8 Sand to silty sand 9 Sand 10 Gravelly sand to sand 11 Very stiff fine grained* 12 Sand to clayey sand* * Overconsolidated or cemented 1 MPa = 10 tsf Figure 17 Soil Behavior Type (SBT) chart (Robertson et al., 1986). 28
37 Zone Soil Behavior Type I c 1 Sensitive, fine grained N/A 2 Organic soils peats > Clays silty clay to clay Silt mixtures clayey silt to silty clay 5 Sand mixtures silty sand to sandy silt 6 Sands clean sand to silty sand 7 Gravelly sand to dense sand < Very stiff sand to clayey sand* N/A 9 Very stiff, fine grained* N/A * Heavily overconsolidated or cemented Figure 18 Normalized Soil Behavior Type (SBT N ) chart, Q t - F (Robertson, 1990). Note: Soil Behavior Type Index, I c is given by: I c = (( log Q t ) 2 + (log F r ) 2 )
38 The full normalized SBT N charts suggested by Robertson (1990) also included an additional chart based on normalized pore pressure parameter, B q, as shown on Figure 19, where; B q = Δu / q n and; excess pore pressure, Δu = u 2 u 0 net cone resistance, q n = q t σ vo The Q t B q chart can aid in the identification of saturated fine grained soils where the excess penetration pore pressures can be large. In general, the Q t - B q chart is not commonly used due to the lack of repeatability of the pore pressure results (e.g. poor saturation or loss of saturation of the filter element, etc.) Figure 19 Normalized Soil Behavior Type (SBT N ) charts Q t F r and Q t - B q (Robertson, 1990). 30
39 If no prior experience exists in a given geologic environment it is advisable to obtain samples from appropriate locations to verify the classification and soil behavior type. If significant experience is available and the charts have been modified based on this experience samples may not be required. Soil classification can be improved if pore pressure data is also collected, as shown on Figure 19. In soft clay the penetration pore pressures can be very large, whereas, in stiff heavily over-consolidated clays or dense silts and silty sands the penetration pore pressures can be small and sometimes negative relative to the equilibrium pore pressures (u 0 ). The rate of pore pressure dissipation during a pause in penetration can guide in the soil type. In sandy soils any excess pore pressures will dissipate very quickly, whereas, in clays the rate of dissipation can be very slow. To simplify the application of the SBT N chart shown in Figure 18, the normalized cone parameters Q t and F r can be combined into one Soil Behavior Type index, I c, where I c is the radius of the essentially concentric circles that represent the boundaries between each SBT zone. I c can be defined as follows; I c = (( log Q t ) 2 + (log F r ) 2 ) 0.5 where: Q t = the normalized cone penetration resistance (dimensionless) = (q t σ vo )/σ' vo F r = the normalized friction ratio, in % = (f s /(q t σ vo )) x 100% The term Q t represents the simple stress normalization with a stress exponent (n) of 1.0, which applies well to clay-like soils. Recently Robertson suggested that the normalized SBT N charts shown in Figures 18 and 19 should be used with the normalized cone resistance calculated by using a stress exponent that varies with soil type via I c (i.e. Q tn, see Glossary). The boundaries of soil behavior types are then given in terms of the index, I c, as shown in Figure 18. The soil behavior type index does not apply to zones 1, 8 and 9. Profiles of I c provide a simple guide to the continuous variation of soil behavior type in a given soil profile based on results. 31
40 Independent studies have shown that the normalized SBT N chart shown in Figure 18 typically has greater than 80% reliability when compared with samples. In recent years, the SBT charts have been color coded to aid in the visual presentation of SBT on a profile. An example profile is shown in Figure 20, the location of soil and groundwater samples are also shown. Figure 20 Example U profile with SBT (1 tsf ~ 0.1 MPa, 14.7 psi = 100kPa) 32
41 Hydraulic Conductivity (k) An approximate estimate of soil hydraulic conductivity or coefficient of permeability, k, can be made from an estimate of soil behavior type using the SBT charts. Table 4 provides estimates based on the non-normalized chart shown in Figure 17, while Table 5 provides estimates based on the normalized chart shown in Figure 18. These estimates are approximate at best, but can provide a guide to variations of possible permeability. Zone Soil Behavior Type (SBT) Range of permeability k (m/s) 1 Sensitive fine grained 3x10⁻⁹ to 3x Organic soils 1x10⁻⁸ to 1x Clay 1x10⁻¹⁰ to 1x Silty clay to clay 1x10⁻⁹ to 1x Clayey silt to silty clay 1x10⁻⁸ to 1x Sandy silt to clayey silt 1x10⁻⁷ to 1x Silty sand to sandy silt 1x10⁻⁵ to 1x Sand to silty sand 1x10⁻⁵ to 1x Sand 1x10⁻⁴ to 1x Gravelly sand to dense sand 1x10⁻³ to 1 11 Very stiff fine-grained soil 1x10⁻⁸ to 1x Very stiff sand to clayey sand 3x10⁻⁷ to 3x10⁻⁴ Table 4 Estimation of soil permeability (k) from the non-normalized SBT chart by Robertson et al. (1986) shown in Figure 17 The rate of dissipation of pore pressure during a dissipation test can also be used to estimate the horizontal coefficient of permeability (k h ), typically using the time to reach 50% dissipation (t 50 ). The method to determine the value of t 50 from a dissipation test is illustrated in Figure
42 Zone Soil Behavior Type (SBT N ) Range of permeability k (m/s) 1 Sensitive fine grained 3x10⁻⁹ to 3x Organic soils 1x10⁻⁸ to 1x Clay 1x10⁻¹⁰ to 1x Silt mixtures 3x10⁻⁹ to 1x Sand mixtures 1x10⁻⁷ to 1x Sands 1x10⁻⁵ to 1x Gravelly sands to dense sands 1x10⁻³ to 1 8 Very stiff sand to clayey sand 1x10⁻⁸ to 1x Very stiff fine-grained soil 1x10⁻⁸ to 1x10⁻⁶ Table 5 Estimation of soil permeability (k) from the normalized SBT N chart by Robertson (1990) shown in Figure 18 Robertson et al. (1992) presented a summary of available data to estimate the horizontal coefficient of permeability from dissipation tests, as shown in Figure 22. Since the relationship is also a function of the soil compressibility there is a wide variation of +/ one order of magnitude in the estimate. Jamiolkowski et al. (1985) suggested a range of possible values of k h /k v for soft clays as shown in Table 6. Nature of clay No macrofabric, or only slightly developed macrofabric, essentially homogeneous deposits From fairly well- to well-developed macrofabric, e.g. sedimentary clays with discontinuous lenses and layers of more permeable material Varved clays and other deposits containing embedded and more or less continuous permeable layers k h /k v 1 to to 4 3 to 10 Table 6 Range of possible field values of k h /k v for soft clays (Jamiolkowski et al., 1985) 34
43 Figure 21 Example dissipation test to determine t 50 Figure 22 Summary of data for estimating horizontal coefficient of permeability from dissipation tests (Robertson et al., 1992). (Note: increase values of k h by 1.5 when using a 15 cm 2 cone) 35
44 Sensors to Screen for Contaminants The is an excellent logging device that provides near continuous profiles of mechanical soil parameters. Screening sensors can be added to the to provide valuable qualitative data concerning the location and magnitude of contamination in the ground in addition to the data provided by the. Field screening data can be used to; Determine direct sampling locations Locate permanent and /or temporary well installations Enhance design of remediation programs. Significant cost saving is possible by combining the with various sensors to detect contaminants. Temperature One of the earliest sensors added to a cone was a temperature sensor. Initially temperature sensors were used to aid in either calibration corrections or to locate zones of different ground temperature, such as frozen soil. Recently temperature sensors have been used to aid in the identification of contaminants that generate heat due to biological and/or chemical activity. Electrical Conductivity/Resistivity One method of detecting changes in groundwater and soil chemistry is by measuring changes in the electrical bulk resistivity or conductivity. The conductivity is the inverse of resistivity, with the following as a useful guide; Conductivity (μs/cm) = 10,000 Resistivity (Ω-m) The rationale for making electrical measurements is that some contaminants change the electrical properties of the soil. Therefore, by measuring soil resistivity, the lateral and vertical extent of soil contamination can be evaluated when the contaminate influences the electrical properties of the ground and/or groundwater. Unsaturated soils 36

45 and saturated soils with many non-aqueous-phase-liquid (NAPL) compounds exhibit high electrical resistivity (low conductivity). Dissolved inorganic compounds, such as those contained in brines and landfill leachates, can significantly decrease soil resistivity. The resistivity (R) works on the principle that the measured voltage drop across two electrodes in the soil, at a given excitation current, is proportional to the electrical resistivity of the soil. The resistivity electrodes are typically steel rings from 5 mm to 15 mm wide that are set apart by distances that vary from 10 mm to 150 mm. The larger the spacing the greater the depth of penetration for the electrical field into the surrounding soil. Some probes have several electrode spacings so that lateral penetration varies. Some devices use small circular electrodes mounted around the circumference of the probe. The electrodes are designed to be wear resistant and have high electrical conductivity. A non-conducting plastic or other material is used as the insulator separating the electrodes. Figure 23 shows a range of resistivity cones. Figure 23 Example of some resistivity cones (courtesy P.Mayne) 37
46 Electrical resistance is not a material property but a function of the electrode spacing and size. To convert from resistance to resistivity, which is a material property, a laboratory calibration of the probe geometry is necessary. The resistivity of soil is for the most part influenced by the resistivity of the pore liquid, which in turn is a measure of the pore fluid chemical composition (e.g. hydrocarbons are typically non-conductive and will therefore exhibit high resistivity). Electrical resistivity/conductivity is also strongly influenced by clay content. Low resistivity (high conductivity) is typically linked with high clay content, all other factors constant. The main disadvantage with electrical measurements is that the bulk resistivity or conductivity is not directly controlled by the chemical properties of the surrounding material. The measurements are strongly influenced by the background soil and pore liquid. Hence, it is important to obtain measurements of the background uncontaminated ground for comparison. For relatively uniform soil conditions it is possible to develop local site specific correlations between the bulk resistivity and selected contaminants. Electrical resistivity can also be very effective in locating the groundwater table, since there is a large change in bulk resistivity between dry and saturated soil. The primary advantage of the resistivity is that it provides continuous profiles of bulk resistivity along with the full data in a rapid cost effective manner. Profiles of resistivity measurements can then be used to identify potentially critical zones where detailed sampling and/or monitoring can be carried out. An example resistivity profile is shown in Figure 24 at a site where there was a variation in water quality from fresh to salt water, the salt water has a lower resistivity than fresh water. 38

47 Figure 24 Example electrical resistivity (R) used to identify salt water zone Dielectric Measurements The electrical measurements discussed above relate to resistivity. However, electrical measurements can also be made to measure the dielectric constant of the material surrounding a penetrometer. The resistivity can be somewhat insensitive to contaminant type whereas, the dielectric constant can be very sensitive to contaminant type. The dielectric constant is frequency dependent. However, above about 50 MHz the dielectric constant is essentially constant. Contaminants such as light and dense NAPL zones can be detected by low values of dielectric constant and conductivity in relation to the background surrounding water saturated soil. 39
48 ph The acidity of a material can be measured using ph sensors mounted either inside a cone or on the surface of the probe. The disadvantage of sensors mounted inside the cone is that a sample of pore liquid must be drawn into the measuring cell and then expelled. This process can be difficult in low permeability soils such as clay and the cell and sensor must be cleaned after each reading. More details about sampling techniques will be given in a later section. Sensors mounted on the outside of the cone have the advantage of direct exposure to the surrounding material, however, abrasion and damage to the sensor can be a major problem. A ph sensor can be located in a small recess a short distance behind the friction sleeve. This recess is designed to produce a small vortex for pore liquid to enter during cone penetration. The sensor is then well protected from abrasion and damage from the surrounding solid material and can measure continuous variations of the ph of the pore liquid. The ph measurements are sensitive to temperature changes and generally a temperature sensor is mounted adjacent to the ph sensor to allow for automatic correction for temperature effects. The continuous measurement of ph can be a useful guide for detecting certain contaminants with significantly different ph values from that of the background soil. A ph sensor can be used to identify either acidic or basic materials. Oxygen Exchange Capacity The oxygen exchange capacity of a material can be measured with a sensor for redox (reduction oxidation) potential. probes have been designed to measure redox potential, ph and conductivity. These three parameters are major variables of chemical equilibrium for inorganic substances. The sensors are typically mounted inside the cone and a sample is drawn into a measuring cell located a short distance behind the cone. The measurements are made under a nitrogen atmosphere to reduce the exchange of atmospheric oxygen with dissolved gases from ground water. A slight excess pressure of nitrogen is used during penetration of the probe to stop the flow of liquid into a small (approximately 15ml) measuring cell. The nitrogen is supplied from a gas cylinder at the surface. A stainless steel porous filter is cleaned by de-mineralized water, which is also used to clean the sensors and check the calibration. The 40
49 water is pushed out by an excess nitrogen pressure. A pressure sensor is also included to monitor the flow of liquid into the measuring cell and to estimate the hydraulic conductivity of the surrounding soil. Olie et al. (1992) showed that the measurement of redox potential, ph and electrical conductivity enabled the monitoring of in-situ sanitation, designed to dissolve a floating layer of versatic acid with infiltration of hydroxide solution beneath a storage tank at a petrochemical plant in the Netherlands. Redox potential can also be used to monitor conditions during bio-remediation. Further details of devices that sample the surrounding pore liquid or vapor are given in a later section. Radio-isotope Gamma and neutron sources and sensors have been added to cone penetrometers in the past in an effort to measure in-situ density and moisture content. However, these devices have not become popular because they contained active radiation sources which can present significant problems if the probes should become lost in the ground and require expensive recovery. Passive gamma-ray sensors have been added to the in an effort to detect radioactive contaminants. A variety of different passive sensors are available, the selection of the appropriate sensor is based on efficiency, range of gamma-ray energies expected, temperature dependence of the sensor and sensor ruggedness. The application of gamma-ray sensors is clearly limited to environments where specific gamma-ray emitting contaminants are present. Fluorescence Fluorescence is a property of many aromatic hydrocarbons where absorbed light stimulates the release of photons (light) of a longer wavelength. Fluorescence can be used to detect small amounts of polyaromatic hydrocarbons (PAH) in soil. The first laser induced fluorescence (LIF) system was developed by the U.S. Military and was called a Site Characterization and Analysis Penetrometer System (SCAPS). This system was later licensed to the private sector, modified and called a Rapid Optical Screening Tool (ROST). Updated versions have been developed of fluorescence devices 41
50 that can be added to standard equipment (e.g. UVOST). All fluorescence devices operate in the ultra violet range of wavelengths. Some use a surface laser for the excitation light and deliver the light through a fibre optic cable (ROST and UVOST), whereas others use a small downhole ultra violet light source (UVIF). The fluorescence of PAHs has both a spectral and temporal component. Environmental samples typically contain several different PAHs along with other fluorophores, and the PAH fluorescence spectra overlap to form broad featureless spectral and temporal emission (compared to pure PAH spectra). If the temporal decay waveforms (intensity versus time) are recorded across the entire spectrum the resulting wavelength-timeintensity matrix can describe the fluorescence emission completely. Typically, the ultra violet light exits trough a small (sapphire) window in the side of the probe. As the probe is advanced, the soil is exposed to the excitation light. If fluorescent compounds exist (i.e. PAH s), fluorescence light is emitted and the intensity is measured. Some devices measure the fluorescence by transmitting the signal light via a fiber back up the probe to a data acquisition system at the surface (e.g. ROST, UVOST). Others measure the intensity via a small photomultiplier tube in the probe and avoid the use of fiber optic cables (UVIF). Some systems measure only the intensity of fluorescence at one wavelength of excitation and another for emission (e.g. UVIF), whereas others measure the intensity of fluorescence over a range of emission wavelengths (e.g. UVOST). Results are typically displayed as some form of intensity versus depth profile. With a system that has the capability to measure fluorescence emission over a range of wavelengths, a waveform can also be displayed at selected depths that can assist in identifying the contaminant present at that depth. A schematic of the LIF screening concept is shown in Figure

51 Figure 25 Schematic of LIF screening concept (courtesy of Dakota Technologies Inc) 43
52 Common fuel contaminants, such as heating oil, jet fuels, gasoline and diesel fuel can exhibit strong fluorescence signatures with the degree of fluorescence depending on the excitation wavelength. However, common chemical contaminants such as chlorinated hydrocarbons (e.g. TCE, PCE) do not fluoresce and are generally not suitable for the fluorescence technique. A list of contaminants that are suitable or unsuitable for the UVOST system is shown in Table 7 below. Table 8 lists false positives/negatives that may elicit a response from the UVOST system. HYDROCARBONS DETECTED WITH UVOST Gasoline Diesel Jet (Kerosene) Motor Oil Cutting fluids Hydraulic fluids Crude Oil HYDROCARBONS RARELY DETECTED USING UVOST Extremely weathered gasoline Coal tar Creosote Bunker Oil Polychlorinated bi-phenols (PCB s) Chlorinated solvent DNAPL Dissolved phase (aqueous) PAH s Table 7 Suitable/Unsuitable contaminants for UVOST system POTENTIAL FALSE POSITIVES (fluorescence observed) Sea-shells (weak-medium) Paper (medium-strong depending on color) Peat/meadow mat (weak) Calcite/calcareous sands (weak) Tree roots (weak-medium) Sewer lines (medium-strong) POTENTIAL FALSE NEGATIVES (do not fluoresce) Extremely weathered fuels (especially gasoline) Aviation gasoline (weak) Coal tars (most) Creosotes (most) Dry PAHs such as aqueous phase, lamp black, purifier chips Most chlorinated solvents Benzene, toluene, zylenes (relatively pure) Table 8 False positives/negatives that may elicit a response from the UVOST system 44

53 The intensity of fluorescence is strongly dependent on soil type, with sands having a stronger signal for a given concentration than clayey soils. The calibration and detection limits of fluorescence in soils are complicated by soil type, soil grain size effects, natural organic compounds and the influence of time on the contaminant degradation. Concerns also exist over long term durability and maintenance of the fiber optic cable when used to transmit the signals between the probe and data acquisition system. Research (Van Ree and Olie, 1993) has shown that the soil effectively cleans the window on the surface of the cone and that the displacement (smearing) of the detected layer does not exceed 5 cm (2 inches). An example UVIF profile is shown in Figure 26 and a schematic of a UVOST system is shown in Figure 27. Figure 26 Example UVIF profile at a creosote contaminated site 45

54 Figure 27 Schematic of UVOST system 46
55 Membrane Interface Probe (MIP) A relatively recent advance in the detection of volatile organic compounds (VOCs) in soil is the membrane interface probe (MIP). The MIP can be pushed into soil using standard direct push equipment or attached behind a. A schematic of the MIP probe is shown in Figure 28. The probe has a small diameter (6.35mm) semi-permeable membrane comprised of a thin film polymer impregnated onto a stainless steel screen for support. The membrane is placed in a heater block attached to the probe. The heater block is thicker along the leading edge to protect the membrane during penetration. The block is heated to about 100 to 120 degrees C to accelerate diffusion of VOCs through the membrane. Diffusion occurs because of a concentration gradient between the contaminated soil and the clean carrier gas (nitrogen) behind the membrane. A constant flow rate of about 35 to 45 ml/min sweeps behind the membrane and carries contaminates to the gas phase detectors in the data acquisition system at the surface. Travel time from the membrane to the surface detectors depends on the depth of probe and flow rate but is typically around 30 to 40 seconds. The probe is pushed into the ground at a rate of about 1 foot (30cm) per minute and collects about 20 data points every 1 foot (30cm). After each 1 foot (30cm), penetration is paused 30 to 60 seconds to reheat the membrane, since heat is lost during penetration. A range of gas detectors can be used with the most common being photoionization detector (PID), electron capture detector (ECD) and a flame ionization detector (FID). Each detector is designed for sensitivity to a group or type of contaminate. The ECD is used for chlorinated (TCE, PCE) contaminate detection, PID is best for aromatic hydrocarbons (BTEX compounds) and the FID is best for straight chained hydrocarbons (methane, butane). These detectors may be used in series with the least destructive first. The detectors must be low dead volume gas chromatography detectors and must be heated to avoid condensation of any water vapor that crosses the membrane. These detectors provide a qualitative evaluation of contaminates. The MIP can also be used with a field portable Gas Chromatograph Mass Spectrometer (GC-MS) to obtain a more quantitative analysis. Typically the detector signals are recorded with time and the signals presented versus depth. 47

56 When the MIP is pushed using standard direct push equipment, it is often combined with electrical conductivity measurements to provide a qualitative profile of soil stratigraphy. When the MIP is combined with the it provides more superior profile of soil stratigraphy along with the MIP data. Figure 28 Schematic of MIP system (courtesy Geoprobe Inc.) Hydraulic Profiling Test (HPT) As previously discussed, the includes the measurement of pore water pressure during penetration and during pauses in penetration (dissipation test). However, the accuracy and usefulness of the pore water pressure measurement is dependent on the soil and saturation of the pore pressure sensor. Below the water table, where the soil is saturated, the pore pressure measurements provide useful information regarding the behavior of the soil as well as equilibrium water pressure. pore pressure measurements above the water table have limited usefulness because the soil is typically unsaturated. 48
57 Recently, the concept of injecting water out of a small porous element on the side of the cone (usually above the friction sleeve) has resulted in a Hydraulic Profiling Test (HPT). Water is injected at a slow rate of about 250mL/min and the flow pressure recorded with depth. The flow pressure is related to the capacity of the soil around the cone to accept the flow of water, i.e. related to the hydraulic conductivity of the soil adjacent to the probe. In fine-grained soils the flow pressure is large, whereas in coarsegrained soils the flow pressure is low. The advantage of the HPT is that the resulting flow pressure profile can be obtained both above and below the water table, resulting in a continuous profile that can provide an indication of hydraulic conductivity with depth. The HPT is often combined with electrical conductivity (EC) measurements to provide a continuous profile of both EC and flow pressure. Since EC can be influenced by clay content, the combined profiles can provide an indication of grain-size and hydraulic conductivity above and below the water table. Figure 29 shows an example of a HPT flow pressure profile with EC. Figure 29 Example HPT profile (courtesy Geoprobe Inc.) 49


58 Vision Cone Several downhole video imaging systems have been developed for probes. These systems use miniature video cameras with magnification and focusing systems integrated into the probe to obtain images of soil. Lightemitting diodes provide illumination. The signal from the camera is sent to the surface where it can be viewed in real-time on a video monitor, recorded or digitized for further analysis. With 100x magnification, objects as small as 20 micrometers can be resolved on a standard monitor. Algorithms have been developed to classify soils electronically from the video image. Figures 30 and 31 show vision cone equipment and image of coal tar contamination, respectively. Figure 30 Example Vision Cone (courtesy P.Mayne.) Figure 31 Example image from vision cone of coal tar contamination 50
59 Sampling Devices The cone penetrometers described in the previous section are primarily screening devices that log the stratigraphic profile for geotechnical and chemical measurements. Based on these measurements it is often possible to identify potentially critical zones or regions that may require more selective testing to measure or monitor specific contaminants. Typically, the results from a screening investigation are used to develop a specific sampling and/or monitoring program. A wide range of samplers have been developed for use with direct push techniques for the sampling of vapors, liquids and solids. Samplers are designed for either one-time samples or as monitoring wells. One-time samplers are pushed to a desired depth and a sample obtained, then the probe is either retracted or pushed to a greater depth for further sampling before removal. Monitoring well samplers are installed and samples retrieved over a period of time before the well is ultimately removed. Small diameter monitoring wells are described in a later section. Liquid (water) Samplers The most common direct-push, discrete depth, in-situ water sampler is the Hydropunch. To a lesser extent, the BAT Enviroprobe, Simulprobe and Waterloo Profiler are also used. The Hydropunch and its variations is a simple sampling tool that is pushed to the desired depth and the push rods withdrawn to expose the filter screen. Figure 32 shows a schematic of a typical Hydropunch system. The filter screen can be made from a range of materials (PVC, stainless steel) although PVC is the most common. Screened intervals can vary in length from 4 inches to 5 feet (100mm to 1500mm) depending on ground conditions, required sample depth, contaminant type and hydraulic conductivity of surrounding material. A small diameter sampler (bailer) is lowered through the hollow push rods and body of the sampler to collect a liquid sample. A peristaltic pump can also be used to pump larger volumes of non-volatile liquids to the surface. This type of push-in liquid sampler is very common, simple to use and can produce large sample volumes. However, samples are considered less discrete in depth 51

60 than other methods, due to the longer Hydropunch screen intervals typically used. The hydropunch-type method can also be modified to install more permanent monitoring well installations. Prepacked well screens and grout seals can be used with hydropunch-type wells for construction of monitoring wells. Figure 32 Schematic of a Hydropunch system 52
61 The BAT Enviroprobe consists of three basic components: 1. A sealed filter tip with retractable sleeve attached to the push rods. 2. Evacuated and sterilized glass sample vials, enclosed in a housing and lowered to the filter tip via a wireline system. 3. A disposable, double-ended hypodermic needle which makes a hydraulic connection with the pore fluid by puncturing the selfsealing flexible septum in the filter tip. The filling rate of the sample vials can be monitored using a pore pressure transducer attached to the vial. The monitoring shows when the fluid infiltration is complete, assuring that pressure inside the vial is equal to the in-situ fluid pressure. These measurements can also be used to estimate the hydraulic conductivity of the surrounding material, as shown in Figure 33. Various modified versions of this concept are now in use for ground water sampling. The system is most applicable for retrieving water samples where limited volumes are sufficient (< 150 ml). The small filter size allows for discrete sampling intervals, but can create longer sampling times in less permeable materials. The protective sleeve and fine filter screen produces water samples with low turbidity, however, sometimes the needle can become blocked with fine material passing through the filter resulting in incomplete filling of the vial. Samplers have also been developed that allow simultaneous sampling of either soil/water or soil/vapor (e.g. SimulProbe). Either before or after a soil sample is obtained by pushing the sampler into the soil, the probe is retracted about 2 inches (50mm) to expose a screened port for either water or vapor sampling. A nitrogen or helium pressurized canister is used and the back-pressure released to allow water/vapor sampling. The fluid sample rises hydrostatically through a longitudinal pathway around the soil core chamber. The pressurized canister maintains any VOC s in solution. Figure 34 shows a soil-water SimulProbe. 53

62 Figure 33 Schematic of BAT sampler with pressure transducer to monitor sampling 54


63 Figure 34 Soil-water SimulProbe (courtesy of BESST Inc.) The Waterloo Profiler allows multiple groundwater samples in a single push. Deionized water is injected out the sampling ports during penetration to prevent clogging and can be monitored to estimate hydraulic conductivity. Liquid samples are taken at discreet depths using a peristaltic pump. The use of the peristaltic pump limits the total depth of sampling. Figure 35 shows a photograph of a Waterloo Profiler probe with several sampling ports. Figure 35 Waterloo profiler probe showing several sampling ports 55

64 Vapor Samplers Vapor (gas) samples can be obtained in a manner similar to that described above for liquid samples. The most common direct-push, discrete depth, in-situ gas sampler is the hydropunch-type sampler. The sampler is pushed to the required depth, the filter element exposed and a vacuum applied to draw a vapor sample to the surface. The volume of gas can be monitored using special monitoring equipment and typical sample containers are gas tight syringes and glass or steel sampling vessels. Special disposable plastic tubing is used to draw the sample to the surface. Vapor sampling modules have also been added to cone penetrometers to allow sampling during a. The sampling module is typically located a short distance behind the cone. Samples can be taken during short pauses in the penetration. Minimizing cross-contamination for subsequent samples within one vertical sounding requires either a two line sampling design for purging of the vapor collection lines between samples or a single line system with nitrogen or argon gas purging. A small positive internal gas pressure can stop the inflow of gases during the penetration process. Figure 35 illustrates typical post-run (hydropunch-type) and inline vapor sampling devices. Special care is required to purge the sample tubes and store the samples. Figure 35 Typical (one-time) Vapor sampling devices 56

65 Solid Samplers A variety of push-in discrete depth soil (solid) samplers are available. Most are based on designs similar to the original Gouda or MOSTAP soil samplers from the Netherlands. The samplers are pushed to the required depth in a closed position. The Gouda type samplers have an inner cone tip that is retracted to the locked position leaving a hollow sampler with small diameter (25mm/1 inch) stainless steel or brass sample tubes. The hollow sampler is then pushed to collect a sample. The filled sampler and push rods are then retrieved to the ground surface. The MOSTAP type samplers contain a wire to fix the position of the inner cone tip before pushing to obtain a sample. Modifications have also been made to include a wireline system so that soil samples can be retrieved at multiple depths rather than retrieving and re-deploying the sampler and rods at each interval. The wireline systems tend to work better in soft soils. Figure 36 shows a schematic of typical (Gouda-type) -based soil sampler. Figure 36 Schematic of -based soil sampler 57

66 Continuous soil samplers are also available that can be installed using either equipment or other direct push equipment (e.g. Geoprobe). Single and dual tube continuous soil samplers are available. The dual tube configuration is more rapid because the outer tube remains in place while the inner tube is removed to extract the sample. Sample size is typically 2 inch (50mm) diameter and up to 5ft (1.5m) in length. Figure 37 shows a schematic of a single-tube continuous soil sampler. Figure 37 Schematic of single-tube continuous soil sampler (courtesy of Geoprobe Inc.) 58

67 Small Diameter Wells & Piezometers and direct-push equipment can be an effective means of installing small diameter wells, stand-pipe piezometers and electric piezometers. These techniques generate no soil cuttings and the continuous nature of the data, combined with associated screening sensors, provide valuable information to determine screen intervals and depths for small diameter wells. Wells are typically installed in small 2 inch (50 mm) diameter holes with or other direct-push equipment. The small annular space necessitates the use of pre-packed screens and seals, as illustrated in Figure 38. Figure 38 Schematic of direct-push small diameter temporary well with pre-packed screen and seal 59

68 Similar soil gas sampling wells can be installed. Soil gas wells typically have double woven stainless steel wire screens that can be inserted down the push-rods and anchored at a desired depth. The screen and sampling tube can be installed and rotated to attach to the anchor point used during driving and then the push-rods removed. Screens are available in a variety of lengths. Continuous Multichannel Tubing (CMT) can provide groundwater sampling and measurement of hydraulic head at multiple depths within a single installation. High density polyethylene (HDPE) tubing can be installed to multiple depths using direct push techniques in soft ground or through boreholes in stiff ground. The tubing has an outside diameter of about 1.7 inches (43 mm) and can come in either 3 or 7 port configurations. Pre-packed screens and seals make installation possible using direct-push techniques. Figure 39 shows a schematic of a CMT well. Figure 39 Schematic of a CMT well (courtesy of Solinst Inc.) 60
69 FLUTe Liners Flexible Liner Underground Technologies Inc. (FLUTe) produce a Ribbon NAPL System (commonly called FLUTe liners) for detecting NAPL contaminants. A hydrophobic liner is impregnated with a powdered oil dye which dissolves on contact with a NAPL and leaves a stain on the liner. The liner is placed within the push rods and inflated against the soil using water as the push rods are removed. After a wait of about 1 hour to allow reaction between any NAPL contaminants and the liner, the liner is then retrieved (peeled inside out) from the hole using an internal tubing attached to the bottom of the liner. FLUTe liners provide a qualitative evaluation for NAPL contamination and are usually used in combination with and other sensors. Figure 40 shows a schematic of a FLUTe liner installation. Figure 42 Schematic of FLUTe liner installation for NAPL detection (courtesy of FLUTe Inc.) 61
70 Sealing and Decontamination The hole produced by a push-in penetrometer may require sealing, usually with a special grout. The grouting can be carried out either after the push rods are removed using re-entry techniques (post-grouting) or during the removal process (retraction-grouting) or during the penetration process. For post-grouting, the hole can be grouted by either surface pouring or using either a flexible or rigid tremie tube. Post-grouting using surface pouring is typically only possible in stiff clays and moist sand above the water table where the small diameter hole will stay open after retraction of the push-rods. Post-grouting with a rigid tube is carried out after rod removal using special grout push rods with a disposable tip. The hole is grouted from the bottom up as the grout rod/tremie tube is pulled from the ground, as illustrated in Figure 43. The grout rods generally follow the previous push hole since the rods follow the path of least resistance. Postgrouting is typically the least expensive and easiest technique. Retraction-grouting allows for grouting during push-rod retraction. The grout can be delivered to the probe through a small diameter grout tube pre-threaded through the push rods. The grout can exit the probe through either a sacrificial cone tip or through ports above the cone located on the friction reducer. A special high torque pump is used to pump the grout. Figure 44 illustrates a retraction-grouting technique. Retraction-grouting is usually expensive and often requires some probe re-design. Grouting during the advance of the push-rods can provide a seal during penetration of the cone, i.e. while the test proceeds. Grout is contained in an over-size pipe installed and sealed in the ground around the cone hole (typically using a single flight of hollow-stem auger). The grout container can be either open or pressurized to aid in the grout flow, as illustrated in Figure 45. Grouting during probe advance is often simple, inexpensive and allows greater control. 62
71 Figure 43 Post-grouting using re-entry with rigid rods and sacrificial tip (Lutenegger and DeGroot, 1995) Figure 44 Example of a retraction-grouting technique (Lutenegger and DeGroot, 1995) 63
72 Figure 45 Example of grouting during using gravity feed casing (Lutenegger and DeGroot, 1995) To clean the push rods and equipment after a sounding all downhole equipment can be pulled through a rod-washing, decontamination chamber. The chamber can be mounted at the base of the hydraulic thrust cylinders. The push rods are then steam cleaned as they pass through the chamber, before being handled by field personnel. Rubber wipers at the entry and exit of the chamber control water leakage. The waste water is collected for later disposal. Many of the special truck mounted systems also include stainless steel sinks for decontamination of samplers and penetrometers. 64
73 Summary Summary To better characterize potentially environmentally hazardous sites, improved investigation devices and methods have been developed using technology. The gathers high quality in-situ geotechnical information in a rapid cost effective manner. Sensors have been adapted to probes to enable mapping of subsurface contamination in sufficient detail to reduce the quantity of more costly subsurface sampling and monitoring points. Traditional drilling and sampling methods, when compared to methods, have high waste management costs from handling and disposal of contaminated materials. Also, methods minimize exposure of field personnel to hazardous substances. Significant developments have been made in recent years to improve geoenvironmental site characterization using technology. Sensors have been added to the cone penetrometer to enhance the logging and screening capabilities for both mechanical and chemical measurements. Recent advances in 3-D computer visualization techniques have significantly improved data presentation with additional sensors and discrete sampling. Figure 46 illustrates a 3-D computer visualization technique. A synergistic approach to 3-D site characterization can also be achieved by utilizing a combination of surface geophysical technology and directpush technology. By taking advantage of the synergy between the two, a significant improvement can be achieved in the interpretation of the geophysical data. 65

74 Summary Figure 46 3-D visualization techniques using and MIP results (courtesy of Columbia Technologies Inc.) 66
75 Appendix A Appendix A Estimating Geotechnical Soil Parameters 67
76 Appendix A Equivalent SPT N 60 Profiles The Standard Penetration Test (SPT) is one of the most commonly used insitu tests in many parts of the world, especially North America. Despite continued efforts to standardize the SPT procedure and equipment there are still problems associated with its repeatability and reliability. However, many geotechnical engineers have developed considerable experience with design methods based on local SPT correlations. When these engineers are first introduced to the they initially prefer to see results in the form of equivalent SPT N-values. Hence, there is a need for reliable /SPT correlations so that data can be used in existing SPT-based design approaches. There are many factors affecting the SPT results, such as borehole preparation and size, sampler details, rod length and energy efficiency of the hammer-anvil-operator system. One of the most significant factors is the energy efficiency of the SPT system. This is normally expressed in terms of the rod energy ratio (ERr). An energy ratio of about 60% has generally been accepted as the reference value which represents the approximate historical average SPT energy. A number of studies have been presented over the years to relate the SPT N value to the cone penetration resistance, q c. Robertson et al. (1983) reviewed these correlations and presented the relationship shown in Figure A1 relating the ratio (q c /p a )/N 60 with mean grain size, D 50 (varying between 0.001mm to 1mm). Values of q c are made dimensionless when dividing by the atmospheric pressure (p a ) in the same units as q c. It is observed that the ratio increases with increasing grain size. The values of N used by Robertson et al. correspond to an average energy ratio of about 60%. Hence, the ratio applies to N 60, as shown on Figure A1. Other studies have linked the ratio between the and SPT with fines content for sandy soils. 68
77 Appendix A Figure A1 -SPT correlations with mean grain size (Robertson et al., 1983) The above correlations require the soil grain size information to determine the mean grain size (or fines content). Grain characteristics can be estimated directly from results using soil classification or soil behavior type (SBT) charts. The SBT charts show a clear trend of increasing friction ratio with increasing fines content and decreasing grain size. Robertson et al. (1986) suggested (q c /p a )/N 60 ratios for each soil behavior type zone using the non-normalized chart. The suggested ratio for each soil behavior type is given in Table A1. These values provide a reasonable estimate of SPT N 60 values from data. For simplicity the above correlations are given in terms of q c. For fine grained soft soils the correlations should be applied to total cone resistance, q t. Note that in sandy soils q c = q t. One disadvantage of this simplified approach is the somewhat discontinuous nature of the conversion. Often a soil will have data that crosses different soil behavior type zones and hence produces discontinuous changes in predicted SPT N 60 values. 69
78 Appendix A Zone Soil Behavior Type ( q / p ) 1 sensitive fine grained 2 2 organic soils - peats 1 3 clay 1 4 silty clay to clay clayey silt to silty clay 2 6 sandy silt to clayey silt silty sand to sandy silt 3 8 sand to silty sand 4 9 sand 5 10 dense sand to gravelly 6 sand 11 very stiff fine grained 1 c N 60 a Table A1 Suggested (q c /p a )/N 60 ratios. Jefferies and Davies (1993) suggested the application of a soil behavior type index, I c to link with the -SPT correlation. The soil behavior type index, I c, can be combined with the -SPT ratios to give the following relationship: (q t N /p 60 a ) = 8.5 I c Jefferies and Davies (1993) suggested that the above approach can provide a better estimate of the SPT N-values than the actual SPT test due to the poor repeatability of the SPT. The above relationship applies to I c < In very loose soils ((N 1 ) 60 < 10) the weight of the rods and hammer can dominate the SPT penetration resistance and produce very low N-values, which can result in high (q c /p a )/N 60 ratios due to the low SPT N-values measured. 70
79 Appendix A Undrained Shear Strength (s u ) - Clays No single value of undrained shear strength exists, since the undrained response of soil depends on the direction of loading, soil anisotropy, strain rate, and stress history. Typically the undrained strength in tri-axial compression is larger than in simple shear which is larger than tri-axial extension (s utc > s uss > s ute ). The value of s u to be used in analysis therefore depends on the design problem. In general, the simple shear direction of loading often represents the average undrained strength. Since anisotropy and strain rate will inevitably influence the results of all insitu tests, their interpretation will necessarily require some empirical content to account for these factors, as well as possible effects of sample disturbance. Recent theoretical solutions have provided some valuable insight into the form of the relationship between cone resistance and s u. All theories result in a relationship between cone resistance and s u of the form: s u = q t σ N kt v Typically N kt varies from 10 to 20, with 14 as an average. N kt tends to increase with increasing plasticity and decrease with increasing soil sensitivity. Lunne et al., 1997 showed that N kt varies with B q, where N kt decreases as B q increases, when B q ~ 1.0 (i.e. sensitive clay), N kt can be as low as 6. For deposits where little experience is available, estimate s u using the total cone resistance (q t ) and preliminary cone factor values (N kt ) from For a more conservative estimate, select a value close to the upper limit. In very soft clays where there may be some uncertainty with the accuracy in q t, estimates of s u can be made from the excess pore pressure (Δu) measured behind the cone (u 2 ) using the following: s u = Δu N Δu 71
80 Appendix A Where N Δu varies from 4 to 8. For a more conservative estimate, select a value close to the upper limit. Note that N Δu is linked to N kt, via B q, where: N Δu = B q N kt If previous experience is available in the same deposit, the values suggested above should be adjusted to reflect this experience. For larger, moderate to high risk projects, where high quality field and laboratory data may be available, site specific correlations should be developed based on appropriate and reliable values of s u. Soil Sensitivity The sensitivity (S t ) of clay is defined as the ratio of undisturbed undrained shear strength to totally remolded undrained shear strength. The remolded undrained shear strength can be assumed equal to the sleeve friction stress, f s. Therefore, the sensitivity of a clay can be estimated by calculating the peak s u from either site specific or general correlations with q t or Δu and s u(remolded) from f s. S t = s s u u(remolded) = q t σ N kt v (1 / f s ) For relatively sensitive clays (S t > 10), the value of f s can be very low with inherent difficulties in accuracy. Hence, the estimate of sensitivity should be used as a guide only. 72
81 Appendix A Stress History - Overconsolidation Ratio (OCR) Overconsolidation ratio (OCR) is defined as the ratio of the maximum past effective consolidation stress and the present effective overburden stress: σ' p OCR = σ' For mechanically overconsolidated soils where the only change has been the removal of overburden stress, this definition is appropriate. However, for cemented and/or aged soils the OCR may represent the ratio of the yield stress and the present effective overburden stress. The yield stress will depend on the direction and type of loading. For overconsolidated clays: (s u /σ' vo ) OC = (s u /σ' vo ) NC (OCR) 0.8 (s u /σ' vo ) DSS = 0.22 (OCR) 0.8 (for φ' = 26 o ) vo The easiest method to estimate OCR in cohesive soils is: q t σ vo OCR = k = k Q t σ' vo or σ' p = k (q t σ vo ) An average value of k = 0.33 can be assumed, with an expected range of 0.2 to 0.5. Higher values of k are recommended in aged, heavily overconsolidated clays. If previous experience is available in the same deposit, the values of k should be adjusted to reflect this experience and to provide a more reliable profile of OCR. For larger, moderate to high-risk projects, where additional high quality field and laboratory data may be available, site-specific correlations should be developed based on consistent and relevant values of OCR. The estimated OCR is influenced by soil sensitivity, pre-consolidation mechanism, soil type and local heterogeneity. 73
82 Appendix A In-Situ Stress Ratio (K o ) - Clays There is no reliable method to determine K o in clays from the. However, an estimate can be made based on an estimate of OCR, as shown in Figure A2. Kulhawy and Mayne (1990) suggested a similar approach, using: K o = 0.1 q t σ σ' vo vo These approaches are generally limited to mechanically overconsolidated soils. Considerable scatter exists in the database used for these correlations and therefore they must be considered only as a guide. Figure A2 OCR and K o from s u /σ' vo and Plasticity Index, I p (after Andresen et al., 1979) 74
83 Appendix A Friction Angle - Sands The shear strength of uncemented, cohesionless soil is usually expressed in terms of a peak secant friction angle, φ'. Numerous studies have been published for assessing φ' from the in clean sands and basically the methods fall into one of three categories: Bearing capacity theory Cavity expansion theory Empirical, based on calibration chamber tests Significant advances have been made in the development of theories to model the cone penetration process in sands (Yu and Mitchell, 1998). Cavity expansion models show the most promise since they are relatively simple and can incorporate many of the important features of soil response. However, empirical correlations based on calibration chamber test results are still the most commonly used. A review of calibration chamber test results was made by Robertson and Campanella (1983) to compare cone resistance to measured peak secant friction angle. The peak secant friction angle was measured in drained triaxial compression tests performed at the confining stress approximately equal to the horizontal stresses in the calibration chamber before the. The recommended correlation for uncemented, unaged, moderately compressible, predominately quartz sands proposed by Robertson and Campanella (1983) is shown in Figure A3. For sands of high compressibility (i.e. carbonate sands or sands with high mica content), the chart will tend to predict low friction angles. Kulhawy and Mayne (1990) suggested an alternate relationship for clean, rounded, uncemented quartz sands: φ' = log (q c1n ) 75

84 Appendix A Note: 0.1MPa = 100 kpa = 1 bar 1 tsf 1 kg/cm 2 tan φ' = q log σ' c vo Figure A3 Friction angle, φ', from in uncemented, silica sand ( Robertson and Campanella, 1983) 76
85 Appendix A Relative density (D r ) - Sands For cohesionless soils, the density, or more commonly, the relative density or density index, is often used as an intermediate soil parameter. Relative density, D r, or density index, I D, is defined as: where: I D = D r = e e max max e e min e max and e min are the maximum and minimum void ratios and e is the in-situ void ratio. The problems associated with the determination of e max and e min are well known. Also, research has shown that the stress strain and strength behavior of cohesionless soils is too complicated to be represented by only the relative density of the soil. However, for many years relative density has been used by engineers as a parameter to describe sand deposits. Research using large calibration chambers has provided numerous correlations between penetration resistance and relative density for clean, predominantly quartz sands. The calibration chamber studies have shown that the resistance is controlled by sand density, in-situ vertical and horizontal effective stress and sand compressibility. Sand compressibility is controlled by grain characteristics, such as grain size, shape and mineralogy. Angular sands tend to be more compressible than rounded sands as do sands with high mica and/or carbonate compared with clean quartz sands. More compressible sands give a lower penetration resistance for a given relative density then less compressible sands. Based on extensive calibration chamber testing on Ticino sand, Baldi et al. (1986) recommended a formula to estimate relative density from q c. A modified version of this formula, to obtain D r from q c1 is as follows: D r = 1 C q ln c1 2 C0 77
86 Appendix A where: C 0 and C 2 are soil constants σ' vo = effective vertical stress q c1 = (q c / p a ) / (σ' vo /p a ) 0.5 = normalized resistance, corrected for overburden pressure (more recently defined as q c1n and using net cone resistance, q n ) p a = reference pressure of 1 tsf (100kPa), in same units as q c and σ' vo q c = cone penetration resistance (more correctly, q t ) For moderately compressible, normally consolidated, unaged and uncemented, predominantly quartz sands the constants are: C o = 15.7 and C 2 = Kulhawy and Mayne (1990) suggested a simpler formula for estimating relative density: D r 2 = q c1 305Q Q C OCR Q A where: q c1 and p a are as defined above Q C = Compressibility factor ranges from 0.91 (low compress.) to 1.09 (high compress.) Q OCR = Overconsolidation factor = OCR 0.18 Q A = Aging factor = log(t/100) A constant of 350 is more reasonable for medium, clean, uncemented, unaged quartz sands that are about 1,000 years old. The constant is closer to 300 for fine sands and closer to 400 for coarse sands. The constant increases with age and increases significantly when age exceeds 10,000 years. The equation can then be simplified to: D r 2 = q c1 /
 are sensitive to stress and strain history, aging and sand mineralogy.")
87 Appendix A Stiffness and Modulus - Sands data can be used to estimate modulus in cohesionless soils for subsequent use in elastic or semi-empirical settlement prediction methods. However, correlations between q c and moduli (E) are sensitive to stress and strain history, aging and sand mineralogy. A useful guide for estimating Young's moduli for uncemented predominantly silica sands is given in Figure A4. The modulus has been defined as that mobilized at 0.1% strain. For more heavily loaded conditions (i.e. larger strain) the modulus would decrease. The results for NC sands are applicable for young recent fills with an age less than 10 years and the results for aged NC sands are applicable for natural sands with an age greater than 1,000 years. Figure A4 Evaluation of drained Young's modulus from for uncemented silica sands 79
88 Appendix A Consolidation Characteristics Flow and consolidation characteristics of a soil are normally expressed in terms of the coefficient of consolidation, c, and hydraulic conductivity, k. They are inter-linked through the formula: c = k M γ w where M is the constrained modulus relevant to the problem (i.e. unloading, reloading, virgin loading). The parameters c and k vary over many orders of magnitude and are some of the most difficult parameters to measure in geotechnical engineering. It is often considered that accuracy within one order of magnitude is acceptable. Due to soil anisotropy, both c and k have different values in the horizontal (c h, k h ) and vertical (c v, k v ) direction. The relevant design values depend on drainage and loading direction. Details on how to estimate k from soil classification charts are given in the previous section. The coefficient of consolidation can be estimated by measuring the dissipation or rate of decay of pore pressure with time after a stop in penetration. Many theoretical solutions have been developed for deriving the coefficient of consolidation from pore pressure dissipation data. The coefficient of consolidation should be interpreted at 50% dissipation, using the following formula: where: c = T t r o 2 T 50 = theoretical time factor t 50 = measured time for 50% dissipation r o = penetrometer radius 80
89 Appendix A It is clear from this formula that the dissipation time is inversely proportional to the radius of the probe. Hence, in soils of very low permeability, the time for dissipation can be decreased by using smaller probes. Robertson et al. (1992) reviewed dissipation data from around the world and compared the results with the leading theoretical solution by Teh and Houlsby (1991), as shown in Figure A5 (Teh and Houslby theory shown as solid lines for I r = 50 and 500). Figure A5 Average laboratory c h values and U results (Robertson et al., 1992) The review showed that the theoretical solution provided reasonable estimates of c h. The solution and data shown in Figure A5 apply to pore pressure sensors located just behind the cone tip (i.e. u 2 ). 81
90 Appendix A The ability to estimate c h from dissipation results is controlled by soil stress history, sensitivity, anisotropy, rigidity index (relative stiffness), fabric and structure. In overconsolidated soils, the pore pressure behind the cone tip can be low or negative, resulting in dissipation data that can initially rise before a decay to the equilibrium value. Care is required to ensure that the dissipation is continued to the correct equilibrium and not stopped prematurely after the initial rise. In these cases, the pore pressure sensor can be moved to the face of the cone or the t 50 time can be estimated using the maximum pore pressure as the initial value. Based on available experience, the dissipation method should provide estimates of c h to within +/ half an order of magnitude. However, the technique is repeatable and provides an accurate measure of changes in consolidation characteristics within a given soil profile. An approximate estimate of the coefficient of consolidation in the vertical direction can be obtained using the ratios of permeability in the horizontal and vertical direction given in the section on hydraulic conductivity, since: c v = c h k k v h Table 6 can be used to provide an estimate of the ratio of hydraulic conductivities. For short dissipations in sandy soils, the dissipation results can be plotted on a square-root time scale. The gradient of the initial straight line is m, where; c h = (m/m T ) 2 r 2 (I r ) 0.5 M T = 1.15 for u 2 position and 10 cm 2 cone (i.e. r = 1.78 cm). 82
91 Appendix A Constrained Modulus Consolidation settlements can be estimated using the 1-D Constrained Modulus, M, where; M = 1/ m v = δσ v / δε Where m v = equivalent oedometer coefficient of compressibility. Constrained modulus can be estimated from results using the following empirical relationship; M = α M q t Sangrelat (1970) suggested that α M varies with soil plasticity and natural water content for a wide range of fine grained soils and organic soils, although the data were based on q c. Meigh (1987) suggested that α M lies in the range 2 8, whereas Mayne (2001) suggested a general value of 8 based on net cone resistance. It is recommended to use an initial value of α M = 4, unless local experience and/or laboratory test results suggest higher values. Estimates of drained 1-D constrained modulus from undrained cone penetration will be approximate. Estimates can be improved with additional information about the soil, such as plasticity index and natural moisture content, where α M is lower for organic soils. Dielectric measurements during a can be used to measure in-situ moisture content in fine grained soils and hence improve the correlation with constrained modulus. The same relationship between constrained modulus and cone resistance applies to sandy soils, where a general value of α M = 4 applies to young, uncemented, quartz sands. Since, constrained modulus, M, is close to Young s modulus (E ) under drained loading, the value for α M varies with age and stress history (see Figure A4). 83
92 Main References Main References Lunne, T., Robertson, P.K., and Powell, J.J.M Cone penetration testing in geotechnical practice, E & FN Spon Routledge, 352 p, ISBN Jefferies, M.G. and Davies, M.P Estimation of SPT N values from the, ASTM. Robertson, P.K Soil classification using the cone penetration test. Canadian Geotechnical Journal, 27 (1), Robertson, P.K., Campanella, R.G. and Wightman, A SPT- Correlations, ASCE J. of Geotechnical Engineering 109(11): Baligh, M.M. and Levadoux, J.N Consolidation after undrained piezocone penetration, II: Interpretation, J. of Geotech. Engineering, ASCE, 112(7): Jamiolkowski, M., Ladd, C.C., Germaine, J.T. and Lancellotta, R New developments in field and laboratory testing of soils, State-of-theart report, Proceedings of the 11 th International Conference on Soil Mechanics and Foundation Engineering, San Francisco, 1, , Balkema. Robertson, P.K., Sully, J.P., Woeller, D.J., Lunne, T., Powell, J.J.M. and Gillespie, D.G Estimating coefficient of consolidation from piezocone tests, Canadian Geotechnical J., 29(4): Teh, C.I. and Houlsby, G.T An analytical study of the cone penetration test in clay, Geotechnique, 41(1): Olie, J.J., Van Ree, C.C.D.F., and Bremmer, C., In-Situ Measurement by Chemoprobe of Groundwater from In-Situ Sanitation of Versatic Acid Spill, Geotechnique 42, No. 1, pp

93
94
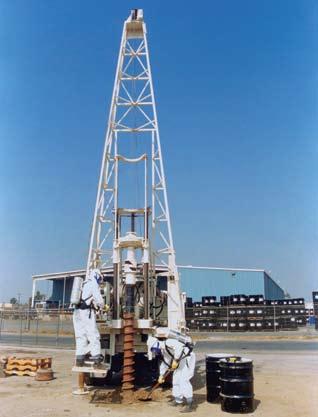
95
96

97
98

99
100
101 6 Feet 10 Feet COMMUNICATION CATV


102
Estimating in-situ soil permeability from CPT & CPTu
 Estimating in-situ soil permeability from CPT & CPTu P.K. Robertson Gregg Drilling & Testing Inc., Signal Hill, California, USA ABSTRACT: Engineers often want to estimate profiles of soil permeability
Estimation of in-situ water content, void ratio, dry unit weight and porosity using CPT for saturated sands
 Barounis, N. & Philpot, J. (217) Estimation of in-situ water content, void ratio, dry unit weight and porosity using CPT for saturated sands Proc. 2 th NZGS Geotechnical Symposium. Eds. GJ Alexander &
CPT Guide 5 th Edition. Cone Penetration Test (CPT) Quality control (QC) Gregg Drilling & Testing, Inc. Dr. Peter K. Robertson Webinar #
 Quality control (QC) Gregg Drilling & Testing, Inc. Dr. Peter K. Robertson Webinar #") Gregg Drilling & Testing, Inc. Site Investigation Experts Cone Penetration Test (CPT) Quality control (QC) Dr. Peter K. Robertson Webinar #10 2013 CPT Guide 5 th Edition Download FREE copy from: Robertson
Gregg Drilling & Testing, Inc. Site Investigation Experts Cone Penetration Test (CPT) Quality control (QC) Dr. Peter K. Robertson Webinar #10 2013 CPT Guide 5 th Edition Download FREE copy from: Robertson
Earth Mechanics, Inc. Geotechnical & Earthquake Engineering
 Earth Mechanics, Inc. Geotechnical & Earthquake Engineering TECHNICAL MEMORANDUM DATE: June 3, 2009 EMI PROJECT NO: 01-143 TO: COPY: FROM: SUBJECT: John Chun, P.E. / Port of Long Beach (POLB) Jorge Castillo
General Groundwater Concepts
 General Groundwater Concepts Hydrologic Cycle All water on the surface of the earth and underground are part of the hydrologic cycle (Figure 1), driven by natural processes that constantly transform water
ENGINEERING HYDROLOGY
 ENGINEERING HYDROLOGY Prof. Rajesh Bhagat Asst. Professor Civil Engineering Department Yeshwantrao Chavan College Of Engineering Nagpur B. E. (Civil Engg.) M. Tech. (Enviro. Engg.) GCOE, Amravati VNIT,
PE Exam Review - Geotechnical
 PE Exam Review - Geotechnical Resources and Visual Aids Item Page I. Glossary... 11 II. Parameters... 9 III. Equations....11 IV. Tables, Charts & Diagrams... 14 1. Module 1 - Soil Classification... 14
Atterberg limits Clay A Clay B. Liquid limit 44 % 55% Plastic limit 29% 35% Natural water content 30% 50%
 CE 6405 SOIL MECHANICS UNIT I INTRODUCTION Part A 1. Distinguish between Residual and Transported soil. 2. Give the relation between γ sat, G, γ w and e 3. A compacted sample of soil with a bulk unit weight
Introduction to CPT. Peter K. Robertson. Santiago, Chile. CPT in Geotechnical Practice. July, 2014
 Introduction to CPT Peter K. Robertson CPT in Geotechnical Practice Santiago, Chile July, 2014 Ground Investigation To investigate ground and groundwater conditions in and around site consistent with project
Groundwater 3/16/2010. GG22A: GEOSPHERE & HYDROSPHERE Hydrology
 GG22A: GEOSPHERE & HYDROSPHERE Hydrology Definitions Groundwater Subsurface water in soil or rock that is fully saturated. Aquifer Contains enough saturated material to yield significant quantities of
CE 240 Soil Mechanics & Foundations Lecture 4.3. Permeability I (Das, Ch. 6)
") CE 240 Soil Mechanics & Foundations Lecture 4.3 Permeability I (Das, Ch. 6) Outline of this Lecture 1. Permeability in Soils 2. Bernoulli s Equation 3. Darcy s Law 4. Hydraulic Conductivity 5. Hydraulic
CE 240 Soil Mechanics & Foundations Lecture 4.3 Permeability I (Das, Ch. 6) Outline of this Lecture 1. Permeability in Soils 2. Bernoulli s Equation 3. Darcy s Law 4. Hydraulic Conductivity 5. Hydraulic
Typical set up for Plate Load test assembly
 Major disadvantages of field tests are Laborious Time consuming Heavy equipment to be carried to field Short duration behavior Plate Load Test Sand Bags Platform for loading Dial Gauge Testing Plate Foundation
Compressibility of Soil. Chapter 11
 Compressibility of Soil Chapter 11 TOPICS INTRODUCTION ELASTIC SETTLEMENT Stress distribution in soil masses CONSOLIDATION SETTLEMENT Fundamentals of consolidation Calculation of 1-D Consolidation Settlement
GEOTECHNICAL INVESTIGATION PROPOSED OUTFALL LOCATION CITY OF MORGAN S POINT DRAINAGE HARRIS COUNTY, TEXAS REPORT NO
 GEOTECHNICAL INVESTIGATION PROPOSED OUTFALL LOCATION CITY OF MORGAN S POINT DRAINAGE HARRIS COUNTY, TEXAS REPORT NO. 1140198001 Reported to: SIRRUS ENGINEERS, INC. Houston, Texas Submitted by: GEOTEST
Estimating in-situ state parameter and friction angle in sandy soils from CPT
 Estimating in-situ state parameter and friction angle in sandy soils from CPT P.K. Robertson Gregg Drilling & Testing Inc., Signal Hill, California, USA ABSTRACT: The response of sandy soils at a constant
OUTLINE OF PRESENTATION
 GROUNDWATER?? OUTLINE OF PRESENTATION What is groundwater? Geologic investigation Definitions: aquifer and aquitard, unconfined and semi-confined Water level and interpretation of water level data Well
SOURCES OF WATER SUPPLY GROUND WATER HYDRAULICS
 SOURCES OF WATER SUPPLY GROUND WATER HYDRAULICS, Zerihun Alemayehu GROUNDWATER Groundwater takes 0.6% of the total water in the hydrosphere 0.31% of the total water in the hydrosphere has depth less than
SEMBODAI RUKMANI VARATHARAJAN ENGINEERING COLLEGE SEMBODAI BACHELOR OF ENGINEERING DEPARTMENT OF CIVIL ENGINEERING QUESTION BANK
 SEMBODAI RUKMANI VARATHARAJAN ENGINEERING COLLEGE SEMBODAI - 614809 BACHELOR OF ENGINEERING Sub.Code: CE6405 DEPARTMENT OF CIVIL ENGINEERING QUESTION BANK Branch/Year/SEM: CIVIL/II/ IV Sub.Name: Soil Mechanics
DESIGN PARAMETERS FOR MULTI-PHASE EXTRACTION SYSTEMS USING UNSATURATED AND SATURATED SOIL PROPERTIES
 DESIGN PARAMETERS FOR MULTI-PHASE EXTRACTION SYSTEMS USING UNSATURATED AND SATURATED SOIL PROPERTIES Todd White, M.Sc., P.Geol. and Douglas A. Sweeney, M.Sc., P.Eng. SEACOR Environmental Inc. INTRODUCTION
Code No: RR Set No. 1
 Code No: RR320101 Set No. 1 III B.Tech Supplimentary Examinations, Aug/Sep 2008 GEOTECHNICAL ENGINEERING (Civil Engineering) Time: 3 hours Max Marks: 80 Answer any FIVE Questions All Questions carry equal
WEEK 9 ACTIVITY. Lecture (3 hours) Self Assessment. 34 slides
 Self Assessment. 34 slides") WEEK 9 ACTIVITY Lecture (3 hours) 34 slides Self Assessment Site Investigation (ECG513) ARM - 2009 LEARNING OUTCOMES Week 9 : (3H) Coverage : Geophysical Methods, Permeability and Ground Stress measurement.
WEEK 9 ACTIVITY Lecture (3 hours) 34 slides Self Assessment Site Investigation (ECG513) ARM - 2009 LEARNING OUTCOMES Week 9 : (3H) Coverage : Geophysical Methods, Permeability and Ground Stress measurement.
Lecture 20: Groundwater Introduction
 Lecture 20: Groundwater Introduction Key Questions for Groundwater 1. What is an aquifer? 2. What is an unconfined aquifer? 3. What is groundwater recharge? 4. What is porosity? What determines the magnitude
Downloaded from Downloaded from /1
 PURWANCHAL UNIVERSITY VI SEMESTER FINAL EXAMINATION-2003 LEVEL : B. E. (Civil) SUBJECT: BEG359CI, Foundation Engineering. Full Marks: 80 TIME: 03:00 hrs Pass marks: 32 Candidates are required to give their
Inclusion Effect on Heterogeneity of Excess Pore Water Pressure Distribution in Composite Clay
 Inclusion Effect on Heterogeneity of Excess Pore Water Pressure Distribution in Composite Clay J. Jalili Payame Noor University, Iran M. K. Jafari & A. Shafiee International Institute of Earthquake Engineering
Lecture 2: Soil Properties and Groundwater Flow
 9621 Soil Remediation Engineering Lecture 2: Soil Properties and Groundwater Flow Spring 2012 Faculty of Engineering & Applied Science 1 2.1 Soil properties 2.1.1 What is soil? Each discipline defines
SITE INVESTIGATION Validation and Interpretation of data
 SITE INVESTIGATION Validation and Interpretation of data Dr. G.Venkatappa Rao The Impact 1 The Need To determine the type of foundation To assess bearing capacity/settlement Location of Ground water table,issues
Lecture Notes on Groundwater Hydrology. Part 1
 Lecture Notes on Groundwater Hydrology Part 1 1 1. Basic concepts and definitions 1.1 Aquifer, Aquitard, Aquiclude and Aquifuge Aquifer is a word produced from two Latin words: Aqua, which means water
Pump Station Excavation
 Pump Station Excavation SPONSORED BY THE KIEWIT CORPORATION A capstone project for the The Department of Civil & Environmental Engineering in The Ira A. Fulton College of Engineering and Technology Brigham
Time-Dependent Strength Behavior of Soil-Bentonite Slurry Wall Backfill
 Time-Dependent Strength Behavior of Soil-Bentonite Slurry Wall Backfill Jeffrey Evans 1, and Christopher Ryan 2 1 Bucknell University, Department of Civil and Environmental Engineering, Lewisburg, PA 17837
Groundwater Hydrology
 Groundwater Hydrology Þröstur Þorsteinsson Environment and Natural Resources, University of Iceland Why study groundwater? Important source of fresh water Large portion of the Earth s fresh water as groundwater
ENVIRONMENTAL GEOLOGY - GEOL 406/506
 ENVIRONMENTAL GEOLOGY - GEOL 406/506 Glossary of useful Terms: 1. Abiotic: not living. 2. A b s o r p t i o n: the penetration of atoms, ions, or molecules into the bulk mass of substrate. 3. Acclimation:
SPECIFICATION FOR PREFABRICATED VERTICAL DRAIN
 SPECIFICATION FOR PREFABRICATED VERTICAL DRAIN 1.0 GENERAL This work comprises of supply and installation of prefabricated vertical drains in accordance to the Specifications and Drawings. 2.0 MATERIALS
Subsurface Investigations PDCA Professor s Driven Pile Institute. Loren R. Anderson Utah State University June 25, 2015
 Subsurface Investigations PDCA Professor s Driven Pile Institute Loren R. Anderson Utah State University June 25, 2015 Ralph B. Peck (1962) Subsurface engineering is an art; soil mechanics is an engineering
2012 Soil Mechanics I and Exercises Final Examination
 2012 Soil Mechanics I and Exercises Final Examination 2013/1/22 (Tue) 13:00-15:00 Kyotsu 155 Kyotsu 1 Kyotsu 3 W2 Lecture room Attention: There are four questions and four answer sheets. Write down your
EXECUTIVE SUMMARY. 2. The effect of remediation on the distribution and mobility of both the LNAPL and water within the zone of interest.
 EXECUTIVE SUMMARY For many decades, the oil production industry has recognized that significant limitations exist to complete extraction of oil from geologic formations. Attempts to recover fuels and crude
COPYRIGHTED MATERIAL. Contents PART ONE: THEORY...1. Preface to the Third Edition xiii. About the Authors xv. Acknowledgements xvii
 Preface to the Third Edition xiii About the Authors xv Acknowledgements xvii Contents PART ONE: THEORY...1 1. Groundwater in Construction...3 1.1 Groundwater in the Hydrologic Cycle 3 1.2 Origins of Dewatering
June i TABLE OF CONTENTS
 June 2005 - i - 05-526 TABLE OF CONTENTS SECTION PAGE 1.0 INTRODUCTION... 1 1.1 Purpose of the Investigation... 1 1.2 Description of the Project and Scope of Work... 1 1.3 Site Geology... 1 1.4 Site Description
Groundwater Flow Demonstration Model Activities for grades 4-12
 Groundwater Flow Demonstration Model Activities for grades 4-12 NR/WQ/2012-5 SET-UP Please allow time to practice using the groundwater model before conducting demonstrations. 1. Remove the groundwater
Module 2. The Science of Surface and Ground Water. Version 2 CE IIT, Kharagpur
 Module 2 The Science of Surface and Ground Water Lesson 7 Well Hydraulics Instructional Objectives At the end of this lesson, the student shall be able to learn the following: 1. The concepts of steady
,.-,I. ?-.ET;,p\ L-,* :kg
 Collecting real-time soil moisture profiles in the vadose zone C.M. Rose S.C. Armstrong J.L. Walker G.N. Young and J.C. Burton Environmental Research Division Argonne National Laboratory Argonne Illinois
East Maui Watershed Partnership Adapted from Utah State University and University of Wisconsin Ground Water Project Ages 7 th -Adult
 INTRODUCTION What is groundwater? Water contained in saturated soil and rock materials below the surface of the earth. It is not NEW water, but is recycled water through the hydraulic cycle. The source
September 16, 2011 Project No Ms. Christine Arbogast BAS, A Tetra Tech Company 1360 Valley Vista Drive Diamond Bar, CA 91765
 Geologists, Hydrogeologists and Engineers September 6, 0 Project No. 0-0 Ms. Christine Arbogast BAS, A Tetra Tech Company Valley Vista Drive Diamond Bar, CA 976 STOCKPILE SLOPE STABILITY PRIMA PHASE B
(Refer Slide Time: 04:08)
") Soil Mechanics Prof. B.V.S. Viswanathan Department of Civil Engineering Indian Institute of Technology, Bombay Lecture 27 Flow of water through soils-viii Welcome to lecture number eight of flow of water
Soil Mechanics Prof. B.V.S. Viswanathan Department of Civil Engineering Indian Institute of Technology, Bombay Lecture 27 Flow of water through soils-viii Welcome to lecture number eight of flow of water
Brooks/Cole Thomson LearningiM. Fundamentals of Geotechnical Engineering. Braja M. Das. California State University, Sacramento
 Fundamentals of Geotechnical Engineering Braja M. Das California State University, Sacramento Brooks/Cole Thomson LearningiM Australia Canada Mexico Singapore Spain United Kingdom United States CHAPTER
ASTM Volume 04.08, March 2017 Soil and Rock (I): D421 D5876
: D421 D5876") Table of Contents 1 D425-88(2008) Standard Test Method for Centrifuge Moisture Equivalent of Soils 2 D558-11 Standard Test Methods for Moisture-Density (Unit Weight) Relations of Soil-Cement Mixtures 3
Table of Contents 1 D425-88(2008) Standard Test Method for Centrifuge Moisture Equivalent of Soils 2 D558-11 Standard Test Methods for Moisture-Density (Unit Weight) Relations of Soil-Cement Mixtures 3
Site Investigation MUHAMMAD AZRIL HEZMI
 Site Investigation MUHAMMAD AZRIL HEZMI Definition Essential part of the preliminary design workon any important structure in order to provide adequateand reliable geotechnical informationand site condition,
Soil Improvement by Compaction Grouting
 CITY AND COUNTY OF DENVER ENGINEERING DIVISION Wastewater Capital Projects Management Standard Construction Specification 31-3223.12 Soil Improvement by Compaction Grouting Part 1 - General 1.01 Introduction
POROSITY, SPECIFIC YIELD & SPECIFIC RETENTION. Physical properties of
 POROSITY, SPECIFIC YIELD & SPECIFIC RETENTION Porosity is the the ratio of the voids to the total volume of an unconsolidated or consolidated material. Physical properties of n = porosity as a decimal
British Columbia s New Guidance for Groundwater Site Characterization
 Guy C. Patrick Victoria, BC October 29, 2010 British Columbia s New Guidance for Groundwater Site Characterization Better Investigations for Better Decision Making BC Ministry of Environment, 2010. Technical
CIV E Geotechnical Engineering I Consolidation
 Purpose Determine the magnitude and time rate of settlement for a compressible cohesive soil. Required reading Das 2006 Sections 10.4 to 10.16 (pages 312 to 358). Theory Bringing soil samples into the
New Development -Sonic Drilling with Sampling
 New Development -Sonic Drilling with Sampling Three Forces on Drill Strings: - Rotary force provides slow rotation to enhance vibrating effect -Vertical oscillatory force provides localized displacement
SEES 503 SUSTAINABLE WATER RESOURCES GROUNDWATER. Instructor. Assist. Prof. Dr. Bertuğ Akıntuğ
 SEES 503 SUSTAINABLE WATER RESOURCES GROUNDWATER Instructor Assist. Prof. Dr. Bertuğ Akıntuğ Civil Engineering Program Middle East Technical University Northern Cyprus Campus SEES 503 Sustainable Water
Compaction and Jet Grouting
 Compaction and Jet Grouting Alan Ringen, PE Senior Vice President Breakthroughs in Tunneling Short Course August 16, 2017 Grouting Principles Geotechnical Grouting: The injection of pumpable fluid materials
Electrical Conductivity & Hydraulic Profiling. The Combining of Two Subsurface Investigation Methods (With More to Come)
") Electrical Conductivity & Hydraulic Profiling The Combining of Two Subsurface Investigation Methods (With More to Come) How has field work been progressing? Split Spoon and Standard Penetration Testing
Electrical Conductivity & Hydraulic Profiling The Combining of Two Subsurface Investigation Methods (With More to Come) How has field work been progressing? Split Spoon and Standard Penetration Testing
ENGINEERING PROPERTIES AND MAINTENANCE OF PUTTING GREENS James R. Crum Department of Crop and Soil Sciences Michigan State University
 ENGINEERING PROPERTIES AND MAINTENANCE OF PUTTING GREENS James R. Crum Department of Crop and Soil Sciences Michigan State University Introduction Our overall objective of this research project was to
Importance of tailings properties for closure
 Proceedings of Mine Closure Solutions, 2014 April 26 30, 2014, Ouro Preto, Minas Gerais, Brazil Published by InfoMine, 2014 InfoMine, ISBN: 978-0-9917905-4-8 Importance of tailings properties for closure
3/7/ Basic Types of Rocks. A Brief Review of Physics
 A Brief Review of Physics Energy is the capacity to do work. Work is equal to the product of the net force applied to a fluid and the distance through which the force moves: W = F l W is work [M 2 T -2
Soil Water Relationship. Dr. M. R. Kabir
 CHAPTER 4 Soil Water Relationship Dr. M. R. Kabir Professor and Head, Department of Civil Engineering University of Asia Pacific (UAP), Dhaka LECTURE 10 Introduction Root zone (depth of soil penetrated
Hydrologic Cycle. Rain Shadow:
 Hydrologic Cycle The cyclical movement of water from the ocean to the atmosphere by evaporation, to the surface through precipitation, to streams through runoff and groundwater, and back to the ocean.
FLOW IN POROUS MEDIA LUÍS RIBEIRO INSTITUTO SUPERIOR TECNICO UNIVERSITY OF LISBON
 FLOW IN POROUS MEDIA LUÍS RIBEIRO INSTITUTO SUPERIOR TECNICO UNIVERSITY OF LISBON Where does groundwater flow? How water flows? Groundwater moves from areas of high hydraulic head to areas of low hydraulic
CEE 370 Environmental Engineering Principles
 Updated: 25 October 2015 Print version CEE 370 Environmental Engineering Principles Lecture #22 Water Resources & Hydrology II: Wells, Withdrawals and Contaminant Transport Reading: Mihelcic & Zimmerman,
DHANALAKSHMI COLLEGE OF ENGINEERING, CHENNAI DEPARTMENT OF CIVIL ENGINEERING 2 MARK QUESTIONS WITH ANSWERS CE FOUNDATION ENGINEERING UNIT 1
 DHANALAKSHMI COLLEGE OF ENGINEERING, CHENNAI DEPARTMENT OF CIVIL ENGINEERING 2 MARK QUESTIONS WITH ANSWERS CE6502 - FOUNDATION ENGINEERING Subject Code: CE6502 UNIT 1 1. What are the informations obtained
Cross Borehole Electrical Resistivity Tomography (ERT) Measurements
 Measurements") Introduction Cross Borehole Electrical Resistivity Tomography (ERT) Measurements Resistivity imaging at the surface may be used for applications such as cavity detection, geotechnical investigation, site
Introduction Cross Borehole Electrical Resistivity Tomography (ERT) Measurements Resistivity imaging at the surface may be used for applications such as cavity detection, geotechnical investigation, site
SAMPLE CHAPTERS UNESCO EOLSS GROUNDWATER MONITORING. Masanori Ando Musashino University, Japan
 GROUNDWATER MONITORING Masanori Ando Musashino University, Japan Keywords: groundwater, monitoring, sampling, monitoring program, monitoring location, sampling programs, flow measurement, sampling techniques,
9/9/ Basic Types of Rocks. Porosity of Earth Materials
 3 Basic Types of Rocks Porosity of Earth Materials Igneous rocks: crystalline solids which form directly from the cooling of magma. Example: granite. Sedimentary rocks: formed from material deposited as
1. Apply knowledge of the controlling variables for groundwater flow. 2. Demonstrate groundwater flow direction based on hydraulic head observations.
 .9-12 HYDRAULIC HEAD SUBJECTS: TIME: Science (Physical Science, Physics), Math 1 class period MATERIALS: Copies of student sheets and background information OBJECTIVES The student will do the following:
1.364 ADVANCED GEOTECHNICAL ENGINEERING HOMEWORK No. 5
 .364 ADVANCED GEOTECHNICAL ENGINEERING HOMEWORK No. Due: Friday December 2. This question concerns the stability of an open slope cutting that will be used to provide construction access for a 3.2m deep
Bi-Directional Static Load Testing of Driven Piles
 Bi-Directional Static Load Testing of Driven Piles Paul J. Bullock, PhD Fugro Consultants Inc. Loadtest Bi-Directional Osterberg Cell Testing Specialized jack in pile uses bearing to mobilize side shear
Determination of Design Infiltration Rates for the Sizing of Infiltration based Green Infrastructure Facilities
 Determination of Design Infiltration Rates for the Sizing of Infiltration based Green Infrastructure Facilities 1 Introduction This document, developed by the San Francisco Public Utilities Commission
J.-H. YIN Department of Civil & Structural Engineering, The Hong Kong Polytechnic University Kowloon, Hong Kong, China
 AN INNOVATIVE DOUBLE CELL TRIAXIAL SYSTEM FOR CONTINUOUS MEASUREMENT OF THE VOLUME CHANGE OF GASEOUS OR UNSATURATED MARINE SOILS AND TWO OTHER ADVANCED SOIL TESTING SYSTEMS J.-H. YIN Department of Civil
Misan University - College of Engineering Civil Engineering Department
 CHAPTER 2 Soil and Excavations Soil investigation including two phases: surface investigation and subsurface investigation Surface investigation involves making a preliminary judgment about the site s
LIMITED MOBILITY GROUTING -- PRACTICE IN NORTH AMERICA. Michael Byle, D.GE, F.ASCE,
 LIMITED MOBILITY GROUTING -- PRACTICE IN NORTH AMERICA Michael Byle, D.GE, F.ASCE, Overview INTRODUCTION COMPACTION GROUTING LIMITED MOBILITY GROUTING LMG MATERIALS AND TECHNOLOGY EQUIPMENT GROUT INJECTION
Subsurface Investigation Report. Proposed New 1-Story Building 6447 Grand Avenue Gurnee, Illinois
 AGI Project No. -11 Subsurface Investigation Report For the Proposed New 1-Story Building 6447 Grand Avenue Gurnee, Illinois Prepared for Mr. Steve Panko Key Development Partners, LLC North State Street,
VERIFICATION OF GEOTECHNICAL GROUTING- STRATEGIES AND PLANNING. Michael J. Byle, D.GE, F. ASCE
 VERIFICATION OF GEOTECHNICAL GROUTING- STRATEGIES AND PLANNING Michael J. Byle, D.GE, F. ASCE Verification of Geotechnical Grouting was published By the ASCE Committee on Grouting in 1995 It is still available
Period #7: Fluid Flow in Soils (I)
") Period #7: Fluid Flow in Soils (I) 53:030 Class Notes; C.C. Swan, University of Iowa A. Motivation: The ability of engineers to understand and predict the flow of fluids (usually water) in soils is essential
Period #7: Fluid Flow in Soils (I) 53:030 Class Notes; C.C. Swan, University of Iowa A. Motivation: The ability of engineers to understand and predict the flow of fluids (usually water) in soils is essential
ICBO Evaluation Service, Inc Workman Mill Road, Whittier, California
 ER-5435 Reissued May 1, 2002 ICBO Evaluation Service, Inc. 5360 Workman Mill Road, Whittier, California 90601 www.icboes.org Filing Category: DESIGN Masonry MESA RETAINING BLOCK WALL SYSTEM TENSAR EARTH
Ground Water Chapter 11
 Ground Water Chapter 11 How does water get underground? How is water stored underground? How does water move? How do we find it? Why we need to protect it. Lake Powell. Water levels are decreasing every
Installation of the BAT Mk III Filter Tip
 Installation of the BAT Mk III Filter Tip - Preparation - Installation - Accessories BAT Geosystems AB Box 1060 SE - 186 26 Vallentuna Sweden Phone +46 851170600 Fax +46 851173361 www.bat-gms.com info@bat-gms.com
Applied GeoScience, Inc Hammond Dr., Suite 6 Schaumburg, Illinois
 AGI Project No. 13-276 Subsurface Investigation Report For the Proposed New Retail Center 9601 South Pulaski Road Evergreen Park, Illinois Prepared for Mr. Feras Sweis FHS Design + Build LLC 2010 West
Stormwater Retention Pond Recovery Analysis
 Stormwater Retention Pond Recovery Analysis By Nicolas E Andreyev The first in a series of courses on Green Drainage Design www.suncam.com Page 1 of 33 Forward To design a stormwater retention pond, one
Chapter 11 Compressibility of Soil
 Page 11 1 Chapter 11 Compressibility of Soil 1. The compression of soil layers as a result of foundation or other loadings is caused by (a) deformation of soil particles. (b) relocation of soil particles.
Experience of a Large Scale Unintentionally Long Surcharge on Organic Soils
 Experience of a Large Scale Unintentionally Long Surcharge on Organic Soils Ying Liu, Ph.D., P.E., Senior Engineer, Group Delta Consultants, Inc., 37 Amapola Ave., Suite 212, Torrance, CA. Email: yingl@groupdelta.com
A-2. Soils. Soil Media. Chapter Contents. Soil Media In-situ Soil Testing Separation from Seasonal High Water Table (SHWT)
") A-2. Soils Chapter Contents Soil Media In-situ Soil Testing Separation from Seasonal High Water Table (SHWT) Importance of Soil Composition in SCMs The soil composition of many stormwater SCMs also is
A-2. Soils Chapter Contents Soil Media In-situ Soil Testing Separation from Seasonal High Water Table (SHWT) Importance of Soil Composition in SCMs The soil composition of many stormwater SCMs also is
CEX6230 GEOTECHNICS Dear Student:
 CEX6230 GEOTECHNICS 31.05.2010 Dear Student: Geotechnics (CEX6230) discusses design and construction aspects of Geotechnical Engineering. Even though this course requires a pass in CEX4230, I find that
Overburden Effect on the Axial Resistance of Instrumented CFA Piles. Knoxville, TN 37922, ph ,
 703 Overburden Effect on the Axial Resistance of Instrumented CFA Piles Timothy C. Siegel 1, M. ASCE, P.E., G.E., D.GE and Peter Faust 2 1 Principal Engineer, Dan Brown and Associates, PC, 1808 Northshore
Florida Method of Test for NONREPETITIVE STATIC PLATE LOAD TEST OF SOILS AND FLEXIBLE PAVEMENT COMPONENTS
 Florida Method of Test for NONREPETITIVE STATIC PLATE LOAD TEST OF SOILS AND FLEXIBLE PAVEMENT COMPONENTS 1. SCOPE Designation: FM 5-527 Modified AASHTO T-222-78 1.1 This method covers the making of nonrepetitive
Typical Subsurface Profile. November 28, 2016
 November 28, 2016 RSCCD Facility Planning, District Construction and Support Services 2323 N. Broadway, Suite 112, Santa Ana, CA 92706 Attn: Re: Ms. Allison Coburn Facilities Project Manager P: (714) 480-7530
Groundwater Earth 9th Edition Chapter 17 Mass wasting: summary in haiku form Importance of groundwater Importance of groundwater
 1 2 3 4 5 6 7 8 9 10 11 Groundwater Earth 9 th Edition Chapter 17 Geology 100 Mass wasting: summary in haiku form The grass is greener over the septic system said Erma Bombeck. Importance of groundwater
ADDENDUM NO. 1. PROJECT NAME: Bostic Pelt Road NRCS Drainage Improvements PRI PROJECT NO: Wakulla Co ITB#
 ADDENDUM NO. 1 DATE: January 22, 214 TO: Prospective Bidders via individual e-mails FROM: Alan Wise, P.E. PROJECT NAME: Bostic Pelt Road NRCS Drainage Improvements PRI PROJECT NO: 23.15 ---- Wakulla Co
Jet Grouting to Increase Lateral Resistance of Pile Group in Soft Clay
 GROUND MODIFICATION, PROBLEM SOILS, AND GEO-SUPPORT 265 Jet Grouting to Increase Lateral Resistance of Pile Group in Soft Clay Kyle M. Rollins 1, Matthew E. Adsero 2, and Dan A. Brown 3 1 Prof. Civil &
Example of the Unified Design procedure for use in the September 8, 2014, short course on in Brazil
 Introduction Example of the Unified Design procedure for use in the September 8, 2014, short course on in Brazil The Unified Design procedure involves two main steps. The first is verifying that the loads
Exploration, Sampling, and In Situ Soil Measurements. Dr. Omar Al-Hattamleh
 Exploration, Sampling, and In Situ Soil Measurements Dr. Omar Al-Hattamleh Purpose of Soil Exploration Information to determine the type of foundation required (shallow or deep). Information to allow the
GROUND IMPROVEMENT SITE INVESTIGATON
 GROUND IMPROVEMENT SITE INVESTIGTON November 2009 Lankelma ltd old Harbour arn old Harbour Lane Iden, East Sussex TN31 7UT U.K. T: +44 (0)1797 280050 E: info@lankelma.com www.lankelma.com Gardline Lankelma
Science Olympiad. Mentor Invitational Hydrogeology ANSWER KEY. Name(s): School Name: Point Totals
: School Name: Point Totals") Science Olympiad Mentor Invitational Hydrogeology ANSWER KEY Team Number: Raw Score: Rank: Name(s): School Name: Point Totals Possible Part 1: Groundwater Concepts and Vocabulary 30 Part 2: The Hydrogeology
Science Olympiad Mentor Invitational Hydrogeology ANSWER KEY Team Number: Raw Score: Rank: Name(s): School Name: Point Totals Possible Part 1: Groundwater Concepts and Vocabulary 30 Part 2: The Hydrogeology
THE ADVANTAGES OF THE USE OF GPS BASED LOGGING SYSTEMS FOR VERTICAL DRAIN INSTALLATION PROJECTS
 International Conference on Soft Ground Engineering (ICSGE2015) 3-4 December 2015, Singapore THE ADVANTAGES OF THE USE OF GPS BASED LOGGING SYSTEMS FOR VERTICAL DRAIN INSTALLATION PROJECTS JEROEN DIJKSTRA
Skirted Spudcan Sheet Pile Wall Interaction during Jack- Up Rig Installation and Removal in a Harbour Area
 Skirted Spudcan Sheet Pile Wall Interaction during Jack- Up Rig Installation and Removal in a Harbour Area L. Kellezi GEO - Danish Geotechnical Institute 1 Maglebjergvej, DK 2800 Copenhagen, Denmark G.
Plume Area Treatment Example
 Page 1 of 5 H R C T E C H N I C A L B U L L E T I N # 2. 5. 1 Plume Area Treatment Example HRC injection grids are commonly employed at project sites where a localized plume of chlorinated solvent contamination
NGWA s Water Well Construction Standard: ANSI/NGWA 01-14
 NGWA s Water Well Construction Standard: ANSI/NGWA 01-14 NGWA Standard Development Process as Approved by ANSI What is ANSI? The American National Standards Institute (ANSI), founded in 1918, promotes
HMA GROUP AUSTRALIA - NEW ZEALAND - INDONESIA - SOUTH AFRICA SINCE 1966
 SINCE 1966 Introduction Geotechnical Systems Australia (GSA) was founded in March 1987 to design, manufacture and distribute geotechnical instrumentation for the geotechnical and mining industries. Now