SOIL SCIENTIST EVALUATION FINAL UNC Bingham WWTF Land Application System Receiver Site
|
|
|
- Laurel Moore
- 6 years ago
- Views:
Transcription


1 SOIL SCIENTIST EVALUATION FINAL UNC Bingham WWTF Land Application System Receiver Site Orange County North Carolina Prepared for: McKim & Creed, PA Venture IV Building, Suite Varsity Drive Raleigh, NC And North Carolina Division of Water Quality Aquifer Protection Section North Carolina Division of Water Quality 1617 Mail Service Center Raleigh, NC Prepared by: Scott J. Frederick, EI, NCLSS April 2011
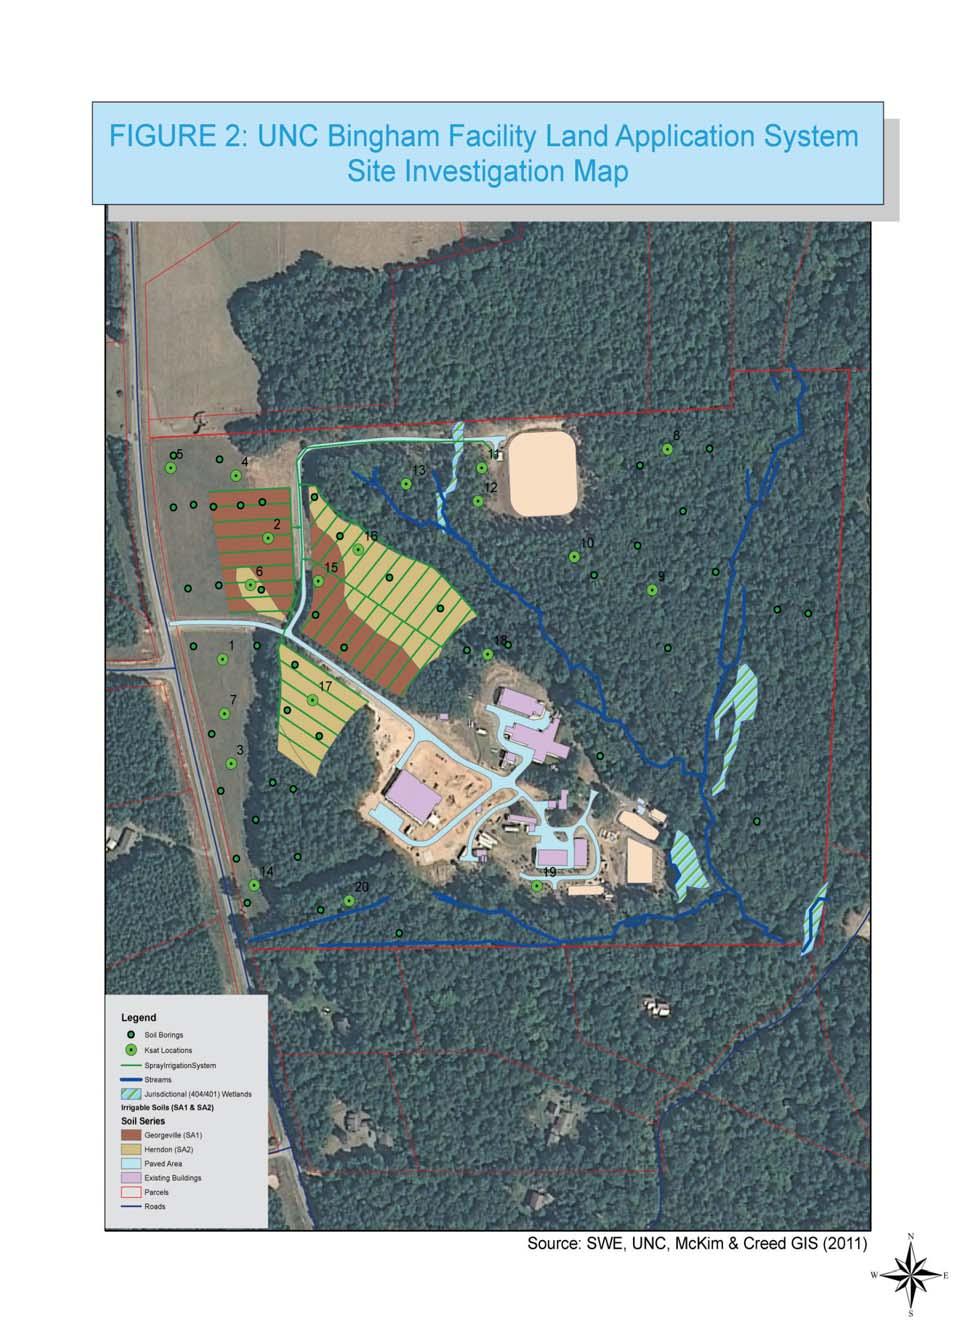
2 Table of Contents Executive Summary iv 1.0 Introduction Objectives Methodology Site Description Wetlands, Streams, and Groundwater Wells 4.2 Soils Investigation 4.3 Soils Analysis 5.0 Hydrology 5.1 Liquid Loadings 5.2 Wastewater Characterization 5.3 Wastewater Remediation 5.4 Water Budget Environmental Effects Results / Discussion References. 12 Appendix.. 13 Appendix A Maps Figure 2: UNCBWWTF Land Application System Receiver Site Investigation Map. Figure 3: UNCBWWTF Land Application System Irrigable Soils Map. Figure 4: UNCBWWTF Land Application System NRCS (USDA)Soils Map. Appendix B Saturated Hydraulic Conductivity Data - UNCBWWTF Saturated Hydraulic Conductivity Data Appendix C Soils Descriptions - UNCBWWTF Land Application System Soils Descriptions i
3 List of Figures Figure 1: Project Location Map: UNCBWWTF Land Application System Receiver Site Map, Orange County, North Carolina 3 Figure 2: Figure 3: Figure 4: UNCBWWTF Land Application System Receiver Site Investigation Map... UNCBWWTF Land Application System Irrigable Soils Map... UNCBWWTF Land Application System NRCS (USDA) Soils Map... Appendix A Appendix A Appendix A ii
4 List of Tables Table 1: Soil Areas, Recommended Hydraulic Loading Rates for the UNCBWWTF Land Application System Receiver Site, Orange County, NC.... iv Table 2: UNCBWWTF Land Application System Receiver Site Soil Areas, Associated Soils, and Existing Vegetation v Table 3: Table 4: Table 5: Table 6: Table 7: UNCBWWTF Land Application System Receiver Site Soil Area Descriptions... 5 Composite Soil Analysis of Upland Soils (N=22) at the UNCBWWTF Land Application System Receiver Site, Orange County, NC (2010)... 6 Typical Ranges of Soil Infiltration Rates by Soil Texture and Slope. 6 Average Saturated Hydraulic Conductivity (Ksat) Data for the UNCBWWTF Receiver Site... 7 Soils, Irrigable Areas, and Wastewater Loadings for the UNCBWWTF Land Application System Receiver Site iii
5 Executive Summary A soil and site investigation was completed for the UNC Bingham Facility Wastewater Treatment (UNCBWWTF) land application system in Orange County, NC. The purpose of the investigation was to determine the potential of this property to receive secondary treated irrigation water. The soil scientist evaluation was conducted according to mandates set forth by the North Carolina Division of Water Quality (NCDWQ), Aquifer Protection Section and specifically, 15 NCAC 02T Field investigations were conducted to describe the existing receiver site according to the soils, existing vegetation crop, geologic features, physiographic region, topography, hydrology, wetlands, and landscape position. Water quality data and the most limiting site characteristics were utilized for hydraulic and liquid loading calculations and recommendations. Hydraulic loading recommendations were determined after consideration of site characteristics such as soils, in situ saturated hydraulic conductivity measurements, hydrology, vegetation, landscape position, and any other site limiting factors (Table 1). Loading recommendations are provided in this report for a land application irrigation system on the proposed receiver site and soil areas (Table 2). Hydraulic loadings were calculated based on site specific data and accepted professional guidelines for waste disposal (NCDWQ). Soil fertility was analyzed by a regional agronomic services laboratory (Table 4). Recommendations in this report are provided for the establishment of a forest or forage land application wastewater irrigation system including results from a detailed water balance and hydraulic loading rate analysis (Edwin Andrews & Assoc., PC, 2011). Soil analyses of the proposed irrigation site indicate there are some nutrient deficiencies on the proposed receiving silt loam and sandy loam soils (Table 4). The existing wastewater irrigation constituents will provide supplemental nutrients and a consistent source of water to growing crops, in this case a mixed hardwood forest and/or forage crop system. Table 1: Soil Areas, Recommended Hydraulic Loading Rates for the UNCBWWTF Land Application System Receiver Site, Orange County, NC. Soil acres 1] Area in/wk 2] gpd 3]4]5] Seasonal ,182 Yes ,318 Yes Design (SA 1 and SA2) 3,500 gpd 5.71* 3,500 Yes 1] Acreages account for setbacks from waterways, wetlands, streams, property lines, dwellings, and water supply wells for a 3,500 gpd system. 2] Rate based on recommended application rates calculated by a comprehensive Water Balance (Edwin Andrews & Assoc., PC, 2011). 3] Based on a 7 day irrigation week. 4] Recommended maximum hydraulic loading over an entire irrigation year including constraints from storage. 5] Irrigation rate shown is the maximum that should be used in computing receiver site capacity unless or until a higher loading rate is shown to be sustainable based on actual field performance and storage capacity limitations. Use of forest cover crop may result in higher than estimated transpiration and drainage rates. Operators at a minimum need the permit flexibility to apply irrigation water at iv
6 a rate high enough to sustain plant growth without causing runoff or ponding, which during extended dry periods (drought conditions) could exceed the rates shown in the table. * - Actual irrigable area utilized in Water Balance Report (Edwin Andrews & Assoc., PC, 2011). Table 2: UNCBWWTF Land Application System Receiver Site Soil Areas, Associated Soils, and Existing Vegetation. Predominant Soil Soil Area Series Existing Vegetation SA-1 Georgeville Grass, Mixed Pine/Hardwood SA-2 Herndon Grass Approximately 57 acres of uplands with potential to receive municipal wastewater irrigation were evaluated and similar soils were grouped into Soil Areas (SA). Two different soil areas were identified within these areas, each with specific loading rates totaling 5.71 irrigable acres utilizing a secondary treated water source. Soil Areas account for buffers from waters of the State, property lines, as well as other site limitations such as bedrock, shallow soils, depressions, and disturbed areas. It should be noted that final hydraulic loading rates are based off a detailed water balance and in situ saturated hydraulic conductivity measurements. This water balance accounts for storage and other factors (Edwin Andrews & Assoc., PC, 2011) and local rainfall conditions. The receiver site investigated for this evaluation was approved by a nationally and state licensed soil scientist in North Carolina. It should be noted that soil systems are quite variable and the actual system performance and operations can be adjusted during operation to accommodate site variabilities. Hydraulic recommendations are based on site specific data, and attempt to account for these site variabilities. With that understanding, maximum hydraulic and nutrient loadings are given. This report is based on the professional recommendations and judgment of a nationally and North Carolina licensed soil scientist (SWE Group, 2011), and reviewed for incorporation into the permit application submittal to NCDWQ by a North Carolina licensed professional engineer (McKim & Creed 2011). Overall, the Bingham Facility Land Application System is a viable alternative to discharging treated wastewater into nearby surface waters. The irrigation of the treated wastewater will ultimately increase soil fertility and productivity of the cover crop vegetation and will enhance adjacent wetlands and low lying areas with increased base flow. The information contained in this report will aid with management of a land application irrigation system for the Bingham Facility receiver site. v
7 1.0 Introduction Under Section 02T.0500 Rules Waste Not Discharged to Surface Waters set forth by the North Carolina Division of Water Quality, municipalities, and publicly owned treatment works (POTWs) can divert their treated effluent to land application irrigation receiver sites. Land applying wastewater or reclaimed water will provide additional treatment, and is consistent with the total maximum daily load (TMDL) program promoted by federal and state regulatory agencies. Many county governments, municipalities, and industries are facing similar situations with finding alternatives for wastewater and reclaimed water treatment and disposal in nutrient sensitive regions. The proposed receiver site is a viable alternative to a point source discharge for wastewater produced by the UNC Bingham Wastewater Treatment Facility (UNCBWWTF) and will provide an excellent source of irrigation water for growing forage grasses and/or tree crops. 2.0 Objectives The objectives of this report are to describe the existing receiver site according to the soils, vegetation and/or crop cover, geologic features, topography, hydrology, wetlands, and landscape position. Recommendations will be provided for the establishment of a land based irrigation system. In addition, a standard soil fertility analysis will be provided and analyzed with an accompanying Agronomist Report (SWE Group, 2011). 3.0 Methodology Per regulations set forth by the North Carolina Division of Water Quality (NCDWQ) the purpose of this evaluation was to determine the potential and suitability of selected receiver areas to receive treated irrigation water and use this information in the permitting of the facility receiver areas. The soil scientist evaluation was conducted according to 15A NCAC 02T.0504(b). Field investigations were conducted to describe the potential wastewater receiver site according to the soils, existing vegetation / crop, geologic features, topography, hydrology, wetlands, and location. Anticipated wastewater quality data and the most limiting site characteristics were utilized for hydraulic loading calculations and recommendations. Hydraulic loading recommendations were determined after consideration of site characteristics such as soils, hydrology, vegetation, landscape position, and any other site limiting factors. Hydraulic loadings were calculated based on site specific data and NCDWQ guidelines for waste disposal (Water Balance Report: Edwin Andrews & Assoc. 2011). Soil fertility was analyzed by a regional soils analysis laboratory at NCDA (Table 4). 1
8 4.0 Site Description The UNCBWWTF is located in Orange County near the town of White Cross in the Bingham Township off Orange Chapel Clover Garden Road (SR 1956) (Figure 1). The property consists of several agricultural hay fields currently out of production, adjacent and abutting regenerating and mature pine fringe forest, hardwood forest, and adjacent mature mixed pine and hardwood forest. Existing facility structures occur on the site as well as in entrance road, existing wastewater irrigation system and infrastructure, and a newly constructed expansion wastewater irrigation system, storage lagoon, and irrigation infrastructure. Several intermittent stream, wetland, and floodprone complexes occur on the north and east sides of the receiver site. Several drainages course through the property draining upland areas into Collins Creek, a tributary to the Haw River. The site is located in the Piedmont Physiographic Province in the vicinity of the Haw River that is characterized by rolling topography bisected by narrow perennial and intermittent streams. The soils present on the proposed receiver sites, according to the Orange County Soil Survey (USDA, GIS 2010), are mapped as Georgeville silt loam, Herndon silt loam, as well as lowland loam soils consisting of Chewacla series soils. These mapping units were found on the site in similar locations indicated by the Orange County Soil Survey. Several small ephemeral, intermittent, and perennial drainages extend away from the receiver site connecting water conveyances on and off the site. These drainages were delineated and appropriate setbacks established to calculate irrigable soil areas (Biohabitats, 2010). These drainage areas will be protected from irrigation application with vegetative buffers that will capture and utilize subsurface irrigation water and rainfall runoff. Soils in the upland areas are typical of piedmont Carolina Slate Belt series soils with considerable variability within the catena and within each soil series including depth, color, and texture. Topography is rolling near drainages with slopes ranging from 2 to 6 percent. Shallow soils were found on ridges and areas historically farmed and now in pine forest vegetation. Soils in the lowland areas are typical of floodplain soils with periodic flooding and inundation characteristics, but very well drained adjacent to the water conveyance. The vegetation on the proposed forested land application areas consist of upland pine and hardwoods including: yellow poplar (Liriodendron tulipifera), hickory (Carya sp.), northern red oak (Quercus rubra), white oak (Quercus alba), red maple (Acer rubrum), black cherry (Prunus serotina), black gum (Nyssa sylvatica), sweetgum (Liquidambar styraciflua), sugar maple (Acer saccharum), Loblolly pine (Pinus taeda), Shortleaf pine (Pinus echinata), Virginia pine (Pinus virginiana), sassafras (Sassafras albidum), and other small understory woody species. Vegetation in the fields and open areas consist of a variety of herbaceous grasses, forbs, and broadleaf species. Fields will either be kept 2

9
10 open and planted with perennial forage grasses such as coastal Bermuda or fescue, or will be planted with an appropriate tree species selected for the soil, proposed liquid loadings, and landscape position. 4.1 Wetlands, Streams, and Groundwater Wells: A field investigation of the receiver site revealed areas of wetlands and drainage ways that have been delineated to avoid impacts from the irrigation system (Biohabitats, 2010). According to regulations (Section.0500 Waste not discharged to surface waters) concerning wastewater land application systems using treated effluent, irrigation spray shall not influence within 25 feet of surface waters not classified SA (shellfish waters), including jurisdictional wetlands. Groundwater wells have been located and buffered accordingly. Additional 100 foot Jordan Lake buffers were also included in these setbacks on appropriate surface waters. 4.2 Soils Investigation: A soils investigation was accomplished across the proposed receiver site. A series of 3.5 in. hand auger borings were done across the site to maximum depths ranging from in. (Appendix A Figure 2: Site Investigation Map). These borings were done to characterize the depth of each of the horizons, the color of the soil material at each of the various depths, the texture, structure, consistence of the soil material within each of the horizons, and depth to bedrock or other limiting horizon. These augerings were also done to verify the boundaries of mapping units indicated in the USDA soil survey for Orange County, NC (USDA GIS, 2010). Descriptions of the augerings are included in the Appendix (Appendix C: Soils Descriptions) and were utilized to make a field determination of the specific soil mapping unit and subsequent recommended hydraulic and liquid loadings. The USDA Orange County Soil Survey for the site shows two (2) predominant series present within the irrigable soil areas: Georgeville silt loam and Herndon silt loam. Considerable variability in depth, color, and texture was evident across the site depending on landscape position and historical agricultural land use. These variations resulted in subsequent variations in hydraulic loading potentials between the two soil series but not within soil series sampling. Field investigations revealed similar locations for the soil series relative to the NRCS soil survey. The soils described and delineated in the field were separated into different Soil Areas each representing a different proposed hydraulic loading rate. These loading rates were determined in part by detailed soils descriptions including texture, structure, mineralogy, and consistence. In addition these Soil Areas and corresponding potential hydraulic loadings were determined by site topography and site specific saturated hydraulic conductivity (Ksat) measurements. Uplands and lowlands were examined for the potential for land application. Soils in the uplands are typical of piedmont Carolina Slate Belt series soils with silt loam textures, deep soils on side and toe slopes, shallow soils on ridges, and considerable variability across the site. Topography is flat to rolling near drainages with slopes ranging from 2 to 4
11 6 percent. Potential hydraulic loading rates will be limited by the soil with the lowest Ksat within each proposed Soil Area. The hand auger borings confirmed that the soils mapped on the site according to NRCS (USDA) are present in the proposed receiver areas. The majority of the soils on the proposed receiver site consist of Georgeville and Herndon silt loam soils, with the remainder of the lowlands consisting of Chewacla loam soils. Soil Area 1 (SA1) soils on the receiver site consist of Georgeville silt loam soils. Slopes range from 2-6%. These soils are very deep, well drained, moderately permeable soils that formed in material mostly weathered from fine-grained metavolcanic rocks of the Carolina Slate Belt. Seasonal high water is typically >6 ft. SA1 soils comprise approximately 62% (3.56 ac) of the total receiver site acreage (5.71 ac). Soil Area 2 (SA2) soils on the receiver site consist of Herndon silt loam soils. Slopes range from 2-6%. These soils are very deep, well drained, moderately rapid permeability soils that formed in material mostly weathered from fine-grained metavolcanic rock of the Carolina Slate Belt. Seasonal high water is typically >6 ft, however soil variabilities across the site indicate some seasonal perching conditions closer to the surface, probably indicative of slower permeable inclusions. SA2 soils comprise approximately 37% (2.15 ac) of the total receiver site acreage (5.71). A description of the soil areas including predominant soil series, and existing vegetation is summarized in Table 3. Table 3: UNCBWWTF Land Application System Receiver Site Soil Area Descriptions. Predominant Soil Soil Area Series Existing Vegetation SA-1 Georgeville Grass, Mixed Pine/Hardwood SA-2 Herndon Grass 4.3 Soils Analysis: A composite sample of the top 0-12 inches of soil representing the irrigable upland areas was collected and analyzed for nutrient composition by NCDA (Table 4). Soil analyses of the proposed irrigation site indicate that there are nutrient deficiencies, especially nitrogen and phosphorus. This conclusion is based on the potential crop response to particular nutrients if fertilizer is applied to the site. The cation exchange capacity (CEC) and base saturation (BS%) are low as well. The addition of wastewater to the site will improve soil fertility and consequently the growing conditions and productivity of this site. Additional agronomy recommendations are found in the Agronomist Report (SWE Group, 2011) 5
12 Table 4: Depth Uplands 0-6 in in. Composite Soil Analysis of Uplands (N=22) at the UNCBWWTF Receiver Site, Orange County, NC (2010) 1. Phosphorus Potassium Calcium Magnesium ph ppm ppm ppm (%) ppm (%) CEC 3 BS% 4 (Index) 2 (Index) (19.5) (4.0) 69.1 (35.4) 55.0 (28.1) (33.1) 94.3 (14.7) (29.8) (17.7) Laboratory Soil Test Reports (2010). 2 Index values reported by NCDA (2010) 3 Cation exchange capacity (meq/100g) defined as the amount of cations adsorbed on soil-particle surfaces per unit mass of the soil under chemically neutral conditions. 4 Base saturation defined as the percentage of the CEC occupied by base cations 5.0 Hydrology 5.1 Liquid Loadings The liquid loading limit represents the amount of liquid (in/wk), which can be applied to land receiver sites, including nutrients. These values are represented as the annual, monthly, weekly, and hourly maximum loadings that can be assimilated on a wastewater receiver site. A water balance was calculated for each Soil Area to determine suitable liquid loadings according to the in-situ properties of the site that most influence these loadings. The soils present are generally silt loam soils with slopes ranging from 2-6% on Soil Areas 1 and 2. Wastewater should not be applied at an instantaneous rate exceeding 0.5 in/hr on Soil Area 1 and 2. The maximum instantaneous loading rate was determined utilizing published infiltration rate data for the particular soil and landscape position at the existing wastewater receiver site (Sprinkler Irrigation, 1969). However, these numbers are somewhat conservative given the acceptable range of maximum instantaneous loading rate for these soils and ideal site conditions and can be increased up to 50% under ideal conditions (Table 5). Table 5: Typical Ranges of Soil Infiltration Rates by Soil Texture and Slope. Basic Infiltration Rate (in/hr 1 ) Slope Texture 0-3% 3-9% 9+% Sands loamy sands sandy loams and fine sandy loams very fine sandy loam and silt loam
13 sandy clay loam and silty clay loam clay and silty clay <0.1 Source: Sprinkler Irrigation Association, Sprinkler Irrigation (1969) 1. For good vegetative cover, these rates may be 25-50% greater. For poor surface conditions, rates may be as much as 50% less. During the soils investigation, the most restrictive soil horizons were noted to determine the appropriate Soil Areas and to estimate or measure saturated hydraulic conductivity in these restrictive horizons. Saturated hydraulic conductivity (K sat ) values were obtained from 22 sample points across the receiver site using a portable constant head permeameter (CHP) (Table 6). Test locations for soil hydraulic conductivity are shown on the site investigation map in Appendix A. From the site specific data, the Ksats for Soil Areas 1 and 2 were determined to have a geometric mean of 0.04 in/hr and in/hr respectively (Appendix B Saturated Hydraulic Conductivity Data) (Water Balance Report Edwin Andrews & Assoc., 2011). Due to site variabilities and to improve site operations, the lowest geomean Ksat was selected to represent both soil areas. Therefore, both soil areas will be loaded at the same rate across the site at.033 in/hr (Edwin Andrews and Associates, 2011). These values represented the soil hydraulic characteristics of the irrigable soils and were incorporated into a comprehensive water balance. (Edwin Andrews & Assoc., PC, 2011). It should also be noted that a forested land application system design was selected for a portion of this receiver site to maximize evapotranspiration, and improve soil quality; including structure and vertical and horizontal hydraulic conductivities. Root channels from the tree cover crop effectively improve the hydraulic conductivities of soils found on site above what can typically be calculated from discreet CHP data points and as reflected in the Ksat values used for each soil area in the water balance. Table 6: Average Saturated Hydraulic Conductivity (Ksat) Data for the UNCBWWTF Receiver Site. Average Depth Soil Area Horizon (in.) cm/hr 1 in/hr * 1 Bt Bt SA1 & SA ] Based off Ksat data collected across the project site for each Soil Area (Appendix B Saturated Hydraulic Conductivity Data) (SWE Group, 2010 and Edwin Andrews & Associates, 2010) *Water Balance conducted by Edwin Andrews and Associates, Depending on zone layout and design it is recommended that some type of automated system be installed to allow efficient use of varying soil areas and irrigable areas. All irrigable soils (Figure 3 Irrigable Soils Map) should be managed for irrigation according to antecedent rainfall and time of year to minimize ponding and runoff potential. 7
14 5.2 Wastewater Characterization: The proposed secondary effluent irrigation water can be described as containing varying levels of essential plant nutrients, organic compounds, trace minerals, and potentially phytotoxic compounds. Each of these wastewater constituents are assimilated or transformed on a receiver site through physical, chemical, and biological processes. The irrigation water proposed for application on this system will go through a series of pretreatment stages preparatory to slow rate irrigation on a dedicated receiver site. Additional sampling and monitoring of wastewater and soils on the receiver site is recommended to ensure optimal performance of the proposed irrigation system. Irrigation water should have SAR values 10 to avoid potential salting problems in the soil. Periodic application of gypsum may be required as a corrective measure if the SAR is consistently above 10. Proposed data from the design facility indicates low levels for N and P in treated effluent. Therefore, supplemental nutrients may be required. 5.3 Wastewater Remediation: Irrigation water will be utilized in several ways on the receiver site. Some water will be lost directly by evaporation of the water from the sprinkler heads. Water will be lost through transpiration by vegetation, evaporation from the vegetation and soils surface, and percolation through the soil profile. Any excess nutrients in the wastewater will be treated through microbial processes, plant uptake, adsorption to soil solids, and biologically mediated chemical transformations (i.e. denitrification). Based on the wastewater analysis, there is little potential for percolation of nutrients below the root zone. 5.4 Water Budget: A water balance was calculated by Edwin Andrews & Assoc., PC based on specific site data and utilized as an aid for system design. This water balance can be represented by: Evapotranspiration + Natural Runoff + Drainage = Precipitation and Irrigation Drainage rate was estimated based on qualitative observations, soil chemical and physical data, and site specific hydraulic conductivity data (K sat ). Long-term precipitation values used in the water balance represent the wet-year for the region (Chapel Hill, NC). Evapotranspiration data was utilized from data determined by the Thornthwaite method for calculating PET, one appropriate method for the Southeastern region. The estimated water balance calculations illustrate the amount of wastewater that can be applied to the receiver site under wet rainfall year conditions, given there are no nutrient limitations. The facility should be designed to handle larger flow volumes when 8
15 antecedent moisture conditions allow for additional irrigation such as during dry rainfall years. When irrigation water cannot be sprayed due to weather or site conditions, the water is put into storage. The water balance is used to optimize wastewater loadings and allow removal from storage. The drainage rate used is based on the K sat of the soils. In determining the water balance, the percolation rate (Pw) was estimated to be conservatively,.04% of K sat for Soil Areas 1 and 2. The EPA method (EPA, 1981) adopted by NCDWQ recommends that the drainage rate used is between 4-10% of the saturated hydraulic conductivity (K sat ) of the soils. This percolation rate is recommended for this system based on the potential accumulation of organic matter and migration of fine soil particles during the operation of this system, as well as the time of year that saturated hydraulic conductivity measurements occurred. The K sat used to determine drainage represents this expression of organic material and soil fines, as well as the existing soil characteristics such as structure and texture found at the proposed receiver site and soil moisture conditions at the time of measurement. It should be noted that K sat values for discrete locations in Soil Areas can understate or overstate actual hydraulic dynamics across the site due to extensive tree root systems, root channels, and improved soil quality characteristics from these root systems; such as soil structure, % organic matter, and soil macro fauna channels. The water losses are evapotranspiration (ET), drainage, and rainfall runoff. The potential additions are rainfall and irrigation. The method used for the water balance uses the wettest conditions over a long-term period as measured by the 80 th percentile precipitation data for each month. Actual irrigation rates can double under drier conditions than those used for the water balance. In addition, ET would increase with decreasing rainfall and thus increase the amount of irrigation water that can be utilized. It should be noted that expected ET values for the forest system are much higher than ET data used in water balance calculations. Operators should be given sufficient permit flexibility to allow additional hydraulic loadings to take full advantage of the benefits provided by the forest or forage cover crop and to ultimately meet the maximum potential hydraulic capacity of the system without resulting in runoff or ponding. 6.0 Environmental Effects When managed properly, there will be no adverse environmental effects from the use and operation of the proposed UNCBWWTF land application system receiver site. The irrigation water used will be effectively treated by the receiver site and growing crops before these waters enter surface and/or groundwaters. The use of this irrigation water will ultimately increase soil fertility and productivity of the site, as indicated by soils analysis and crop productivity, and will enhance adjacent wetlands and low lying areas with increased base flow. If managed properly, the existing wastewater land application system will have no adverse impacts to groundwater supplies or surface water supplies. The addition of water and nutrients to the site will benefit wildlife through increased biological activity in adjacent wetlands and low lying areas, and the irrigation operation may actually contribute to base flow in this river system. 9
16 7.0 Results / Discussion The soils investigated at the UNCBWWTF land application system receiver site are suitable for wastewater application. The best soils are deep, well-drained, and have moderate permeabilities. The soils were grouped into two (2) separate soil areas, each with specific loading rates (Table 7). A geometric mean loading rate was utilized using the most conservative soils on site thereby combining all soil areas into one design Soil Area. Table 7: Soils, Irrigable Area, and Recommended Wastewater Loadings for the UNCBWWTF Land Application System Receiver Site. Soil Predominant acres 1] Area Soils in/wk 2] gpd 3]4]5] Seasonal 1 Georgeville ,182 Yes 2 Herndon ,318 Yes Design * SA1 & ,500 Yes 1] Acreages account for setbacks from waterways, wetlands, streams, property lines, dwellings, and water supply wells for a 3,500 gpd system. 2] Rate based on recommended application rates calculated by a comprehensive Water Balance Report (Edwin Andrews & Assoc., PC, 2010) and local wet rainfall year data. 3] Based on a 7 day irrigation week. 4] Recommended hydraulic loading over an entire irrigation year including storage constraints. 5] Irrigation rate shown is the maximum that should be used in computing receiver site capacity unless or until a higher loading rate is shown to be sustainable based on actual field performance and storage capacity limitations. Use of forest cover crop may result in higher than estimated transpiration and drainage rates. Operators at a minimum need the permit flexibility to apply irrigation water at a rate high enough to sustain plant growth without causing runoff or ponding, which during extended dry periods (drought conditions) could exceed the rates shown in the table. * Actual irrigable area utilized in Water Balance Report (Edwin Andrews & Assoc., PC, 2011). Saturated hydraulic conductivity tests were performed to determine the permeability of the most restrictive horizon. These measurements were obtained from selected sample points across the site. These values were used to determine the hydraulic loading capacity of the receiver site. The most restrictive horizon in these soils have saturated hydraulic conductivities ranging from.29 to 0.01 in/hr for all Soil Areas. The most restrictive saturated hydraulic conductivities were determined in the Bt horizons of all Soil Areas. According to the final Water Balance Report (Edwin Andrews & Assoc., PC, 2011) for the selected receiver site, existing soils and vegetation can accept maximum hydraulically limited liquid loadings of 8.2 in/yr applied to Soil Areas 1 and 2 (3,500 gpd). Recommended weekly application is.157 in/wk for both soil areas based on local wet year rainfall data. Actual loadings may be adjusted in the future according to site specific characteristics, system operation, and storage modifications. 10
17 Overall, the site is a viable option for wastewater application. The irrigation water applied will provide supplemental nutrients and a consistent source of water to growing crops capable of producing large amounts of biomass and providing favorable soil conditions to enhance adsorption and denitrification of phosphorous and nitrogen respectively. With proper site management, hydraulic and nutrient loading management, the site will perform as a means to treat and assimilate wastewater irrigation water and protect surface waters entering the nearby river basins. 11
18 8.0 References Edwin Andrews & Associates, PA, Water Balance Report. UNC Bingham WWTF Land Application System. Orange County, NC. Evans, R.O present. North Carolina State University Biological and Agricultural Engineering Associate Professor and Department Extension Leader, Water Table Management and Water Quality, Raleigh, NC (personal communication). Rubin, A.R North Carolina State University Biological and Agricultural Engineering Professor and Extension Specialist, Waste Management, Raleigh, NC. (personal communication) Section.0500 Waste Not Discharged to Surface Waters, 15A NCAC 02T.0504 (b) - Soils Report. G.S ; (a)(1); Eff. September 1, Soil, Water, and Environment Group, PLLC, Agronomist Report. UNC Bingham WWTF Land Application System. Orange County, NC. United States Department of Agriculture, Soil Conservation Service. Soil Survey of Orange County, North Carolina. GIS Web Survey, United States Environmental Protection Agency Process Design Manual, Land Treatment of Municipal Wastewater. Published by USEPA Center for Environmental Research Information. Cincinnati, Ohio
19 APPENDIX 13
20 APPENDIX A Maps
21
22

23
24 APPENDIX B Saturated Hydraulic Conductivity Data
25 Ksat Data Sheet Plot: Ksat-1 Conducted By: SJF Location: Bingham, road Date: 4/6/10 Weather: sunny Temp: 75 Soil Series/Horizon: Georgeville Source of Water: tap Plot hd r rs D Hi H/r di dsur i 1-ON 2-ON dsur f df Hf Mri Ti MRf Tf MR T V CF Q (cm 3 /min) Q (cm 3 /h) Ksat (cm/h) Ksat (cm/d) Ksat (in/h) Ksat (in/d) 1/Bt yes :43: :13: :30: yes :13: :43: :30: yes :43: :13: :30: yes :13: :43: :30: yes :43: :13: :30: yes :13: :43: :30: yes :43: :13: :30: /Bc yes :05: :50: :45: yes :50: :20: :30: yes :20: :50: :30: yes :50: :20: :30: hd = Hole depth (cm) r = Radius of the hole (dia./2) (cm) rs = Distance between reference level and soil surface (cm) D = Distance from the hole bottom to the reference level (hd+rs) (cm) Hi = Initial desired water depth (head) in hole (cm) H/r = Ratio of head to radius of hole (must be 5) di = Constant-head tube setting, initial d measured in hole (di = D-Hi) (cm) - usually 1 cm less than calculated di dsur i = Initial distance from water surface to ground (hd - Hi) 1-ON = 3-way valve turned to 1-ON (CF = 20, multiply CF times MR to obtain volume of flow) 2-ON = 3-way valve turned to 2-ON (CF = 105, multiply CF times MR to obtain volume of flow) dsur f = Final distance from water surface to ground (steady state) df = Final d measured in hole (dsur f + rs) (cm) - should be within 1-2 cm of di Hf - Final water depth in hole (Hf = D-df) (cm) MRi = Initial measuring reservoir reading (cm) Ti = Initial time to record measuring reservoir level drop (min.) MRf = Final measuring reservoir reading (cm) Tf = Final time to record measuring reservoir level drop (min.) MR = Change in measuring reservoir level (cm) T = Change in time for measuring reservoir water drop (min.) V = flow volume (cm 3 )
26 Ksat Data Sheet Plot: Ksat-2 Conducted By: SJF Location: Bingham - field/road Date: 4/6/10 Weather: sunny Temp: 75 Soil Series/Horizon: Ge Source of Water: tap Plot hd r rs D Hi H/r di dsur i 1-ON 2-ON dsur f df Hf Mri Ti MRf Tf MR T V CF Q (cm 3 /min) Q (cm 3 /h) Ksat (cm/h) Ksat (cm/d) Ksat (in/h) Ksat (in/d) 1/Bt yes :06: :36: :30: yes :36: :06: :30: yes :06: :36: :30: yes :36: :06: :30: yes :06: :36: :30: yes :36: :06: :30: /BC yes :00: :45: :45: yes :45: :15: :30: yes :15: :45: :30: yes :45: :15: :30: yes :15: :45: :30: yes :45: :57: :48: yes :57: :27: :30: yes :27: :07: :40: yes :07: :37: :30: hd = Hole depth (cm) r = Radius of the hole (dia./2) (cm) rs = Distance between reference level and soil surface (cm) D = Distance from the hole bottom to the reference level (hd+rs) (cm) Hi = Initial desired water depth (head) in hole (cm) H/r = Ratio of head to radius of hole (must be 5) di = Constant-head tube setting, initial d measured in hole (di = D-Hi) (cm) - usually 1 cm less than calculated di dsur i = Initial distance from water surface to ground (hd - Hi) 1-ON = 3-way valve turned to 1-ON (CF = 20, multiply CF times MR to obtain volume of flow) 2-ON = 3-way valve turned to 2-ON (CF = 105, multiply CF times MR to obtain volume of flow) dsur f = Final distance from water surface to ground (steady state) df = Final d measured in hole (dsur f + rs) (cm) - should be within 1-2 cm of di Hf - Final water depth in hole (Hf = D-df) (cm) MRi = Initial measuring reservoir reading (cm) Ti = Initial time to record measuring reservoir level drop (min.) MRf = Final measuring reservoir reading (cm) Tf = Final time to record measuring reservoir level drop (min.) MR = Change in measuring reservoir level (cm) T = Change in time for measuring reservoir water drop (min.) V = flow volume (cm 3 )
27 Ksat Data Sheet Plot: Ksat 3 Conducted By: SJF Location: Bingham - front road Date: 4/23/10 Weather: cloudy Temp: 60 Soil Series/Horizon: Ge Source of Water: tap Plot hd r rs D Hi H/r di dsur i 1-ON 2-ON dsur f df Hf Mri Ti MRf Tf MR T V CF Q (cm 3 /min) Q (cm 3 /h) Ksat (cm/h) Ksat (cm/d) Ksat (in/h) Ksat (in/d) 1/Bt yes :18: :48: :30: yes :48: :18: :30: yes :18: :48: :30: yes :48: :18: :30: yes :18: :48: :30: yes :48: :18: :30: yes :18: :48: :30: yes :48: :18: :30: hd = Hole depth (cm) r = Radius of the hole (dia./2) (cm) rs = Distance between reference level and soil surface (cm) D = Distance from the hole bottom to the reference level (hd+rs) (cm) Hi = Initial desired water depth (head) in hole (cm) H/r = Ratio of head to radius of hole (must be 5) di = Constant-head tube setting, initial d measured in hole (di = D-Hi) (cm) - usually 1 cm less than calculated di dsur i = Initial distance from water surface to ground (hd - Hi) 1-ON = 3-way valve turned to 1-ON (CF = 20, multiply CF times MR to obtain volume of flow) 2-ON = 3-way valve turned to 2-ON (CF = 105, multiply CF times MR to obtain volume of flow) dsur f = Final distance from water surface to ground (steady state) df = Final d measured in hole (dsur f + rs) (cm) - should be within 1-2 cm of di Hf - Final water depth in hole (Hf = D-df) (cm) MRi = Initial measuring reservoir reading (cm) Ti = Initial time to record measuring reservoir level drop (min.) MRf = Final measuring reservoir reading (cm) Tf = Final time to record measuring reservoir level drop (min.) MR = Change in measuring reservoir level (cm) T = Change in time for measuring reservoir water drop (min.) V = flow volume (cm 3 )
28 Ksat Data Sheet Plot: Ksat-4 Conducted By: SJF Location: Bingham, road Date: 4/7/10 Weather: sunny Temp: 75 Soil Series/Horizon: Ge (shallow) Source of Water: tap Plot hd r rs D Hi H/r di dsur i 1-ON 2-ON dsur f df Hf Mri Ti MRf Tf MR T V CF Q (cm 3 /min) Q (cm 3 /h) Ksat (cm/h) Ksat (cm/d) Ksat (in/h) Ksat (in/d) 1/Bt yes :40: :10: :30: yes :10: :50: :40: yes :50: :20: :30: yes :20: :50: :30: yes :50: :20: :30: yes :20: :50: :30: yes :50: :20: :30: hd = Hole depth (cm) r = Radius of the hole (dia./2) (cm) rs = Distance between reference level and soil surface (cm) D = Distance from the hole bottom to the reference level (hd+rs) (cm) Hi = Initial desired water depth (head) in hole (cm) H/r = Ratio of head to radius of hole (must be 5) di = Constant-head tube setting, initial d measured in hole (di = D-Hi) (cm) - usually 1 cm less than calculated di dsur i = Initial distance from water surface to ground (hd - Hi) 1-ON = 3-way valve turned to 1-ON (CF = 20, multiply CF times MR to obtain volume of flow) 2-ON = 3-way valve turned to 2-ON (CF = 105, multiply CF times MR to obtain volume of flow) dsur f = Final distance from water surface to ground (steady state) df = Final d measured in hole (dsur f + rs) (cm) - should be within 1-2 cm of di Hf - Final water depth in hole (Hf = D-df) (cm) MRi = Initial measuring reservoir reading (cm) Ti = Initial time to record measuring reservoir level drop (min.) MRf = Final measuring reservoir reading (cm) Tf = Final time to record measuring reservoir level drop (min.) MR = Change in measuring reservoir level (cm) T = Change in time for measuring reservoir water drop (min.) V = flow volume (cm 3 )
29 Ksat Data Sheet Plot: Ksat-5 Conducted By: SJF Location: Bingham, road Date: 4/12/10 Weather: sunny Temp: 60 Soil Series/Horizon: yellow brown (Herndon) Source of Water: tap Plot hd r rs D Hi H/r di dsur i 1-ON 2-ON dsur f df Hf Mri Ti MRf Tf MR T V CF Q (cm 3 /min) Q (cm 3 /h) Ksat (cm/h) Ksat (cm/d) Ksat (in/h) Ksat (in/d) 1/Bt yes :00: :30: :30: yes :30: :00: :30: yes :00: :30: :30: yes :30: :00: :30: yes :20: :50: :30: yes :50: :20: :30: yes :20: :50: :30: yes :50: :20: :30: hd = Hole depth (cm) r = Radius of the hole (dia./2) (cm) rs = Distance between reference level and soil surface (cm) D = Distance from the hole bottom to the reference level (hd+rs) (cm) Hi = Initial desired water depth (head) in hole (cm) H/r = Ratio of head to radius of hole (must be 5) di = Constant-head tube setting, initial d measured in hole (di = D-Hi) (cm) - usually 1 cm less than calculated di dsur i = Initial distance from water surface to ground (hd - Hi) 1-ON = 3-way valve turned to 1-ON (CF = 20, multiply CF times MR to obtain volume of flow) 2-ON = 3-way valve turned to 2-ON (CF = 105, multiply CF times MR to obtain volume of flow) dsur f = Final distance from water surface to ground (steady state) df = Final d measured in hole (dsur f + rs) (cm) - should be within 1-2 cm of di Hf - Final water depth in hole (Hf = D-df) (cm) MRi = Initial measuring reservoir reading (cm) Ti = Initial time to record measuring reservoir level drop (min.) MRf = Final measuring reservoir reading (cm) Tf = Final time to record measuring reservoir level drop (min.) MR = Change in measuring reservoir level (cm) T = Change in time for measuring reservoir water drop (min.) V = flow volume (cm 3 )
30 Ksat Data Sheet Plot: Ksat-6 Conducted By: SJF Location: Bingham, road Date: 4/12/10 Weather: sunny Temp: 60 Soil Series/Horizon: ylw. brn. (Herndon)-swale Source of Water: tap Plot hd r rs D Hi H/r di dsur i 1-ON 2-ON dsur f df Hf Mri Ti MRf Tf MR T V CF Q (cm 3 /min) Q (cm 3 /h) Ksat (cm/h) Ksat (cm/d) Ksat (in/h) Ksat (in/d) 1/Bt yes :15: :45: :30: yes :45: :15: :30: yes :15: :45: :30: yes :45: :15: :30: yes :15: :45: :30: yes :45: :15: :30: hd = Hole depth (cm) r = Radius of the hole (dia./2) (cm) rs = Distance between reference level and soil surface (cm) D = Distance from the hole bottom to the reference level (hd+rs) (cm) Hi = Initial desired water depth (head) in hole (cm) H/r = Ratio of head to radius of hole (must be 5) di = Constant-head tube setting, initial d measured in hole (di = D-Hi) (cm) - usually 1 cm less than calculated di dsur i = Initial distance from water surface to ground (hd - Hi) 1-ON = 3-way valve turned to 1-ON (CF = 20, multiply CF times MR to obtain volume of flow) 2-ON = 3-way valve turned to 2-ON (CF = 105, multiply CF times MR to obtain volume of flow) dsur f = Final distance from water surface to ground (steady state) df = Final d measured in hole (dsur f + rs) (cm) - should be within 1-2 cm of di Hf - Final water depth in hole (Hf = D-df) (cm) MRi = Initial measuring reservoir reading (cm) Ti = Initial time to record measuring reservoir level drop (min.) MRf = Final measuring reservoir reading (cm) Tf = Final time to record measuring reservoir level drop (min.) MR = Change in measuring reservoir level (cm) T = Change in time for measuring reservoir water drop (min.) V = flow volume (cm 3 )
Determination of Design Infiltration Rates for the Sizing of Infiltration based Green Infrastructure Facilities
 Determination of Design Infiltration Rates for the Sizing of Infiltration based Green Infrastructure Facilities 1 Introduction This document, developed by the San Francisco Public Utilities Commission
Saturated Buffer. Subsurface Drainage PURPOSE N REDUCTION LOCATION COST BARRIERS
 Saturated Buffer To intercept tile drainage prior to discharging to surface waters and redistribute the water laterally in the soil profile of the streamside buffer. Subsurface drainage, also known as
BENEFITS FROM IMPROVING FLOOD IRRIGATION EFFICIENCY
 BENEFITS FROM IMPROVING FLOOD IRRIGATION EFFICIENCY Report of Progress 544 Agricultural Experiment Station Kansas State University, Manhattan Walter R. Woods, Director BENEFITS FROM IMPROVING FLOOD IRRIGATION
E. STORMWATER MANAGEMENT
 E. STORMWATER MANAGEMENT 1. Existing Conditions The Project Site is located within the Lower Hudson Watershed. According to the New York State Department of Environmental Conservation (NYSDEC), Lower Hudson
Physiographic zones. and water quality
 Southland Physiographic zones Central Plains Technical information Physiographic zones are part of the Water and Land 2020 & Beyond project that aims to maintain and improve water quality in the Southland
STORMWATER MANAGEMENT. 158 Attachment 2. Borough of Perkasie
 158 Attachment 2 Borough of Perkasie Appendix B Site Soil Evaluation and Soil Infiltration Testing Source: Pennsylvania Stormwater Best Management Practice Manual, December 2006. SITE SOIL EVALUATION AND
6.0 Runoff. 6.1 Introduction. 6.2 Flood Control Design Runoff
 October 2003, Revised February 2005 Chapter 6.0, Runoff Page 1 6.1 Introduction 6.0 Runoff The timing, peak rates of discharge, and volume of stormwater runoff are the primary considerations in the design
APPENDIX D EXTINCTION-DEPTH DETERMINATION
 APPENDIX D EXTINCTION-DEPTH DETERMINATION by Robert Freese SJRWMD 1 Page Intentionally Blank 2 EXTINCTION-DEPTH DETERMINATION Shah et al. (2007) define extinction depth as the depth to water table at which
HYDRIC SOILS. By Neal Svendsen Resource Soil Scientist Natural Resources Conservation Service Sept 2006
 HYDRIC SOILS By Neal Svendsen Resource Soil Scientist Natural Resources Conservation Service Sept 2006 Wetlands and Hydric Soils The term hydric soils proposed by Cowardin in 1979 Classification of Wetlands
Lift irrigation Using man or Animal power Using Mechanical or Electrical Power Flow irrigation a)inundation Irrigation b) Perennial Irrigation Direct
inundation Irrigation b) Perennial Irrigation Direct") Lift irrigation Using man or Animal power Using Mechanical or Electrical Power Flow irrigation a)inundation Irrigation b) Perennial Irrigation Direct irrigation Storage irrigation a)flow irrigation system:
Lift irrigation Using man or Animal power Using Mechanical or Electrical Power Flow irrigation a)inundation Irrigation b) Perennial Irrigation Direct irrigation Storage irrigation a)flow irrigation system:
Contents: Purpose and objective Water and energy conservation 1 1
 1 Chapter 1 Contents: 652.0100 Purpose and objective 1 1 652.0101 Water and energy conservation 1 1 652.0102 Soil conservation, water quality, and pollution abatement 1 2 652.0103 Using the guide 1 3 (a)
Irrigation Scheduling: Checkbook Method
 Know how. Know now. EC709 Irrigation Scheduling: Checkbook Method Steven R. Melvin, Extension Educator C. Dean Yonts, Extension Irrigation Specialist Irrigation scheduling helps determine when and how
DEPARTMENT OF ENVIRONMENTAL PROTECTION Bureau of Water Quality Protection. Design Criteria - Wetlands Replacement/Monitoring
 DEPARTMENT OF ENVIRONMENTAL PROTECTION Bureau of Water Quality Protection DOCUMENT NUMBER: 363-0300-001 TITLE: Design Criteria - Wetlands Replacement/Monitoring EFFECTIVE DATE: February 11, 1997 AUTHORITY:
Estimating the Seasonal High Water Table: A Mix of Art & Science
 Estimating the Seasonal High Water Table: A Mix of Art & Science PONDS WORKSHOP - SJRWMD Devo Seereeram, Ph.D., P.E. This paper was originally written over 4 years ago & generated a lot of interest. The
Standards for Soil Erosion and Sediment Control in New Jersey May 2012 STANDARD FOR GRASSED WATERWAYS. Definition. Purpose
 STANDARD FOR GRASSED WATERWAYS Definition A natural or constructed watercourse shaped or graded in earth materials and stabilized with suitable vegetation for the safe conveyance of runoff water. Purpose
PHYSICAL SOIL PROPERTIES
 PHYSICAL SOIL PROPERTIES Physical Soil Properties Santa Cruz County, California Scotts Valley Target Physical Soil Properties This table shows estimates of some physical characteristics and features that
Treated Municipal Wastewater Irrigation Guidelines EPB 235
 Treated Municipal Wastewater Irrigation Guidelines EPB 235 JAN 2014 1. Introduction 1.1 General The purpose of this guideline is to assist the owners of wastewater treatment works and consultants considering
Remediation of Sodium Contaminated Sites
 Remediation of Sodium Contaminated Sites..\..\3918b1ca23763e9e9a12ffd67acb0ceb.jpg 21 st International Petroleum Environmental Conference, Houston, Texas Mark Landress P.G. Project Navigator, Ltd. 10497
WETLAND DELINEATION REPORT
 WETLAND DELINEATION REPORT WHITMORE LAKE LOT WASHTENAW COUNTY, MICHIGAN JULY 2015 PREPARED FOR: WASHTENAW COUNTY PARKS AND RECREATION 2230 SOUTH PLATT ROAD ANN ARBOR, MICHIGAN 48104 PREPARED BY: THE MANNIK
Water Resources on PEI: an overview and brief discussion of challenges
 Water Resources on PEI: an overview and brief discussion of challenges Components: Components and links Atmospheric water Surface water (including glacial water) Groundwater Links: Precipitation (atm(
Appendix C. Soil Compost Amendment
 Appendix C. Soil Compost Amendment C.1 Description Soil restoration is a practice applied after construction, to deeply till compacted soils and restore their porosity by amending them with compost. These
Groundwater Balance Study in the High Barind, Bangladesh. A.H.M.Selim Reza 1, Quamrul Hasan Mazumder 1 and Mushfique Ahmed 1
 Rajshahi University J. of Sci. 39, 11-26 (2011) ISSN 1681-0708 Groundwater Balance Study in the High Barind, Bangladesh A.H.M.Selim Reza 1, Quamrul Hasan Mazumder 1 and Mushfique Ahmed 1 1 Department of
East Maui Watershed Partnership Adapted from Utah State University and University of Wisconsin Ground Water Project Ages 7 th -Adult
 INTRODUCTION What is groundwater? Water contained in saturated soil and rock materials below the surface of the earth. It is not NEW water, but is recycled water through the hydraulic cycle. The source
SECTION 3 NATURAL RESOURCES
 SECTION 3 NATURAL RESOURCES The natural environment plays a large role in planning for future development. Environmental conditions, such as topography, wetlands, floodplains, and water bodies, can often
Placement and Interpretation of Soil Moisture Sensors for Irrigated Cotton Production in Humid Regions SITE SELECTION IN A FIELD OBJECTIVE
 Brian Leib, University of Tennessee Jose Payero, Clemson University Lyle Pringle, Mississippi State University James Bordovsky, Texas A&M University Wesley Porter, University of Georgia Ed Barnes, Cotton
Private Sewage Permit Application
 Kneehill County 1600-2 Street NW Three Hills, AB T0M 2A0 Phone: 403-443-5541 Fax: 403-443-5115 Private Sewage Permit Application Permit Number Permit Type: Owner Contractor Development Permit Number: Application
SOIL P-INDEXES: MINIMIZING PHOSPHORUS LOSS. D. Beegle, J. Weld, P. Kleinman, A. Collick, T. Veith, Penn State & USDA-ARS
 SOIL P-INDEXES: MINIMIZING PHOSPHORUS LOSS D Beegle, J Weld, P Kleinman, A Collick, T Veith, Penn State & USDA-ARS Part of a larger national effort to improve the P Index and P Management Chesapeake Bay
The Clean Water Act Waters of the US Proposed Rule -- What is it and what are the implications for agriculture?
 The Clean Water Act Waters of the US Proposed Rule -- What is it and what are the implications for agriculture? August 1, 2014 1 Acronyms and Terms Agencies CWA WOTUS Rule FEMA USGS Environmental Protection
APPENDIX E. LESA Models
 APPENDIX E LESA Models LESA ASSESSMENT CALEXICO SOLAR FARM I PHASE A PROJECT AREA CALEXICO SOLAR FARM I PHASE A PROJECT (SW/4 Section 13, S/2 Section 14, S/2 NE/4 Section 15, NW/4 Section 15, T17S, R13E,
LAND APPLICATION OF SWINE MANURE
 CHAPTER 5a LAND APPLICATION OF SWINE MANURE Jim Camberato Land application of swine manure to crop and forest land is an effective way of recycling the nutrients back to the land. There are four key steps
Manure Storage for Environmental Management Systems
 WiMStor01 MStor Manure Storage for Environmental Management Systems Key: 1)Low Risk 2)Low-Moderate Risk 3)Moderate-High Risk 4)High Risk Location of Manure Storage Are the manure storage facilities in
Characteristics of Land Resources
 Chapter Chapter 1 Characteristics of Land Resources The geology, soils and topography of Woodford County T he geology, soils and topography of an area are important to the community planning process for
Transactions. American Geophysical Union Volume 28, Number 1 February 1947
 Transactions. American Geophysical Union Volume 28, Number 1 February 1947 EFFECT OF REMOVAL OF STREAM-BANK VEGETATION UPON WATER YIELD Earl G. Dunford and P. W. Fletcher Abstract--This is a preliminary
SOUTH FLORIDA WATER MANAGEMENT DISTRICT. Question 13: Wetlands
 SOUTH FLORIDA WATER MANAGEMENT DISTRICT Question 13: Wetlands 1. The wetland responses and topographical data provided in the ADA for the 520- acre project site are conceptual in nature. The referenced
Erosion & Sedimentation Control Policy
 Issue Date 10/22/2010 Page 1 of 8 Erosion & Sedimentation Control Policy Introduction: Soil erosion is the removal of soil by water, wind, ice or gravity and sediment deposition occurs when the rate of
Streamlines V2, n2 (May 1997) A Newsletter for North Carolina Water Supply Watershed Administrators
 A Newsletter for North Carolina Water Supply Watershed Administrators") Page 1 of 5 STREAMLINES A Newsletter for North Carolina Water Supply Watershed Administrators Volume 2, Number 2 May 1997 Non-Point Source (NPS) Pollution This issue of Streamlines provides basic information
Page 1 of 5 STREAMLINES A Newsletter for North Carolina Water Supply Watershed Administrators Volume 2, Number 2 May 1997 Non-Point Source (NPS) Pollution This issue of Streamlines provides basic information
Ponds. Pond A water impoundment made by excavating a pit, or constructing a dam or an embankment.
 POND SITE SELECTION AND CONSTRUCTION Uses, Planning, & Design David Krietemeyer Area Engineer USDA-NRCS June 20, 2008 Uses Considerations for Location of Commonly Used Terms Pond A water impoundment made
Irrigating Efficiently: tools, tips & techniques. Steve Castagnoli, OSU Extension Service
 Irrigating Efficiently: tools, tips & techniques Steve Castagnoli, OSU Extension Service Tonight s class: Why plants need water When plants need water How much water plants need Soil as a reservoir of
Constructed Wetland Channel T-9
 Description A constructed wetland channel is a conveyance BMP that is built, in part, to enhance stormwater quality. Constructed wetland channels use dense vegetation to slow down runoff and allow time
Transitioning from the Percolation Test to Soils Evaluation Colorado Environmental Health Association Annual Education Conference 2015
 Transitioning from the Percolation Test to Soils Evaluation Colorado Environmental Health Association Annual Education Conference 2015 Roy Laws, P.E. Jefferson County Public Health Warren S. Brown, P.E.
New Castle County, DE. Floodplain Regulations
 New Castle County, DE Floodplain Regulations John J. Gysling, PE CFM Department of Land Use New Castle County, DE February 26, 2009 Today s Presentation Floodplain Protection and Uses Terms and Definitions
Appendix A Literature Review - Septic System Performance Criteria, Technologies, and Cost Factors
 Appendix A Literature Review - Septic System Performance Criteria, Technologies, and Cost Factors TECHNICAL MEMORANDUM Appendix A - Literature Review Septic System Performance Criteria, Technologies,
PIMA COUNTY COMPREHENSIVE PLAN CO PIMA COUNTY REGIONAL COMPREHENSIVE PLAN POLICY MAJOR PLAN AMENDMENT
 PIMA COUNTY COMPREHENSIVE PLAN CO7-07-04 PIMA COUNTY REGIONAL COMPREHENSIVE PLAN POLICY MAJOR PLAN AMENDMENT Arizona law [A.R.S. 11-821(C)(3)] requires: Planning for water resources that addresses: a)
Vadose Zone Monitoring of Fields Irrigated with Recycled Processing and Municipal Wastewaters.
 Vadose Zone Monitoring of Fields Irrigated with Recycled Processing and Municipal Wastewaters. Diganta D. Adhikari *, Dave Goorahoo, and Florence Cassel S. Center for Irrigation Technology, California
Design Guideline for Gravity Systems in Soil Type 1. January 2009
 Design Guideline for Gravity Systems in Soil Type 1 January 2009 This page is intentionally blank. Design Guideline for Gravity Systems in Soil Type 1 January 2009 For information or additional copies
POLICY FOR NATURAL RESOURCE MANAGEMENT AREAS
 POLICY FOR NATURAL RESOURCE MANAGEMENT AREAS I. POLICY STATEMENT Auburn University's (the University's) "Policy for Natural Resource Management Areas" implements the Campus Master Plan Land Use Element
Appendix 12. Pollutant Load Estimates and Reductions
 Appendix 12. Pollutant Load Estimates and Reductions A pollutant loading is a quantifiable amount of pollution that is being delivered to a water body. Pollutant load reductions can be calculated based
August 15, 2006 (Revised) July 3, 2006 Project No A
 July 3, 2006 Project No A") August 15, 2006 (Revised) July 3, 2006 Project No. 01-05-0854-101A Mr. David Reed, P.E. Protean Design Group 100 East Pine Street, Suite 306 Orlando, Florida 32801 Preliminary Soil Survey Report Polk Parkway
August 15, 2006 (Revised) July 3, 2006 Project No. 01-05-0854-101A Mr. David Reed, P.E. Protean Design Group 100 East Pine Street, Suite 306 Orlando, Florida 32801 Preliminary Soil Survey Report Polk Parkway
Soil Resources Analysis Hurricane Ivan-RCW Expansion Project Conecuh National Forest
 Soil Resources Analysis Hurricane Ivan-RCW Expansion Project Conecuh National Forest Current Conditions of Soil Resources: The project area is wide spread across the forest, the result of a large scale
Iowa Senate Natural Resources Committee February 3, 2015
 Iowa Senate Natural Resources Committee February 3, 2015 Dr. Matthew Helmers Dean s Professor, College of Agriculture & Life Sciences Professor, Department of Agricultural & Biosystems Engineering mhelmers@iastate.edu,
Constructed Wetland Use in Nonpoint Source Control
 Constructed Wetland Use in Nonpoint Source Control Description Constructed wetlands are excavated basins with irregular perimeters and undulating bottom contours into which wetland vegetation is purposely
East TX Test Site (1/2 Treated)
") 1 East TX Test Site (1/2 Treated) 2 CATION EXCHANGE CAPACITY ( CEC ) It is a measure of the quantity of cations reversibly adsorbed per unit weight of soil. CEC is expressed in meq/100 g of mass (meq is
1 East TX Test Site (1/2 Treated) 2 CATION EXCHANGE CAPACITY ( CEC ) It is a measure of the quantity of cations reversibly adsorbed per unit weight of soil. CEC is expressed in meq/100 g of mass (meq is
Nutrient Management in. A presentation to the West Metro Water Alliance
 Nutrient Management in Developing and Agricultural Areas A presentation to the West Metro Water Alliance Chris Meehan, P.E. May 25, 2011 Agenda Physical Improvements Planning Improvements How to get it
GI BMP Training Program Review Worksheets
 GI BMP Training Program Review Worksheets 2/7/2013 Version 1 ANSWER KEY Instructions: Use the worksheets as a guide to review key learning points and information provided during the training program. Depending
Stormwater Volume and Treatment Methods Simplifying the Numbers. IAFSM March 10, Presented by: Tom Powers P.E., CFM, LEED AP, CPESC
 Stormwater Volume and Treatment Methods Simplifying the Numbers IAFSM March 10, 2011 Presented by: Tom Powers P.E., CFM, LEED AP, CPESC Introduction GOALS: Improve understanding of Rate and Volume (Quantity)
Phosphorus for the Ontario CCA 4R Nutrient Management Specialty
 Ontario CCA 4R Nutrient Management Workshop Wednesday, 18 January 2017 Woodstock, Ontario, Canada Phosphorus for the Ontario CCA 4R Nutrient Management Specialty Tom Bruulsema, Phosphorus Program Director
HOW CHANGES IN NUTRIENT MANAGEMENT REGULATIONS WILL AFFECT FORAGE PRODUCTION
 HOW CHANGES IN NUTRIENT MANAGEMENT REGULATIONS WILL AFFECT FORAGE PRODUCTION Dick Wolkowski and Larry Bundy Department of Soil Science University of Wisconsin What are the issues Forage producers typically
The City of Cocoa (City) is located in east
 is located in east") FWRJ Reclaimed Water and Stormwater: A Perfect Pair to Meet Total Maximum Daily Load Wasteload Allocations? Danielle Honour, James Wittig, John A. Walsh, and Don Stevens Danielle Honour, P.E., D.WRE, and
FWRJ Reclaimed Water and Stormwater: A Perfect Pair to Meet Total Maximum Daily Load Wasteload Allocations? Danielle Honour, James Wittig, John A. Walsh, and Don Stevens Danielle Honour, P.E., D.WRE, and
OPERATING CONTROLLED DRAINAGE AND SUBIRRIGATION SYSTEMS
 OPERATING CONTROLLED DRAINAGE AND SUBIRRIGATION SYSTEMS Prepared by: Robert Evans, Extension Specialist and Wayne Skaggs,William Neal Reynolds Professor Department of Biological and Agricultural Engineering
Infiltration Guidelines
 Appendix E Infiltration Guidelines As a stormwater management method, infiltration means retaining or detaining water within soils to reduce runoff. Infiltration can be a cost-effective method to manage
RI Site Specific Soil Mapping Standards and Procedures
 RI Site Specific Soil Mapping Standards and Procedures Understanding Hydrologic Soil Groups and Site Specific Mapping URI Coastal Institute, Kingston June 28 th 2012 Jillian Phillips URI Cooperative Extension
VIRGINIA POLLUTION ABATEMENT PERMIT APPLICATION
 VIRGINIA POLLUTION ABATEMENT PERMIT APPLICATION FORM B ANIMAL WASTE Department of Environmental Quality VPA FORM B ANIMAL WASTE INSTRUCTIONS This form is to be completed by applicants requesting a VPA
SW-74 SERENOVA PRESERVE SITES 2, 3, 4, 8 MITIGATION PLAN
 SW-74 SERENOVA PRESERVE SITES 2, 3, 4, 8 MITIGATION PLAN BACKGROUND INFORMATION Project SWIM? Aquatic Control? Exotic Control? Mitigation Bank? Type No No No No Mitigation Restoration and enhancement Type
Topsoil Loss and Modification During Suburbanization: Impact on Demands for Municipal Water. R.G. Darmody
 Topsoil Loss and Modification During Suburbanization: Impact on Demands for Municipal Water R.G. Darmody Department of Natural Resources and Environmental Sciences University of Illinois The Problem Demands
Phosphorus for the Ontario CCA 4R Nutrient Management Specialty
 Ontario CCA 4R Nutrient Management Workshop Thursday, July 21, 2016 Holiday Inn, Guelph Phosphorus for the Ontario CCA 4R Nutrient Management Specialty Tom Bruulsema, Phosphorus Program Director Lake Erie
Constructed Wetland Pond T-8
 Constructed Wetland Pond T-8 Description A constructed wetlands pond is a shallow retention pond designed to permit the growth of wetland plants such as rushes, willows, and cattails. Constructed wetlands
Issue paper: Aquifer Water Balance
 Issue paper: Aquifer Water Balance 1. Introduction And Background 1.1. Purpose and Scope The population in Kitsap County has grown rapidly in recent years and is expected to increase substantially in the
Sizing Irrigation Fields
 GRAYWATER CURRICULUM Sizing Irrigation Fields Class 3 Objectives 1. Soil composition 2. Evapotranspiration 3. Determine Graywater Irrigation Fields Graywater production Determine water budget Calculating
Prepared and Published by Irrigation Industry Association of British Columbia (IIABC) Editors
 Editors") Agriculture Pivot Irrigation Scheduling Calculator Users Guide Prepared and Published by (IIABC) Editors Andrew Petersen, P.Ag. CID Ted W. van der Gulik, P.Eng. April 2009 www.irrigationbc.com TABLE OF
Agriculture Pivot Irrigation Scheduling Calculator Users Guide Prepared and Published by (IIABC) Editors Andrew Petersen, P.Ag. CID Ted W. van der Gulik, P.Eng. April 2009 www.irrigationbc.com TABLE OF
Producer Statement. Design: On-Site Effluent Disposal Systems (AS/NZS 1547:2000)
") Updated 04/09/13 Producer Statement Design: On-Site Effluent Disposal Systems (AS/NZS 1547:2000) Issued by : To : To be supplied to: Property Location:. (approved qualified design professional) (owner)
Updated 04/09/13 Producer Statement Design: On-Site Effluent Disposal Systems (AS/NZS 1547:2000) Issued by : To : To be supplied to: Property Location:. (approved qualified design professional) (owner)
Irrigation Scheduling for Urban and Small Farms
 Irrigation Scheduling for Urban and Small Farms Urban and Small Farm Workshop February 18, 2015 Presentation by L. Niel Allen Extension Irrigation Engineer n.allen@usu.edu http://extension.usu.edu/irrigation/
TORCH LAKE TOWNSHIP WATER QUALITY ACTION PLAN
 TORCH LAKE TOWNSHIP WATER QUALITY ACTION PLAN Elk-River-Chain-of-Lakes Gaps Analysis Project The Watershed Center Grand Traverse Bay Tip of the Mitt Watershed Council Michigan Department of Natural Resources
Design Features of Constructed Wetlands for Nonpoint Source Treatment. September 1995
 Design Features of Constructed Wetlands for Nonpoint Source Treatment September 1995 Brochure written by William W. Jones, School of Public and Environmental Affairs, Indiana University, Bloomington, Indiana.
Municipal Stadium Wetland
 W A T E R S H E D F A C T S Total watershed area 140 mi 2 Average annual rainfall 38 in Average annual temperature 58 F Elevation Max 1321 ft Min 899 ft C. J. Brown Reservoir controls flow from 83 mi 2
Pennsylvania Stormwater Best Management Practices Manual. Chapter 3. Stormwater Management Principles and Recommended Control Guidelines
 Pennsylvania Stormwater Best Management Practices Manual Chapter 3 Stormwater Management Principles and Recommended Control Guidelines 363-0300-002 / December 30, 2006 Chapter 3 Stormwater Management Principles
15. Soil Salinity SUMMARY THE ISSUE
 15. Soil Salinity AUTHORS: B.H. Wiebe, R.G. Eilers, W.D. Eilers and J.A. Brierley INDICATOR NAME: Risk of Soil Salinization STATUS: Provincial coverage (AB, SK, MB), 1981 to 2001 SUMMARY At very low levels,
33. Fate of pesticides in soil and plant.
 33. Fate of pesticides in soil and plant. What Happens to Pesticides When a pesticide is released into the environment many things happen to it. Sometimes what happens is beneficial. For example, the leaching
Definitions 3/16/2010. GG22A: GEOSPHERE & HYDROSPHERE Hydrology
 GG22A: GEOSPHERE & HYDROSPHERE Hydrology Definitions Streamflow volume of water in a river passing a defined point over a specific time period = VxA discharge m 3 s -1 Runoff excess precipitation - precipitation
Stormwater Standards. Clackamas County Service District No. 1. Infiltration Testing Guide
 Stormwater Standards Clackamas County Service District No. 1 APPENDIX E Infiltration Testing Guide Table of Contents Appendix E - Infiltration Testing Guide... Page E.1 General... 1 E.2 Basic Method -
SUBSURFACE INFILTRATION SYSTEM DESCRIPTION. Alternative Names: Sump, Drywell, Infiltration Trench, Infiltration Galleries, Leach Fields
 4.1-d SUBSURFACE INFILTRATION SYSTEM Alternative Names: Sump, Drywell, Infiltration Trench, Infiltration Galleries, Leach Fields BMP DESIGN APPROACH Pollutant Source Control Hydrologic Source Control Stormwater
Producer Statement. Design: On-Site Effluent Disposal Systems (AS/NZS 1547:2012)
") Producer Statement Design: On-Site Effluent Disposal Systems (AS/NZS 1547:2012) Issued by: To: To be supplied to: Property Location:. (approved qualified design professional) (owner) Kaipara District Council...
Producer Statement Design: On-Site Effluent Disposal Systems (AS/NZS 1547:2012) Issued by: To: To be supplied to: Property Location:. (approved qualified design professional) (owner) Kaipara District Council...
CHAPTER FIVE Runoff. Engineering Hydrology (ECIV 4323) Instructors: Dr. Yunes Mogheir Dr. Ramadan Al Khatib. Overland flow interflow
 Instructors: Dr. Yunes Mogheir Dr. Ramadan Al Khatib. Overland flow interflow") Engineering Hydrology (ECIV 4323) CHAPTER FIVE Runoff Instructors: Dr. Yunes Mogheir Dr. Ramadan Al Khatib Overland flow interflow Base flow Saturated overland flow ١ ٢ 5.1 Introduction To Runoff Runoff
Engineering Hydrology (ECIV 4323) CHAPTER FIVE Runoff Instructors: Dr. Yunes Mogheir Dr. Ramadan Al Khatib Overland flow interflow Base flow Saturated overland flow ١ ٢ 5.1 Introduction To Runoff Runoff
Appendix A. Infiltration and Soil Texture Testing Methods. Appendix A. A.1 General Description. A.2 Infiltration Testing: A Four-Step Process
 Infiltration and Soil Texture Testing Methods A.1 General Description Appendix A A.2 Infiltration Testing: A Four-Step Process A.3 Other Soil Tests A.3.1 Soil Compaction Bulk Density Tests A.3.2 Soil Contamination
NEW CASTLE CONSERVATION DISTRICT. through. (Name of Municipality) PLAN REVIEW APPLICATION DRAINAGE, STORMWATER MANAGEMENT, EROSION & SEDIMENT CONTROL
 PLAN REVIEW APPLICATION DRAINAGE, STORMWATER MANAGEMENT, EROSION & SEDIMENT CONTROL") NEW CASTLE CONSERVATION DISTRICT through (Name of Municipality) PLAN REVIEW APPLICATION DRAINAGE, STORMWATER MANAGEMENT, EROSION & SEDIMENT CONTROL Office use only: Received by Municipality: Received by
NEW CASTLE CONSERVATION DISTRICT through (Name of Municipality) PLAN REVIEW APPLICATION DRAINAGE, STORMWATER MANAGEMENT, EROSION & SEDIMENT CONTROL Office use only: Received by Municipality: Received by
Water Budget IV: Soil Water Processes P = Q + ET + G + ΔS
 Water Budget IV: Soil Water Processes P = Q + ET + G + ΔS Infiltration Infiltration capacity: The maximum rate at which water can enter soil. Infiltration capacity curve: A graph showing the time-variation
Effects of Prescribed Burning on Stream Water Quantity, Quality, and fuel loads in a Small Piedmont Watershed in North Carolina
 Effects of Prescribed Burning on Stream Water Quantity, Quality, and fuel loads in a Small Piedmont Watershed in North Carolina Matthew Haunsperger Johnny Boggs, Ge Sun, Michael Gavazzi USDA Forest Service
Small-Scale Farmers and the Environment: How to be a Good Steward
 L P E S Small Farms Fact Sheet series Livestock and Poultry Environmental Stewardship < L P E S > Curriculum : How to be a Good Steward By Mark Rice, North Carolina State University Summary Good stewardship
COON CREEK WATERSHED DISTRICT PERMIT REVIEW. Spring Lake Park Schools Westwood Middle School st Avenue NE, Spring Lake Park, MN 55432
 PAN 16-112, Westwood Middle School, Page 1 of 6 COON CREEK WATERSHED DISTRICT PERMIT REVIEW MEETING DATE: August 22, 2016 AGENDA NUMBER: 10 FILE NUMBER: 16-112 ITEM: Westwood Middle School RECOMMENDATION:
NATURAL FEATURES, LAND SUITABILITY FOR DEVELOPMENT AND DEVELOPMENT CONCERNS
 East Central Wayne County Comprehensive Plan - Natural Features, Land Suitability Page 170 NATURAL FEATURES, LAND SUITABILITY FOR DEVELOPMENT AND DEVELOPMENT CONCERNS Introduction The residents of East
Introduction. Welcome to the Belgium Study Abroad Program. Courses:
 Introduction Welcome to the Belgium Study Abroad Program Courses: AGSM 335: Soil and Water Management BAEN 460: Principals of Environmental Hydrology BAEN 460 / AGSM 335 Combined lecture and HW sessions
Runoff Processes. Daene C. McKinney
 CE 374 K Hydrology Runoff Processes Daene C. McKinney Watershed Watershed Area draining to a stream Streamflow generated by water entering surface channels Affected by Physical, vegetative, and climatic
Land Application and Nutrient Management
 MODULE D Land Application and Nutrient Management Figure 34-13. Relationship between the concentration of dissolved P in subsurface drainage from 30 cm deep lysimeters and the Mehlich-3 extractable soil
STATE OF MINNESOTA MINNESOTA POLLUTION CONTROL AGENCY
 STATE OF MINNESOTA MINNESOTA POLLUTION CONTROL AGENCY In the Matter of the Decision on the Need for an Environmental Impact Statement for the Proposed Remer Wastewater Treatment Facility Expansion FINDINGS
RIPARIAN FOREST BUFFER
 RIPARIAN FOREST BUFFER (Acres) Code 391 Natural Resources Conservation Service Conservation Practice Standard I. Definition An area predominantly of trees and shrubs that functions as a vegetated ecotone
November 13, IP3406. Mr. Uriah Sowell Rooney Engineering 115 Inverness Drive East, Suite 300, Englewood, CO 80112
 November 13, 2015 103IP3406 Mr. Uriah Sowell Rooney Engineering 115 Inverness Drive East, Suite 300, Englewood, CO 80112 Subject: Infiltration Testing Hopeland Road Valve Site Sunoco Pennsylvania Pipeline
LAT IS ALL we sell in agriculture. Whether
 B-6152 6-04 Grain Sorghum Irrigation Leon New* LAT IS ALL we sell in agriculture. Whether the enterprise ER is corn, cattle, cauliflower, cotton, or grain sorghum water is essential for its production
Part 624 Drainage National Engineering Handbook
 United States Department of Agriculture Natural Resources Conservation Service Chapter 10 Drainage Issued April 2001 The U.S. Department of Agriculture (USDA) prohibits discrimination in all its programs
Treatment Volume: Curve Numbers. Composite CN or Not? Treatment Volume: Curve Numbers. Treatment Volume: Calculation. Treatment Volume: Calculation
 Stormwater Engineering Bioretention Design Bill Hunt, PE, Ph.D. Extension Specialist & Assistant Professor NCSU-BAE www.bae.ncsu.edu/stormwater Bioretention Design Six Step Process 1 Determine Volume to
Simulating Regeneration Dynamics in Upland Oak Stands
 Simulating Regeneration Dynamics in Upland Oak Stands Powered By Powered by: USDA Forest Service Southern Research Station Dr. David Loftis Powered By Powered by: Regen for Excel is a simulation model
Infiltration Testing For Stormwater BMPs: What Would Mickey Mouse Do?
 Infiltration Testing For Stormwater BMPs: What Would Mickey Mouse Do? CCLC Turning A New Leaf November 3, 2017 David J. Hirschman Hirschman Water & Environment, LLC www.hirschmanwater.com dave@hirschmanwater.com