Hydrologic Analysis Techniques ( 87 Manual Hydrology Tools )
|
|
|
- Brett Garrett
- 6 years ago
- Views:
Transcription

1 Hydrologic Analysis Techniques ( 87 Manual Hydrology Tools )

2 Objectives Know which wetland applies to which technique Define the Wetland Water Budget Locate data Understand the time step Understand Limitations
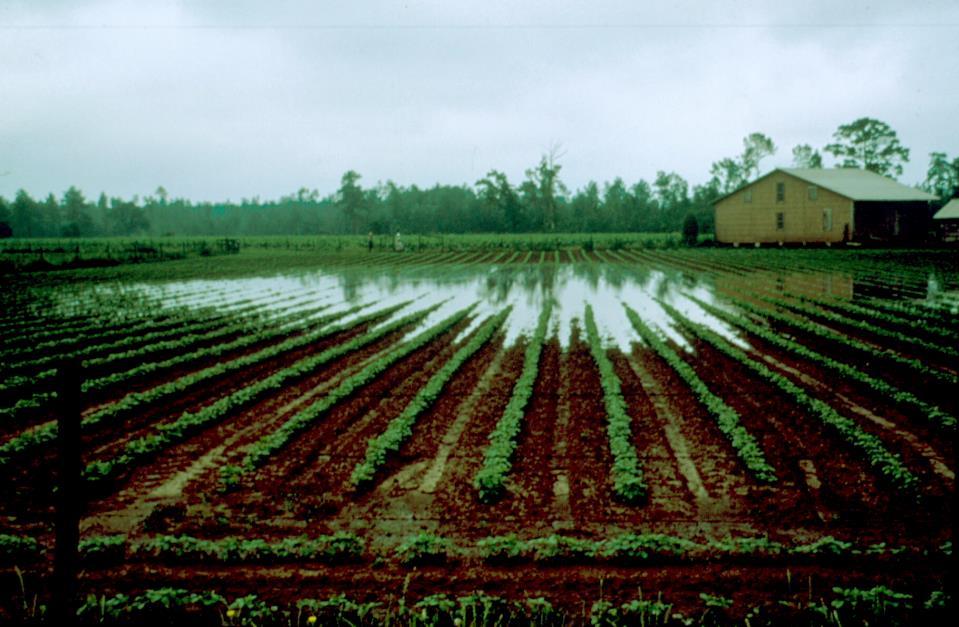
3 Objective Criteria Farmed Wetland (FW) Inundated for 15 Continuous Days In most years (50% chance or more) During Growing Season USACE Groundwater Monitoring for Wetland (W) Saturated Within 12 of surface 50% Annual Probability During Growing Season 15 Continuous Days Slide 3
4 Probabilities (What does in a normal year mean?) 50% chance can be: Median Middle number in a population 2-yr Log-Pearson Commonly used for return period of annual peak discharges 50 th Percentile Calculated from a Weibull Plot Slide 4
5 Probability/Duration Analysis Analysis can be performed on: Stream gage records Groundwater levels Lake Stages Ponded Storage Example Results: 50% Chance annual probability of 7 days of continuous inundation 80% Chance annual probability of 20 days of saturation within 6 of the surface 80% Chance probability of inundation to depth of 3 Slide 5
6 Simplified Water Budgeting I O = ΔS (Inflow Outflow = Change in Storage) Inflows and Outflows: P = Precipitation R i = Surface Runoff in R o = Surface Runoff out G i = Groundwater discharge in G o = Groundwater recharge out ET = Evapotranspiration
7 The Time Step Monthly Simplified Water Budgeting Daily Most hydrology modeling techniques, including SPAW Model Sub-Hourly DRAINMOD Converts Daily Precipitation to sub-hourly distribution
8 Wetland Storage Surface Storage Topographic Storage using Stage-Storage Curve Depth of Storage if topography is relatively flat and area of inundation changes little with increasing depth in the Surface Roughness Storage Soil Storage Use Available Water Capacity in Simplified Method
9 Applicable Wetland Type Simplified Limited to Recharge DEPRESSION HGM Class Monthly Time Step Soil Storage Loss stops when moisture is at Permanent Wilting Point Soil is full at saturation (higher than field capacity) R o occurs when topographic storage depth is exceeded Depression area varies little with depth, volume is expressed as depth All other water budget parameters expressed as depth G i neglected, G o stops when profile is saturated
10 Monthly Precipitation, P WETS Table Tables
11 Soil Storage 0 to 5 inches 0.23 in/in 5 to 32 inches 0.16 in/in Assume root depth (24?) (5 x 0.23) + (19 x 0.16) = 4.19
12 Monthly Evapotranspiration NOAA Atlas 34 Data for Scottsbluff, NE January 1.51 February 1.89 March 3.14 April 5.10 May 6.95 June 8.46 July 9.77 August 8.60 September 6.04 October 4.32 November 2.38 December 1.59 Animal Waste Management (AWM) Software has monthly evaporation files
13 Surface Runoff Runoff Curve Number Method Curve Numbers Meant for use with daily rainfall Must convert RCN to CN 30 for use with monthly rainfall This method used by the AWM program for feedlot runoff The CN 30 is the 30 day Curve Number CN 30 = CN 1 (CN 1 ((CN1^2.365)/631.79) - 15) log 30 CN of 85 = CN 30 of 67

14 Example: Use: WETS Monthly Rainfall Monthly Evaporation Data Given Soil Storage of 4.19 Assume: Overflow Depth of 1 feet Watershed to Depression Ration of 20:1 CN 30 = 67
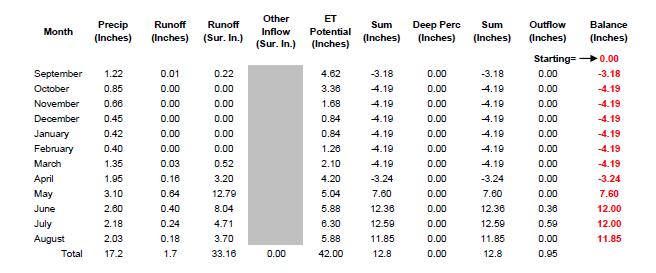
15 Solution:
16 SPAW -- A DAILY HYDROLOGIC MODEL FOR FIELDS AND PONDS A Numerical Model for Recharge Depressions K. E. Saxton USDA/ARS Pullman, WA Patrick Willey USDA/NRCS Portland, OR
17
18 SPAW MODEL Applications Daily hydrologic budgets of agricultural fields, ponds, and wetlands. Realistic and accurate water budgets with general site descriptions, data and parameters. Long-term simulations and analyses with reasonable computer time.
19
20 MODEL CONFIGURATION SPAW: Soil-Plant-Air-Water model providing daily vertical water budget of agricultural fields. POND: Model providing daily inundated pond water budget. FIELD: Model providing daily soil moisture balance, runoff and recharge Pond budget linked to field(s) hydrology -- precipitation, runoff, interflow, evaporation

21 File Edit Options Data Projects Field/Pond View Window Help/Tutorial MAIN SCREEN

22 Agricultural Field Hydrology

23 SPAW FIELD ANALYSES Daily water budgets of dryland and irrigated fields. Crop water stress, irrigation water requirements and schedules. Runoff, percolation, soil water profiles Nitrogen budgets

24 FIELD Data Inputs Climate: Precip., evap., temp. Crop: Canopy, greeness, roots Soil: depths, textures Management: crop rotations, irrigation

25 Graphical Output Select Variable: Daily Precip. Accum. Precip. Daily runoff Accum. runoff
26 Wetland / Pond / Reservoir
27 SPAW-POND Analyses Daily ponded water budgets inflows, storage, evaporation, seepage, outflows. Wetland frequency and duration of inundation. Lagoon design and operations. Water supply design for livestock or irrigation.

28 POND Description Field(s) hydrology Depth-Area relationship Infiltration, seepage Depths: outlets, spillways, pumps inlets Watertable depths Pumping rates & times

29 POND Graphical Output Select Variable: Daily Precip. Pond Depth Accum. Evap. Accum. seepage
30 Wetland Statistical Analyses PERCENTAGE OF YEARS POND DEPTH GREATER THAN GIVEN DEPTHS(10% INTERVALS)FOR 14 CONSECUTIVE DAYS DURING THE WETLAND GROWING SEASON: Apr 1 TO Sep 30 DEPTH (FT): DRY AREA (AC): YEARS (%) : 84% 84% 74% 61% 52% 52% 45% 29% 19% 6% 0%

31 Stream Gage Data Analysis Long Term Ponding Riverine HGM Class Wetland Sites Temporary Flooding Slide 31
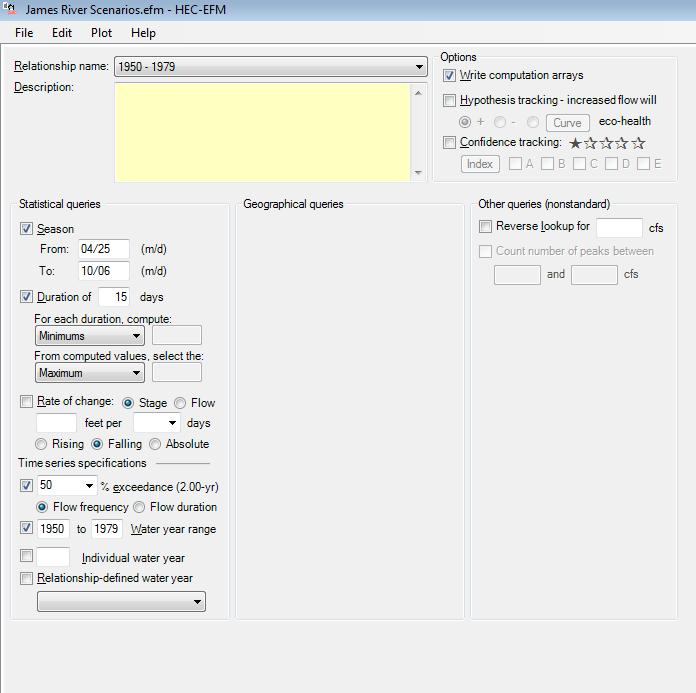
32 Training Session Objective To demonstrate how gage data can be used in the wetland determination process To show how gage data information can be useful in hydrology restoration planning To Show how other data can be statistically analyzed To Introduce the HEC-EFM Software

33 Will flood inundation analysis work in your Area? Daily Mean Flow Data is the Default Daily Peak and Minimum Data Sometimes Available Daily Stage Sometimes Available Slide 33

34 Will it work in your Area? Typical Peak Duration? Slide 34

35 Will it work in your Area? Web Soil Survey Flooding Duration Brief 2 to < 7 days Frequency Frequent - >50 times in 100 years Slide 35

36 Western Snowmelt Hydrographs Long Durations But low peaks Slide 36


37 Other Parameters - Peak Discharges Instantaneous Peak Discharges (50% Chance Annual Probability) Fill Floodplain Depressions (Duration from Water Budgeting) Slide 37
38 Data Requirements for Floodplain Inundation Analysis Continuous Flow Values for 10 years (minimum) up to 30 years Topographic Information for potential wetland site Cross Section of Stream Channel or Channel Rating Information Water Surface Profile Information if Site is not adjacent to gage
39 Sources of Data USGS-NWIS COE, TVA, BOR, NOAA State Water Resource Agencies Data usually includes Daily Mean Flow May Include Stage, Peak Flows, Minimum Flows, Flow Statistics
40 USGS Qualitative Adjectives Assigned to Mean Daily Discharges Excellent - 95% of Daily Discharge Within 5% of Rating Curve Good Fair Poor - 95% of Daily Discharge Within 10% of Rating Curve - 95% of Daily Discharge Within 15% of Rating Curve - Daily Discharges Have Less than Fair Accuracy

41 Data Requirements Flow Data Mean Daily Flow File Gage Datum Slide 41

42 Data Requirements Flow Data Order: Text File, Tab-delimited Can open in Spreadsheet Flow Date Slide 42
43 Data Requirements Channel Rating Gage Height Flow Slide 43
44 NRCS Guidance on Rating Curves Slide 44

45 Site Topography USGS Quad Maps James Huron, South Dakota 15-day, 50% chance Flow obviously Exceeds 10 ft. floodplain contour Site Gage Station Slide 45

46 Water Surface Profiles HEC-GeoRAS Product Slide 46
47 Determine Lowest Flow/Stage for Each Duration Procedures: Determine the Growing Season Determine the Appropriate Duration of Inundation Locate the Closest Stream or Lake Gage Obtain Mean Daily Flow Values for Growing Season
48 Procedures Continued: Determine the Highest of the Annual Low Duration Flows for Each Year Tabulate Flow/Stage in Descending Order Determine the Median Value of Flow/Stage Associate Median Value With Elevation
49 Procedures Continued If 50% Chance is Discharge, Relate it to Elevation If Available, Use Computerized Stream Flow Data Determine Area Inundated Critical Duration
50 Day Oct Nov Dec Jan Feb Mar Apr May Jun Jul Aug Sep
51 Day Oct Nov Dec Jan Feb Mar Apr May Jun Jul Aug Sep
52 Day Oct Nov Dec Jan Feb Mar Apr May Jun Jul Aug Sep
53 Day Oct Nov Dec Jan Feb Mar Apr May Jun Jul Aug Sep
54 Day Oct Nov Dec Jan Feb Mar Apr May Jun Jul Aug Sep
55 Day Oct Nov Dec Jan Feb Mar Apr May Jun Jul Aug Sep
56 Year Discharge
57 Rank Discharges
58 Year Discharge Ranked
59 Year Discharge Ranked
60 Year Discharge Ranked Median Value = ( )/2 = 759 cfs

61 Exercise 1. Determine elevation from rating curve 2. Draw Contour on Map 3. What is your answer?
")
62 HEC Ecosystem Functions Model (EFM) Slide 62
63 Slide 63
64 Slide 64
65 Slide 65
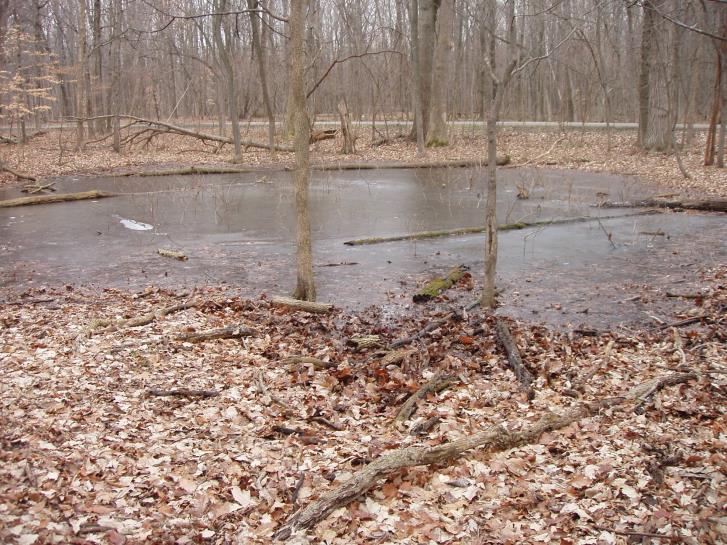
66 Observation Wells
67 Objectives Upon completion of the training you will be able to: - Describe the parts of an observation well and the materials used to install them - Install observation wells to document duration and frequency of saturation - List and explain uses of observation wells and piezometers - Gather and interpret monitoring well data needed to obtain statistically significant results - List general guidelines for reviewing well selection, installation and data collection procedures, and data analysis
68 Observation Wells Monitoring a Shallow Water Table Correct instrumentation (observation well or piezometer) Correct installation Correct data collection, daily readings during growing season critical time Correct interpretation of data
69 Site Evaluation Start with a good soil profile description Respect all impermeable layers Plug any holes into or through with impermeable material

70 Water Table The upper surface of the zone of saturation is called the water table. The hydraulic pressure at any level within a water-table aquifer is equal to the depth from the water table to the point in question and may be expressed as hydraulic head in feet of water.

71 ENDOSATURATION >=200 cm Typical application of observation wells, Scope and Effect equations, DRAINMOD Endosaturation: The soil is saturated with water in all layers from the upper boundary of saturation to a depth of 200 cm or more from the mineral soil surface.
72 <200cm EPISATURATION <200cm Top of unsaturated zone - Episaturation: The soil is saturated with water in one or more layers within 200 cm of the mineral soil surface and also has one or more unsaturated layers, with an upper boundary above a depth of 200 cm, below the saturated layer. - The zone of saturation, i.e., the water table, is perched on top of a relatively impermeable layer.

73 Care must be taken in applying Scope and Effect equations, DRAINMOD to this situation. Which water table is being analyzed? How do you install observation wells and interpret data?

74 Well Points no longer recommended, leave bottom open. 15 max. length now recommended for wells in wetlands.

75 Impermeable layer Piezometers typically installed in confined aquifers for g.w. flow.

76 Monitoring wells do not penetrate a confining layer. Piezometers by definition have perforated interval installed below a confining layer. No confining layer, no piezometer. Always need a good soil profile description.

77 Monitoring well penetrates a confining layer. Erroneous readings will result. Piezometer s perforated interval installed below a confining layer. Correct reading on piezometric head in lower layer. Artesian condition in piezometer. Does not read perched water table.

78 Perched Artesian, confined aquifer Ground water flow Monitoring wells used in water table aquifers. Open to atmosphere. Piezometers are installed in confined aquifers. Artesian if water level rises above confining layer, flowing artesian if water comes to soil surface. Water flows from higher to lower piezometric head.
")
79 Identifying a Perched WT Using Piezometers (after Sprecher, 1993) Correct Incorrect
80 Problems Often Encountered with Observation Wells: 1. Cap too tight (use 3 on 2 pipe) 2. Displacement of water in well by measuring device misrepresents true water level (2 dowel rod in 3 pipe) 3. Infrequent readings (readings on day 1 and 14 doesn t describe what happens in between, continuous duration) 4. 1 year of data (cannot establish frequency, 50% of years) 5. No soil profile description (what the heck is being monitored)
81 Problems Often Encountered with Observation Wells (cont.) 6. No replication (one well only, can t detect problems) 7. Well screen plugged (no water movement) 8. Frost heaving (re-install well) 9. Cracking soil (macropore flow) 10. No on-site raingage (well/rainfall interaction, moving infiltration)
82 Figure 4.14 Hypothetical example in which soil is continuously saturated in the root zone during A. Normal and B. Above normal precipitation conditions. In the case of A., the area may qualify as a jurisdictional wetland. In the case of B., more conclusive evidence would be needed to determine that the area is a jurisdictional wetland.
83 Observation Well Data Minimum 10 years required if used alone Minimum of 5 years if used with WETS table normalization procedure Less than 5 years can be used with extreme caution, using normalization procedure if precipitation is below normal and water table exists to meet criteria One year of data should be compared to DRAINMOD analysis of site using Reference Wetland Simulation procedure
84 Observation Wells Must have soil profile description of each well site Install wells in pairs to confirm readings are correct Local rainfall gage needed - on-site if possible - recording tipping bucket rain gage ideal Note date of leaf out in spring if wooded site, senescence in fall (ET can drop water table significantly)
85 Drainage Equations
86 Chapter Objectives Introduce the 4 Drainage Equations Explain the conditions for use of each List and describe the inputs for each Prepare for an Ellipse Equation Exercise
87 Drainage Equations Apply Directly to MINERAL FLAT Wetlands All water budget vectors are vertical before drainage Drainage introduces horizontal flow


88 Effects of Drainage Systems Estimate the lateral effect of a ditch or subsurface drain on the water table

89 Typical application of observation wells, drainage equations, DRAINMOD ENDOSATURATION
90 Drainage Equations Ellipse Hooghoudt (used in DRAINMOD) van Schilfgaarde Kirkham - removal of surface water (used in DRAINMOD)
91 Figure 1: Example Using The Ellipse Equation m=d-c S = [(4K) (m 2 + 2am) / q] 1/2
92 Ellipse Equation S = [(4K) (m 2 + 2am) / q] 1/2 K and q must be in same units, e.g. in/hr, ft/day S will be in units of a and m
93 How do we get Lateral Effect out of this? m=d-c Le = S / 2
 Turns isotropic layers to anisotrophic")
94 Hydraulic Conductivity Where K and T Are the Saturated Hydraulic Conductivity and Thickness of Each Layer (flow being evaluated is horizontal flow only, so flow is by layers) Turns isotropic layers to anisotrophic profile
95 K1 T1 K2 T2 Drainage K3 T3 Feature Soil A K1 K2 T1 T2 K1 K2 Soil B T1 T2 Choose more restrictive: Soil A or B Drainage K3 T3 K3 T3 Feature
96 Example Problem K = 1.3 in/hr K = 0.9 in/hr 12 in 48 in What hydraulic conductivity do we use? K = 0.15 in/hr 52 in
97 Answer K = 1.3 in/hr * 12 in in/hr * 48 in 60 in K = 0.98 in/hr
98 Ellipse Equation S = [(4K) (m 2 + 2am) / q] 1/2
99 q = q is the drainage rate How much water needs to be removed by when?
100 For wetland hydrology determination, q is evaluated as water that must be removed by drainage in lowering water table (drained volume) divided by the time to remove. Example: lower water table from surface to 12 in 14 days. Drained volume is 0.01 (WT 0 to -12 ) q = 0.01 in/14 days = in/day
101 Table 1. Drainable Porosity for Commerce Soil Water Table Depth of water Drainable Depth Drained Porosity 0 - Depth (cm) (cm) (cm/cm) N/A Values shown for Water Table Depth and Depth of Water drained have already integrated data for multiple soil layers into one soil Drainable Porosity is a function of drawdown, NOT a soil property
102 Calculation of Drainable Porosity The drainable porosity if the water table is lowered from Depth 1 to Depth 2 is: (Drained Volume Depth 1 Drained Volume Depth 2 ) Drainable Porosity Depth 1 - Depth 2 = (Depth 1 Depth 2)
103 Example: Calculate Drainable porosity to 30 cm Water Table Depth of water Drainable Depth Drained Porosity 0 - Depth (cm) (cm) (cm/cm) N/A
104 Example 1. The drainable porosity if the water table is lowered from 0 cm to 30 cm is Drainable Porosity 0-30 f = (0.0 cm cm)/(0 cm-30 cm) = ( cm)/(-30 cm) = cm/cm
105 Example 2. The drainable porosity if the water table is lowered from 10 cm to 30 cm is: Drainable Porosity = ( cm cm)/(10 cm-30 cm) = ( cm) / (-20 cm) = cm / cm
106 Drainable Porosity Use in Scope and Effect Equations Drainable porosity (f) is used directly in the van Schilfgaarde equation. In the Ellipse and Hooghoudt equations it is used as follows to calculate a drainage rate q. q = (f *depth water table lowered) + rainfall -evapotranspiration t t = time to lower water table for most critical period during the growing season

107 Where do you get the Soil data?
108 1.Field Data - Collect soil samples and perform laboratory analysis. Or, 2. NRCS National Soil Information System (NASIS database) % Sand, Silt, and Clay Water 33 kpa and 1500 kpa Moist Bulk density Depth to top and bottom of each layer
109 Rosetta Model (ARS, Riverside, CA) Rosetta uses Pedotransfer functions and the information from the NASIS database to predict: water retention Hydraulic conductivity
110 Values from ROSETTA Class Averages Texture Drained f Ksat Class Vol@30 cm 0-30 cm (cm) (cm/cm) (cm/hr) Clay C Loam Loam L Sand Sand S Clay S C L S Loam Silt Si Clay Si C L Si Loam
111 Hooghoudt Equation S ' = (8K am + 2 4K m 1 2 / q K 1 = weighted hydraulic conductivity above the drainage feature, in/hr K 2 = weighted hydraulic conductivity below the drainage feature, in/hr Note: K 1 and K 2 do not have to be different (also uses an equivalent depth that will be discussed later)
112 NRCS Modified van Schilfgaarde Equation NRCS uses a modified version of the van Schilfgaarde equation in which the drainable porosity is replaced with an adjusted drainable porosity, which accounts for the water storage (s) by surface roughness. If surface roughness is ignored (s=0), the equation is identical to the original van Schilfgaarde equation.
113 van Schilfgaarde Equation S = drain spacing m = height of water table above the center of the drain at midplane after time t, ft m 0 = initial height of water table above the center of the drain at t = 0, ft t = time for water table to drop from m 0 to m, days a = depth from free water surface in drainage feature to impermeable layer, ft f = modified drainable porosity d e = equivalent depth
114 f modified drainable porosity f = f + (s/(m o m) s = water trapped on the surface by soil roughness, ft s = ft (0.1 in) would be typical Note: set s = 0 if unsure of appropriate value
115 Surface Ponding (Microtopography) Average depth of storage that occurs before runoff begins. Distributed across the field - average
116 Surface Storage is often the most critical factor will make or break a determination
117 Surface Storage Depths Well graded cropland Fair cropland Pasture Improved Forest Native Forest Surface Storage Description 0.1 to 0.5 cm Surface relatively smooth and on grade so that water does not remain ponded in field after heavy rainfall. No potholes and adequate outlets. 1.0 to 1.5 cm Some shallow depressions, water remains in a few shallow pools after heavy rainfall. Microstorage caused by disking or cultivation may cause surface drainage to be only fair even when field surface is on grade. 1.5 to 2.5 cm Many depressions or potholes of varying depth. Widespread ponding of water after heavy rainfall. Or inadequate surface outlets such as berms around field ditches. 1.5 to 3.0 cm Depressions of varying depth. 2.5 to 5.0 cm Many depressions of varying depth. Widespread ponding that can last for days.

118 Ponding Natural Microtopography
119
120 Kirkham s Equation Kirkham s Equation for Parallel Drains For removal of ponding only

121 Figure 2: Pothole With Tile Drainage System

122 Kirkham s Equation
123 Organic Soils Difficult to determine Ksat and f Most organic soils are on discharge wetlands Lateral groundwater flow in Does not match vertical hydrodynamics of Mineral Flats
124 Drainmod Explain major DRAINMOD features List major DRAINMOD inputs List major DRAINMOD outputs Interpret basic wetland hydrology output Select the HGM class applicable to DRAINMOD
125 DRAINMOD Program Features DRAINMOD was developed by Dr. R. Wayne Skaggs at North Carolina State University (1980) DRAINMOD is a computer model (program) that is used to simulate the hydrology of high water table soils on an hourly basis for long periods of record (typically > 20 years)
126

127 Graphical Output Mineral Flat Willamette Valley, OR Wet Prairie
128 HGM Class Applicable to DRAINMOD The DRAINMOD model is applicable to wetlands in the MINERAL FLATS wetland class. DRAINMOD accurately models removal of water from shallow depressions within MINERAL FLAT wetlands DRAINMOD is not appropriate for modeling deep depressions within the DEPRESSION HGM class
129 Questions?
San Antonio Water System Mitchell Lake Constructed Wetlands Below the Dam Preliminary Hydrologic Analysis
 San Antonio Water System enhancement. This recommendation was based on limited water quality data provided by SAWS and using a free-water surface constructed wetland with approximately 112 acres of wetted
M.L. Kavvas, Z. Q. Chen, M. Anderson, L. Liang, N. Ohara Hydrologic Research Laboratory, Civil and Environmental Engineering, UC Davis
 Assessment of the Restoration Activities on Water Balance and Water Quality at Last Chance Creek Watershed Using Watershed Environmental Hydrology (WEHY) Model M.L. Kavvas, Z. Q. Chen, M. Anderson, L.
CHAPTER FIVE Runoff. Engineering Hydrology (ECIV 4323) Instructors: Dr. Yunes Mogheir Dr. Ramadan Al Khatib. Overland flow interflow
 Instructors: Dr. Yunes Mogheir Dr. Ramadan Al Khatib. Overland flow interflow") Engineering Hydrology (ECIV 4323) CHAPTER FIVE Runoff Instructors: Dr. Yunes Mogheir Dr. Ramadan Al Khatib Overland flow interflow Base flow Saturated overland flow ١ ٢ 5.1 Introduction To Runoff Runoff
Engineering Hydrology (ECIV 4323) CHAPTER FIVE Runoff Instructors: Dr. Yunes Mogheir Dr. Ramadan Al Khatib Overland flow interflow Base flow Saturated overland flow ١ ٢ 5.1 Introduction To Runoff Runoff
THE SPAW MODEL FOR AGRICULTURAL FIELD AND POND HYDROLOGIC SI... SIMULATION
 THE SPAW MODEL FOR AGRICULTURAL FIELD AND POND HYDROLOGIC SI... Page 1 of 36 THE SPAW MODEL FOR AGRICULTURAL FIELD AND POND HYDROLOGIC SIMULATION Dr. Keith E. Saxton 1 and Mr. Patrick H. Willey 2 1 Research
Treatment Volume: Curve Numbers. Composite CN or Not? Treatment Volume: Curve Numbers. Treatment Volume: Calculation. Treatment Volume: Calculation
 Stormwater Engineering Bioretention Design Bill Hunt, PE, Ph.D. Extension Specialist & Assistant Professor NCSU-BAE www.bae.ncsu.edu/stormwater Bioretention Design Six Step Process 1 Determine Volume to
Overview of the Surface Hydrology of Hawai i Watersheds. Ali Fares Associate Professor of Hydrology NREM-CTAHR
 Overview of the Surface Hydrology of Hawai i Watersheds Ali Fares Associate Professor of Hydrology NREM-CTAHR 5/23/2008 Watershed Hydrology Lab 1 What is Hydrology? Hydrology is the water science that
The Impacts of Climate Change on Portland s Water Supply
 The Impacts of Climate Change on Portland s Water Supply Richard Palmer and Margaret Hahn University of Washington Department of Civil and Environmental Engineering Joe Dvorak, Dennis Kessler, Azad Mohammadi
Hydrologic Modeling with the Distributed-Hydrology- Soils- Vegetation Model (DHSVM)
") Hydrologic Modeling with the Distributed-Hydrology- Soils- Vegetation Model (DHSVM) DHSVM was developed by researchers at the University of Washington and the Pacific Northwest National Lab 200 Simulated
Hydrologic Modeling with the Distributed-Hydrology- Soils- Vegetation Model (DHSVM) DHSVM was developed by researchers at the University of Washington and the Pacific Northwest National Lab 200 Simulated
Issue paper: Aquifer Water Balance
 Issue paper: Aquifer Water Balance 1. Introduction And Background 1.1. Purpose and Scope The population in Kitsap County has grown rapidly in recent years and is expected to increase substantially in the
2
 1 2 3 4 5 6 The program is designed for surface water hydrology simulation. It includes components for representing precipitation, evaporation, and snowmelt; the atmospheric conditions over a watershed.
Hydrology and Water Management. Dr. Mujahid Khan, UET Peshawar
 Hydrology and Water Management Dr. Mujahid Khan, UET Peshawar Course Outline Hydrologic Cycle and its Processes Water Balance Approach Estimation and Analysis of Precipitation Data Infiltration and Runoff
East Maui Watershed Partnership Adapted from Utah State University and University of Wisconsin Ground Water Project Ages 7 th -Adult
 INTRODUCTION What is groundwater? Water contained in saturated soil and rock materials below the surface of the earth. It is not NEW water, but is recycled water through the hydraulic cycle. The source
Application of a Basin Scale Hydrological Model for Characterizing flow and Drought Trend
 Application of a Basin Scale Hydrological Model for Characterizing flow and Drought Trend 20 July 2012 International SWAT conference, Delhi INDIA TIPAPORN HOMDEE 1 Ph.D candidate Prof. KOBKIAT PONGPUT
Lecture 19. Landfill hydrology
 Lecture 19 Landfill hydrology Landfill hydrology Water Pathways Rainfall/Snowfall Transpiration Snow Evaporation Interception Interception Evaporation Runoff Snow Melt Snow Accumulation Plant Growth Infiltration
Irrigating Efficiently: tools, tips & techniques. Steve Castagnoli, OSU Extension Service
 Irrigating Efficiently: tools, tips & techniques Steve Castagnoli, OSU Extension Service Tonight s class: Why plants need water When plants need water How much water plants need Soil as a reservoir of
Continuous Simulation Modeling of Stormwater Ponds, Lakes, & Wetlands: A BUILT-IN APPLICATION OF PONDS 3.2
 Continuous Simulation Modeling of Stormwater Ponds, Lakes, & Wetlands: A BUILT-IN APPLICATION OF PONDS 3.2 PRESENTED AT THE SFWMD WORKSHOP PRE-DEVELOPMENT VERSUS POST DEVELOPMENT RUNOFF VOLUME ANALYSIS
Groundwater Balance Study in the High Barind, Bangladesh. A.H.M.Selim Reza 1, Quamrul Hasan Mazumder 1 and Mushfique Ahmed 1
 Rajshahi University J. of Sci. 39, 11-26 (2011) ISSN 1681-0708 Groundwater Balance Study in the High Barind, Bangladesh A.H.M.Selim Reza 1, Quamrul Hasan Mazumder 1 and Mushfique Ahmed 1 1 Department of
Lecture 9A: Drainage Basins
 GEOG415 Lecture 9A: Drainage Basins 9-1 Drainage basin (watershed, catchment) -Drains surfacewater to a common outlet Drainage divide - how is it defined? Scale effects? - Represents a hydrologic cycle
CHAPTER 3 STORMWATER HYDROLOGY. Table of Contents SECTION 3.1 METHODS FOR ESTIMATING STORMWATER RUNOFF
 CHAPTER 3 STORMWATER HYDROLOGY Table of Contents SECTION 3.1 METHODS FOR ESTIMATING STORMWATER RUNOFF 3.1.1 Introduction to Hydrologic Methods...3.1-1 3.1.2 Symbols and Definitions...3.1-3 3.1.3 Rainfall
Runoff Processes. Daene C. McKinney
 CE 374 K Hydrology Runoff Processes Daene C. McKinney Watershed Watershed Area draining to a stream Streamflow generated by water entering surface channels Affected by Physical, vegetative, and climatic
Ponds. Pond A water impoundment made by excavating a pit, or constructing a dam or an embankment.
 POND SITE SELECTION AND CONSTRUCTION Uses, Planning, & Design David Krietemeyer Area Engineer USDA-NRCS June 20, 2008 Uses Considerations for Location of Commonly Used Terms Pond A water impoundment made
Culvert Sizing procedures for the 100-Year Peak Flow
 CULVERT SIZING PROCEDURES FOR THE 100-YEAR PEAK FLOW 343 APPENDIX A: Culvert Sizing procedures for the 100-Year Peak Flow A. INTRODUCTION Several methods have been developed for estimating the peak flood
iswm TM Technical Manual Hydrology:
 : 1.0 2.0 Downstream Assessment 3.0 Streambank Protection 4.0 Water Balance 5.0 Rainfall Tables 6.0 Hydrologic Soils Data Table of Contents 1.0... HO-1 1.1 Estimating Runoff... HO-1 1.1.1 Introduction
1. Stream Network. The most common approach to quantitatively describing stream networks was postulated by Strahler (1952).
.") 1. Stream Network The most common approach to quantitatively describing stream networks was postulated by Strahler (1952). First Order Streams streams with no tributaries. Second Order Streams begin at
1. Stream Network The most common approach to quantitatively describing stream networks was postulated by Strahler (1952). First Order Streams streams with no tributaries. Second Order Streams begin at
URBAN FLOODING: HEC-HMS
 1.0 Introduction URBAN FLOODING: HEC-HMS -Sunil Kumar, Director, NWA All major ancient civilisations were developed in the river valleys because river served as source of water, food, transportation and
22 Tubewell Drainage Systems
 22 Tubewell Drainage Systems WK Boehmer' and J Boonstra2 221 Introduction ' Tubewell drainage is a technique of controlling the watertable and salinity in agricultural areas It consists of pumping, from
ANNUAL PLATTE RIVER SURFACE WATER FLOW SUMMARY
 ANNUAL PLATTE RIVER SURFACE WATER FLOW SUMMARY 4/3/213 Platte River Recovery Implementation Program 213 ANNUAL SURFACE WATER FLOW SUMMARY DRAFT Prepared by staff of the Platte River Recovery Implementation
I/I Analysis & Water Balance Modelling. Presented by Paul Edwards
 I/I Analysis & Water Balance Modelling Presented by Paul Edwards Contents Background Wet Weather Model Calibration Inflow / Infiltration Assessment Flow Containment Options Water Balance Model 20 Year
Quantification of lake water level influences for Wawasee and Syracuse lakes: Lake and watershed water budgets for 2011, 2012, and 2013
 Quantification of lake water level influences for Wawasee and Syracuse lakes: Lake and watershed water budgets for 2011, 2012, and 2013 Nathan S. Bosch, Joellyn Moine, Margaret Lee, Anna Burke Center for
Economics of Controlled Drainage and Subirrigation Systems
 Economics of Controlled Drainage and Subirrigation Systems Prepared by: Robert Evans, Extension Agricultural Engineering Specialist Wayne Skaggs and Ronald E. Sneed Professors of Biological and Agricultural
Project Drainage Report
 Design Manual Chapter 2 - Stormwater 2A - General Information 2A-4 Project Drainage Report A. Purpose The purpose of the project drainage report is to identify and propose specific solutions to stormwater
EXAMPLE Stormwater Management Plans w/ CSS BMP Sizing Calculator (v2.1)
") 525 Golden Gate Avenue, 11th Floor San Francisco, CA 94102 EXAMPLE Stormwater Management Plans w/ CSS BMP Sizing Calculator (v2.1) The following example Stormwater Management Plans (SMPs) are provided
525 Golden Gate Avenue, 11th Floor San Francisco, CA 94102 EXAMPLE Stormwater Management Plans w/ CSS BMP Sizing Calculator (v2.1) The following example Stormwater Management Plans (SMPs) are provided
Water Budget IV: Soil Water Processes P = Q + ET + G + ΔS
 Water Budget IV: Soil Water Processes P = Q + ET + G + ΔS Infiltration Infiltration capacity: The maximum rate at which water can enter soil. Infiltration capacity curve: A graph showing the time-variation
Pre-Treatment Bioretention Cells Bioswales IOWA STORMWATER MANAGEMENT MANUAL DECEMBER 16, 2015
 Pre-Treatment Bioretention Cells Bioswales IOWA STORMWATER MANAGEMENT MANUAL DECEMBER 16, 2015 Urban Runoff Background How we got here What Problem?? Provenance of the Problem Unified Sizing Criteria What
UNIT HYDROGRAPH AND EFFECTIVE RAINFALL S INFLUENCE OVER THE STORM RUNOFF HYDROGRAPH
 UNIT HYDROGRAPH AND EFFECTIVE RAINFALL S INFLUENCE OVER THE STORM RUNOFF HYDROGRAPH INTRODUCTION Water is a common chemical substance essential for the existence of life and exhibits many notable and unique
Introduction. Welcome to the Belgium Study Abroad Program. Courses:
 Introduction Welcome to the Belgium Study Abroad Program Courses: AGSM 335: Soil and Water Management BAEN 460: Principals of Environmental Hydrology BAEN 460 / AGSM 335 Combined lecture and HW sessions
6.0 Runoff. 6.1 Introduction. 6.2 Flood Control Design Runoff
 October 2003, Revised February 2005 Chapter 6.0, Runoff Page 1 6.1 Introduction 6.0 Runoff The timing, peak rates of discharge, and volume of stormwater runoff are the primary considerations in the design
Lift irrigation Using man or Animal power Using Mechanical or Electrical Power Flow irrigation a)inundation Irrigation b) Perennial Irrigation Direct
inundation Irrigation b) Perennial Irrigation Direct") Lift irrigation Using man or Animal power Using Mechanical or Electrical Power Flow irrigation a)inundation Irrigation b) Perennial Irrigation Direct irrigation Storage irrigation a)flow irrigation system:
Lift irrigation Using man or Animal power Using Mechanical or Electrical Power Flow irrigation a)inundation Irrigation b) Perennial Irrigation Direct irrigation Storage irrigation a)flow irrigation system:
Chapter 6 Hydrology TABLE OF CONTENTS CHAPTER 6 - HYDROLOGY
 Chapter 6 Hydrology TABLE OF CONTENTS CHAPTER 6 - HYDROLOGY... 6-1 6.1 Introduction... 6-1 6.1.1 Objective... 6-1 6.1.2 Definition... 6-1 6.1.3 Factors Affecting Floods... 6-1 6.1.4 Sources of Information...
Saturated Buffer. Subsurface Drainage PURPOSE N REDUCTION LOCATION COST BARRIERS
 Saturated Buffer To intercept tile drainage prior to discharging to surface waters and redistribute the water laterally in the soil profile of the streamside buffer. Subsurface drainage, also known as
Municipal Stadium Wetland
 W A T E R S H E D F A C T S Total watershed area 140 mi 2 Average annual rainfall 38 in Average annual temperature 58 F Elevation Max 1321 ft Min 899 ft C. J. Brown Reservoir controls flow from 83 mi 2
OPERATING CONTROLLED DRAINAGE AND SUBIRRIGATION SYSTEMS
 OPERATING CONTROLLED DRAINAGE AND SUBIRRIGATION SYSTEMS Prepared by: Robert Evans, Extension Specialist and Wayne Skaggs,William Neal Reynolds Professor Department of Biological and Agricultural Engineering
APPENDIX IV. APPROVED METHODS FOR QUANTIFYING HYDROLOGIC CONDITIONS OF CONCERN (NORTH ORANGE COUNTY)
") APPENDIX IV. APPROVED METHODS FOR QUANTIFYING HYDROLOGIC CONDITIONS OF CONCERN (NORTH ORANGE COUNTY) Hydromodification design criteria for the North Orange County permit area are based on the 2- yr, 24-hr
APPENDIX IV. APPROVED METHODS FOR QUANTIFYING HYDROLOGIC CONDITIONS OF CONCERN (NORTH ORANGE COUNTY) Hydromodification design criteria for the North Orange County permit area are based on the 2- yr, 24-hr
NEW CASTLE CONSERVATION DISTRICT. through. (Name of Municipality) PLAN REVIEW APPLICATION DRAINAGE, STORMWATER MANAGEMENT, EROSION & SEDIMENT CONTROL
 PLAN REVIEW APPLICATION DRAINAGE, STORMWATER MANAGEMENT, EROSION & SEDIMENT CONTROL") NEW CASTLE CONSERVATION DISTRICT through (Name of Municipality) PLAN REVIEW APPLICATION DRAINAGE, STORMWATER MANAGEMENT, EROSION & SEDIMENT CONTROL Office use only: Received by Municipality: Received by
NEW CASTLE CONSERVATION DISTRICT through (Name of Municipality) PLAN REVIEW APPLICATION DRAINAGE, STORMWATER MANAGEMENT, EROSION & SEDIMENT CONTROL Office use only: Received by Municipality: Received by
The Effect of Surface Texture on Evaporation, Infiltration and Storage Properties of Paved Surfaces
 The Effect of Surface Texture on Evaporation, Infiltration and Storage Properties of Paved Surfaces M. Mansell* and F. Rollet School of Engineering and Science, University of the West of Scotland, Paisley
Nutrient Management in. A presentation to the West Metro Water Alliance
 Nutrient Management in Developing and Agricultural Areas A presentation to the West Metro Water Alliance Chris Meehan, P.E. May 25, 2011 Agenda Physical Improvements Planning Improvements How to get it
Hood River Water Conservation Strategy: achieving long-term water resource reliability for agriculture & local fish populations
 Hood River Water Conservation Strategy: achieving long-term water resource reliability for agriculture & local fish populations Cindy Thieman Hood River Watershed Group Ed Salminen & Niklas Christensen
Placement and Interpretation of Soil Moisture Sensors for Irrigated Cotton Production in Humid Regions SITE SELECTION IN A FIELD OBJECTIVE
 Brian Leib, University of Tennessee Jose Payero, Clemson University Lyle Pringle, Mississippi State University James Bordovsky, Texas A&M University Wesley Porter, University of Georgia Ed Barnes, Cotton
Lake Houston Dam Comprehensive Evaluation of an Ambursen Dam
 Lake Houston Dam Comprehensive Evaluation of an Ambursen Dam ASDSO September 10, 2008 John Rutledge - Freese & Nichols, Inc. Chuck Easton - Freese & Nichols, Inc. Janis Murphy - Freese & Nichols, Inc.
Stormwater Volume and Treatment Methods Simplifying the Numbers. IAFSM March 10, Presented by: Tom Powers P.E., CFM, LEED AP, CPESC
 Stormwater Volume and Treatment Methods Simplifying the Numbers IAFSM March 10, 2011 Presented by: Tom Powers P.E., CFM, LEED AP, CPESC Introduction GOALS: Improve understanding of Rate and Volume (Quantity)
Effect of the Underlying Groundwater System on the Rate of Infiltration of Stormwater Infiltration Structures.
 Effect of the Underlying Groundwater System on the Rate of Infiltration of Stormwater Infiltration Structures. Presented at: Storm Water Infiltration & Groundwater Recharge A Conference on Reducing Runoff
Does Water Resources Management in the Snake River Basin Matter for the Lower Columbia River? Or Is the Snake River Part of Another Watershed?
 Does Water Resources Management in the Snake River Basin Matter for the Lower Columbia River? Or Is the Snake River Part of Another Watershed? John C. Tracy, Director Idaho Water Resources Research Institute
Rainwater Management. Dr. Iftikhar Ahmad. College of Earth and. University of The Punjab Lahore
 Rainwater Management in Major Cities of Punjab Dr. Iftikhar Ahmad College of Earth and Environmental Sciences. University of The Punjab Lahore Need For Rainfall Harvesting in Urban Areas of Punjab Groundwater
Manure Storage for Environmental Management Systems
 WiMStor01 MStor Manure Storage for Environmental Management Systems Key: 1)Low Risk 2)Low-Moderate Risk 3)Moderate-High Risk 4)High Risk Location of Manure Storage Are the manure storage facilities in
CEE3430 Engineering Hydrology
 CEE3430 Engineering Hydrology Practice Exam (There are multiple practice questions here A 110 min test will likely not have more than four questions) 1. Water Balance Write the water balance as Δ Where
New Castle County, DE. Floodplain Regulations
 New Castle County, DE Floodplain Regulations John J. Gysling, PE CFM Department of Land Use New Castle County, DE February 26, 2009 Today s Presentation Floodplain Protection and Uses Terms and Definitions
Water Balance and Regulation Alternative Analysis for Kajakai Reservoir using HEC-ResSim
 US Army Corps of Engineers Hydrologic Engineering Center Water Balance and Regulation Alternative Analysis for Kajakai Reservoir using HEC-ResSim Phase I and II Final Report December 2007 Approved for
Utilization of the SWAT Model and Remote Sensing to Demonstrate the Effects of Shrub Encroachment on a Small Watershed
 Utilization of the SWAT Model and Remote Sensing to Demonstrate the Effects of Shrub Encroachment on a Small Watershed Jason Afinowicz Department of Biological and Agricultural Engineering Texas A&M University
Definitions 3/16/2010. GG22A: GEOSPHERE & HYDROSPHERE Hydrology
 GG22A: GEOSPHERE & HYDROSPHERE Hydrology Definitions Streamflow volume of water in a river passing a defined point over a specific time period = VxA discharge m 3 s -1 Runoff excess precipitation - precipitation
Information Request 11
 Information Request 11 Information Request 11 11-1 Responses to Information Request 11 Response to Information Request 11a Response to Information Request 11b 11-2 11-6 Federal Review Panel Information
Chapter 6. Hydrology. 6.0 Introduction. 6.1 Design Rainfall
 6.0 Introduction This chapter summarizes methodology for determining rainfall and runoff information for the design of stormwater management facilities in the City. The methodology is based on the procedures
History of Model Development at Temple, Texas. J. R. Williams and J. G. Arnold
 History of Model Development at Temple, Texas J. R. Williams and J. G. Arnold INTRODUCTION Then Model development at Temple A long history (1937-present) Many scientists participating in: Data collection
HYDROLOGICAL IMPACTS OF IRAQI BADUSH DAM ON GROUNDWATER
 HYDROLOGICAL IMPACTS OF IRAQI BADUSH DAM ON GROUNDWATER AQEEL Al-ADILI 1, SALEH KHASAF 2 AND AWS AJAJ 3 1 University of Technology, P.O. Box; 4627, Baghdad, Iraq, e-mail; aqeeladili@hotmail.com 2 University
Hydrology for Folsom Dam Water Control Manual Update
 Hydrology for Folsom Dam Water Control Manual Update Brian Walker, EIT Civil Engineer, Hydrology Section U.S. Army Corps of Engineers Sacramento District 1325 J Street Sacramento, CA 95816 Tel: (916) 557-7376
Transactions. American Geophysical Union Volume 28, Number 1 February 1947
 Transactions. American Geophysical Union Volume 28, Number 1 February 1947 EFFECT OF REMOVAL OF STREAM-BANK VEGETATION UPON WATER YIELD Earl G. Dunford and P. W. Fletcher Abstract--This is a preliminary
Measuring discharge. Climatological and hydrological field work
 Measuring discharge Climatological and hydrological field work 1. Background Discharge (or surface runoff Q s) refers to the horizontal water flow occurring at the surface in rivers and streams. It does
COON CREEK WATERSHED DISTRICT PERMIT REVIEW. Spring Lake Park Schools Westwood Middle School st Avenue NE, Spring Lake Park, MN 55432
 PAN 16-112, Westwood Middle School, Page 1 of 6 COON CREEK WATERSHED DISTRICT PERMIT REVIEW MEETING DATE: August 22, 2016 AGENDA NUMBER: 10 FILE NUMBER: 16-112 ITEM: Westwood Middle School RECOMMENDATION:
8.4.2 Steady flow: Hooghoudt equation
 8.4.2 Steady flow: Hooghoudt equation As explained in Section 1.1, steady flow does not,. in reality, occur. At the end of tail recession, however, because of a small amount of seepage, the flow of some
EFFECTS OF WATERSHED TOPOGRAPHY, SOILS, LAND USE, AND CLIMATE ON BASEFLOW HYDROLOGY IN HUMID REGIONS: A REVIEW
 PROGRESS IN PHYSICAL GEOGRAPHY EFFECTS OF WATERSHED TOPOGRAPHY, SOILS, LAND USE, AND CLIMATE ON BASEFLOW HYDROLOGY IN HUMID REGIONS: A REVIEW KATIE PRICE 2011 Presented by: Jordan Martin Article Overview
Section 2. Mono Basin Operations
 Section 2 Mono Basin Operations Compliance with State Water Resources Control Board Decision 1631 and Order Nos. 98-05 and 98-07 May 2011 Los Angeles Department of Water and Power Table of Contents Page
The Islamic University of Gaza- Civil Engineering Department Sanitary Engineering- ECIV 4325 L5. Storm water Management
 The Islamic University of Gaza- Civil Engineering Department Sanitary Engineering- ECIV 4325 L5. Storm water Management Husam Al-Najar Storm water management : Collection System Design principles The Objectives
SURFACE WATER WITHDRAWALS & LOW FLOW PROTECTION POLICY MICHAEL COLLEGE, P.E. SUSQUEHANNA RIVER BASIN COMMISSION
 SURFACE WATER WITHDRAWALS & LOW FLOW PROTECTION POLICY MICHAEL COLLEGE, P.E. SUSQUEHANNA RIVER BASIN COMMISSION SCENARIOS Direct withdrawal from surface water (SW): PA MOU w/padep NY MOU w/nysdec MD No
Water Table Monitoring Project Design
 Wetlands Regulatory Assistance Program ERDC TN-WRAP-06-2 Water Table Monitoring Project Design by Chris V. Noble PURPOSE: This document provides guidance for planning and implementing a wetland hydrology
Sterling and Gilcrest/LaSalle High Groundwater Analysis
 FINAL REPORT Prepared for The State of Colorado, Department of Natural Resources Sterling and Gilcrest/LaSalle High Groundwater Analysis July 2015 Sterling and Gilcrest/LaSalle High Groundwater Analysis
Lecture 20: Groundwater Introduction
 Lecture 20: Groundwater Introduction Key Questions for Groundwater 1. What is an aquifer? 2. What is an unconfined aquifer? 3. What is groundwater recharge? 4. What is porosity? What determines the magnitude
Stormwater Treatment Wetlands
 Florida Chamber Summer School July, 2014 Stormwater Treatment Wetlands Chris Keller, P.E. Wetland Solutions, Inc. Why Wetlands? Wetlands are the natural stormwater management systems in the landscape Wetlands
Soil Processes: SVAT, ET, and the Subsurface. Summary
 Soil Processes: SVAT, ET, and the Subsurface CIVE 781: Principles of Hydrologic Modelling University of Waterloo Jun 19 24, 2017 Summary The role of soil and vegetation in the water cycle Soil Physics:
Potential effects evaluation of dewatering an underground mine on surface water and groundwater located in a rural area
 Potential effects evaluation of dewatering an underground mine on surface water and groundwater located in a rural area ITRODUCTIO Michel Mailloux* Eng. M.Sc, Vincent Boisvert, M.Sc, Denis Millette, Eng.,
ABC S OF FRESHWATER WETLAND DESIGN: CONCEPT TO CONSTRUCTION
 ABC S OF FRESHWATER WETLAND DESIGN: CONCEPT TO CONSTRUCTION Michael Mak, P.E. (Design Engineer) Karen Appell, P.E., C.P.E.S.C. (Project Manager) Christopher Benosky, P.E., C.F.M (Engineer of Record) August
Municipal Stormwater Ordinances Summary Table
 APPENDIX F Municipal Ordinances Summary Table Municipality Abington Bryn Athyn Borough Hatboro Borough Ordinance, SALDO Runoff equals pre post Erosion Sediment Control Water Quality Requirements Any which
SOURCES OF WATER SUPPLY GROUND WATER HYDRAULICS
 SOURCES OF WATER SUPPLY GROUND WATER HYDRAULICS, Zerihun Alemayehu GROUNDWATER Groundwater takes 0.6% of the total water in the hydrosphere 0.31% of the total water in the hydrosphere has depth less than
Watershed Hydrology and Water Resources Science Teacher Education Program (STEP)
") Watershed Hydrology and Water Resources Science Teacher Education Program (STEP) Presented by Amy Tidwell Water and Environmental Research Center/ Institute of Northern Engineering University of Alaska
Watershed Hydrology and Water Resources Science Teacher Education Program (STEP) Presented by Amy Tidwell Water and Environmental Research Center/ Institute of Northern Engineering University of Alaska
BRADLEY UNIVERSITY. The Performance and Sustainability of Permeable Pavement Progress Report on the Work Performed Under IAPA Scholarship
 BRADLEY UNIVERSITY The Performance and Sustainability of Permeable Pavement Progress Report on the Work Performed Under IAPA Scholarship Anne Riemann 12/19/2016 1 INTRODUCTION Permeable pavement is an
Biogeochemistry of Wetlands: Wetland hydrology
 Institute of Food and Agricultural Sciences (IFAS) Wetland hydrology, transport processes, and modeling June 23-26, 2008 Gainesville, Florida Wetland Biogeochemistry Laboratory Soil and Water Science Department
KanSched An ET-Based Irrigation Scheduling Tool for Kansas Summer Annual Crops
 KanSched An ET-Based Irrigation Scheduling Tool for Kansas Summer Annual Crops Gary A. Clark, Professor Danny H. Rogers, Extension Engineer, Irrigation Steven Briggeman, Extension Assistant Biological
DRAINAGE DESIGN AND RUTTING PERFORMANACE GUIDELINES FOR PERMEABLE PAVEMENT
 DRAINAGE DESIGN AND RUTTING PERFORMANACE GUIDELINES FOR PERMEABLE PAVEMENT by Su Ling Cao Daryl Poduska Graduate Assistants Dan G. Zollinger Associate Professor Sponsored by The Uni-Group U.S.A. The Department
Groundwater Recharge: A Role for Almonds? December 9, 2015
 Groundwater Recharge: A Role for Almonds? December 9, 2015 Speakers Gabriele Ludwig, Almond Board (Moderator) Daniel Mountjoy, Sustainable Conservation Joel Kimmelshue, Land IQ Helen Dahlke, University
Estimating the Seasonal High Water Table: A Mix of Art & Science
 Estimating the Seasonal High Water Table: A Mix of Art & Science PONDS WORKSHOP - SJRWMD Devo Seereeram, Ph.D., P.E. This paper was originally written over 4 years ago & generated a lot of interest. The
South Platte River Importance of Return Flows and Replacing Depletions to Down-Stream Water Users
 South Platte River Importance of Return Flows and Replacing Depletions to Down-Stream Water Users American Ground Water Trust Colorado Aquifer Management November 29 th, 2012 Jim Yahn, P.E. North Sterling
Geoenvironmental impact assessment of a landfill for solid chemical wastes
 ALOJZY SZYMAŃSKI, ZBIGNIEW LECHOWICZ, KAZIMIERZ GARBULEWSKI Department of Geotechnical Engineering, Warsaw Agricultural University SGGW, Poland Geoenvironmental impact assessment of a landfill for solid
Irrigation Scheduling: Checkbook Method
 Know how. Know now. EC709 Irrigation Scheduling: Checkbook Method Steven R. Melvin, Extension Educator C. Dean Yonts, Extension Irrigation Specialist Irrigation scheduling helps determine when and how
Part 624 Drainage National Engineering Handbook
 United States Department of Agriculture Natural Resources Conservation Service Chapter 10 Drainage Issued April 2001 The U.S. Department of Agriculture (USDA) prohibits discrimination in all its programs
Determination of Design Infiltration Rates for the Sizing of Infiltration based Green Infrastructure Facilities
 Determination of Design Infiltration Rates for the Sizing of Infiltration based Green Infrastructure Facilities 1 Introduction This document, developed by the San Francisco Public Utilities Commission
EVALUATION OF HYDROLOGIC AND WATER RESOURCES RESPONSE TO METEOROLOGICAL DROUGHT IN THESSALY, GREECE
 EVALUATION OF HYDROLOGIC AND WATER RESOURCES RESPONSE TO METEOROLOGICAL DROUGHT IN THESSALY, GREECE A. LOUKAS*, AND L. VASILIADES Laboratory of Hydrology and Water Systems Analysis,, Volos, Greece *E-mail:
BROWARD GROUNDWATER ELEVATION MAPS - PREDICTED CHANGES AND PLANNED UPDATES
 BROWARD GROUNDWATER ELEVATION MAPS - PREDICTED CHANGES AND PLANNED UPDATES MICHAEL ZYGNERSKI ENVIRONMENTAL PLANNING AND COMMUNITY RESILIENCY DIV. ASCE 2/8/2017 Overview Purpose/Application Current Maps
DES MOINES RIVER RESERVOIRS WATER CONTROL PLAN UPDATES IOWA ASCE WATER RESOURCES DESIGN CONFERENCE
 DES MOINES RIVER RESERVOIRS WATER CONTROL PLAN UPDATES 237 237 237 217 217 217 200 200 200 0 0 0 163 163 163 131 132 122 80 119 27 252 174.59 110 135 120 112 92 56 IOWA ASCE WATER RESOURCES DESIGN CONFERENCE
Stream Reaches and Hydrologic Units
 Chapter United States 6 Department of Agriculture Natural Resources Conservation Service Chapter 6 Stream Reaches and Hydrologic Units Rain clouds Cloud formation Precipitation Surface runoff Evaporation
Rock Creek Floodplain Analysis
 Rock Creek Floodplain Analysis www.co.washington.or.us By Jon Franczyk 1996 Flood, www.co.washington.or.us 1996 Flood, www.co.washington.or.us Project Outline Project Goals Introduction Background Study
Stanley J. Woodcock, Michael Thiemann, and Larry E. Brazil Riverside Technology, inc., Fort Collins, Colorado
 7.5 FRASER RIVER EXTENDED STREAMFLOW PREDICTION SYSTEM Stanley J. Woodcock, Michael Thiemann, and Larry E. Brazil Riverside Technology, inc., Fort Collins, Colorado Esther Vincent and Andy Pineda * Northern
Infiltration Stormwater Control Measures. Andrew R. Anderson, M.S., E.I.T. Extension Associate Engineer
 Infiltration Stormwater Control Measures Andrew R. Anderson, M.S., E.I.T. Extension Associate Engineer Overview of Presentation NCDENR Infiltration Devices Infiltration and the SHWT Innovative infiltration