Soil Feasibility Study. Petronila Creek Nueces County, Texas. Prepared for:
|
|
|
- Silas Preston
- 6 years ago
- Views:
Transcription


1 Soil Feasibility Study Petronila Creek Nueces County, Texas Prepared for: Railroad Commission of Texas Oil and Gas Division Site Remediation and Special Response William B. Miertschin, Assistant Director Prepared by: TRC 505 East Huntland Drive, Suite 250 Austin, Texas Mark A. Robbins, Project Manager September 2008
2
3 Petronila Creek Soil Feasibility Study Railroad Commission of Texas September 2008 TABLE OF CONTENTS Page 1.0 INTRODUCTION Scope of Soil Feasibility Study Site Background Report Contents CONCEPTUAL SITE MODEL Geology and Hydrogeology Potential Sources of Creek Impacts and Migration Pathways Elevated Salinity Areas BMP Prioritization of Areas BMP ALTERNATIVES FOR SALINITY ABATEMENT Evaluation of Mitigation and Removal Options (Areas 1 through 5) Cap Installation Excavation and Off-Site Disposal In-Situ Soil Flushing Immobilization Evaluation of Mitigation and Removal Options (Areas 6 and 7) Technology Selection of BMP PROPOSED BMP DESIGN Basic Design Components and Cost Estimate Excavation of Areas 6 and Subsurface Cap for Area RECOMMENDED BMPs REFERENCES... 1 APPENDIX A TABLES APPENDIX B JUNE 2008 SOIL SAMPLING ANALYTICAL DATA APPENDIX C ENGINEER S COST ESTIMATE APPENDIX D LETTER OF DETERMINATION Project No ii
4 Petronila Creek Soil Feasibility Study Railroad Commission of Texas September 2008 LIST OF FIGURES Page Figure 1-1. Site Location Map Figure 2-1. Site Map Figure 2-2. Chloride Concentrations Along Petronila Creek Figure 2-3. TDS and Conductivity Concentrations Along Petronila Creek Figure 2-4. Site Map Area 1 Chloride Concentrations Figure 2-5. Site Map Area 1 Conductivity Concentrations Figure 2-6. Area 1 Cross Sections A-A and B-B Figure 2-7. Area 1 Cross Section A-A Figure 2-8. Area 1 Cross Section B-B Figure 2-9. Site Map Area 2 Chloride Concentrations Figure Site Map Area 2 Conductivity Concentrations Figure Area 2 Cross Sections C-C and D-D Figure Area 2 Cross Section C-C Figure Area 2 Cross Section D-D Figure Site Map Area 3 Chloride Concentrations Figure Site Map Area 3 Conductivity Concentrations Figure Area 3 Cross Sections E-E and F-F Figure Area 3 Cross Section E-E Figure Area 3 Cross Section F-F Figure Site Map Area 4 Chloride Concentrations Figure Site Map Area 4 Conductivity Concentrations Figure Area 4 Cross Sections G-G Figure Area 4 Cross Section G-G Figure Site Map Area 5 Chloride Concentrations Figure Site Map Area 5 Conductivity Concentrations Figure Area 5 Cross Section H-H and I-I Figure Area 5 Cross Section H-H Figure Area 5 Cross Section H-H Figure Site Map Area 6 Chloride Concentrations Project No iii
5 Petronila Creek Soil Feasibility Study Railroad Commission of Texas September 2008 Figure Site Map Area 6 Conductivity Concentrations Figure Site Map Area 7 Chloride Concentrations Figure Site Map Area 7 Conductivity Concentrations Project No iv
6 Petronila Creek Preliminary Soil Feasibility Study - DRAFT Railroad Commission of Texas August 2008 LIST OF TABLES Page Table 2-1. Ranges and Average of Chloride and Conductivity Concentrations Table 2-2. Mass of Potential Chlorides Per Area Table 2-3. BMP Ranking of Areas 1 through Project No v
7 Petronila Creek Soil Feasibility Study Railroad Commission of Texas September INTRODUCTION 1.1 Scope of Soil Feasibility Study Analytical and geophysical data collected around the Driscoll segment of Petronila Creek indicate broad extents of soils around the creek impacted with salinity. Historic discharge practices of brine water from oil and gas exploration in the area have likely been a primary contributor to elevated salinity levels in soils, groundwater, and Petronila Creek surface water. Chemical signatures of cations and anions (e.g., calcium, sodium, magnesium, chloride and sulfate) suggest that the source of salinity is from produced water associated with deep brine formations (Paine, Nance, and Collins, 2005). Saline water management and discharge during oil and gas exploration and production in the Driscoll area may have included discharge and infiltration into brine pits, and direct discharge into creeks and ditches. In addition, there may have been leaking injection of brine-disposal wells. Salinity levels in the area prior to oil and gas activity may have been elevated due to a combination of factors including: (1) presence of primary saline pore water incorporated during Pleistocene coastal facies of the Beaumont Formation; (2) salt particles blown inland and deposited by prevailing onshore winds; and (3) extensive inland flooding of saline water from the Gulf Mexico and estuarine water during periodic tropical storms (Paine, Nance, and Collins, 2005). The culmination of historic information, analytical data, and geophysical data indicate that sources of elevated salinity are present within approximately seven square miles around Petronila Creek that may contribute, at variable rates, to salinity loading of the creek. This study focuses on evaluating Best Management Practices (BMPs) to address soils determined to have elevated concentrations, and is based on a broadbrush investigation performed between 2006 and 2008 in the areas around Petronila Creek in the general vicinity of United States Highway (US) 77 and County Road (CR) 18. Results of these iterative investigations indicate the ubiquitous nature of salinity in groundwater in the area due to historical oil and gas operations. Data also indicate that elevated levels of salinity in groundwater. Groundwater contamination will be addressed in a separate feasibility study. BMPs considered in this study include containment, in-situ treatment, immobilization, and removal of contaminated soil. Each BMP was evaluated according to a series of factors, including effectiveness, level of effort required to implement, regulatory agency and stakeholder acceptance, and cost. Each area was then assigned a remedial priority based on chloride and conductivity concentrations, extent of impacted soils, and likelihood to impact the creek (e.g., distance to groundwater and surface water, preferential migration pathways). Project No
8 Petronila Creek Soil Feasibility Study Railroad Commission of Texas September Site Background The Total Maximum Daily Load (TMDL) Section of the Texas Commission on Environmental Quality (TCEQ) placed Segment 2204 (Petronila Creek) on the State s 303(d) list because it does not meet water quality standards due to high salinity. Segment 2204 includes the entire length of Petronila Creek, which begins at the confluence of Agua Dulce Creek and Banquete Creek in Nueces County and continues approximately 70 kilometers (km) to Laureles Ranch in Kleberg County. A site location map is presented as Figure 1-1. Results from a TCEQ and Bureau of Economic Geology (BEG) investigation revealed that the chloride and total dissolved solids (TDS) content in Petronila Creek increased significantly between Gauging Station (located at US 77) and Gauging Station (located downstream of the Clara Driscoll oil field). The United States Environmental Protection Agency (USEPA) and TCEQ awarded the RRC a non-point source grant to determine if oil and gas operations along Petronila Creek are contributing to the high salinity of the surface water. The overall objective of this effort is to determine the source(s) leading to the elevated TDS and chloride in Petronila Creek, and to develop BMPs designed to reduce salinity loading in the creek. As part of the TCEQ s TMDL project, BEG conducted an airborne geophysical survey, supporting ground-based measurements, and surface water analyses of Petronila Creek (Segment 2204) (Paine, Nance, and Collins, 2005). According to the BEG report, the results from the geophysical and chemical analyses suggest that the sources of salinity in Petronila Creek between US 77 and the estuarine-influenced zone include brine produced from local oil fields (North Clara Driscoll, Clara Driscoll, and Luby). Some of which was discharged into ditches (referred to as tidal disposal) before the RRC ended that practice in 1987 and/or discharged into pits before the RRC s no pit order was implemented in Airborne geophysical data suggest that there are extensive areas of salinization between the drainage ditches and Petronila Creek that may provide continuing sources of salinity along the Driscoll, Concordia, and Luby segments of Petronila Creek. The Luby Field area, which is at the downstream limit of the surveyed area, is not included in the present investigation because the area coincides with the zone of estuarine mixing (i.e., this portion of the study area also contains naturally-occurring salinity from tidal influence) (Paine, Nance, and Collins, 2005). TRC conducted site reconnaissance along Petronila Creek and record review in May Findings from this effort indicated that historic oil and gas exploration and operations around Petronila Creek may be primary contributors to salinity loading to the Project No
9
10 Petronila Creek Soil Feasibility Study Railroad Commission of Texas September 2008 creek. TRC identified several potential sources in the Driscoll and Concordia oil fields that could contribute salinity to Petronila Creek. Findings and conclusions were provided in the report titled Final Petronila Creek Records Review, Site Reconnaissance Results, and Recommendations issued to the RRC by TRC in August This report recommended that further investigation in the form of soil and water sampling be performed to assess the extent of salinity in groundwater, surface water, and soil around Petronila Creek. TRC conducted a second phase of field investigation (Phase II) during the spring of 2007, which included seasonal surface water monitoring and in-situ assessment of soils within the vicinity of Petronila Creek. The in-situ soil investigation was conducted using Cone Penetrometer Testing (CPT) technology to provide a broad-brush assessment of salinity concentrations around the creek. Findings from both events were submitted to the RRC in the Draft Interim Technical Memorandum for Petronila Creek, prepared by TRC and dated August 10, Surface water analytical data collected during the Phase II event indicated general increases of conductivity, anion, and cation concentrations in Petronila Creek water between Creek Segments 2 and 25, and decreasing concentrations downstream of Segment 25. Of the cations and anions, chloride was detected at the highest concentration. Elevated TDS, conductivity, anion, and cation concentrations were also observed from water samples collected from the North Clara Driscoll and Clara Driscoll oil field drainage ditches, which join Petronila Creek near Creek Segments 6 and 14, respectively. The Phase II groundwater sampling event included the sampling of groundwater monitoring wells associated with two former oil field/pipeline releases, referred to as the Driscoll #2 Site and Driscoll #3 Site. The results of the groundwater sampling collected from these monitoring wells during the spring of 2007 indicated elevated TDS, conductivity, anion, and cation concentrations. Both areas are registered under Solid Waste Number and are currently under the jurisdiction of the TCEQ. The results of the Phase II CPT investigation indicated discrete areas of shallow soils (less than 10 feet below ground surface [bgs]) with elevated conductivity concentrations. Conductivity concentrations in these areas increased with depth, and spread laterally with depth, suggesting vertical and lateral transport in the direction of groundwater flow. A third phase of investigation (Phase III) was completed in December 2007 with a scope of work based on the results of the Phase II investigation. Phase III work focused on specific areas found to have elevated conductivity based on CPT data (and therefore Project No
11 Petronila Creek Soil Feasibility Study Railroad Commission of Texas September 2008 elevated chloride and TDS levels) that may contribute to salinity loading of Petronila Creek. During this phase, seasonal water monitoring was performed and included surface water sampling, stream flow measurements, and gauging stream stage. Groundwater investigation was also performed and involved monitoring well installation, synoptic well and creek gauging, and groundwater sampling of the monitoring wells. Groundwater elevations collected from monitoring wells in October and December 2007 were compared to the approximate elevation of the bottom of the creek. Groundwater elevations were higher than the bottom of the creek suggesting that a hydraulic connection is present (i.e., gaining creek) between Petronila Creek and the groundwater bearing unit (GWBU). Analysis of cross-sections showing lithology, potentiometric elevations, and the creek profile indicate that the GWBU intersects Petronila Creek to a greater extent in the downstream direction where the creek is more deeply incised (downstream of Segment 9). Between June and September 2007, the Petronila Creek area received precipitation in excess of the average rainfall for the area and caused flooding in the area. Analytical data of the water in Petronila Creek was collected in October 2007 and indicated a significant increase in salinity between Segments 2 and 6, a slight increase in salinity between Segments 6 and 19, and a moderate decrease in salinity between Segments 19 and 33, as compared to salinity concentrations observed in February 2007 (TRC, 2007b). Similar increases in salinity were observed in analytical results of samples collected from the North Clara Driscoll and Clara Driscoll drainage ditches. Salinity increases (including chloride, TDS, and sulfate) were observed in the North Clara Driscoll drainage ditch between sample locations P-D-02 and P-D-01, and in the Clara Driscoll drainage ditch between sample locations P-D-06 and P-D-07 (TRC, 2007b). The soil analytical data collected during the Phase III investigation identified elevated salinity concentrations at shallow soil depths in the following areas: Driscoll #2 Site, Driscoll #3 Site, oil field wasteland areas near P-MW-3, P-MW-6 and P-MW-16, and the drainage ditches along CR18 and North Clara Driscoll field. The Phase III groundwater analytical data for the shallow wells indicated that the highest salinity concentrations occurred at the Driscoll #3 Site, oil field wasteland areas near P-MW-3, P- MW-6, P-MW-16, and wells P-MW-20 and P-MW-21, located along drainage ditch CR18. A cumulative analysis of the soil and groundwater information gathered from the Phase II and Phase III investigations suggested seven likely source areas: (1) oil wasteland south of Petronila Creek near well P-MW-16; (2) oil wasteland area south of Petronila Creek near well P-MW-6; (3) oil wasteland area north of Petronila creek near Project No
12 Petronila Creek Soil Feasibility Study Railroad Commission of Texas September 2008 well P-MW-03; (4) unknown source near the Driscoll #2 Site (P-D2-MW-12); (5) former disposal pit near the Driscoll #3 Site (P-D3-MW-27; (6) North Clara Driscoll drainage ditch; and (7) CR18 drainage ditch (TRC, 2007b). These elevated salinity areas were investigated as part of this feasibility study based on their likelihood to impact Petronila Creek by leaching/migration via groundwater and/or surface runoff. These seven locations with elevated salinity levels are presented in Section 2.0. Field sampling conducted in June 2008 focused on the collection of soil samples from each of the seven areas identified in the Phase III report with the objective of determining the feasibility of addressing each area with one or more BMPs. Each of the elevated salinity areas (i.e., potential source areas) was investigated in closer detail with the collection of multiple soil or ditch sediment samples. The June 2008 sampling results are integrated into this feasibility study. Tabulated analytical results are provided in Appendix A, and the laboratory analytical reports are provided in Appendix B. 1.3 Report Contents The remainder of this report provides a conceptual site model (Section 2.0), alternatives for salinity/tds abatement (Section 3.0), BMP design alternatives (Section 4.0), and the recommended BMP (Section 5.0). Project No
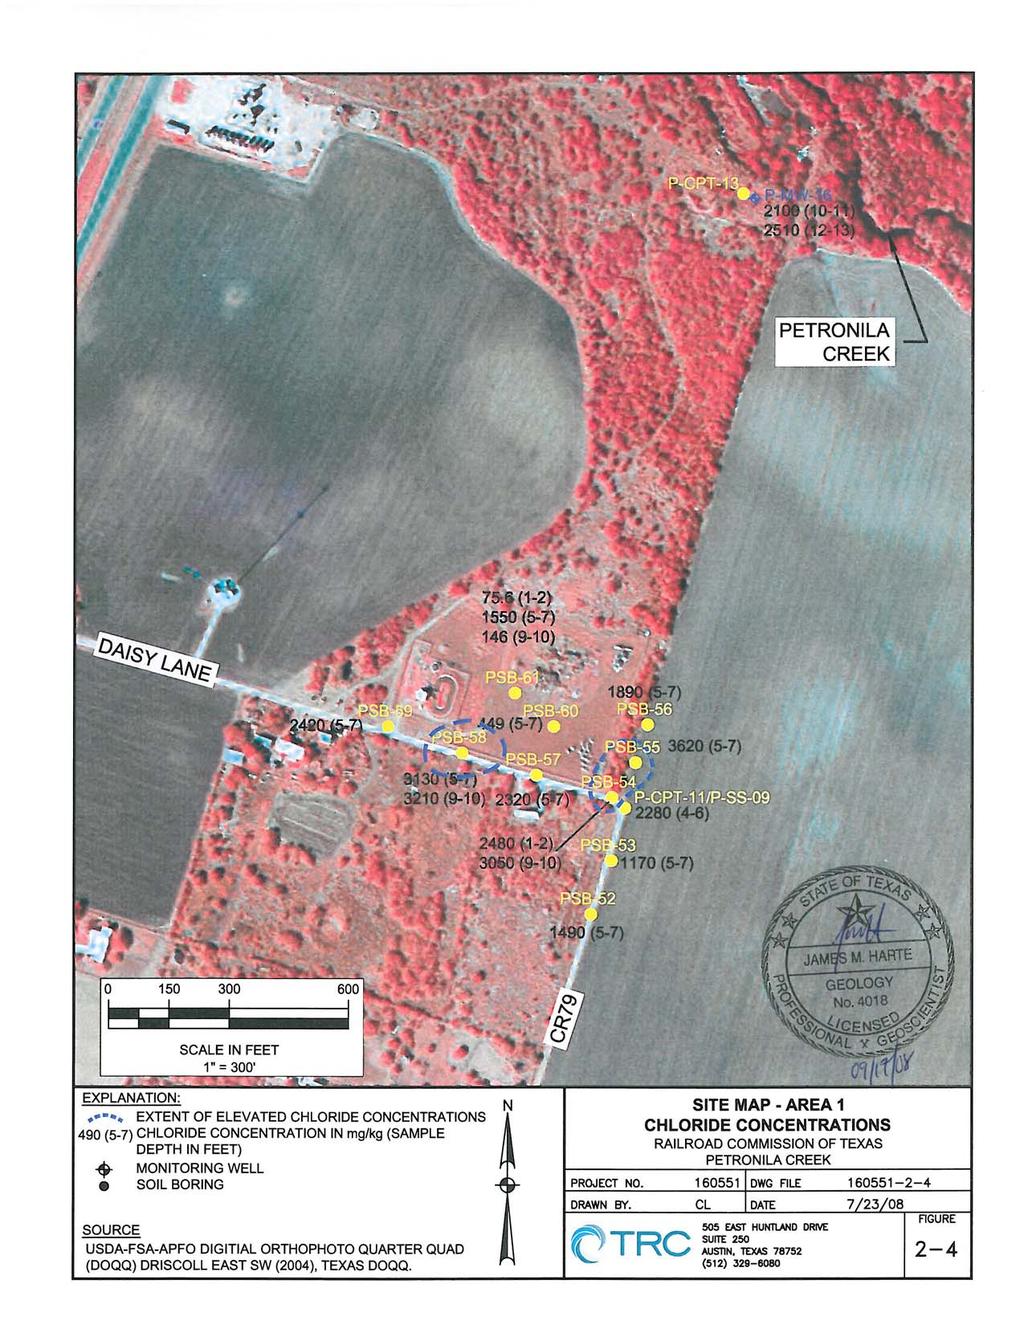
13 Petronila Creek Soil Feasibility Study Railroad Commission of Texas September CONCEPTUAL SITE MODEL This feasibility study evaluates BMPs at the seven source areas identified during the project field investigations. To simplify investigation and discussion, each of the source areas identified in the Phase II and Phase III investigations was designated a numeric identification as described below and shown on Figure 2-1: Area 1 Oil wasteland area south of Petronila Creek near CPT boring P-CPT- 11 Area 2 Oil wasteland area south of Petronila Creek near Well P-MW-6 Area 3 Oil wasteland area north of Petronila Creek near Well P-MW-03 Area 4 Unknown source near the El Paso Driscoll #2 release site Area 5 Former disposal pit near El Paso Driscoll #3 release site Area 6 North Clara Driscoll drainage ditch Area 7 CR18 drainage ditch A conceptual site model was developed to define the physical setting of these areas relative to Petronila Creek. The conceptual site model includes a description of the geology/hydrogeology, chemicals of concern, distribution of salinity and other target constituents in each of the focus areas, and migration pathways of saline-impacted water. 2.1 Geology and Hydrogeology Based on the BEG Geologic Atlas of Texas, Corpus Christi Sheet, the Quaternary alluvium deposits and the Beaumont Formation are the only geologic units in direct contact with Petronila Creek in the Driscoll and Concordia areas. The Beaumont Formation consists of clay, silt, sand, and gravel, includes mainly stream channel, point bar, natural levee, and backswamp deposits, and has a thickness of approximately100 feet (BEG, 1975). The subsurface lithology interpreted to a maximum depth of approximately 61 feet bgs, based on monitoring wells, and CPT and soil borings, indicated predominantly clays and silts from ground surface to between 10 and 15 feet bgs. Below 10 to 15 feet bgs (approximately 40 feet above mean sea level [amsl]), laterally continuous and discontinuous silty sand lenses reside within a matrix of sandy clay and/or finer grained materials (i.e., silts and clays). These sandy lenses are generally five to 15 feet thick and appear to be more continuous and thicker to the southeast towards Baffin Bay and the Project No
14
15 Petronila Creek Soil Feasibility Study Railroad Commission of Texas September 2008 Gulf of Mexico. The lithologic data collected from the subsurface investigations are consistent with a fluvial depositional environment and are representative of the Beaumont Formation. The principal GWBUs in Nueces County are the Goliad Sand, Lissie Formation, and Beaumont Formation. In general, these three units are located within the Gulf Coast Aquifer. Groundwater in these GWBUs flows southeastward toward the Gulf of Mexico and occurs under unconfined and confined conditions (TWDB, 1968). The Gulf Coast Aquifer is separated into two subunits, known as the Chicot Aquifer and Evangeline Aquifer. In Nueces County, the Chicot Aquifer is located within the Beaumont Formation and overlying alluvium. The Evangeline Aquifer is older than the Chicot Aquifer and generally located at deeper levels within the Goliad Formation in Nueces County (TWDB, 1968). Based on observed lithologic information from subsurface drilling, Petronila Creek and the seven focus areas are within the Chicot Aquifer. The lithology of the Beaumont Formation varies with depth, and the project monitoring wells were screened within the following lithologic layers: clays/silts (generally shallower wells), sand lenses (generally deeper wells), or both (intermediate wells). The presence of a static water level in monitoring wells screened in the shallower clays and silty clays suggests that these clays are saturated, even though field observations did not indicate obvious saturated conditions. The potentiometric groundwater levels reveal vertical groundwater gradients (both upward and downward), and saturated shallow clay units around the creek suggest that the GWBU exists under unconfined conditions with recharge from surface infiltration. 2.2 Potential Sources of Creek Impacts and Migration Pathways Oil and gas exploration and management practices, as discussed in Sections 1.1 and 1.2, have impacted soil and groundwater around the creek. Several source areas were identified during the Phase II and Phase III investigations. This soil feasibility study addresses the seven most likely source areas identified to date; these seven potential source areas are listed in Section 2.0. Because these investigations covered such a large area and there is incomplete historical data on land use, it is feasible that there may be other contributing areas that were not discovered during the Phase II and Phase III investigations. Analytical data collected in February and October 2007 detected elevated concentrations of salinity between Segments 2 and 34 of Petronila Creek. The salinity levels increased between Segments 2 and 20 suggesting saline loading into Petronila Creek occurs between Segments 2 and 20. Chloride, TDS, and conductivity concentrations detected along Petronila Creek for both sampling events are plotted in Project No
16 Petronila Creek Soil Feasibility Study Railroad Commission of Texas September 2008 Figures 2-2 and 2-3. Salinity concentrations observed in October 2007 were greater than February The increase in TDS and chloride concentrations is most likely related to significant amounts of precipitation in the area during the summer of Precipitation would cause more leaching of salinity constituents that percolate vertically to the GWBU and increase surface erosion/runoff to the creek. The greatest increase in concentrations from February to October 2007 occurred between Segments 2 and 6 where several of the high salinity areas are relatively close to the creek resulting in the following: (1) shorter distance for groundwater to migrate from the source to the creek, and/or (2) direct salinity loading to the creek from surface runoff. Analytical data of water samples collected from Petronila Creek are presented in Table 1 of Appendix A. The fate and transport of saline-impacted media from the potential source areas to the creek is not completely understood; therefore, the relative contribution of salinity loading to the creek by each area has not been determined. In addition, data indicate elevated salinity concentrations in the GWBU over a broad portion of the study area and this ubiquitous source area presents another mechanism of salinity loading. These issues are being addressed in a separate feasibility study that includes development of a conceptual site model of groundwater to provide more perspective and information regarding salinity flux to the creek. Potential migration pathways from areas closest to the creek may be two-fold: (1) leaching from soil followed by percolation to the GWBU and then migration via the GWBU to the creek, and (2) direct salinity loading to the creek by erosion and surface runoff. Visual evidence of erosion and surface water runoff (i.e., drainage channels that trend toward the creek) was observed in Area 2. Potential source areas farther from Petronila Creek may also contribute to salinity loading of Petronila Creek; however, the predominant transport to the creek will be leaching from soil followed by percolation to the GWBU and then migration via the GWBU to the creek. Evidence of vertical migration is indicated by CPT conductivity data collected from Areas 4 and 5 showing increasing conductivity with depth. Analytical data collected at Areas 1 and 3 suggest that vertical migration of salinity to the GWBU with eventual advection towards the creek may also be the primary form transport away from these areas. These pathways will be discussed in more detail in the groundwater conceptual site model. The greatest quantity of salinity loading to the creek may be from Areas 6 and 7, which are ditches that drain water from large agricultural areas in the vicinity. Analytical results of sediment samples collected from these areas detected elevated concentrations of chlorides and conductivity over long distances (up to 8,000 feet) across each ditch. Project No
17 Figure 2-2 Chloride Concentrations Along Petronila Creek Petronila Creek Segment Chloride Concentration (mg/l)
18 Figure 2-3 TDS and Conductivity Concentrations Along Petronila Creek Creek Segment Concentration (mg/l) Conductivity (µs/cm) TDS Concentration - October 2007 Conductivity Concentration - October 2007 TDS Concentration - February 2007 Conductivity Concentration - February 2007
19 Petronila Creek Soil Feasibility Study Railroad Commission of Texas September 2008 Predominant transport from these areas would be leaching during storm events with direct flow to Petronila Creek. Infiltration and vertical leaching through the bottom of the ditch to the GWBU may be a secondary transport mechanism. Evidence of this secondary transport mechanism is observed along the CR18 ditch where a plume of elevated CPT conductivity data starts at the ditch near the intersection of CR77 and CR18 and then moves downgradient (i.e., southeast). 2.3 Elevated Salinity Areas The June 2008 field investigation, which involved soil sampling in the seven focus areas identified at the beginning of Section 2.0, was conducted to understand the concentration and distribution of salinity components in the soil. The field investigation tasks were completed in general accordance with the following documents: Work Order for Soil Delineation and Feasibility Study, Petronila Creek, Driscoll, Nueces County, Texas (TRC, 2008), submitted to the RRC May 9, 2008, and approved May 13, Investigation of Increased Salinity Along Petronila Creek (Segment 2204) Quality Assurance Project Plan Revision 1 (RRC, 2007) submitted by the RRC to the TCEQ and USEPA in February 2007, and approved April 24, The following variances from the Work Order are noted: Nine soil borings were planned for Area 1; however, a tenth boring was completed. The Work Order stated that one soil sample per boring would be submitted for laboratory analysis at Areas 1 to 5. However, two or three soil samples were submitted from several borings to obtain better vertical definition. Photo-ionization detector (PID) was not used to field screen the soil samples because the main constituents of concern were chloride and conductivity. A PID was used for health and safety purposes to monitoring the breathing zone during drilling operations. Soil samples were collected and submitted to DHL Analytical (Austin, Texas) for analysis of chloride (SW846 Method 6020), electrical conductivity (Agron ), and moisture content (ASTM D2216). No deviations from the QAPP were noted. Soil borings were completed in Areas 1 through 5 using a direct push technology (DPT) rig. Continuous soil samples to a maximum depth of 20 feet bgs were collected Project No
20 Petronila Creek Soil Feasibility Study Railroad Commission of Texas September 2008 from each borehole using a split-barrel sampler. The soil analytical data is provided in Table 2 of Appendix A, and the laboratory reports are provided in Appendix B. For the purpose of this assessment, elevated levels are defined as chloride concentrations in excess of 3,000 milligrams per kilogram (mg/kg) and conductivity concentrations in excess of 8,000 micromhos per centimeter (µmhos/cm). These threshold levels were based on the RRC s Field Guide for the Assessment and Cleanup of Produced Water Releases-Draft dated June 28, 2006, and were used to make relative definition of elevated salinity levels in soil. The lateral and vertical distribution of chloride and conductivity concentrations detected in Areas 1 through 5 is depicted in Figures 2-4 through Soils with chloride and conductivity concentrations in excess of their respective threshold levels are identified with a blue dashed line (chloride) or red dashed line (conductivity) in each of the figures. The extent of elevated concentrations (i.e., defined by the dashed lines) at Areas 1 through 5 was determined using a combination of analytical data and observation of vegetation that is indicative of shallow soils with salinity concentrations that do not pose an adverse ecological impact. Additional delineation may be needed during the design phase, if a BMP is applied to any of these areas. The soils with the highest concentrations relative to each area are identified with a gray box in the figures and represent the areas that were initially considered for remediation. The high concentration area defined by the gray box is not based on formal clean-up levels since these have not been developed at this point in the project. Area 1 was not defined with a gray box because the concentrations were low relative to the remaining areas. The concentration range and average concentration for chloride and conductivity, and the estimated area of saline-impacted soil is summarized in Table 2-1. Project No
21
22
23
24
25
26

27
28
29
30
31
32
33
34
35
36

37
38
39
INVESTIGATIONS AND ABATEMENT OF PRODUCED WATER IMPACTS AND SEEPS TO SURFACE WATER
 INVESTIGATIONS AND ABATEMENT OF PRODUCED WATER IMPACTS AND SEEPS TO SURFACE WATER Introduction SECTION 319 NONPOINT SOURCE GRANT UPPER COLORADO RIVER BASIN (Segment 1426) Coke and Runnels Counties, Texas
Chapter 7 Shallow Ground Water Study Team
 Chapter 7 Shallow Ground Water Study Team Objective What are the shallow ground water issues of concern and what needs to be done? Introduction The Shallow Ground Water Study Team (Team) was formed to
RISK MANAGEMENT OF A FORMER SALT STORAGE YARD
 RISK MANAGEMENT OF A FORMER SALT STORAGE YARD Robert S. Nichols, B.Sc., P.Eng. and Trent Parks, Ph.D., P.Chem. Abstract A risk management plan was developed by Matrix Solutions Inc. (Matrix) and implemented
Hilmar Cheese Company, Hilmar, Merced County, California. On behalf of Hilmar Cheese Company (HCC), Jacobson James & Associates, Inc.
, Jacobson James & Associates, Inc.") May 13, 2009 Mr. Jan Alfson California Regional Water Quality Control Board Fresno Branch Office 1685 E Street Fresno, CA 93706 Subject: Data Gap Work Plan Addendum Hilmar Cheese Company, Hilmar, Merced
May 13, 2009 Mr. Jan Alfson California Regional Water Quality Control Board Fresno Branch Office 1685 E Street Fresno, CA 93706 Subject: Data Gap Work Plan Addendum Hilmar Cheese Company, Hilmar, Merced
Conceptual Site Models for Environmental Investigations and Remediation
 Remediation Technology Symposium (RemTech) 2012 Conceptual Site Models for Environmental Investigations and Remediation October 18, 2012 Tai T. Wong, P.Eng. Authors and Presenter Authors: James Carss,
Application of Mulch Biowall for Anaerobic Treatment of Perchlorate in Shallow Groundwater
 Paper G-04, in: G.B. Wickramanayake and H.V. Rectanus (Chairs), In Situ and On-Site Bioremediation 2009. Tenth International In Situ and On-Site Bioremediation Symposium (Baltimore, MD; May 5 8, 2009).
Remediation of Sodium Contaminated Sites
 Remediation of Sodium Contaminated Sites..\..\3918b1ca23763e9e9a12ffd67acb0ceb.jpg 21 st International Petroleum Environmental Conference, Houston, Texas Mark Landress P.G. Project Navigator, Ltd. 10497
Large-Scale Implementation of Recirculation Systems for In-Situ Treatment of Hexavalent Chromium in Groundwater in Hinkley CA 17338
 WM217 Conference, March 5 9, 217, Phoenix, Arizona, USA Large-Scale Implementation of Recirculation Systems for In-Situ Treatment of Hexavalent Chromium in Groundwater in Hinkley CA 17338 Margy Gentile
Criteria for mapping brackish groundwater
 Criteria for mapping brackish groundwater Texas Desal 2018 John Meyer, P.G. Innovative Water Technologies Texas Water Development Board Unless specifically noted, this presentation does not necessarily
GEOTECHNICAL INVESTIGATION PROPOSED OUTFALL LOCATION CITY OF MORGAN S POINT DRAINAGE HARRIS COUNTY, TEXAS REPORT NO
 GEOTECHNICAL INVESTIGATION PROPOSED OUTFALL LOCATION CITY OF MORGAN S POINT DRAINAGE HARRIS COUNTY, TEXAS REPORT NO. 1140198001 Reported to: SIRRUS ENGINEERS, INC. Houston, Texas Submitted by: GEOTEST
Physiographic zones. and water quality
 Southland Physiographic zones Central Plains Technical information Physiographic zones are part of the Water and Land 2020 & Beyond project that aims to maintain and improve water quality in the Southland
Groundwater Monitoring Requirements of the CCR Rule What s Next?
 2017 World of Coal Ash (WOCA) Conference in Lexington, KY - May 9-11, 2017 http://www.flyash.info/ Groundwater Monitoring Requirements of the CCR Rule What s Next? Thomas A. Mann, PE SynTerra Corporation,
D.G.S.W. Pitakumbura Manager (Groundwater Studies) Groundwater Section NWS&DB. Groundwater recharge or deep drainage or
 Groundwater Section NWS&DB. Groundwater recharge or deep drainage or") Groundwater Recharge and Extraction Techniques D.G.S.W. Pitakumbura Manager (Groundwater Studies) Groundwater Section NWS&DB What is Groundwater Recharge Groundwater recharge or deep drainage or deep percolation
Groundwater Recharge and Extraction Techniques D.G.S.W. Pitakumbura Manager (Groundwater Studies) Groundwater Section NWS&DB What is Groundwater Recharge Groundwater recharge or deep drainage or deep percolation
GROUNDWATER General Facts and Concepts
 GROUNDWATER General Facts and Concepts General schematic of hydrologic cycle. As the term implies, water moves within the cycle and groundwater (aquifer) is just one zone of the cycle. Aquifers and Wells
A-2. Soils. Soil Media. Chapter Contents. Soil Media In-situ Soil Testing Separation from Seasonal High Water Table (SHWT)
") A-2. Soils Chapter Contents Soil Media In-situ Soil Testing Separation from Seasonal High Water Table (SHWT) Importance of Soil Composition in SCMs The soil composition of many stormwater SCMs also is
A-2. Soils Chapter Contents Soil Media In-situ Soil Testing Separation from Seasonal High Water Table (SHWT) Importance of Soil Composition in SCMs The soil composition of many stormwater SCMs also is
Impact of effluent disposal pit on groundwater quality at Sabriya oil field
 Water Pollution XI 241 Impact of effluent disposal pit on groundwater quality at Sabriya oil field M. Al-Senafy, A. Mukhopadhyay, A. Al-Khalid, H. Bhandary, K. Al-Fahad & A. Bushehri Hydrology Department,
MEMORANDUM. Kathy Yager USEPA OSRTI Dick Goehlert USEPA Region 1 Darryl Luce USEPA Region 1 Mindy Vanderford, GSI Environmental, Inc.
 MEMORANDUM To: From: Kathy Yager USEPA OSRTI Dick Goehlert USEPA Region 1 Darryl Luce USEPA Region 1 Mindy Vanderford, GSI Environmental, Inc. (GSI) Doug Sutton, GeoTrans, Inc. Rob Greenwald, GeoTrans,
Woodburn, James Russell Bojes, Heidi Pope, Peter G. Railroad Commission of Texas Austin, TX
 Woodburn, James Russell Bojes, Heidi Pope, Peter G. Railroad Commission of Texas Austin, TX Characterize the source(s) of elevated groundwater salinity detected in a residential water well in Goliad County
Draft Fact Sheet Butte County Stable Isotope Recharge Study
 Agenda Item #4 Draft Fact Sheet Butte County Stable Isotope Recharge Study Purpose of the Study: To develop a better understanding of how various water sources contribute to recharge of Butte County groundwater.
East Maui Watershed Partnership Adapted from Utah State University and University of Wisconsin Ground Water Project Ages 7 th -Adult
 INTRODUCTION What is groundwater? Water contained in saturated soil and rock materials below the surface of the earth. It is not NEW water, but is recycled water through the hydraulic cycle. The source
Cleaning Up a Salt Spill: Predictive Modelling and Monitoring Natural Attenuation to Save Remedial Costs
 Cleaning Up a Salt Spill: Predictive Modelling and Monitoring Natural Attenuation to Save Remedial Costs Outline Introduction Remedial Alternatives Alternate Approach: Site Assessment and Predictive Modelling
Movement and Storage of Groundwater The Hydrosphere
 Movement and Storage of Groundwater The Hydrosphere The water on and in Earth s crust makes up the hydrosphere. About 97 percent of the hydrosphere is contained in the oceans. The water contained by landmasses
Synopsis. Geoffrey R. Tick Dorina Murgulet Hydrogeology Group The University of Alabama UA Project Number Grant # 09-EI UAT-2
 Assessment of Groundwater Flow Paths and Discharge to the Coastal Region of Baldwin County, Alabama to Understand Contaminant Transport using a Cross- Sectional Groundwater Flow and Transport Synopsis
Model-Simulated Ground Water Elevation at the Green Spot Site (MW-4) Baseline Scenario (1992 to 2002)
 Baseline Scenario (1992 to 2002)") Big Bear Area Regional Wastewater Authority Analysis of Ground Water Flow Model Simulations for the Proposed Green Spot Artificial Recharge Site 6895 6885 6875 Model-Simulated Ground Water Elevation at
Big Bear Area Regional Wastewater Authority Analysis of Ground Water Flow Model Simulations for the Proposed Green Spot Artificial Recharge Site 6895 6885 6875 Model-Simulated Ground Water Elevation at
Exploring Dynamic Interactions Between Surface Water and Groundwater at a Point Bar System in the Muskegon River Watershed
 Exploring Dynamic Interactions Between Surface Water and Groundwater at a Point Bar System in the Muskegon River Watershed Introduction The quality of critical surface water resources is linked to the
Groundwater Monitoring System Certification
 Groundwater Monitoring System Certification for Compliance with the Coal Combustion Residuals (CCR) Rule Xcel Energy July 21, 2016, Denver, Colorado Table of Contents 1.0 Introduction... 1 2.0 Facility
Helena Valley Ground Water Monitoring Program
 Helena Valley Ground Water Monitoring Program James Swierc Lewis & Clark County Water Quality Protection District October 6, 2011 WQPD Sampling Program Overview Helena Area Water Related Issues Nutrient
THE ANTELOPE VALLEY WATER BANK PILOT BASIN PROJECT: FROM ONE ACRE TO 1600 ACRES
 THE ANTELOPE VALLEY WATER BANK PILOT BASIN PROJECT: FROM ONE ACRE TO 1600 ACRES Michael A. Milczarek 1, Dale P. Hammermeister 1, Robert C. Rice 1, Andrew J. Werner 2 and David W. Dorrance 2 1 GeoSystems
Field Demonstration of Zerovalent Iron Treatment Technology in Parker Brothers Arroyo Status Report
 Texas Custodial Trust 2301 West Paisano Drive El Paso, Texas 79922-1622 Field Demonstration of Zerovalent Iron Treatment Technology in Parker Brothers Arroyo Status Report January 2014 6835001 Report Prepared
Closed Castner Firing Range Remedial Investigation. Technical Project Planning (TPP) Meeting #4 07 November :00 AM 11:00 AM
 Meeting #4 07 November :00 AM 11:00 AM") Closed Castner Firing Range Remedial Investigation Technical Project Planning (TPP) Meeting #4 0 9:00 AM 11:00 AM Imagine result 2017 7 the November 1 Meeting Agenda Remedial Investigation (RI) Project
Closed Castner Firing Range Remedial Investigation Technical Project Planning (TPP) Meeting #4 0 9:00 AM 11:00 AM Imagine result 2017 7 the November 1 Meeting Agenda Remedial Investigation (RI) Project
Effluent Disposal Feasibility Alternatives Study of Morro Valley
 Final Report Effluent Disposal Feasibility Alternatives Study of Morro Valley Morro Bay, California Prepared for Michael K. Nunley & Associates and the City of Morro Bay August 2016 Prepared by Table of
EKOS Oct 2010 COMBINING SOIL GAS SAMPLING AND MIP INVESTIGATION TO OPTIMIZE A DNAPL SOURCE ZONE CHARACTERIZATION
 COMBINING SOIL GAS SAMPLING AND MIP INVESTIGATION TO OPTIMIZE A DNAPL SOURCE ZONE CHARACTERIZATION Paulo Valle Principal Consultant ERM Benelux EKOS Oct 2010 Area Layout & Project Goals Groundwater Flow
Numerical Groundwater Flow Model Report. Caloosa Materials, LLC 3323 Gulf City Road Ruskin, Florida 33570
 Numerical Groundwater Flow Model Report Caloosa Materials, LLC 3323 Gulf City Road Ruskin, Florida 33570 GHD 2675 Winkler Ave Suite 180 Fort Myers, FL 33901 11138224 Report July 27, 2017 Table of Contents
Wickes Manufacturing TCE Plume Site Mancelona, Michigan
 Wickes Manufacturing TCE Plume Site Mancelona, Michigan December 2017 What is TCE? Trichloroethylene (TCE) Common Industrial Solvent Known Human Carcinogen Federal and State Safe Drinking Water of 5 µg/l
Site Profiles - View. General Information. Contaminants: Site Name and Location: Description: Historical activity that resulted in contamination.
 Site Profiles - View General Information Site Name and Location: Description: Historical activity that resulted in contamination. Rummel Creek Shopping Center Houston, Texas, United States The facility
Chapter 2: Aquifers and groundwater
 Chapter 2: Aquifers and groundwater Groundwater movement through aquifers is driven by differences in groundwater levels or pressure and is controlled by how porous the material is that it passes through.
Remediation of Brine Spills- What Goes Wrong Kerry Sublette
 Remediation of Brine Spills- What Goes Wrong Kerry Sublette University of Tulsa Spills of produced water or brine on soil result in two types of damage: Excess salinity Creates an osmotic imbalance that
AQUIFER STUDIES RELATED TO GEOLOGIC STORAGE OF CO 2
 AQUIFER STUDIES RELATED TO GEOLOGIC STORAGE OF CO 2 Presenter: Rebecca C. Becky Smyth Gulf Coast Carbon Center,, Jackson School of Geosciences, The University of Texas at Austin ACKNOWLEDGEMENTS Fellow
Upper Basalt-Confined Aquifer
 2.14 Upper Basalt-Confined Aquifer D. R. Newcomer and J. P. McDonald Upper basalt-confined aquifer groundwater quality is monitored because of the potential for downward migration of contaminants from
SEMI-QUANTITATIVE RISK ASSESSMENT FOR SMALL CLOSED LANDFILLS
 SEMI-QUANTITATIVE RISK ASSESSMENT FOR SMALL CLOSED LANDFILLS Abstract Phil Lindsay (email: plindsay@golder.co.nz) Golder Associates Ltd Level 1, 79 Cambridge Terrace Christchurch Margaret Leonard Current
Water Resources on PEI: an overview and brief discussion of challenges
 Water Resources on PEI: an overview and brief discussion of challenges Components: Components and links Atmospheric water Surface water (including glacial water) Groundwater Links: Precipitation (atm(
atertech Banff, AB. April 29-May 1, 2009
 DILUTION IS NOT A SALT SOLUTION Case Studies: Assessment, Containment and Recovery of Two Produced Water Spills into Domestic Use Aquifers in Central Alberta 2 AUTHORS Randy Brunatti and Reed Jackson AMEC
Hydrogeochemical Evaluation of the Texas Gulf Coast Aquifer System and Implications for Developing Groundwater Availability Models
 Hydrogeochemical Evaluation of the Texas Gulf Coast Aquifer System and Implications for Developing Groundwater Availability Models Presented to: TEXAS GROUNDWATER PROTECTION COMMITTEE (TGPC) Fiscal Year
Oso Creek and Oso Bay Data Report
 Oso Creek and Oso Bay Data Report February 2011 Prepared by: Texas Stream Team River Systems Institute Texas State University San Marcos This report was prepared in cooperation with the Texas Commission
Appendix L East Property Report
 231 West Paisano Drive El Paso, Texas 79922 Appendix L East Property Report L-1: East 14 Investigation Work Plan L-2: East Property Electrical Resistivity Survey Summary Memorandum 68351 231 West Paisano
February 23, 2010 Version 0.0
 February 23, 2010 Version 0.0 New Jersey Department of Environmental Protection Site Remediation Program Guidance for Light Non-aqueous Phase Liquid (LNAPL) Free Product Initial Recovery and Interim Remedial
KARST GEOLOGY, VAPOR INTRUSION, AND HUMAN HEALTH RISK ASSESSMENT. Fundamental Issues to Consider
 KARST GEOLOGY, VAPOR INTRUSION, AND HUMAN HEALTH RISK ASSESSMENT Fundamental Issues to Consider Introduction 2 Development of property with karst features Standard geologic investigation methods to determine
Workshop 1 Our Groundwater and Surfacewaters are Connected and We are What We Drink Hosted by: Lackawanna County Conservation District
 Workshop 1 Our Groundwater and Surfacewaters are Connected and We are What We Drink Hosted by: Lackawanna County Conservation District Sponsored by: Pocono Northeast RC&D Council Through the C-SAW C Program
1. Introduction Site Information Site Characteristics Hydrogeologic Setting... 2
 Table of Contents 1. Introduction... 1 1.1 Site Information... 1 1.2 Site Characteristics... 1 1.3 Hydrogeologic Setting... 2 2. Closure Plan... 5 2.1 Closure Description... 5 2.2 Closure Timeframe...
Numerical Modeling of Groundwater Flow in the Navajo Sandstone Aquifer at the Tuba City, Arizona, Disposal Site 15167
 Numerical Modeling of Groundwater Flow in the Navajo Sandstone Aquifer at the Tuba City, Arizona, Disposal Site 15167 ABSTRACT Richard Bush*, Timothy Bartlett** *US DOE, Office of Legacy Management **Stoller
Conceptual Site Model Considerations - Terrestrial/Groundwater
 Site Description Site Conditions Location: Size: Site Status: Active Inactive Unknown Describe present site conditions using information obtained during property inspection or sitespecific documents to
General Groundwater Concepts
 General Groundwater Concepts Hydrologic Cycle All water on the surface of the earth and underground are part of the hydrologic cycle (Figure 1), driven by natural processes that constantly transform water
Plume Area Treatment Example
 Page 1 of 5 H R C T E C H N I C A L B U L L E T I N # 2. 5. 1 Plume Area Treatment Example HRC injection grids are commonly employed at project sites where a localized plume of chlorinated solvent contamination
15A NCAC 02C.0225 GROUNDWATER REMEDIATION WELLS (a) Groundwater Remediation Wells are used to inject additives, treated groundwater, or ambient air
 Groundwater Remediation Wells are used to inject additives, treated groundwater, or ambient air") 15A NCAC 02C.0225 GROUNDWATER REMEDIATION WELLS (a) Groundwater Remediation Wells are used to inject additives, treated groundwater, or ambient air for the treatment of contaminated soil or groundwater.
15A NCAC 02C.0225 GROUNDWATER REMEDIATION WELLS (a) Groundwater Remediation Wells are used to inject additives, treated groundwater, or ambient air for the treatment of contaminated soil or groundwater.
Groundwater basics. Groundwater and surface water: a single resource. Pore Spaces. Simplified View
 Groundwater and surface water: a single resource Santa Cruz River, Tucson Groundwater basics Groundwater is water found within the pore spaces of geologic material beneath the surface of the Earth. It
Conceptualization and Cost Estimate for Remediation Alternatives Cotter Mill Site Cañon City, Colorado
 Conceptualization and Cost Estimate for Remediation Alternatives Cotter Mill Site Cañon City, Colorado Prepared for: P.O. Box 1750 Cañon City, Colorado 81215 Prepared by: December 2009 Project No. 110071
2017 GROUNDWATER MONITORING & CORRECTIVE ACTION REPORT COAL ASH PONDS ELMER SMITH STATION DAVIESS COUNTY OWENSBORO, KENTUCKY
 2017 GROUNDWATER MONITORING & CORRECTIVE ACTION REPORT COAL ASH PONDS ELMER SMITH STATION DAVIESS COUNTY OWENSBORO, KENTUCKY Prepared For: OWENSBORO MUNICIPAL UTILITIES OWENSBORO, KENTUCKY Prepared By:
4. LNAPL Conceptual Site Model (LCSM)
") 4. LNAPL Conceptual Site Model (LCSM) Figure 4-1. LNAPL conceptual site model (LCSM) stages and integration with LNAPL alternative evaluation. The LCSM is the collection of information that incorporates
4. LNAPL Conceptual Site Model (LCSM) Figure 4-1. LNAPL conceptual site model (LCSM) stages and integration with LNAPL alternative evaluation. The LCSM is the collection of information that incorporates
Umetco Minerals Corporation
 Umetco Minerals Corporation 310 George Patterson Blvd, suite 100, Bristol, Pennsylvania 19007 (215) 785-7373 March 30, 2016 Ms. Linda A. Hanson, P.G. Arkansas Department of Environmental Quality Water
Groundwater in the Santa Rosa Plain
 . Groundwater in the Santa Rosa Plain Marcus Trotta, PG, CHg Principal Hydrogeologist Sonoma County Water Agency Santa Rosa Plain Groundwater Sustainability Agency October 12, 2017 www.sonomacountywater.org
DYNFLOW accepts various types of boundary conditions on the groundwater flow system including:
 Section 6 Groundwater Flow Model A groundwater flow model was developed to evaluate groundwater flow patterns in the site area and to provide a basis for contaminant transport modeling. 6.1 Model Code
FAX
 21335 Signal Hill Plaza Suite 100 Sterling, Virginia 20164 www.geotransinc.com 703-444-7000 FAX 703-444-1685 Mr. William Kutash Florida Department of Environmental Protection Waste Management Division
EXECUTIVE SUMMARY. 2. The effect of remediation on the distribution and mobility of both the LNAPL and water within the zone of interest.
 EXECUTIVE SUMMARY For many decades, the oil production industry has recognized that significant limitations exist to complete extraction of oil from geologic formations. Attempts to recover fuels and crude
DESIGN PARAMETERS FOR MULTI-PHASE EXTRACTION SYSTEMS USING UNSATURATED AND SATURATED SOIL PROPERTIES
 DESIGN PARAMETERS FOR MULTI-PHASE EXTRACTION SYSTEMS USING UNSATURATED AND SATURATED SOIL PROPERTIES Todd White, M.Sc., P.Geol. and Douglas A. Sweeney, M.Sc., P.Eng. SEACOR Environmental Inc. INTRODUCTION
SAN MATEO PLAIN GROUNDWATER BASIN ASSESSMENT STAKEHOLDER WORKSHOP#2 SEPTEMBER 7, 2016
 SAN MATEO PLAIN GROUNDWATER BASIN ASSESSMENT STAKEHOLDER WORKSHOP#2 SEPTEMBER 7, 2016 PRESENTATION OVERVIEW Introductions Project Overview Summary of Stakeholder Meeting #1 Feedback Snapshot of Results
Groundwater Forensics to Evaluate Molybdenum Concentrations Near a CCR Landfill
 15 World of Coal Ash (WOCA) Conference in Nasvhille, TN - May 5-7, 15 http://www.flyash.info/ Groundwater Forensics to Evaluate Molybdenum Concentrations Near a CCR Landfill Bruce R. Hensel 1, Thomas J.
GEOCHEMICAL IDENTIFICATION OF SALTWATER SOURCES IN SALINE RIVER AND SMOKY HILL RIVER WATERS, RUSSELL COUNTY. and
 GEOCHEMICAL IDENTIFICATION OF SALTWATER SOURCES IN SALINE RIVER AND SMOKY HILL RIVER WATERS, RUSSELL COUNTY and ADDENDUM GEOCHEMICAL IDENTIFICATION OF SALINITY SOURCES IN THE SMOKY HILL RIVER IN ELLIS
Groundwater and surface water: a single resource. Santa Cruz River, Tucson
 Groundwater and surface water: a single resource Santa Cruz River, Tucson 1942 1989 1 Groundwater basics Groundwater is water found within the pore spaces of geologic material beneath the surface of the
2018 GROUNDWATER MONITORING & CORRECTIVE ACTION REPORT COAL ASH PONDS ELMER SMITH STATION DAVIESS COUNTY OWENSBORO, KENTUCKY
 2018 GROUNDWATER MONITORING & CORRECTIVE ACTION REPORT COAL ASH PONDS ELMER SMITH STATION DAVIESS COUNTY OWENSBORO, KENTUCKY Prepared For: OWENSBORO MUNICIPAL UTILITIES OWENSBORO, KENTUCKY Prepared By:
4.5 GEOTECHNICAL, SUBSURFACE, AND SEISMIC HAZARDS
 4.5 GEOTECHNICAL, SUBSURFACE, AND SEISMIC HAZARDS This section discusses the geology, soils, seismicity, hazardous materials, and subsurface obstructions along Flower Street, and evaluates their potential
Removal of Perchloroethylene within a Silt Confining Layer Using Hydrogen Release Compound
 Proceedings of the Annual International Conference on Soils, Sediments, Water and Energy Volume 15 Article 20 June 2010 Removal of Perchloroethylene within a Silt Confining Layer Using Hydrogen Release
MEMORANDUM. FROM: Jordan Kear, P.G., C.Hg. KG
 MEMORANDUM TO: Mr. Robert Elliott Little Baldy Water Company PO Box 313 Llano, California 93544 FROM: Jordan Kear, P.G., C.Hg. KG12-0100 DATE: July 20, 2012 SUBJECT: Reconnaissance Level Hydrogeologic
Science Olympiad. Mentor Invitational Hydrogeology ANSWER KEY. Name(s): School Name: Point Totals
: School Name: Point Totals") Science Olympiad Mentor Invitational Hydrogeology ANSWER KEY Team Number: Raw Score: Rank: Name(s): School Name: Point Totals Possible Part 1: Groundwater Concepts and Vocabulary 30 Part 2: The Hydrogeology
Science Olympiad Mentor Invitational Hydrogeology ANSWER KEY Team Number: Raw Score: Rank: Name(s): School Name: Point Totals Possible Part 1: Groundwater Concepts and Vocabulary 30 Part 2: The Hydrogeology
The soil is a very. The soil can. The manure. Soil Characteristics. effective manure treatment system if manures are applied at the proper rate.
 The soil is a very effective manure treatment system if manures are applied at the proper rate. The soil can filter pollutants and prevent them from reaching groundwater. The manure application rate should
Informational Meeting: Onsite and Offsite Response Action Plans
 Informational Meeting: Onsite and Offsite Response Action Plans Kop-Flex Voluntary Cleanup Program Site #31 June 24, 2015 BACKGROUND ONSITE AREA SUMMARY OF SITE HISTORY Koppers Company purchased the property,
GROUND WATER. Practice Note # water. sensitive. urban. design \ \ \ \ \ \ \ \ \ \ \ \ \ \ \ \ \ \ \ \ \ \ \ \ \ \ \ \
 2013 water. sensitive. urban. design \ \ \ \ \ \ \ \ \ \ \ \ \ \ \ \ \ \ \ \ \ \ \ \ \ \ \ \ Practice Note #8 GROUND Water Smart design is the effective planning, design and building of homes, subdivisions,
GROUNDWATER & SGMA 101
 GROUNDWATER & SGMA 101 Santa Cruz Mid-County GSA Public Orientation Workshop #1 Presenter: Derrik Williams, HydroMetrics Water Resources Inc. Thursday, October 5, 2017 Session Objectives 1. Understanding
PHASE II ENVIRONMENTAL SITE ASSESSMENT BURKHART ESTATE MATAGORDA COUNTY, TEXAS
 FINAL REPORT PHASE II ENVIRONMENTAL SITE ASSESSMENT BURKHART ESTATE MATAGORDA COUNTY, TEXAS PREPARED FOR: TEXAS A&M UNIVERSITY PREPARED BY: AUSTIN, TEXAS MAY 26, 2011 1.0 EXECUTIVE SUMMARY A Phase II Environmental
Appendix B: Tyrsting Valley
 Appendix B: Tyrsting Valley Appendix B: Tyrsting Valley A plan for protecting the groundwater at a proposed well field located in Tyrsting buried valley, Denmark This Groundwater Protection Plan (GPP)
ENVIRONET Conceptual Site Model
 ENVIRONET Conceptual Site Model Peter Booth Senior Technical Director 17/04/2012 Definition The conceptual site model (CSM) can be seen as; A representation which sets out the critical pollutant linkages
CONTAMINATED LAND FUNDAMENTALS
 CONTAMINATED LAND FUNDAMENTALS Hydrogeology Martin Robertson Z Energy Ltd HYDROGEOLOGY AND THE CSM. WATER CYCLE Groundwater is often a subdued replica of topography. Flow patterns are controlled by the
COKE OVEN AREA SPECIAL STUDY AREA INTERIM MEASURES WORK PLAN PHASE 1
 COKE OVEN AREA SPECIAL STUDY AREA INTERIM MEASURES WORK PLAN PHASE 1 SEVERSTAL SPARROWS POINT, LLC SPARROWS POINT, MARYLAND Prepared for: Severstal Sparrows Point, LLC Sparrows Point, Maryland In accordance
The Hydrogeology Challenge: Water for the World TEACHER S GUIDE
 The Hydrogeology Challenge: Water for the World TEACHER S GUIDE Why is learning about groundwater important? 95% of the water used in the United States comes from groundwater. About half of the people
William Wilmot Matrix Solutions Inc. 118, Avenue S.W., Calgary, Alberta, Canada
 Hydrogeologic Assessment in Support of the Development of the Peace River Oil Sands Deposit: A Case Study Concerning a Pilot-Scale in-situ SAGD Operation William Wilmot Matrix Solutions Inc. 118, 319-2
Section 8 Stevinson Water District Study Area
 Stevinson Water District Study Area Figure 8-1. Location of Stevinson Water District & the Merquin County Water District (SWD 2005). 8.1 Introduction and Overview The Stevinson Water District (SWD) is
In-Situ Remediation of Chlorinated Solvent Source Zone using ZVI-Clay Treatment Technology
 In-Situ Remediation of Chlorinated Solvent Source Zone using ZVI-Clay Treatment Technology Detailed site assessment work at a manufacturing facility in South Carolina indicated that a former French drain
Technical Memorandum Brackish Water Desalination for Public Water Supply in Las Cruces, New Mexico
 Technical Memorandum Brackish Water Desalination for Public Water Supply in Las Cruces, New Mexico 1. Introduction Desalination is a process that is receiving increased attention in the southwestern United
Oil and Gas Monitoring. November 2, 2016 GRA Meeting John Borkovich, P.G. Groundwater Monitoring Section Chief
 Oil and Gas Monitoring November 2, 2016 GRA Meeting John Borkovich, P.G. Groundwater Monitoring Section Chief Presentation Overview Background Well Stimulation Groundwater Monitoring (Model Criteria) Produced
3F. Hydrology and Water Quality
 This section provides an analysis of potential hydrological and water quality impacts associated with implementation of the proposed project. The section also evaluates and describes the potential impacts
Feasibility Study of Subsurface Seawater Intakes West Basin Municipal Water District s Proposed El Segundo Desalination Facility
 Feasibility Study of Subsurface Seawater Intakes West Basin Municipal Water District s Proposed El Segundo Desalination Facility November 16, 2015 Bureau of Reclamation Project No. R14AP00173 1 Outline
Plume Cut-Off Treatment Example
 Page 1 of 5 H R C T E C H N I C A L B U L L E T I N # 2. 5. 2 Plume Cut-Off Treatment Example A biologically active barrier treatment zone can be constructed by applying HRC in rows of injection points.
Groundwater 3/16/2010. GG22A: GEOSPHERE & HYDROSPHERE Hydrology
 GG22A: GEOSPHERE & HYDROSPHERE Hydrology Definitions Groundwater Subsurface water in soil or rock that is fully saturated. Aquifer Contains enough saturated material to yield significant quantities of
Environmental Data Management and Modeling, Niagara Falls Storage Site Lewiston, New York
 Environmental Data Management and Modeling, Niagara Falls Storage Site Lewiston, New York Eric Evans and Don DeMarco HydroGeoLogic, Inc. May 7, 2008 Mr. Eric Evans, M.Sc., P.G. is a Senior Hydrogeologist
Operational Range Assessment Program (ORAP) Phase II Overview. Andrea Graham USACE, Baltimore District
 Phase II Overview. Andrea Graham USACE, Baltimore District") Operational Range Assessment Program (ORAP) Phase II Overview Andrea Graham USACE, Baltimore District andrea.a.graham@usace.army.mil Operational Range Assessment Program Background Mission Establish information
Operational Range Assessment Program (ORAP) Phase II Overview Andrea Graham USACE, Baltimore District andrea.a.graham@usace.army.mil Operational Range Assessment Program Background Mission Establish information
What is Hydrogeology?
 What is Hydrogeology? It is the comprehensive study of groundwater, its distribution and evolution through time and space, under regional geology. Geohydrology studies water behavior in geological environment,
Saturated Buffer. Subsurface Drainage PURPOSE N REDUCTION LOCATION COST BARRIERS
 Saturated Buffer To intercept tile drainage prior to discharging to surface waters and redistribute the water laterally in the soil profile of the streamside buffer. Subsurface drainage, also known as
5. Basin Evaluation Salt and Nitrate Balance
 SNMP Attachment B, Section B.2.1.3 (originally Section 5 in CV-SALTS Phase 2 Conceptual Model Task 5 deliverables) 5. As part of the evaluation of water quality the SNMP requires loading estimates and
Development of Soil Cleanup Standards for Explosive Residues on Military Ranges
 Development of Soil Cleanup Standards for Explosive Residues on Military Ranges Jay Clausen AMEC Earth & Environmental Joe Robb AMEC Earth & Environmental Mahalingham Ravichandran AMEC Earth & Environmental
Design Guideline for Gravity Systems in Soil Type 1. January 2009
 Design Guideline for Gravity Systems in Soil Type 1 January 2009 This page is intentionally blank. Design Guideline for Gravity Systems in Soil Type 1 January 2009 For information or additional copies
STRATEGIES FOR CHARACTERIZING SUBSURFACE RELEASES OF GASOLINE CONTAINING MTBE
 AUGUST 2000 NO. 11 STRATEGIES FOR CHARACTERIZING SUBSURFACE RELEASES OF GASOLINE CONTAINING MTBE ERIC M. NICHOLS, LFR LEVINE!FRICKE; MURRAY D. EINARSON, CONOR PACIFIC/EFW; STEVEN C. BEADLE, LFR LEVINE!FRICKE