Wastewater Treatment Facility Plan City of Silver Bay, Minnesota
|
|
|
- Priscilla Goodman
- 6 years ago
- Views:
Transcription

1 March 2017 Wastewater Treatment Facility Plan City of Silver Bay, Minnesota Project Number M Prepared by: Bolton & Menk, Inc Sunwood Dr. NW Ramsey, MN P: F:
2
3 Certification Wastewater Treatment Facility Plan for City of Silver Bay, Minnesota M March 2017 I hereby certify that this plan, specification or report was prepared by me or under my direct supervision, and that I am a duly Licensed Professional Engineer under the laws of the State of Minnesota. By: John Graupman P.E. License No Date: March 3, 2017 Prepared by: Bolton & Menk, Inc. Silver Bay, MN Wastewater Treatment Facility Plan ǀ M Certification
4
5 Table of Contents 1. INTRODUCTION... 1 PURPOSE... 1 BACKGROUND DESIGN CONDITIONS... 4 PLANNING PERIOD... 4 DEVELOPMENT PROJECTIONS... 6 WASTEWATER FLOWS... 8 WASTEWATER LOADINGS BIOSOLIDS EXISTING EFFLUENT LIMITS CONSIDERATIONS FOR FUTURE EFFLUENT LIMITS EVALUATION OF EXISTING FACILITIES OVERVIEW COLLECTION SYSTEM TREATMENT FACILITY TREATMENT PERFORMANCE ENVIRONMENTAL SOURCES OF MERCURY - RAINFALL FULL-SCALE PILOT STUDY & MERCURY COLLECTION AND MONITORING WASTEWATER TREATMENT FACILITY IMPROVEMENT ALTERNATIVES GENERAL WASTEWATER TREATMENT FACILITY IMPROVEMENTS ADVANTAGES AND DISADVANTAGES MERCURY REMOVAL IMPROVEMENTS AND ALTERNATIVES GEMERAL TREATMENT ALTERNATIVES VARIANCE FOR MERCURY COMPLIANCE OPINION OF PROBABLE COSTS AND FUNDING GENERAL CAPITAL COSTS OPERATIONS AN MAINTENANCE PRESENT WORTH ANALYSIS PROJECT FUNDING RECOMMENDATIONS AND IMPLEMENTATION RECOMMENDED IMPROVEMENTS IMPLEMENTATION SCHEDULE SUMMARY AND RECOMMENDATIONS ON OTHER WASTEWATER ISSUES Figures Figure 2.2 Population Projections... 8 Figure 2.3 Silver Bay Historical Flows Figure 3.1: Silver bay WWTF Process Schematic Figure 3.2 Silver Bay WWTF Aerial Overview Figure 3.3: Grit Removal Chamber Figure 3.4: Primary Clarifier No Figure 3.4: Primary Clarifier No Prepared by: Bolton & Menk, Inc. Silver Bay, MN Wastewater Treatment Facility Plan ǀ M Table of Contents Page i
6 Tables Figure 3.6: Trickling Filter Figure 3.7: Secondary Clarifier Figure 3.8: Solids Contact Clarifier No Figure 3.9: Solids Contact Clarifier No Figure 3.10: First Stage Anaerobic Digester Figure 3.11: Second Stage Anaerobic Digester Figure 3.12 CBOD 5 Effluent Discharge Concentration (top) and Loading (bottom) Figure 3.13 TSS Effluent Discharge Concentration (top) and Loading (bottom) Figure 3.14 Total Phosphorus Discharge Concentration (top) and Loading (bottom) Figure 3.15 Influent Mercury Compared to Daily Precipitation Figure 3.16 Total Effluent Calendar Monthly Average Mercury Compared to Interim and Final Limits Figure 3.17 Total Effluent Daily Maximum Mercury Compared to Interim and Final Limits Figure 3.18 Effluent Mercury Relationship to WWTF Flow Rate Figure 3.19 Effluent Mercury and TSS Comparison Figure 3.20 Mercury Levels Throughout the Treatment Process Table 2.1 Population Projections... 7 Table 2.2 Historical Flow Data Summary Table 2.3 Historical Flow Data Silver Bay WWTF Table 2.4 Summary of Allocated Design Flows Table 2.6 Historical Pollutant Loading Summary Table 2.7 Historical Average and Peak Day Summary Table 2.8 Residential & Commercial Design Loadings Table 2.9 Summary of Existing and Calculated 20-Year Loadings Table 2.10 NPDES Discharge Limits Silver Bay, MN Table 3.1 Historical Mercury Data ( ) Table 4.1 Proposed Non-Mercury Related Alternatives for Wastewater Treatment Facility Improvements Table 6.1 Capital Cost Opinion Table 6.2 Operations, Maintenance, and Replacement Costs Table 6.3 Present Worth Analysis Table 7.1 Project Implementation Schedule - City of Silver Bay Prepared by: Bolton & Menk, Inc. Silver Bay, MN Wastewater Treatment Facility Plan ǀ M Table of Contents Page ii
7 Appendices Appendix A: Silver Bay Wastewater Treatment Facility NPDES/SDS Discharge Permit Appendix B: Public Hearing Presentation Material, Notice and Publication, and Comments* Appendix C: Signed Resolution Adopting Facility Plan* Appendix D: SERP Mailing List Appendix E: Preliminary Effluent Limit Request Appendix F: SHPO Letter Appendix G: Silver Bay Environmental Information Worksheet (EIW) Appendix H: Silver Bay Preliminary Phase I Report Appendix I: PPL Application and Worksheet Prepared by: Bolton & Menk, Inc. Silver Bay, MN Wastewater Treatment Facility Plan ǀ M Table of Contents Page iii
8
9 1. INTRODUCTION PURPOSE This report provides the City of Silver Bay, Minnesota with recommendations for wastewater treatment facility improvements and upcoming needs, specifically for preliminary treatment and mercury removal. A report was submitted on January 31, 2017 by Bolton & Menk, Inc. that details the results of full-scale pilot testing using solids contact clarifiers with chemcial addition for mercury removal. The findings of the pilot study were inconclusive and more data is required before it can be determined if the clarifiers are effective at removing mercury to below permitted final effluent limits. Recommendations for improvements are based on input from the City staff and an evaluation of facility requirements in accordance with the current recommended practices and regulatory agency requirements. Section 2 provides a review of the current and future design conditions; Section 3 provides an evaluation of the existing wastewater system components; Section 4 discusses various alternatives for wastewater system improvements that are non-mercury related; Section 5 provides alternatives for mercury removal treatment technologies; Section 6 details cost analysis of the various alternatives; and Section 7 provides recommendations and general conclusions concerning the proposed wastewater system improvements. BACKGROUND The current Silver Bay Wastewater Treatment Facility (WWTF) has continuous discharge to Lake Superior. The WWTF was originally constructed to treat an average flow of 0.83 million gallons per day (MGD) with a five-day carbonaceous biochemical oxygen demand (CBOD 5) strength of 184 mg/l. The facility was later expanded in 1995 to treat an average wet weather (AWW) flow of MGD with a CBOD 5 strength of 70 mg/l. Pre-treatment processes include a manual bar screen, a high flow diversion structure which diverts water to the primary clarifier, a manual bar screen, grit removal chamber, and a submersible comminuter. Primary treatment includes two 40-foot primary clarifiers, one 60- foot diameter trickling filter with rock media, and a single 40-ft secondary clarifier. Tertiary treatment was originally constructed to aid in phosphorus removal, using chemical addition, and includes two tertiary solids contact clarifiers. A chlorination/dechlorination unit provides disinfection. Biosolids are processed in two heated anaerobic digesters and are land applied. The treated wastewater flows through a manhole and finally to the outfall where it is discharged into Lake Superior. The WWTF has a current NPDES permit (No. MN ) that was issued on September 4, 2015 and will expire August 31, See Appendix A for a copy of the permit. Within the permit are requirements for mercury monitoring and effluent limits. In accordance with the Great Lakes Initiative, the permit includes both interim and final effluent limits on total mercury. The interim limits are 3.8 nanograms per liter (ng/l) calendar month average and 7.0 ng/l daily maximum. The final limits are 1.9 ng/l calendar month average and 3.5 ng/l daily maximum. The City must comply with all the final limits no later than March 31, Permitted limits on other pollutants are discussed later in this report. Prepared by: Bolton & Menk, Inc. INTRODUCTION Silver Bay, MN Wastewater Treatment Facility Plan ǀ M Page 1
10 The Silver Bay WWTF has been evaluating the effectiveness of using solids contact clarifiers, with chemical addition, for low-level mercury removal. A full-scale pilot study officially started in December of 2016 after both tertiary contact clarifiers were rehabilitated. The full-scale pilot study objective was to use the existing tertiary solids contact clarifiers with chemical addition of alum and polymer to evaluate the effectiveness the system has for mercury removal to below permitted final mercury limits. A reported by Bolton & Menk, Inc., titled Phase I Report Silver Bay Mercury Removal Pilot Studies details the pilot study results and recommendations. This report and all recommendations are attached in Appendix H. With the short duration of the pilot study and limited data on mercury, temperature, and total suspended solids (TSS), it cannot be concluded at this time that the solids contact clarifiers are able to remove mercury to below permitted final limits. Alternative treatment technologies and improvements to the existing clarifiers for mercury removal should be explored so the facility can meet final mercury limits. Prepared by: Bolton & Menk, Inc. INTRODUCTION Silver Bay, MN Wastewater Treatment Facility Plan ǀ M Page 2
11 This page intentionally left blank Prepared by: Bolton & Menk, Inc. INTRODUCTION Silver Bay, MN Wastewater Treatment Facility Plan ǀ M Page 3
12 2. DESIGN CONDITIONS PLANNING PERIOD Wastewater treatment facilities are typically designed based on a 20-year planning period, as it is generally not feasible to make frequent changes in the capacity of a wastewater treatment facility. In addition, a 20-year planning period is required for the project to be eligible for funding assistance with the MN Public Facilities Authority (PFA). A design year of 2037 is used for this evaluation. Projected wastewater flows and loadings are determined using a combination of population trends and expected commercial and industrial growth. Figure 2.1 shows the planning area encompassed by this report and the improvements discussed herein. Prepared by: Bolton & Menk, Inc. DESIGN CONDITIONS Silver Bay, MN Wastewater Treatment Facility Plan ǀ M Page 4

13 Figure 2.1 Planning Area Prepared by: Bolton & Menk, Inc. DESIGN CONDITIONS Silver Bay, MN Wastewater Treatment Facility Plan ǀ M Page 5
14 DEVELOPMENT PROJECTIONS 1. Population Projections There are a number of methods available for predicting population trends for cities such as Silver Bay. Historical city and county population trends are reviewed. Future trends can be predicted using a variety of mathematical projections including arithmetic, geometric, and linear regression methods. Additionally, the Minnesota State Demographic Center (SDC) publishes population projections for all counties in Minnesota. The most recent estimates and projections by the SDC were released in July 2016 and March 2014, respectively. Table 2.1 and Figure 2.2 show historical and projected populations for the City of Silver Bay and Lake County as reported by the Minnesota State Demographer. Historically, the population of Lake County has been slightly decreasing from a peak population of 11,229 in 2004 to a current population of 10,634 in It is assumed that this is the current population in Projections provided by the MN State Demographer indicate that the population of Lake County will slightly increase until 2020 before decreasing through the design year of Historically, the City of Silver Bay has accounted for an average of 18% of the county population. The population has decreased from a population of 2,068 in 2000 to a current population of 1,849 in Again, it is assumed that the 2015 population is the current population. Population projections predict a continually declining population. With a continually decreasing population, it is assumed that the design population will be the current population. Based on these assumptions, the 2037 design population for the City of Silver Bay will be 1,849 people. Prepared by: Bolton & Menk, Inc. DESIGN CONDITIONS Silver Bay, MN Wastewater Treatment Facility Plan ǀ M Page 6
15 Table 2.1 Population Projections Year City of Silver Bay (3) Lake County (3) ,068 11, ,065 11, ,050 11, ,052 11, ,049 11, ,039 11, ,013 11, ,993 11, ,980 10, ,962 10, ,887 10, ,869 10, ,868 10, ,866 10, ,860 10, ,849 10, ,849 (1) 11,322 (2) ,849 (1) 11,335 (2) ,849 (1) 11,184 (2) ,849 (1) 11,013 (2) 2037 Design Year 1,849 (1) 10,908 (2) (1) Based on both historical population trends (2) Projected by MN State Demographic Center (March 2014) (3) Historic population by MN State Demographic Center (July 2016) Prepared by: Bolton & Menk, Inc. DESIGN CONDITIONS Silver Bay, MN Wastewater Treatment Facility Plan ǀ M Page 7
16 12,000 11,000 10,000 9,000 8,000 Historic Silver Bay Population Historic Lake County Population Projected Silver Bay Population Projected Lake County Population Population 7,000 6,000 5,000 4,000 3,000 2,000 1, Industrial Development Figure 2.2 Population Projections There is currently no Significant Industrial Users (SIU) within the City of Silver Bay. Future planning for the wastewater treatment facility will not include anticipated loads and flows from any SIUs. The small industries within the City are accounted for in the residential and commercial flows and loadings. WASTEWATER FLOWS 1. Historical Monitoring Data a) Influent Monitoring The Silver Bay Wastewater Treatment Facility records influent flows on a continuous basis. The flows to the treatment facility are measured using a Parshall Flume with an ultrasonic level transducer after the raw wastewater has been screened. Community wastewater flows include contributions from domestic users. Domestic users include residential, commercial, and small industrial users, as these flows are typically of domestic strength. Table 2.2 provides a summary of the domestic flow data from January 2012 through December A historical summary of the average and maximum day influent flows to the Silver Bay WWTF are presented in Table 2.3 and Figure 2.3. The average daily flow over this period is MGD. The average daily flow shows a slightly increasing trend over the five-year monitoring period. Future wastewater flows are projected to increase and follow the same trend as the historical data. The Prepared by: Bolton & Menk, Inc. DESIGN CONDITIONS Silver Bay, MN Wastewater Treatment Facility Plan ǀ M Page 8
17 max day flows tend to peak in early spring, specifically around April and May each year. The historic maximum daily flow occurred in April of 2014 at 2.7 MGD. The peak flows that occur in the early spring can be correlated to snowmelt and spring rain events. The historic peaking factor (peak day to average day ratio) is Prepared by: Bolton & Menk, Inc. DESIGN CONDITIONS Silver Bay, MN Wastewater Treatment Facility Plan ǀ M Page 9
18 Table 2.2 Historical Flow Data Summary Date Flow (MGD) GPCD Minimum Month Average Flow February Average Daily Flow January December Max. Month Average Flow April Max. Day Flow April ,452 Month/Year Monthly Average (MGD) Table 2.3 Historical Flow Data Silver Bay WWTF Year Max Day (MGD) Monthly Average (MGD) Max Day (MGD) Monthly Average (MGD) Max Day (MGD) Monthly Average (MGD) Max Day (MGD) Monthly Average (MGD) Max Day (MGD) 5-year Average (MGD) January February March April May June July August September October November December year Max Day (MGD) Yearly Average/Max Prepared by: Bolton & Menk, Inc. DESIGN CONDITIONS Silver Bay, MN Wastewater Treatment Facility Plan ǀ M Page 10
19 3.5 Average Flow AWW Design Flow (0.919 MGD) Maximum Daily Flow PHWW Design Flow (3.191 MGD) Flow (MGD) Figure 2.3 Silver Bay Historical Flows Prepared by: Bolton & Menk, Inc. DESIGN CONDITIONS Silver Bay, MN Wastewater Treatment Facility Plan ǀ M Page 11
20 b) Infiltration and Inflow Analysis 2. Design Flows The Minnesota Pollution Control Agency (MPCA) has developed guidelines to provide a comprehensive and systematic approach to analyze I&I. These guidelines were used to determine if I&I is considered excessive in the City of Silver Bay s wastewater collection system. The following are definitions of inflow and infiltration as provided by the MPCA guidelines: Infiltration is water other than wastewater that enters a sewer system (including service sewer connections and foundation drains) from the ground through broken or defective pipes, pipe joints, connections, manholes, and wet basements. Inflow is water other than wastewater that enters a sewer system (including sewer service connections) through sources such as, but not limited to, roof leaders, foundation drains, yard drains, area drains, drains from springs and swampy areas, manhole covers, cross connections between storm sewers and sanitary sewers, catch basins, storm waters, surface runoff, street wash water, or other drainage structures. Excessive Infiltration Infiltration is excessive if the quantity of flow (domestic base flow and infiltration) is greater than 120 gallons per capita per day (gpcd). The quantity of flow was determined using the annual average residential/commercial flow over the past five (5) years, and the 2015 population of 1, ,000 gpd / 1,849 people = 242 gpcd Excessive Inflow Inflow is excessive if the quantity of flow during storm events that results in chronic operational problems related to the hydraulic overloading of the treatment system or that results in a total flow of more than 275 gpcd (domestic base flow plus infiltration and inflow). The flow during storm events was determined using the maximum residential/commercial flow over the past five (5) years, and the 2015 population of 1,849. 2,700,000 gpd / 1,849 people = 1,452 gpcd According to MPCA criteria, infiltration and inflow are considered excessive in Silver Bay s wastewater collection system. This issue is largely attributed to the City s aging and deteriorating collection system infrastructure. For the purposes of developing design flow projections, infiltration and inflow will be allocated at present day values. The MPCA has guidelines for determining design wastewater flows for new or expanded treatment facilities. Flow projections are developed for different climatic conditions as described below: Prepared by: Bolton & Menk, Inc. DESIGN CONDITIONS Silver Bay, MN Wastewater Treatment Facility Plan ǀ M Page 12
21 Average Dry Weather (ADW) Flow Measure of flow during which there is no inflow due to precipitation and/or snowmelt and no infiltration due to high groundwater. This flow typically occurs during winter months or very dry summers. It is also strongly correlated with drinking water usage. Average Wet Weather (AWW) Flow Daily average flow for the wettest 30 consecutive days for mechanical treatment facilities. AWW flow is based on flow with infiltration due to high groundwater and typical inflow due to precipitation and/or snowmelt. This flow typically occurs during the spring and early summer. Peak Hourly Wet Weather (PHWW) Flow Peak flow during the peak hour of the day at a time when the groundwater is high and a five-year, one-hour storm event is occurring. Peak Instantaneous Wet Weather (PIWW) Flow Peak instantaneous flow during the day at a time when the groundwater is high and a 25- year, one-hour storm event is occurring. This flow is used for sizing pumps and piping systems. The flow parameters described above are determined by following the procedures outlined in the MPCA document Design Flow and Loading Determination Guidelines for Wastewater Treatment Plants. Additional flow from population increase will be estimated based on a Ten States Standard flow of 100 gal/cap/day (gpcd). a) Residential/Commercial/Institutional Flows Commercial flows include wastewater from businesses, small industries, restaurants, and city offices. These flows are typically similar to residential flows and will be considered in future flow allocations. Institutional flows include wastewater from the elementary school and the high school. Residential flows include household wastewater flows. These flows contribute to a significant portion of flow for the City of Silver Bay. Linear regression of historical residential/commercial flows suggests that wastewater inflows will slightly increase as the City s collection system continues to age and the population remains constant. b) Industrial Flows There are no Significant Industrial Users (SIU s) in the City of Silver Bay. Northshore Mining Company regulates flows and only discharges from bathrooms and shower facilities. c) Design Flows Design flows have been projected utilizing the following criteria and historical flow values: Prepared by: Bolton & Menk, Inc. DESIGN CONDITIONS Silver Bay, MN Wastewater Treatment Facility Plan ǀ M Page 13
22 Population will remain constant at 1,849 people through 2037 Infiltration and inflow will be similar to historical flow values Industrial flow is accounted for in the residential and commercial flows AWW flow will remain the same as existing design AWW flow Table 2.4 presents a summary of the allocated design flows. It is important to note, there is no projected change in the Average Wet Weather Flow for the 2037 design year. Table 2.4 Summary of Allocated Design Flows Parameter Existing Facility Design New Design Flow Average Dry Weather Flow (mgd) Average Wet Weather Flow (mgd) Peak Hourly Wet Weather Flow (mgd) Peak Instantaneous Wet Weather Flow (mgd) The MPCA Determination of Design Flows worksheet has been completed and is shown in Table 2.5. Table 2.5 Determination of Design Flow Summary - City of Silver Bay A) For Determination of Peak Hourly Wet Weather Design Flow (PHWW) MGD 1 Present peak hourly dry weather flow Present peak hourly flow during high ground water period (no runoff) Present peak hourly dry weather flow [same as (1)] Present peak hourly infiltration = Present hourly flow during high ground water period and runoff at point of greatest distance between Curves Y and Z Present hourly flow during high ground water (no runoff) at same time of day as (5) measurement Present peak hourly inflow = Present peak hourly inflow adjusted for a 5-year 1-hour rainfall event Present peak hourly infiltration [same as (4)] Peak hourly infiltration cost effective to eliminate - 0 Peak hourly infiltration after rehabilitation (where rehabilitation is cost = effective) 12 Present Peak hourly adjusted inflow [same as (8)] Peak hourly inflow cost effective to eliminate - 0 Peak hourly inflow after rehabilitation (where rehabilitation is cost = effective) Prepared by: Bolton & Menk, Inc. DESIGN CONDITIONS Silver Bay, MN Wastewater Treatment Facility Plan ǀ M Page 14
23 15 Population increase _100_ gpcd times 3 (peaking factor) Peak hourly flow from planned industrial increase 0 17 Estimated peak hourly flow from future unidentified industries 0 18 Peak hourly flow from other future increases 0 Peak hourly wet weather design flow [(1)+(11)+(14)+(15)+(16)+(17)+(18)] B) For Determination of Peak Instantaneous Wet Weather Design Flow (PIWW) MGD 20 Peak hourly wet weather design flow [same as (19)] Present peak hourly inflow adjusted for a 5-year 1-hour rainfall event [same as (8)] 22 Present peak inflow adjusted for a 25-year 1-hour rainfall event Peak instantaneous wet weather design flow = C) For Determination of Average Dry Weather Design Flow (ADW) MGD 24 Present average dry weather flow Population increase _100_ gpcd Average flow from planned industrial increase Estimated average flow from other future unidentified industries Average flow from other future increases Average dry weather design flow [(24)+(25)+(26)+(27)+(28)] = D) For Determination of Average Wet Weather Design Flow (30-day Average) MGD 30 Present average dry weather flow Average infiltration after rehabilitation (where rehabilitation is cost 31 effective) Average inflow after rehabilitation (where rehabilitation is cost 32 effective) Population increase _100_ gpcd Average flow from planned industrial increase Estimated average flow from future unidentified industries Average flow from other future industries Average wet weather design flow [(30)+(31)+(32)+(33)+(34)+(35)+(36)] = WASTEWATER LOADINGS 1. Historical Monitoring Data a) Influent Monitoring The City of Silver Bay monitors influent pollutant loadings per the requirements of their NPDES Discharge Permit. The City monitors the 5-day Carbonaceous Biochemical Oxygen Demand (CBOD 5), Total Suspended Solids (TSS), and Prepared by: Bolton & Menk, Inc. DESIGN CONDITIONS Silver Bay, MN Wastewater Treatment Facility Plan ǀ M Page 15
24 Total Phosphorus (P). The City does not measure Total Kjeldahl Nitrogen (TKN). The historical loadings are shown in Table 2.6, which indicates the total loadings entering the wastewater treatment facility. The average CBOD 5 concentration has decreased from 358 lbs./day in 2012 to 249 lbs./day in This corresponds to a decrease in CBOD 5 load of 30% over the five-year period. An increase in the CBOD 5 load was observed in Historical per capita loading has averaged pounds per capita per day (lbs./cap/day). The average day CBOD 5 load is 327 lbs./day with a peak day load of 2,920 lbs./day. Total suspended solids (TSS) loadings fluctuate over the five-year historical monitoring period saw an average TSS load of 491 lbs./day, while 2015 saw an average TSS load of 612 lbs./day. The five-year average TSS loading was 537 lbs./day with a peak day load of 4,626 lbs./day. Per capita loadings have averaged lbs./capita/day over the last five-years. Total Phosphorus (TP) loading has remained consistent from 2012 through The lowest average load occurred in 2012 at 8.8 lbs./day and the average peaked in 2013 at 11.5 lbs./day. The five-year average total phosphorus load is 10.2 lbs./day. Per-capita loadings have followed the same trend as the TP load and average lbs./cap/day. Table 2.7 provides a summary of the average day and peak day loading data described above, from 2012 through Table 2.6 Historical Pollutant Loading Summary Parameter Unit (1) 5 Year Average Flow MGD CBOD 5 mg/l lbs./day lbs./capita/day (2) TSS mg/l lbs./day lbs./capita/day (2) Total Phosphorus mg/l lbs./day lbs./capita/day (2) (1) 2016 data is through September of Data after September was not available. (2) lbs./capita/day loadings calculated based on respective year s population. Prepared by: Bolton & Menk, Inc. DESIGN CONDITIONS Silver Bay, MN Wastewater Treatment Facility Plan ǀ M Page 16
25 Table 2.7 Historical Average and Peak Day Summary Residential/ Loadings Commercial Loading CBOD Average Day (lbs./day) 327 CBOD Peak Day (lbs./day) 2,920 TSS Average Day (lbs./day) 537 TSS Peak Day (lbs./day) 4,626 P Average Day (lbs./day) 10.2 b) Industrial Monitoring 2. Design Loadings The City of Silver Bay does not have any significant industrial users. Flows from the small industries are accounted for in the residential and commercial loadings. The City of Silver Bay s existing wastewater treatment facility receives pollutantloading contributions from residential, commercial, and small institutional users. Design loadings will be projected for one category of users: Domestic users, including residential, commercial, institutional, and small industrial users a) Residential and Commercial Loadings Design loadings from residential/commercial users are developed utilizing historical loading data and adding pollutant mass loadings for projected population increases. Since there is no projected population increase, the future design loadings are calculated by multiplying the design population by the per capita design loading parameters. Design loadings for the projected population are developed utilizing mass per capita (lbs./person/day) values for CBOD 5, TSS, TKN, and TP. Common per capita design loading rates for residential/commercial sources, as per the Recommended Standards for Wastewater Facilities 2014 Edition (Commonly known as Ten States Standards), are lbs. CBOD 5/capita/day, lbs. TSS/capita/day, and lbs. TKN- N/capita/day. According to Metcalf & Eddy (2003), typical per capita Total Phosphorus loading is lbs./capita/day. Based on historical data provided in Table 2.6, the City of Silver Bay per capita loadings for CBOD 5 are within the typical range so Ten States Standard design criteria apply. The historical TSS per capita loadings for all years, except 2016, exceed the Ten States Standards design range. Therefore, the average historical per capita loading from 2012 to 2015 of lbs./cap/day will be the design parameter used to calculate future TSS loadings. The Ten States design standard Prepared by: Bolton & Menk, Inc. DESIGN CONDITIONS Silver Bay, MN Wastewater Treatment Facility Plan ǀ M Page 17
26 of lbs./day of TKN will be used for future loadings. All future per capita contributions for the projected population will be based on values included in Table 2.8. Table 2.8 Residential & Commercial Design Loadings Per Capita Design Projected Design Parameter Loading (1) Loading Population 1,849 CBOD lbs./capita-day 370 lbs./day TSS lbs./capita-day (2) 547 lbs./day TKN lbs./capita-day 85 lbs./day TP lbs./capita-day (3) 15 lbs./day (1) Design loadings from Ten State Standards unless otherwise noted (2) Historic TSS per capita loading. See Table 2.6. (3) Recommended design loading from Metcalf & Eddy (2003). b) Industrial Loadings Since there are no Significant Industrial User agreements between industries and the City of Silver Bay, there are no industrial loadings to account for. The small industrial users are considered in the residential and commercial loadings. c) 20-Year Design Loadings Table 2.9 summarizes both existing and calculated 20-year design loadings that include all wastewater sources. Table 2.9 Summary of Existing and Calculated 20-Year Loadings Existing/Historic Future Design Parameter Parameters Parameters Year Population 1,849 1,849 CBOD Average Day (lbs./day) CBOD Peak Day (lbs./day) 2,920 3,302 TSS Average Day (lbs./day) TSS Peak Day (lbs./day) 4,626 4,716 TKN Average Day (lbs./day) N/A 85 TKN Peak Day (lbs./day) N/A 213 P Average Day (lbs./day) BIOSOLIDS The Silver Bay Wastewater Treatment Facility produces Class B biosolids. Sludge is processed in a first and second stage anaerobic digester. Biosolids production is expected to Prepared by: Bolton & Menk, Inc. DESIGN CONDITIONS Silver Bay, MN Wastewater Treatment Facility Plan ǀ M Page 18
27 increase over the design period as flows and loadings increase. The NPDES permit in Appendix A describes the biosolids limits for land application with monitoring requirements. EXISTING EFFLUENT LIMITS The current effluent limits for the Silver Bay s Wastewater Treatment Facility are described in NPDES Permit No. MN A copy of the permit is included in Appendix A. A summary of the final effluent limits is presented in Table Table 2.10 NPDES Discharge Limits Silver Bay, MN Parameter Season Limit Type Limits CBOD 5 Jan-Dec Calendar Month Average 25 mg/l (78.4 kg/day) Jan-Dec Max Calendar Week Ave. 40 mg/l (125 kg/day) Jan-Dec Min. Calendar Month Ave. 85% removal Chlorine, Total Residual Jan-Dec Daily Maximum mg/l Fecal Coliform Apr-Oct Calendar Month Geometric Mean 200 #/100 ml Mercury, Total (as Hg) May, Sep. Calendar Month Average 1.9. ng/l May, Sep. Daily Max 3.5 ng/l Phosphorus, Total (as P) Jan-Dec Calendar Month Average 1 mg/l (3.1 kg/day) ph Jan-Dec Monthly Max. 9 Jan-Dec Monthly Min. 6 TSS Jan-Dec Monthly Ave. 30 mg/l (94.1 kg/day) Jan-Dec Max. Week Ave. 45 mg/l (141 kg/day) Jan-Dec Min. Month Ave. 85% removal CONSIDERATIONS FOR FUTURE EFFLUENT LIMITS Based on the types of improvements being considered in Section 4 and Section 5, the MPCA requires the submittal of a Preliminary Effluent Limits Review Request (PELRR) in order to re-evaluate the facility s current discharge limits. Completed review forms are included in Appendix E. Prepared by: Bolton & Menk, Inc. DESIGN CONDITIONS Silver Bay, MN Wastewater Treatment Facility Plan ǀ M Page 19
28
29 3. EVALUATION OF EXISTING FACILITIES OVERVIEW The City of Silver Bay owns and operates a mechanical wastewater treatment facility that has a continuous discharge to Lake Superior in accordance with National Pollutant Discharge Elimination System (NPDES/SDS) permit MN The permit was issued on September 5, 2015 and expires on August 31, The facility has a current AWW design flow of MGD. The City s gravity collection system and forcemains conveys all raw wastewater to the WWTF. Pre-treatment processes include a manual bar screen, a high flow diversion structure to bypass the bar screen and grit removal chamber, and a comminuter. Primary treatment includes two 40-foot diameter primary clarifiers, one 60-foot diameter trickling filter with rock media, and a 40-foot diameter secondary clarifier. Tertiary treatment was originally constructed to aid in phosphorus removal, using chemical addition, and includes two tertiary solids contact clarifiers. A chlorination/dechlorination unit provides disinfection. Biosolids are processed in two heated anaerobic digesters. The treated wastewater flows through a manhole and finally to the outfall where it is discharged into Lake Superior. To improve mercury removals at the WWTF, the City of Silver Bay recently upgraded both tertiary solids contact clarifiers in Tertiary clarifier No. 1 received new equipment and a new coating, while tertiary clarifier No. 2 received only a new coating. Neither of the clarifiers received covers during the last rehabilitation project. Historically, ice has formed on the surface of the clarifiers, which may affect performance, specifically for mercury removal. Overall, the facility is in good condition and has been well maintained and has the ability to meet all permitted discharge limits, except mercury. Mercury removal alternatives and costs are found in section five of this report. A process flow diagram for the normal flow path is presented in Figure 3.1. The site overview of the existing wastewater treatment facility is presented in Figure 3.2. Prepared by: Bolton & Menk, Inc. EVALUATION OF EXISTING FACILITIES Silver Bay, MN Wastewater Treatment Facility Plan ǀ M Page 20
30 3.1 Figure 3.1: Silver bay WWTF Process Schematic Prepared by: Bolton & Menk, Inc. EVALUATION OF EXISTING FACILITIES Silver Bay, MN Wastewater Treatment Facility Plan ǀ M Page 21

31 COLLECTION SYSTEM Figure 3.2 Silver Bay WWTF Aerial Overview 1. Gravity Collection System The City of Silver Bay existing gravity collection system consists of varying pipe sizes. The City performs infrastructure improvements as necessary to replace aging infrastructure. The City has been focusing these improvements on areas believed to be major sources of infiltration and inflow (I&I). Improvements to the existing gravity collection system are not considered in this Facility Plan. However, it is highly recommended that the City continue efforts to reduce I&I. Prepared by: Bolton & Menk, Inc. EVALUATION OF EXISTING FACILITIES Silver Bay, MN Wastewater Treatment Facility Plan ǀ M Page 22
32 TREATMENT FACILITY 1. Pre-Treatment a) Influent Manhole The influent manhole was constructed with the original plant in The concrete has shown signs of deterioration but the manhole structure is in fair condition overall. With improvements to the preliminary treatment, the influent manhole should be replaced. b) High Flow Diversion Structure and High Flow Manual Bar Screen A high-flow diversion structure precedes the pre-treatment process at the WWTF. This structure was added in 1994 and includes an influent by-pass structure, a manually cleaned bar screen on the by-pass line, and influent flow monitoring for the by-pass. The by-pass constructed in 1994 involves diverting flows in excess of the capacity of the previously constructed bar screen, grit removal, and influent flow monitoring to the primary clarifier splitter box. The concrete structure for the high-flow bypass has 20 plus years of useful life remaining and is in good condition. However, operational issues with the manual bar screen during high flow events have resulted in rags and other debris continuing downstream and causing operational problems with pumps, digester heating, and contributing to excess solids accumulating in the digesters which increases costs associated with biosolids removal. The high flow diversion structure and manual bar screen are exposed to weather resulting in operation that is more difficult during rainfall and winter conditions. With the above operational concerns noted, the manual bar screen and high flow diversion structure are in need of replacement. c) Manual Bar Screen Under normal flow conditions, pre-treatment at the WWTF begins with a manual bar screen. The existing bar screen has 3/8 bars and 1 ½ openings. The effective area of the screen is 2-1 by 3-0 and sits at a 26 o angle with the horizontal plane. The manual bar screen was installed in The existing manual bar screen has operational problems that allow rags and other debris to pass through which has led to clogging problems with pumps and excess debris and solids settling in the clarifiers. The excess solid are sent to the digesters, which has affected digester heating and has led to increase biosolids handling costs. The manual bar screen is currently not protected from the weather. High flows and winter freezing conditions make operation of the bar screen difficult. Overall, with poor screening efficiency and difficult operation, the manual bar should be replaced. d) Grit Removal Once the wastewater has been screened, flow enters the grit removal chamber. The grit removal chamber was installed in 1972 and is 14 feet in diameter with an effective liquid depth of 4.67 feet. The grit chamber and associated grit removal equipment are in poor condition. The conveyor that removes the settled Prepared by: Bolton & Menk, Inc. EVALUATION OF EXISTING FACILITIES Silver Bay, MN Wastewater Treatment Facility Plan ǀ M Page 23

33 material from the grit tank has been repaired numerous times and is inoperable at times. The existing equipment in the chamber is inefficient and is in need of replacement. With equipment that is outdated and has poor efficiency and reliability, significant amounts of grit pass through this structure and settle in the primary clarifiers. The excess solids from the clarifiers are sent to the digesters. These excess solids accumulate in the digesters, and as noted before, increase the costs for biosolids handling and removal from the facility. The existing grit removal chamber is undersized for the influent flows and has several operational concerns. As noted earlier the equipment has failed several times and is inoperable. The existing concrete structure is showing signs of deterioration and requires significant rehabilitation and modifications to accommodate new equipment. The grit and solids that settle out in the bottom of the tank are sent to a washing unit and collection bin in the adjacent building. The adjacent building is in poor condition. The building was replaced in 1994 and requires repairs to the masonry walls and concrete. The building does not have any wall insulation and only 1 ½ of board insulation on the roof that results in freezing conditions during winter months. The building is in need of significant improvements. The grit removal chamber is shown in Figure 3.3. Figure 3.3: Grit Removal Chamber e) Bar Screen/Comminuter Combination Following grit removal, wastewater enters the bar screen/comminuter combination. The purpose of the comminuter is to grind up rags and other debris to prevent downstream processes and pipes from clogging. The bar screen is manually cleaned in the 24 inch channel in which the comminuter sits in. However, flows often exceed the capacity of the bar screen and watermarks on the concrete structure indicate water levels above the bar screen. These flows exceed the capacity of the comminuter. The comminuter was installed in 1954 with the original WWTF. The bar screen and comminuter combination is inefficient at removing debris from the wastewater and has exceeded its useful life. Prepared by: Bolton & Menk, Inc. EVALUATION OF EXISTING FACILITIES Silver Bay, MN Wastewater Treatment Facility Plan ǀ M Page 24


34 2. Primary Clarifiers After preliminary treatment, wastewater enters two primary clarifiers. Both clarifiers are both 40 feet in diameter with a sidewater depth of 7.5-ft each. Primary clarifier No. 1 was installed in 1954 while primary clarifier No. 2 was installed in Clarifier No. 1 received new equipment in The equipment in clarifier No. 2 is almost 20 years old and should be replaced. Both clarifiers should be drained down and inspected. Overall, the clarifiers appear to be in good operating condition and are in adequate condition for current and future design flows. Primary clarifier No. 1 and No. 2 are shown in Figure 3.4 and 3.5, respectively. Figure 3.4: Primary Clarifier No. 1 Figure 3.4: Primary Clarifier No. 2 Prepared by: Bolton & Menk, Inc. EVALUATION OF EXISTING FACILITIES Silver Bay, MN Wastewater Treatment Facility Plan ǀ M Page 25


35 3. Trickling Filter Primary biological treatment at the WWTF is completed by a single 60-foot diameter trickling filter with 6 feet of rock media that is made from 3-inch crushed rock. Historically, the trickling filter has achieved high removals of CBOD 5 to below permitted limits. The structure has 20 plus years of useful life remaining and has been well maintained. The trickling filter is in good condition and has the capacity to handle current and future loading and flows. The trickling filter is shown in Figure Secondary Clarifier Figure 3.6: Trickling Filter Following the trickling filter is one 40-foot diameter secondary clarifier. The clarifier has a sidewater depth of 7.5 feet and was installed in 1954 with the original WWTF. The secondary clarifier also serves a purpose to recycle solids back to the trickling filter to maintain a healthy population of organisms to treat the wastewater and to waste excess solids to the anaerobic digesters. The concrete in the secondary clarifier is in good condition and has 20 plus years of useful life remaining. Figure 3.7: Secondary Clarifier Prepared by: Bolton & Menk, Inc. EVALUATION OF EXISTING FACILITIES Silver Bay, MN Wastewater Treatment Facility Plan ǀ M Page 26
36 5. Disinfection Flow from the secondary clarifier enters the chlorine contact tank that sits below the operations building. The chlorine contact tank allows for a flow of 1.04 MGD with a minimum of a 15-minute detention time. The contact basin is made from concrete that has 20 plus years of useful life remaining. No major improvements are required for the chlorine contact basin. Under higher flows, the detention time in the chlorine contact time is relatively short, but additional contact time is achieved in the tertiary clarifiers. With the tertiary clarifiers included in the detention time, the allowable flow exceeds 10 MGD. Pumps convey the wastewater to the tertiary clarifier splitter box that sends the wastewater to one of two tertiary solids contact clarifiers. Currently, the three original dry-pit that were designed to convey the water to the tertiary clarifiers, are not being use and are in need of replacement. These pumps are rated for 600 gpm. Two smaller submersible pumps in the wet well are the only pumps that convey water to the splitter box. The splitter box is in good condition and has 20 plus years of useful life remaining. Dechlorination is accomplished in the effluent trough of the tertiary solids contact clarifiers with the addition of sodium bisulfate. 6. Tertiary Solids Contact Clarifiers Two tertiary solids contact clarifiers follow the chlorine contact basin. These clarifiers were originally designed to reduce effluent phosphorus loads, but are also currently being used to test the effectiveness of reducing mercury levels with chemical addition in a full-scale pilot study. Tertiary clarifier number one was constructed in 1975 and is 40 feet in diameter with a sidewater depth of 11 feet. Four sludge hoppers collect the settled sludge where it is pumped to the anaerobic digesters. A second clarifier was added in 1995 and is 45 feet in diameter with a sidewater depth of 10.8 feet. The second clarifier has a sloped floor that conveys settled sludge to one centralized sludge hopper. Freezing temperatures in the winter historically have caused ice to form in the clarifiers. Colder wastewater temperatures and ice formation could cause the coagulant (alum) to be less effective in forming precipitates, thus reducing the removal efficiency of phosphorus and mercury. The addition of covers will prevent ice formation and other operation concerns that occur when the surface of the clarifiers freeze. Both clarifiers were rehabilitated in 2016 with solid contact clarifier No. 1 receiving new equipment and a new coating, while solids contact clarifier No. 2 received only a new coating. The project was completed in December of This most recent project added 20 plus years of useful life to the clarifiers. Currently, the clarifiers are in good condition. Clarifier number one can be seen in Figure 3.8 while clarifier number two is shown in Figure 3.9. Additional discussion on the clarifiers is later in this report. Prepared by: Bolton & Menk, Inc. EVALUATION OF EXISTING FACILITIES Silver Bay, MN Wastewater Treatment Facility Plan ǀ M Page 27
 are sent via pumps to the first and second")

37 Figure 3.8: Solids Contact Clarifier No. 1 Figure 3.9: Solids Contact Clarifier No Biosolids Storage Solids produced at the WWTF (in the primary, secondary, and tertiary clarifiers) are sent via pumps to the first and second stage anaerobic digesters. The first stage anaerobic digester was installed in 1954, while the second stage anaerobic digester was added in It has been noted that the waste gas burner and equipment is not Prepared by: Bolton & Menk, Inc. EVALUATION OF EXISTING FACILITIES Silver Bay, MN Wastewater Treatment Facility Plan ǀ M Page 28


38 operating correctly and requires new parts and components. The sediment trap on the stage two digester is in need of replacement. The second stage digester has a floating cover that was rehabilitated in 1995, but has not had any major improvements since that time. The cover exterior is in ok condition, but an inspection will need to be completed to verify the condition inside the tank. Floating covers typically require maintenance after 20 years and it is most likely that the floating cover will need to be rehabilitated. In addition, the concrete foundation inside the first stage digester is noted to have a crack that needs to be sealed. The mixer in digester one in in need of replacement. There is no mixer in the second stage digester. The facility produces class B biosolids that are applied to local fields. The structures are in good condition and have 30 plus years of useful life remaining. The first stage digester is shown in Figure 3.10, while the second stage anaerobic digester is shown in Figure Figure 3.10: First Stage Anaerobic Digester Figure 3.11: Second Stage Anaerobic Digester Prepared by: Bolton & Menk, Inc. EVALUATION OF EXISTING FACILITIES Silver Bay, MN Wastewater Treatment Facility Plan ǀ M Page 29
39 TREATMENT PERFORMANCE 1. CBOD, TSS, and Phosphorus Removal The City of Silver Bay NPDES permit specifies pollutant discharge limits for CBOD 5, TSS, phosphorus, and mercury. Figures 3.12 through 3.14 show reported effluent discharge values for each CBOD 5, TSS, and phosphorus, respectively over the past five years. In this timeframe, there was only one instance where the weekly maximum CBOD 5 concentration exceeded the weekly maximum limit. Otherwise, the WWTF has met all discharge limits for CBOD 5. Twice, the weekly maximum effluent TSS concentration exceed the weekly maximum limit of 40 mg/l, and only one time has the weekly maximum TSS load exceeded the weekly maximum limit of 311 lbs./day. The TSS load exceeded the average monthly limit of 207 lbs./day only once during the historical monitoring period. There were no other instances where the average monthly concentration or TSS loads, exceed permitted limits. The total phosphorus concentration exceeded the permitted limit of 1 mg/l only once during the historical monitoring period. The total phosphorus load exceeded the permitted limit of 6.83 lbs./day one time in the last five years. Prepared by: Bolton & Menk, Inc. EVALUATION OF EXISTING FACILITIES Silver Bay, MN Wastewater Treatment Facility Plan ǀ M Page 30
40 90 Average Monthly Monthly Average Limit (25 mg/l) Maximum Weekly Weekly Maximum Limit (40 mg/l) CBOD 5 Concentration (mg/l) Monthly Average Monthly Average Limit (173 lbs/day) Weekly Maximum Weekly Maximum Limit (276 lbs/day) CBOD 5 Loading (lbs/day) Figure 3.12 CBOD 5 Effluent Discharge Concentration (top) and Loading (bottom) Prepared by: Bolton & Menk, Inc. EVALUATION OF EXISTING FACILITIES Silver Bay, MN Wastewater Treatment Facility Plan ǀ M Page 31
41 TSS Concentration (mg/l) Average Monthly Monthly Average Limit (30 mg/l) Maximum Weekly Weekly Maximum Limit (45 mg/l) TSS Loading (lbs/day) Monthly Average Monthly Average Limit (207 lbs/day) Weekly Maximum Weekly Maximum Limit (311 lbs/day) Figure 3.13 TSS Effluent Discharge Concentration (top) and Loading (bottom) Prepared by: Bolton & Menk, Inc. EVALUATION OF EXISTING FACILITIES Silver Bay, MN Wastewater Treatment Facility Plan ǀ M Page 32
42 1.2 Average Monthly Monthly Average Limit (1 mg/l) Total Phosphorus (mg/l) Monthly Average Monthly Average Limit (6.83 lbs/day) Total Phosphorus (lbs/day) Figure 3.14 Total Phosphorus Discharge Concentration (top) and Loading (bottom) Prepared by: Bolton & Menk, Inc. EVALUATION OF EXISTING FACILITIES Silver Bay, MN Wastewater Treatment Facility Plan ǀ M Page 33
43 ENVIRONMENTAL SOURCES OF MERCURY - RAINFALL Studies have indicated that significant concentrations of mercury can be found in rainfall. Mercury in rainwater is linked to atmospheric pollutants, mainly from coal burning facilities. There are often higher levels of mercury in rainwater downwind of large industrial areas as well. Data is collected by the National Atmospheric Deposition Program and compiled to compare mercury in rainfall from a number of monitoring stations across the upper Midwest. Mercury data collected across the Northeastern section of Minnesota indicates that mercury levels in rainfall are elevated and are above the permitted final mercury limits noted in the NPDES permit. High levels of mercury in rainfall may warrant specific improvements to the existing facility to prevent erroneous mercury testing results in the effluent waste stream. Some of the elevated mercury results discussed later may have occurred during heavy rain events where rainwater with a high mercury concentration may have entered the effluent waste stream of the uncovered solids contact clarifiers. If a mercury grab sample was collected during a precipitation event or within a several hour window, this could lead to an elevated mercury concentration. Specific improvements to the tertiary solids contact clarifiers to prevent rainfall from entering the effluent waste stream are presented in section four (4). FULL-SCALE PILOT STUDY & MERCURY COLLECTION AND MONITORING 1. Background A pilot study is currently being run to test the effectiveness of using coagulant and flocculant to increase TSS, and consequently total mercury, removal in the tertiary clarifiers. Mercury sampling for the pilot study started in December 2016 after the rehabilitation project on the tertiary clarifiers was completed and both clarifiers were operational. A change to operation was made on January 10, The coagulant feed point was moved from the tertiary splitter box to the center well of the tertiary clarifiers. No change was made to the polymer feed point, which remains in the tertiary clarifier center well. 2. Water Quality Summary This section includes a summary of the influent and effluent mercury and TSS data collected to date. As stipulated by the current permit, once per month total and dissolved mercury samples are required to be collected in May and September. While the required once per week 24-hour composite TSS effluent samples have been collected, TSS samples have not been collected with mercury samples as required in the permit. Unfortunately, this makes correlating mercury and TSS concentrations less reliable. As part of the City s mercury reduction effort, weekly mercury sampling has been conducted beginning in December Mercury data collection is shown in Table 3.1. Prepared by: Bolton & Menk, Inc. EVALUATION OF EXISTING FACILITIES Silver Bay, MN Wastewater Treatment Facility Plan ǀ M Page 34
44 Table 3.1 Historical Mercury Data ( ) Influent Effluent Combined Sample Date Total Mercury (ng/l) Dissolved Mercury (ng/l) Clarifier No. 1 Total Mercury (1) (2) (ng/l) Clarifier No. 1 Dissolved Mercury (ng/l) Clarifier No. 2 Total Mercury (ng/l) (2) Clarifier No. 2 Dissolved Mercury (ng/l) Average Total mercury (ng/l) (3) Effluent TSS (mg/l) (4) WWTF Flow (MGD) Total Mercury Percent Removal June 18, % Oct. 22, % Nov. 9, N/A Jan. 14, < % Feb. 4, < N/A April 1, % May 31, % Sep. 30, % Jan 6, < % May 18, % May 31, < % July 6, % Oct. 18, % Oct. 27, % Dec. 7, N/A 79.2% Dec. 13, N/A 96.7% Dec. 21, < N/A 89.0% Dec. 28, N/A 85.9% Jan. 4, N/A 87.8% Jan. 11, N/A 89.0% Jan. 18, < < N/A 95.8% Jan. 25, < < N/A 96.7% Feb. 1, < < N/A 95.2% Average % (1) Clarifier No. 1 was out of service until August 25, 2016 and came online on August 26, 2016 when renovations began on tertiary clarifier No. 2. (2) Both clarifiers became operational on November 14, (3) Average effluent total mercury concentrations are the average mercury concentrations between samples taken from tertiary clarifier No. 1 and tertiary clarifier No. 2. (4) TSS data represents composite calendar month average and was not collected with the mercury samples The average influent total mercury concentration over this reporting period is 51.6 ng/l with an average dissolved concentration of 2.3 ng/l. While clarifier No. 1 was offline for a majority of the period of historical data, clarifier No. 2 had a long-term average effluent total mercury concentration of 2.54 ng/l and an average dissolved concentration of approximately 1.26 ng/l. When clarifier No. 1 came back online on August 26, 2016 after it was rehabilitated, clarifier No. 2 was shut down for renovations from August 26, 2016 to November 14, The average effluent total mercury concentration in tertiary clarifier No. 1 during this time was 1.76 ng/l with an average dissolved concentration of ng/l. Both clarifiers became operational on November 14, Historically, the clarifiers have been removing approximately 92% of the influent mercury. Although the treatment facility has achieved a high percentage of mercury removal, historical effluent mercury concentrations have exceeded final limits of 1.9 ng/l for a calendar month average and 3.5 ng/l for a daily maximum. As noted in the table, there is significant variability in the influent mercury data, ranging from 11.9 ng/l to 194 ng/l. To determine the cause of this variability, precipitation data recorded at Silver Bay Municipal Airport was compiled and compared to the mercury data. Figure 3.15 shows the relationship between the influent Prepared by: Bolton & Menk, Inc. EVALUATION OF EXISTING FACILITIES Silver Bay, MN Wastewater Treatment Facility Plan ǀ M Page 35
45 mercury levels and the inches of precipitation on that particular day. This follows the discussion from earlier relating rainfall and mercury in northeastern Minnesota. While not definitive, there may be a correlation between influent mercury concentration and precipitation events. There may be a number of possible contributors to the elevated influent levels and a review of the mercury minimization plan may identify new sources of mercury since completion of that plan to possibly reduce or eliminate the influent spikes 250 Influent Mercury Precipitation Influent Mercury (ng/l) Precipitation (in) Figure 3.15 Influent Mercury Compared to Daily Precipitation Figures 3.16 and 3.17 show historical total and dissolved effluent mercury as compared to the interim and final limits set forth in the NPDES permit. Prepared by: Bolton & Menk, Inc. EVALUATION OF EXISTING FACILITIES Silver Bay, MN Wastewater Treatment Facility Plan ǀ M Page 36
46 6 Total Mercury Dissolved Mercury Interim Limit Final Limit Effluent Mercury (ng/l) Figure 3.16 Total Effluent Calendar Monthly Average Mercury Compared to Interim and Final Limits 8 Total Mercury Dissolved Mercury Interim Limit Final Limit 7 Effluent Mercury (ng/l) Figure 3.17 Total Effluent Daily Maximum Mercury Compared to Interim and Final Limits As shown in Figure 3.16, the existing treatment plant has consistently been able to meet the calendar monthly average interim limits (3.8 ng/l), with exceptions in September 2015 and July Figure 3.17 show the plant has been able to consistently meet the daily maximum interim limits (7 ng/l). Prepared by: Bolton & Menk, Inc. EVALUATION OF EXISTING FACILITIES Silver Bay, MN Wastewater Treatment Facility Plan ǀ M Page 37
47 While the treatment plant has been able to generally meet the interim limits, it has not been able to consistently meet the daily maximum (3.5 ng/l) and the calendar monthly average (1.9 ng/l) final limits. Additionally, the dissolved effluent mercury concentration has exceeded the final limits two times. To identify potential causes of the exceedances, the flow rate through the facility was reviewed and is plotted with the mercury concentration in Figure 3.18 below. At higher flow rates, the settling times may be reduced reducing TSS removal and subsequently mercury removal. The carryover in the clarifiers could result in the higher effluent mercury levels. Total Mercury (ng/l) Total Mercury Flow Flow (MGD) Figure 3.18 Effluent Mercury Relationship to WWTF Flow Rate While they were not collected together, there seems to be some correlation between total effluent mercury and TSS as shown in Figure Renovations to the tertiary clarifiers were completed in November At that time, the City began the fullscale pilot study. These test results begin on December 7, Prepared by: Bolton & Menk, Inc. EVALUATION OF EXISTING FACILITIES Silver Bay, MN Wastewater Treatment Facility Plan ǀ M Page 38
48 Effluent Total Mercury Effluent TSS Start of Pilot Study Total Mercury (ng/l) TSS (mg/l) Figure 3.19 Effluent Mercury and TSS Comparison While the TSS and mercury data were not collected together, there does appear to be a possible correlation between the two constituents. This is consistent with the findings at other facilities. TSS data that is available was used in the comparison. TSS sampling has been taken during the full-scale pilot and sent to the lab for analysis, and the results are pending at this time. Reviewing the available TSS data indicates the current treatment system does a good job of removing TSS and consistently discharges low TSS. However, this also means it is unlikely that much more TSS would be removed through settling alone. Another item to note is the mercury data collected in the splitter located ahead of the tertiary clarifiers. This data provides insight into potential mercury removal at the various stages of the existing treatment train. Figure 3.20 below shows mercury levels sampled at the influent, secondary clarifier effluent (tertiary splitter box), and tertiary clarifier effluent. While most removal takes place in the primary and secondary clarifiers, there is still some removal in the tertiary clarifier. In the primary and secondary clarifiers, there will be a higher percent of TSS for the mercury to attach to and settle out. As this TSS is reduced, additional chemical feed may be needed to get more mercury in suspension prior to the tertiary clarifiers to allow for more settling of the mercury. Prepared by: Bolton & Menk, Inc. EVALUATION OF EXISTING FACILITIES Silver Bay, MN Wastewater Treatment Facility Plan ǀ M Page 39
49 250 Influent Mercury Splitter Box Mercury Effluent Mercury 200 Mercury (ng/l) Figure 3.20 Mercury Levels Throughout the Treatment Process The test results of the full-scale pilot show that occasionally the system can meet the final discharge limits for mercury. However, it has not been able to consistently meet the final effluent limits over the entire pilot test period. Continuing the full-scale pilot study and monitoring the results during anticipated changes in influent flow rates, influent mercury level fluctuations and weather changes will provide additional data to assist with the decisions for long-term mercury treatment options. Prepared by: Bolton & Menk, Inc. EVALUATION OF EXISTING FACILITIES Silver Bay, MN Wastewater Treatment Facility Plan ǀ M Page 40
50
51 4. WASTEWATER TREATMENT FACILITY IMPROVEMENT ALTERNATIVES GENERAL Over the past five years, the City of Silver Bay Wastewater Treatment Facility has met compliance criteria specified in their NPDES discharge permit. However, with new mercury limits, the facility must explore alternative treatments that will improve mercury removals. By improving other treatment processes at the facility, it may benefit mercury removal. This section details improvements to the existing WWTF that are non-mercury related. Section five (5) will detail mercury related removal alternatives. WASTEWATER TREATMENT FACILITY IMPROVEMENTS The City of Silver Bay existing treatment infrastructure is in good condition to comply with current permitted limits. However, the preliminary treatment system has several operational concerns and will require improvements. Table 4.1 identifies alternatives for non-mercury related (preliminary treatment) and other miscellaneous improvements. Regardless of what mercury removal technology is discussed and recommended in section five (5), the following improvements will be included with the recommended mercury removal treatment alternative. Details of the preliminary treatment and other miscellaneous improvements are described in the following paragraphs. Table 4.1 Proposed Non-Mercury Related Alternatives for Wastewater Treatment Facility Improvements Alternative Description Alternative No. 1 Rehabilitate Pre-treatment, add Clarifier Covers to all clarifiers, and rehabilitate digester gas-burner equipment 1. Alternative No. 1 Rehabilitate Pre-treatment, add Clarifier Covers, and rehabilitate digester equipment The first alternative includes the rehabilitation of the pre-treatment process at the WWTF and providing covers for the tertiary solids contact clarifiers. As noted in section three, the existing pre-treatment process has several operational concerns as the manual bar screen has clogging issues and the grit removal equipment is outdated and in need of replacement. This alternative includes replacing the influent manhole, replacing the by-pass bar screen and channel, replacing the manual bar screen with a mechanical fine screen, replacing the grit removal equipment, modifying the grit removal structure, constructing a new pre-treatment building, adding covers to the tertiary solids contact clarifiers, adding covers to the primary and secondary clarifiers, replacing pumps in the control building, replacing the gas burner equipment on the digesters, adding a digester mixer to the anaerobic digesters. Details on this alternative are provided below. a) Preliminary Treatment Building Part of the rehabilitation of the existing preliminary treatment process involves the construction of a new pre-treatment building. The pre-treatment building will Prepared by: Bolton & Menk, Inc. WASTEWATER TREATMENT FACILITY IMPROVEMENT ALTERNATIVES Silver Bay, MN Wastewater Treatment Facility Plan ǀ M Page 41
52 house the mechanical fine screen, flow-monitoring equipment, and a new grit classifier and washer. This alternative will require the existing building that houses the grit washer to be demolished. The new building will be constructed over the existing preliminary treatment process. This building will have to be constructed while maintaining operation of the treatment process. Some processes will need to be by-passed during construction. The new building will contain mechanical and electrical rooms due to the classification of the process space in the building. The building would be a masonry wall building with reinforced concrete. Heating and air conditioning will be included with construction. The proposed building would have dimensions of 32 feet by 40 feet with a 12-foot high ceiling. The mechanical and electrical rooms would have dimensions of 8 feet by 12 feet each. These dimensions are preliminary and may change during design if it is determined a smaller footprint is needed to reduce capital costs. The roof would be made from pre-cast concrete planks with insulation and a membrane roof system. An 8-footby-8-foot overhead door would be installed so a truck could back-up to the dumpster to remove the screening materials. Minor site improvements will be necessary to grade the surrounding ground to slope drainage away from the building and to re-route the driveway to the new building. b) Influent Manhole and Diversion Structure As noted in section three, the existing influent manhole is in need of replacement. This alternative includes demolishing the old influent manhole and replacing it with a new 48 manhole. The new manhole would be located upstream of the diversion structure to allow all of the flow to the WWTF pass through this manhole. This also includes modifying route of the influent from North Shore Mining to pass through this manhole. Flow from the influent manhole would flow to a new diversion structure with influent monitoring capability. This is where flow would be diverted to the bypass channel during high flow events. Flow would be monitored by either a Parshall Flume or an ultrasonic level transducer that could record flow. c) By-pass Bar Screen and Channel With the construction of a new pre-treatment building and operational problems with the existing by-pass structure, a new manually cleaned bar screen in a new by-pass channel will be installed. With this option, the existing by-pass bar screen and structure will be demolished. The new screen would be 2-4 feet wide and have a bar spacing similar to the existing manual bar screen. This process would be installed outside the new preliminary treatment building and be covered to protect equipment and the structure from the elements and allow for easy access for maintenance and cleaning. Flow monitoring equipment will be installed in the downstream channel as either a Parshall Flume or ultrasonic level transducer to record flows during by-pass events. The flow would be sent to the primary clarifier splitter box. Prepared by: Bolton & Menk, Inc. WASTEWATER TREATMENT FACILITY IMPROVEMENT ALTERNATIVES Silver Bay, MN Wastewater Treatment Facility Plan ǀ M Page 42
53 d) Mechanical Fine Screen The existing manual bar screen has operational issues such as clogging and freezing during winter months. With improvements to the WWTF, a new mechanical fine screen will replace the manual bar screen. The purpose of the new mechanical fine screen would be to improve removal efficiency of debris and solids that could possibly affect downstream processes. The mechanical screen would be positioned in the influent channel upstream of the grit removal chamber. The screen would be designed to handle the design peak hourly wet weather flow of 3.48 MGD. Flows above this would most likely be diverted to the new by-pass channel. The screen cleaning would cycle based on headloss or on a timed system where the screen is cleaned at specific time intervals. With the addition of a mechanical fine screen, the existing comminuter and associated concrete structure would be demolished and not replaced. e) Grit Removal Chamber and Equipment As noted in section three, the concrete structure on the existing grit removal chamber is deteriorating in certain locations and is in need of rehabilitation. The existing equipment is non-operational at times and in need of replacement. The old grit removal equipment will be replaced with a new vortex style grit removal system. The new system would include a shaft with adjustable paddles that rotate and create a mechanically induced vortex, which settles grit, transports it to the center opening of the fixed floor for collection, and lifts and returns the light organic particles to the main flow. The new grit equipment would be sized for the PHWW design flow of 3.48 MGD. The existing concrete structure would need to be modified to reshape the tank bottom and to relocate pipe penetrations into the structure for grit removal. The new preliminary treatment building would be constructed around the existing grit removal chamber to reduce costs with forming a new chamber. By placing this structure inside, it will remove operational issues associated with freezing temperatures in the winter and heavy rain events in the summer. A recessed impeller pump would then transport the grit to the grit classifier and grit washer. The grit classifier and washer clean and separate the grit from the water. The grit classifier would deposit the de-watered grit in a dumpster while the wash water would be recycled back to the head of the plant for re-treatment. f) Tertiary Solids Contact Clarifier Covers This alternative includes installing aluminum covers on both tertiary solids contact clarifiers to improve treatment performance. The existing tertiary solids contact clarifiers recently underwent renovations to replace equipment and recoat the interior of the clarifiers in Both clarifiers are in good shape and have been well maintained. However, these most recent renovations did not provide covers for the clarifiers. Operations staff at the WWTF has noted that the clarifiers form ice during winter months. This can affect the treatment performance of the clarifiers, especially with chemical addition. Cold temperatures reduce the kinetics of the chemical reactions making them less Prepared by: Bolton & Menk, Inc. WASTEWATER TREATMENT FACILITY IMPROVEMENT ALTERNATIVES Silver Bay, MN Wastewater Treatment Facility Plan ǀ M Page 43
54 efficient, which can reduce effluent water quality. It is best to try maintain a consistent wastewater temperature for optimum efficiency. The covers will help provide control for chemical feed doses and feed rates as well as maintaining a more consistent wastewater temperature. As noted earlier in this report, the City is in the process of running a full-scale pilot study using chemical addition in the solids contact clarifiers to remove mercury. By covering the clarifiers and providing control over temperature, it may help improve mercury removals in the clarifiers. The covers may also prove beneficial in preventing mercury contamination from outside environmental sources. The covers will help reduce ice formation during the winter and prevent algae growth during summer months. This is critical in optimizing mercury removal from the clarifiers, especially prior to a tertiary treatment system. As noted earlier in this report, data collected on the mercury concentration in rainfall indicates that the area receives rainfall that may have elevated levels of mercury above the treatment facilities final permitted discharge limits. During heavy precipitation events, the rainfall that hits the solid contact clarifiers and flows out in the effluent channel may increase effluent mercury concentrations. This mercury would actually be from rainfall, and not from the wastewater. Covers over the clarifiers will reduce the chance that rainfall will affect the mercury concentration in the effluent waste stream. It ensures that the concentration of mercury in the grab samples is from only the wastewater, not the rainwater. g) Primary and Secondary Clarifier Covers As noted in section three, the two primary and single secondary clarifiers are in good condition. However, since they are open to the elements, rain and freezing conditions may affect performance. Since the facility is working on improvements to help achieve high mercury and solids removal, providing covers over these clarifiers will significantly help treatment performance. The covers included in this option will all be aluminum and sized to fit over the existing clarifiers. Access hatches will be provided for inspection and maintenance. In total, three covers will be required for these clarifiers in addition to the two required on the tertiary clarifiers for a total of five aluminum clarifier covers. This option also includes draining the clarifiers for inspection and recoating the primary and secondary clarifiers with a new coating on the interior and all mechanical components. h) Anaerobic Digester Equipment The anaerobic digester structures are in good condition for 20 plus years. To help improve biosolids processing, a digester mixer is included in this alternatives. A mixer would be added into the first stage anaerobic digester to completely mix the tank. This will help improve biosolids processing and maintain good mixing throughout the tank. In addition, it was noted that the gas burner equipment has not been operating as intended. This option includes replacing that equipment with new equipment so the facility can operate the gas burner as intended on the digester. The sediment Prepared by: Bolton & Menk, Inc. WASTEWATER TREATMENT FACILITY IMPROVEMENT ALTERNATIVES Silver Bay, MN Wastewater Treatment Facility Plan ǀ M Page 44
55 trap that is currently in-place has significant operation problems and will be replaced with this option. i) Control Building Pumps, Piping, and Valves As stated in section three, the three dry-pit pumps in the existing control building that are designed to convey water to the tertiary clarifier splitter box, are not being used due to reliability issues. To improve pumping efficiency and to provide redundancy, this alternative includes replacing these three pumps inkind, with three new dry-pit pumps capable of producing the same flow rate (600 gpm). j) Site Improvements With significant modifications to the pre-treatment facilities, additional site modifications will be required. The new pre-treatment building will require a new driveway to be constructed up to the building to allow access and for dumpster removal. The site grading will need to drain water away from the structure. It may be required to add masonry retaining walls depending on final floor elevations and channel elevations in the pre-treatment building. Depending on what alternative is recommended for mercury removal treatment, new buildings to house filters or other equipment may need to be constructed. This would require significant site improvements and grading to improve drainage. New driveways and sidewalks would need to be constructed as well. This part of the site improvements is contingent on what mercury removal technology is recommended and implemented at the WWTF. ADVANTAGES AND DISADVANTAGES The advantages for this alternative include greatly increasing screening efficiency and grit removal by adding a fine screen and new vortex grit removal equipment. The existing system has limitations, especially during winter months when freezing temperatures impact the manual bar screen. The addition of a new building, screening equipment, and grit removal equipment will remove more solids and debris, which can help improve downstream treatment efficiency. By removing debris and grit upstream, it may be possible to reduce wear on pumps and increase the pumping efficiency. Improving grit and debris removal may also prove beneficial at helping to reduce mercury concentrations entering the WWTF. Some of the influent mercury will be attached to suspended particles. By improving TSS removal in the preliminary treatment, it may be possible to help improve mercury removal downstream by removing solids that may have attached mercury. Additionally, covering the clarifiers prevents them from freezing and provides more control over chemical dosing and controlling effluent mercury and phosphorus concentrations. The covers will also prevent the growth of algae in the summer months that can affect treatment performance and potentially lead to increased pollutant loadings when algae die. Again, covers over the clarifiers will prevent rainfall with potentially high levels of mercury from Prepared by: Bolton & Menk, Inc. WASTEWATER TREATMENT FACILITY IMPROVEMENT ALTERNATIVES Silver Bay, MN Wastewater Treatment Facility Plan ǀ M Page 45
56 entering the effluent waste stream leading to high mercury concentrations in the grab samples. The disadvantages to this alternative are that another building will need to be constructed which increases capital and operations costs. The building will require heat and air conditioning. Overall, the advantages greatly outweigh the disadvantages for rehabilitating the preliminary treatment process and adding tertiary clarifier covers. These improvements will greatly benefit the recommended mercury removal treatment process discussed in the next section. Prepared by: Bolton & Menk, Inc. WASTEWATER TREATMENT FACILITY IMPROVEMENT ALTERNATIVES Silver Bay, MN Wastewater Treatment Facility Plan ǀ M Page 46
57 5. MERCURY REMOVAL IMPROVEMENTS AND ALTERNATIVES GEMERAL As noted in previous sections, the effluent mercury concentrations do not meet the mercury permit limits in the final period. While there is limited TSS data that was collected with the grab mercury samples, based on experience with other projects, reducing TSS will likely have a positive effect on mercury removal. However, the current treatment process is already very efficient at removing TSS, additional tertiary treatment for mercury removal may be required. The pilot study using the tertiary clarifiers to remove mercury has shown that mercury removal is possible, but the results from the Phase I report (attached in Appendix H) are inconclusive and it is recommended to explore additional mercury removal alternatives. This section will discuss and evaluate different treatment options for mercury removal. It is important to note, that with each of the three alternatives discussed below, the preliminary treatment improvements from section four (4) are included. TREATMENT ALTERNATIVES Three options for additional solids and mercury removal have been identified: 1. Enhance existing tertiary solids contact clarifiers for mercury and TSS removal. 2. Construct new tertiary treatment facilities with media filters. 3. Construct new tertiary treatment facilities with membrane filters. Additional information is presented for each of these options below. 1. Enhancement of Existing Tertiary Solids Contact Clarifiers for Mercury and TSS Removal It is possible that enhancing the efficiency of the existing tertiary clarifiers will increase mercury removal. The mercury suspended in the water will attach to other suspended solids and settle out of solution, often with the help of coagulant, flocculant, and/or mercury scavenger chemistry. It has been demonstrated in other applications that mercury particles will settle out with other suspended solids in clarification steps of the treatment system. However, because the effluent already has low TSS, it is not expected that much more can be removed. Using a mercury scavenger, along with the current alum and polymer combination, the tertiary clarifier may potentially increase the settling of solids and mercury. While it is possible to improve mercury removal with the existing tertiary treatment process using additional additives, it is uncertain that this option will reliably meet final effluent limits for mercury. This option is currently being evaluated with the full-scale pilot study. The current pilot study is evaluating how effective coagulant and flocculant chemistry is at removing mercury. The City is using a combination of alum plus a polymer to form flocs that sequester the particulate mercury to settle in the bottom of the clarifiers. Additional combinations of alum and polymer may be explored with this option to determine the optimum doses of each chemical for each season. To sustain mercury removals with the tertiary solids contact clarifiers, it may require more detail and care Prepared by: Bolton & Menk, Inc. MERCURY REMOVAL IMPROVEMENTS AND ALTERNATIVES Silver Bay, MN Wastewater Treatment Facility Plan ǀ M Page 47
58 in adjusting chemical feed rates and doses as temperatures change and as rainfall changes throughout the year. The preliminary results of the pilot study indicate that mercury removal is possible with the tertiary solids contact clarifiers and chemical addition. However, the pilot study also indicates that mercury removal to below permitted levels is inconsistent and additional treatment is necessary to meet final limits. With inconclusive pilot study results, and with the full-scale pilot study ongoing, it is best to wait until the pilot study is finished before discussing this option. One treatment technology included in this option to aide in mercury removal is adding the tertiary clarifier coves discussed in section four (4) of this report. The clarifier covers are required in this option. Covers over the clarifiers may help improve mercury removal by removing outside environmental factors, such as rainfall induced mercury discussed earlier, and providing more control over chemical feed doses and wastewater temperatures. If this option is not selected, there is still value in optimizing the existing tertiary solids contact clarifiers with the addition of covers and chemical addition for additional mercury and TSS removal prior to a tertiary treatment system. Part of the recommendation of the Phase I report attached in Appendix H was to extend the duration of the pilot study into June of 2017 to cover a range of seasonal conditions to see if the clarifiers are able to sustain mercury removal. If it is determined that by the end of the pilot study that an optimum chemical feed and operation process is found, and the tertiary clarifiers can remove mercury to below permitted limits, then this Facility Plan may be amended with a report stating that the tertiary solids contact clarifiers will be the primary mercury removal technology used at the Silver Bay WWTF and additional tertiary treatment will not be required. 2. Construct Tertiary Treatment Facilities with Media Filters While enhancing the existing tertiary solids contact clarifiers may be able to remove additional mercury, it is unlikely that it will have the ability to remove the mercury down to the final discharge limits. Therefore, it is likely that tertiary treatment of the effluent will be required. Based on evaluation of the available data, focusing treatment on additional solids removal is recommended. In particular, a filtration system is a viable treatment alternative. Such a system would be installed after the tertiary clarifiers. This option also includes the installation of covers over the tertiary clarifiers as discussed in section four (4) of this report as they prevent external sources of mercury from rainfall and other environmental sources from entering the wastewater. A pressure or gravity multimedia filtration system has been used for polishing effluent at other wastewater treatment facilities and has been effective to capture solids not removed by upstream clarifiers. In additional to filtration, it is likely that chemical addition may be required to consistently meet the final effluent mercury limits. Chemical addition is currently in operation in the tertiary clarifiers and would be key to sustaining low mercury levels. The current pilot study will provide key details on chemical addition to optimize solids and mercury removal in the tertiary clarifiers. Prepared by: Bolton & Menk, Inc. MERCURY REMOVAL IMPROVEMENTS AND ALTERNATIVES Silver Bay, MN Wastewater Treatment Facility Plan ǀ M Page 48
59 Based on these assumptions, a conceptual design for a tertiary filtration system was developed. The intent of this conceptual design is to provide a basis for the preparation of AACE, Class 5 level budgetary costs for planning purposes. This conceptual design would need to be validated after additional data has been collected and reviewed. The proposed tertiary treatment facility would consist of the following major components, which are described, in more detail below. It is important to note that if the results of the current pilot study show that solids contact clarification, with chemical addition, are feasible and remove mercury down to below permitted limits, utilizing the tertiary clarifiers, as the primary mercury removal treatment method may be recommended in an amendment to this Facility Plan. The sizing of the filtration units is based on treating a peak hourly wet weather (PHWW) flow of 3.48 MGD. The tertiary treatment system with media filters will include: Multimedia filter influent pump station Multimedia filters Backwash water pump station Backwash water supply A multimedia filter influent pump station with redundant pumping would be needed to feed the multimedia filters. This pump station would likely have 4 wastewater pumps with discharge piping and valves to allow for flexibility in operation. Gravity filtration will provide the most economical long-term solution for a filtration system. The flux rate target for mercury removal through a gravity filter is 4-6 gpm/ft 2. Using the conservative rate to allow for unknowns, the total filter area for 4 6 gravity filters would be approximately 605 square feet. The range of the number of filters allows for flexibility during design regarding filter size and available space on-site. More filters will require more space, but reduces the size of each filter. Backwash rates for this filter option would be approximately gpm/ft 2 for minutes. This is a typical range for the backwash rate for gravity filters. Chlorine will be added prior to the filters to prevent biological growth within the filter media, unless a sufficient residual is carried through the tertiary solids contact clarifiers. Dechlorination would be moved to after the filtration system. A backwash water pump station would provide a means to pump backwash water to the head of the plant for re-treatment. It is assumed the solids in the backwash water would settle out in the primary clarifiers, so treatment of this water is proposed. A duplex submersible pump station is proposed for this unit. To minimize pump sizes, which would help reduce capital costs, it is assumed the wet well will have a volume in the range of 10,000 to 15,000 gallons for this unit. Process controls will allow the backwash water to be pumped back to the head of the treatment plant during a backwash cycle as to not overflow the backwash waste pump station. This operation minimizes the size required for the pump station and reduces capital costs. Backwash water supply would consist of a tank/reservoir with pumps to collect treated effluent from the multimedia filters for use in backwashing the filters. This unit would Prepared by: Bolton & Menk, Inc. MERCURY REMOVAL IMPROVEMENTS AND ALTERNATIVES Silver Bay, MN Wastewater Treatment Facility Plan ǀ M Page 49
60 likely consist of a wet well with multiple pumps to meet the backwash rates and volumes needed for the filters described above. To ensure enough water is available for backwashing one filter per day, a tank with a volume in the range of 50,000 to 60,000 gallons is required for backwashing. In order to backwash two filters per day, a tank with a volume in the range of 80,000 to 100,000 gallons is required. The footprint of these tanks can vary depending on the desired water depth in the tank. To prevent biological growth in the backwash water supply tank/reservoir, chlorine could be added after filtration to maintain a sufficient residual in the reservoir. Dechlorination would occur as the water leaves the reservoir prior to discharge. Typical chemicals for dechlorination are sodium bisulfate and sulfur dioxide. Since dechlorination is typically a fast reaction, in the order of seconds, this could be done in a small mixing chamber as the water leaves the reservoir. 3. Construct Tertiary Treatment Facilities with Membrane Filters Another filtration option that can be used to remove mercury is membrane filtration. Membrane filtration removes nearly all non-soluble contaminants. Therefore very low CBOD and TSS limits are capable of being met. By removing high levels of TSS, high levels of mercury removal may be possible with membrane filtration. Membranes are available in a range of pore sizes. Typical wastewater applications utilize microfiltration (MF), which removes solids in the to 10 µm range. Ultrafiltration (UF) removes solids to a much smaller size and macromolecules with molecular weights of 1,000 to 1,000,000. Membrane filtration systems also remove most bacteria. A membrane system draws water from a tank through numerous membrane tubes assembled into cassettes. The cassettes are installed in steel or concrete tanks. The permeate, or effluent, pumps draw water through the membranes under a vacuum. These pumps are sized for peak hourly wet weather flow. The treated water flows from the permeate skid to a disinfection chamber. The reject stream is returned to the head of the plant or intermediate point in the process for further treatment. The membranes are cleaned by reversing the permeate pumps to reverse the direction of flow through the membrane in conjunction with periodic chemical cleaning. It is important to have an efficient clarification process upstream as high solids entering the membrane filters can cause membrane fouling which may lead to replacing membranes often and increases maintenance required. To help prevent outside mercury contamination from rainfall, the tertiary clarifier covers discussed in section four (4) are required with this alternative. Membrane filtration is a feasible option for mercury removal treatment. However, capital costs and operations costs are generally higher than that for gravity media filters. VARIANCE FOR MERCURY COMPLIANCE The alternatives above are all feasible options that will reduce effluent mercury levels at the WWTF. The NPDES permit has a deadline where the facility must achieve the final limits. This date is March 31, If the facility can meet and sustain mercury levels to below Prepared by: Bolton & Menk, Inc. MERCURY REMOVAL IMPROVEMENTS AND ALTERNATIVES Silver Bay, MN Wastewater Treatment Facility Plan ǀ M Page 50
61 permitted limits before this date, the MPCA must be notified in writing that compliance has been achieved. However, circumstances may prevent the selected treatment option from meeting final limits by the deadline. This instance may warrant an extension for meeting the deadline to achieve final limits. This can be achieved through a variance. A variance is essentially an extended compliance date. The City would still be required to reduce effluent mercury to try to meet final limits and provide annual updates on these efforts. A variance typically is good for five (5) years and is renewable if the conditions prohibiting mercury treatment still exist. A variance is not common and requires MPCA and Environmental Protection Agency (EPA) approval. A variance is an option that may be considered if it can be proven that a treatment alternative will require sufficient time beyond the required date in the NPDES permit to meet final mercury limits, or if environmental conditions make low level mercury removal difficult. Prepared by: Bolton & Menk, Inc. MERCURY REMOVAL IMPROVEMENTS AND ALTERNATIVES Silver Bay, MN Wastewater Treatment Facility Plan ǀ M Page 51
62
63 6. OPINION OF PROBABLE COSTS AND FUNDING GENERAL This section presents cost opinions for the Wastewater Treatment Facility improvement alternatives presented in Section four (4) and five (5). The alternatives in section four (4) are included with each alternative in section five (5). Costs were developed primarily through the use of contractor pay estimates of recent projects with similar scopes of work. The cost opinions presented herein are meant to be used as a guideline in the decision-making process. The accuracy of these cost opinions should be considered within +/- 25% of actual project costs. If the City decides to move forward with one of the proposed alternatives, a more refined cost estimate of the selected alternative will be available during the design phase of the actual selected project. CAPITAL COSTS The opinion of costs for mercury removal alternatives 1, 2, and 3 from section five (5) are presented in Table 6.1 including engineering, construction observation, and administration. Again, it is important to note that all of the preliminary treatment items discussed in section four (4) are included with each mercury removal option in section five (5). Prepared by: Bolton & Menk, Inc. OPINION OF PROBABLE COSTS AND FUNDING Silver Bay, MN Wastewater Treatment Facility Plan ǀ M Page 52
64 Item Table 6.1 Capital Cost Opinion City of Silver Bay, Minnesota Alternative No. 1 - Alternative No. 2 - Enhance Solid Add Tertiary Gravity Contact Clarifiers Filters Alternative No. 3 - Add Tertiary Membrane Filters General General/Mobilization $100,000 $245,000 $275,000 Site Improvements/Earthwork $250,000 $250,000 $250,000 Preliminary Treatment and Misc. Improvements Demo Existing Pre-Treatment Building $30,000 $30,000 $30,000 Fine Screen Equipment $100,000 $100,000 $100,000 Grit Removal Equipment $175,000 $175,000 $175,000 Construction of Pre-treatment Building $450,000 $450,000 $450,000 Pumps/Piping/Valves $350,000 $350,000 $350,000 Digester Equipment $200,000 $200,000 $200,000 HVAC $100,000 $100,000 $100,000 Electrical and Controls $275,000 $275,000 $275,000 Mercury Treatment Improvements Clarifier Covers $400,000 $400,000 $400,000 New Tertiary Filtration Building N/A $1,000,000 $1,000,000 Filter Construction/Installation N/A $400,000 $450,000 Filter Equipment (Membranes) N/A N/A $600,000 Filter Media/underdrain system N/A $150,000 N/A Backwash supply tank N/A $150,000 $150,000 Backwash waste pump station (15,000 gallons) N/A $50,000 $50,000 Lift/Pump Station N/A $250,000 $250,000 Pumps/Piping/Valves N/A $400,000 $400,000 Chemical Equipment $30,000 $40,000 $90,000 Electrical and Controls $65,000 $550,000 $660,000 Subtotal $2,525,000 $5,565,000 $6,255,000 Contingencies (10%) $255,000 $560,000 $625,000 Engineering/Administration/Legal (15%) $380,000 $835,000 $940,000 TOTAL $3,160,000 $6,960,000 $7,820,000 OPERATIONS AN MAINTENANCE The estimated annual operational costs include labor utilities, chemicals and other non-capital related expenditures. The staff time necessary to any of the mechanical wastewater treatment facility alternatives averages 20 hours per week. This includes daily visits for process control. Energy costs are associated with the pumps, mechanical equipment, and chemical feed equipment operating in the processes. Some of these pieces of equipment run 24 hours a day. Prepared by: Bolton & Menk, Inc. OPINION OF PROBABLE COSTS AND FUNDING Silver Bay, MN Wastewater Treatment Facility Plan ǀ M Page 53
65 Electrical costs are assumed to be $0.10 per kilowatt hour. Electrical costs associated with alternative 1, are based on current use of the mixers and chemical feed. Chemicals are used to achieve the desired total mercury limit by using an alum and polymer combination prior to a filtration system. It is assumed that with each alternative, the City will continue operating with the current process of adding alum plus polymer to the tertiary solids contact clarifiers. Biosolids production will increase with a filtration system, as more solids are captures by the filters and wasted from backwashing. Biosolids from the system will be land applied. The estimated cost for this service is $0.05 per gallon of biosolids at three percent. As equipment is used, it wears out. The City needs to plan for equipment replacement. The table presents an estimated average cost. Alternative 2 and 3 have slightly higher energy costs due to the intermediate pumping station to pump to the filters. Item Table 6.2 Operations, Maintenance, and Replacement Costs City of Silver Bay, Minnesota Alternative No. 1 - Enhance Solid Contact Clarifiers Alternative No. 2 - Add Tertiary Gravity Filters Alternative No. 3 - Add Tertiary Membrane Filters Electrical Cost $ 25,000 $ 35,000 $ 40,000 Repairs and Media/Membrane Replacement $ - $ 15,000 $ 20,000 Labor/Operations Staff $ 25,000 $ 30,000 $ 30,000 Biosolids Costs $ 5,000 $ 10,000 $ 10,000 Chemical Costs $ 10,000 $ 10,000 $ 10,000 Equipment Replacement $ 50,000 $ 50,000 $ 50,000 Annual Operating Cost $ 115,000 $ 150,000 $ 160,000 PRESENT WORTH ANALYSIS Minnesota Rules require the evaluation of alternatives on a present worth basis. Alternative present worth is calculated by assuming a 20-year life cycle and 3% rate of inflation. Table 6.4 is the summary of the present worth analysis. Although alternative 1 has the lowest present worth cost, this alternative might not have the capability to remove mercury to below permitted limits. Therefore, alternative 2 will provide the most economical solution for the City to achieve mercury removal to below permitted limits. Prepared by: Bolton & Menk, Inc. OPINION OF PROBABLE COSTS AND FUNDING Silver Bay, MN Wastewater Treatment Facility Plan ǀ M Page 54
66 Table 6.3 Present Worth Analysis City of Silver Bay, Minnesota Item Alternative No. 1 - Enhance Solid Contact Clarifiers Alternative No. 2 - Add Tertiary Gravity Filters Alternative No. 3 - Add Tertiary Membrane Filters Capital Cost $ 3,160,000 $ 6,960,000 $ 7,820,000 OM & R Annual Costs $ 115,000 $ 150,000 $ 160,000 OM & R Present Worth Cost at 20 years 3% $ 1,710,910 $ 2,231,621 $ 2,380,396 Total Present Worth Cost $ 4,870,910 $ 9,191,621 $ 10,200,396 PROJECT FUNDING It will be important to explore as many options as possible for funding the recommended project. There are several funding options the City of Silver Bay can explore to help finance these improvements: 1. Bonding The City could sell general obligation, local improvement, or revenue bonds in order to raise the capital costs to improve the treatment facility. The proceeds of the bonds would need to be repaid, through either property taxes, assessments, or user charges to the system. 2. Assessment A portion of the capital costs of the project can be assessed to local property owners under Minnesota Statute 429. Using this method, a one-time assessment could be levied and repaid over a period of 10 to 20 years. This cost could help offset some monthly increases in user fees and permit use of general obligation bonding. 3. State Revolving Fund Loan (through the PFA) The Clean Water Revolving Fund (CWRF) loan program was created under the State Revolving Fund (SRF) provisions in the Federal Clean Water Act to provide financial assistance for water pollution control projects. Minnesota s revolving loan program provides loans to municipalities for planning, design, and construction of wastewater treatment projects. The loans are typically for a 20-year period at an interest rate of two to four percent. The loan monies are administered through the Public Facilities Authority. To be eligible for PFA funding, the City must submit this Facilities Plan for review and approval by the Minnesota Pollution Control Agency. Revenue for loan repayment is typically generated by user rates, availability charges, or assessment. In recent years, interest rates have been approximately one percent, and this has proven to be an excellent funding source for this type of project. Prepared by: Bolton & Menk, Inc. OPINION OF PROBABLE COSTS AND FUNDING Silver Bay, MN Wastewater Treatment Facility Plan ǀ M Page 55
67 4. Rural Development (RD) Loan The City may be eligible to secure a loan or grant through the USDA Office of Rural Development to help finance wastewater system improvements. Repayment could be through an increase in local property tax rates, user fees, or assessments. A portion of the project costs may be eligible for grant funding as a part of this program depending on the economic status of the residents in the City. In order to be considered for Rural Development monies, a Preliminary Engineering Report (PER) must be completed and submitted to RD. This provides specific treatment and financial information for RD to consider. Rural Development uses an Equivalent Dwelling Unit (EDU) calculation for assisting in determining the amount and type of funding for which a community is eligible. Rural Development financing is a 40-year term. While this term is favorable from an annual cost basis, typically, wastewater facilities require a significant upgrade after 20 or 30 years. Since the life expectancy of the facility is shorter than the loan term, it is generally not advisable to consider paying for wastewater treatment facilities with this method. Additionally, the interest rate on this type of loan has typically been higher when compared to the CWRF. 5. Small Cities Development Program The Small Cities Development Program provides federal grants from the US Department of Housing and Urban Development (HUD) to local units of the government on a competitive basis for a variety of community development projects. Eligible applicants include cities and townships with populations under 50,000 and counties with populations under 200,000. The proposed project must meet one of the three national objectives: 1. Benefit to low and moderate low-income persons 2. Elimination of slum and blight conditions; or 3. Elimination of an urgent threat to public health or safety. In addition, the proposed activities must be eligible for funding, project needs must be documented, and the public must be involved in the application preparation. Under this program, Small Cities Development Public Facility grants are available for wastewater treatment projects, including collection systems and treatment plants; fresh water projects, including wells, water towers, and distribution systems; storm sewer projects; flood control projects; and occasionally street projects. The maximum grant award for Public Facility project is $600, Wastewater Infrastructure Funding Program Supplemental assistance to municipalities is currently available through the wastewater infrastructure (WIF) program. The Public Facilities Authority (PFA) administers the WIF program to those communities what are applying for funding under the clean Prepared by: Bolton & Menk, Inc. OPINION OF PROBABLE COSTS AND FUNDING Silver Bay, MN Wastewater Treatment Facility Plan ǀ M Page 56
68 water revolving fund loan program or the United States Department of Agriculture Rural Economic and Community Development s (USDA/RECD) Water and Waste Disposal Loans and Grants Program. Assistance is in the form of zero percent loans, which may be forgiven upon receipt of the notice from MPCA that the project operational performance standards have been met. This program is income based. The City of Silver Bay s median household income (MHI) is $41,439 ( estimation by American Community Survey). The project cost with O&M would need to exceed 1.4% of the MHI. This is potential that this funding source may apply. 7. Economic Development Administration The Economic Development Administration (EDA) has a grant program, which is used to help communities develop the infrastructure required to attract or maintain businesses or industries. Grant sizes vary depending upon the community s need and the impact the project would have on the community. If the City of Silver Bay expects to get an industry that provides jobs to its residents and has wastewater treatment need, the City may be eligible for an EDA Grant, or by leveraging existing industries, it could also be eligible. 8. Point Source Implementation Grant The Point Source Implementation Grant (PSIG) is a grant program to assist and encourage communities to make infrastructure improvements in order to comply with new stringent NPDES permit limits, such as TMDL waste load requirements, phosphorus reduction requirements, and water quality based effluent limits. The program is funded through the Clean Water Legacy Program and is competitive based on scoring from the MPCA under the same criteria as the CWRF. The grant program provides 50% grant on eligible portions of the project up to a maximum of $3 million dollars. The Regulatory Certainty program for voluntary compliance of TN of 10 mg/l and TP of 1 mg/l for nutrient removal at wastewater treatment facilities is part of the Point Source Implementation Grant program and therefore, is eligible for a grant under the PSIG program. 9. Iron Range Resources and Rehabilitation Board Iron Range Resources and Rehabilitation Board (IRRRB) is a State of Minnesota development agency whose mission is to promote and invest in business, community, and workforce development for the betterment of northeastern Minnesota. A variety of grants are available to local units of government that promote workforce development and sustainable communities. Grants will require a 1:1 match of City funds and have historically been awarded with a maximum grant of $350,000. This funding source could be possible for these improvements. Prepared by: Bolton & Menk, Inc. OPINION OF PROBABLE COSTS AND FUNDING Silver Bay, MN Wastewater Treatment Facility Plan ǀ M Page 57
69 7. RECOMMENDATIONS AND IMPLEMENTATION RECOMMENDED IMPROVEMENTS Based on the evaluation of alternatives and their respective costs presented in Sections four (4) and five (5), it is recommended that the City of select option No. 2 Construct Tertiary Gravity Filters with improvements to the preliminary treatment facilities and addition of clarifier covers. These improvements will greatly improve the treatment performance at the WWTF and provide needed improvements to reduce mercury to comply with permitted limits. IMPLEMENTATION SCHEDULE The proposed implementation schedule for the recommended project is presented in Table 7.1. Table 7.1 Project Implementation Schedule - City of Silver Bay Item Date Review with City / Finalize Report March 2017 Submit Funding Applications and Facility Plan to MPCA March 6, 2017 (no later) Public Hearing / Council Approval of Facility Plan March 2017 Design Period July 2017 January 2018 Submit Plans and Specifications to MPCA March 2018 Advertise to Receive Construction Bids April June 2018 Begin Construction September 2018 Submit Construction Progress Report September 2019 Finish Construction and Initiate New Facilities Gain Compliance with Mercury Limit* March 1, 2020 (no later) March 31, 2020 (no later) *Must meet final limits by this date. If the facility is able to meet final limits before this date, the MPCA must be notified in writing. SUMMARY AND RECOMMENDATIONS ON OTHER WASTEWATER ISSUES Infiltration & Inflow Reduction Over the past several years, the City has been proactive in replacing defective sewer infrastructure in order to reduce issues with I&I. Moving forward, it is recommended that the City continue this infrastructure improvements program in order to further reduce I&I. By attacking the source of the issue, the City will not need to consider expanding their wastewater treatment facility in order to handle excess flows. Prepared by: Bolton & Menk, Inc. RECOMMENDATIONS AND IMPLEMENTATION Silver Bay, MN Wastewater Treatment Facility Plan ǀ M Page 58
70
71 Appendix A: Silver Bay Wastewater Treatment Facility NPDES/SDS Discharge Permit
72
73
74
75
76
77
78
79
80
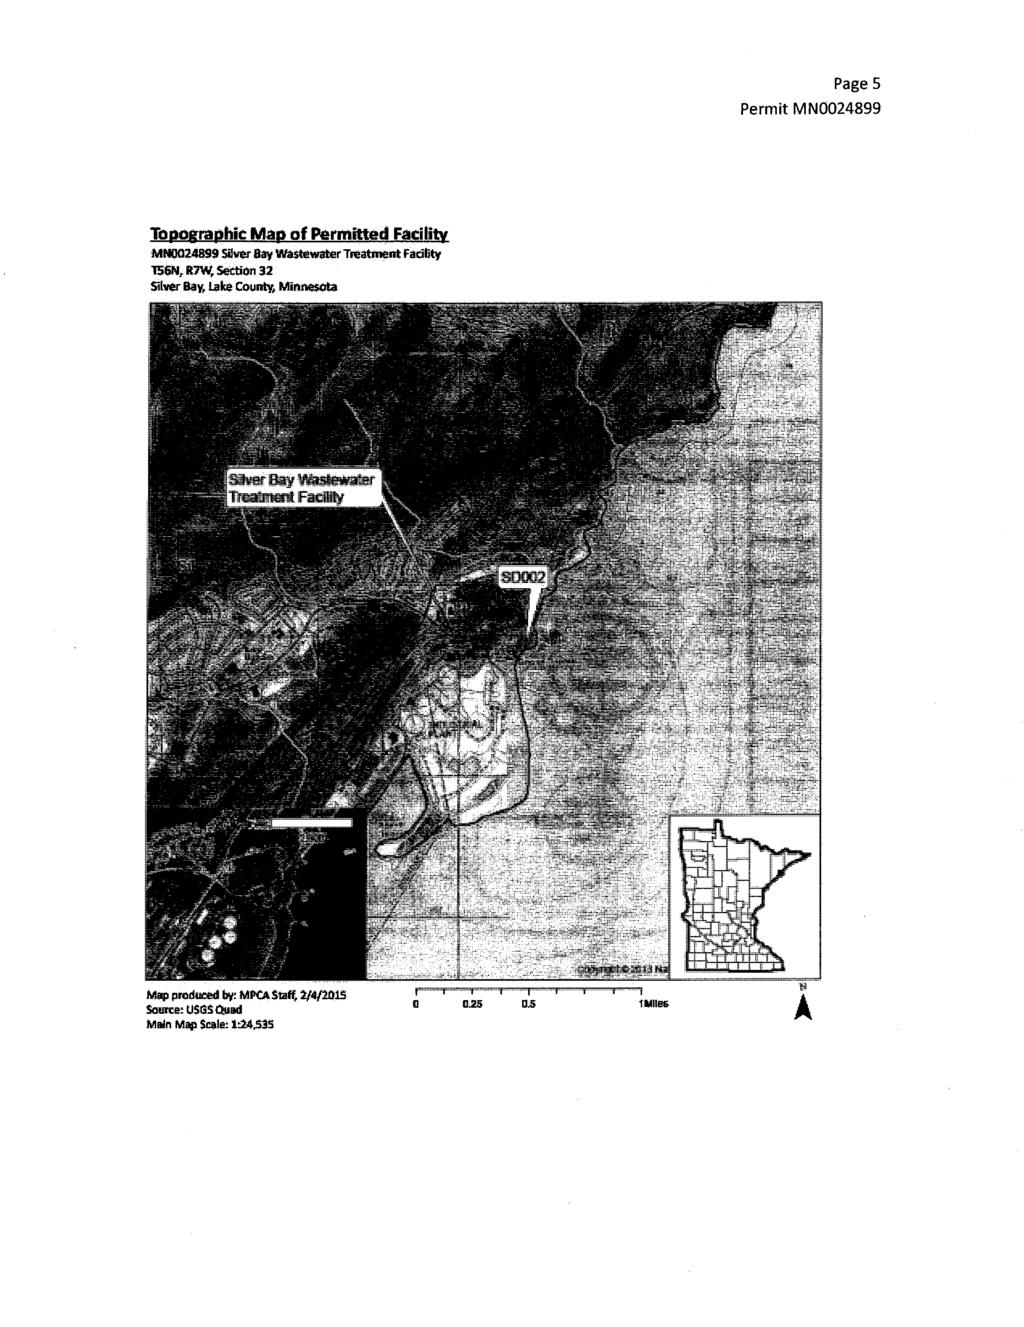
81
82
83
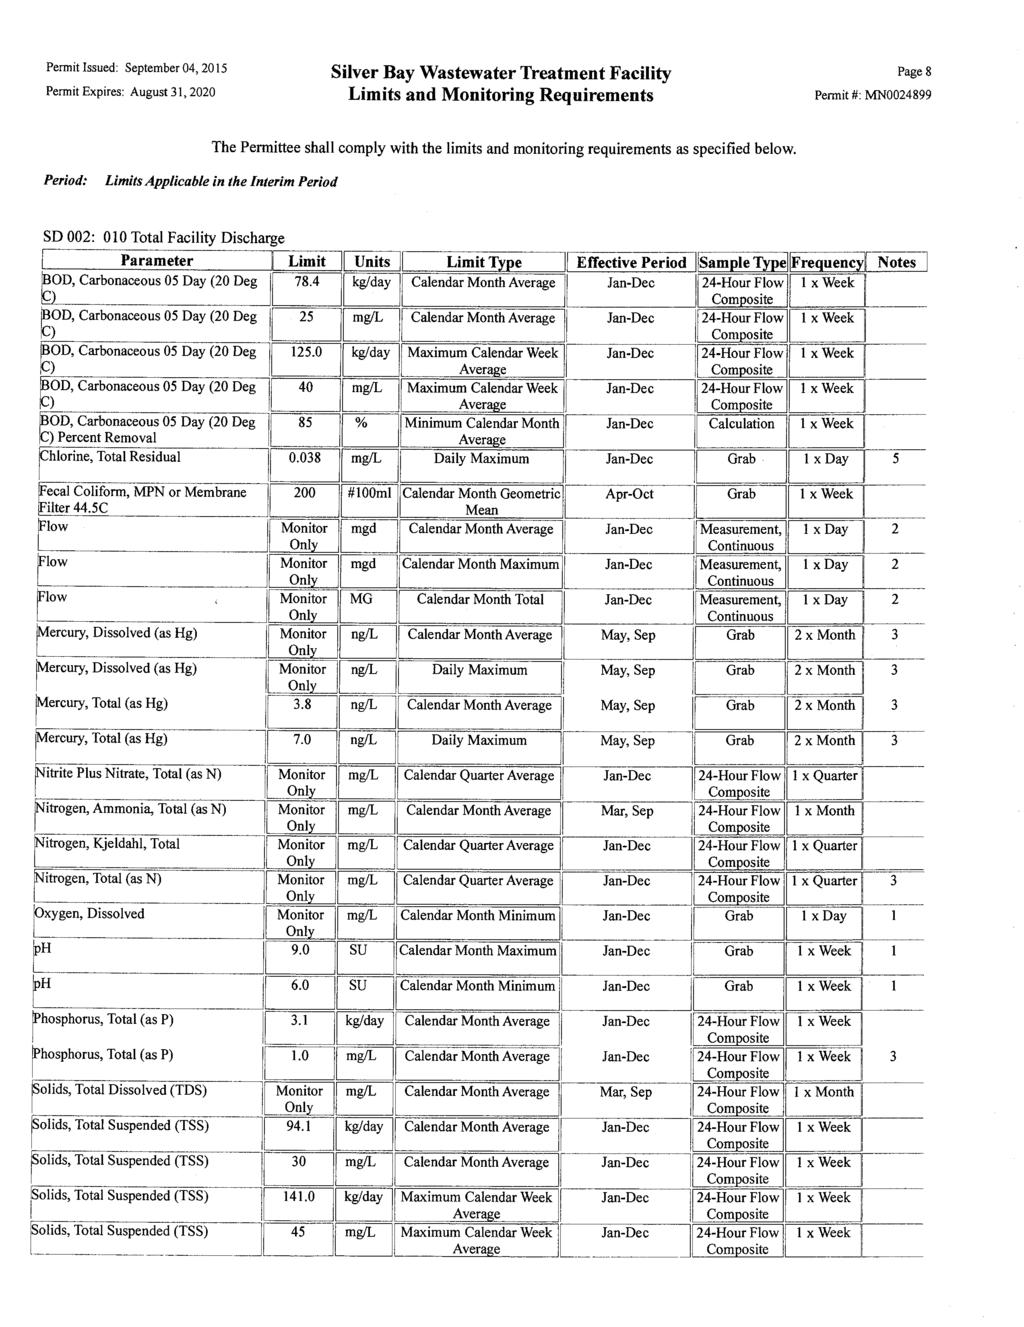
84

85

86
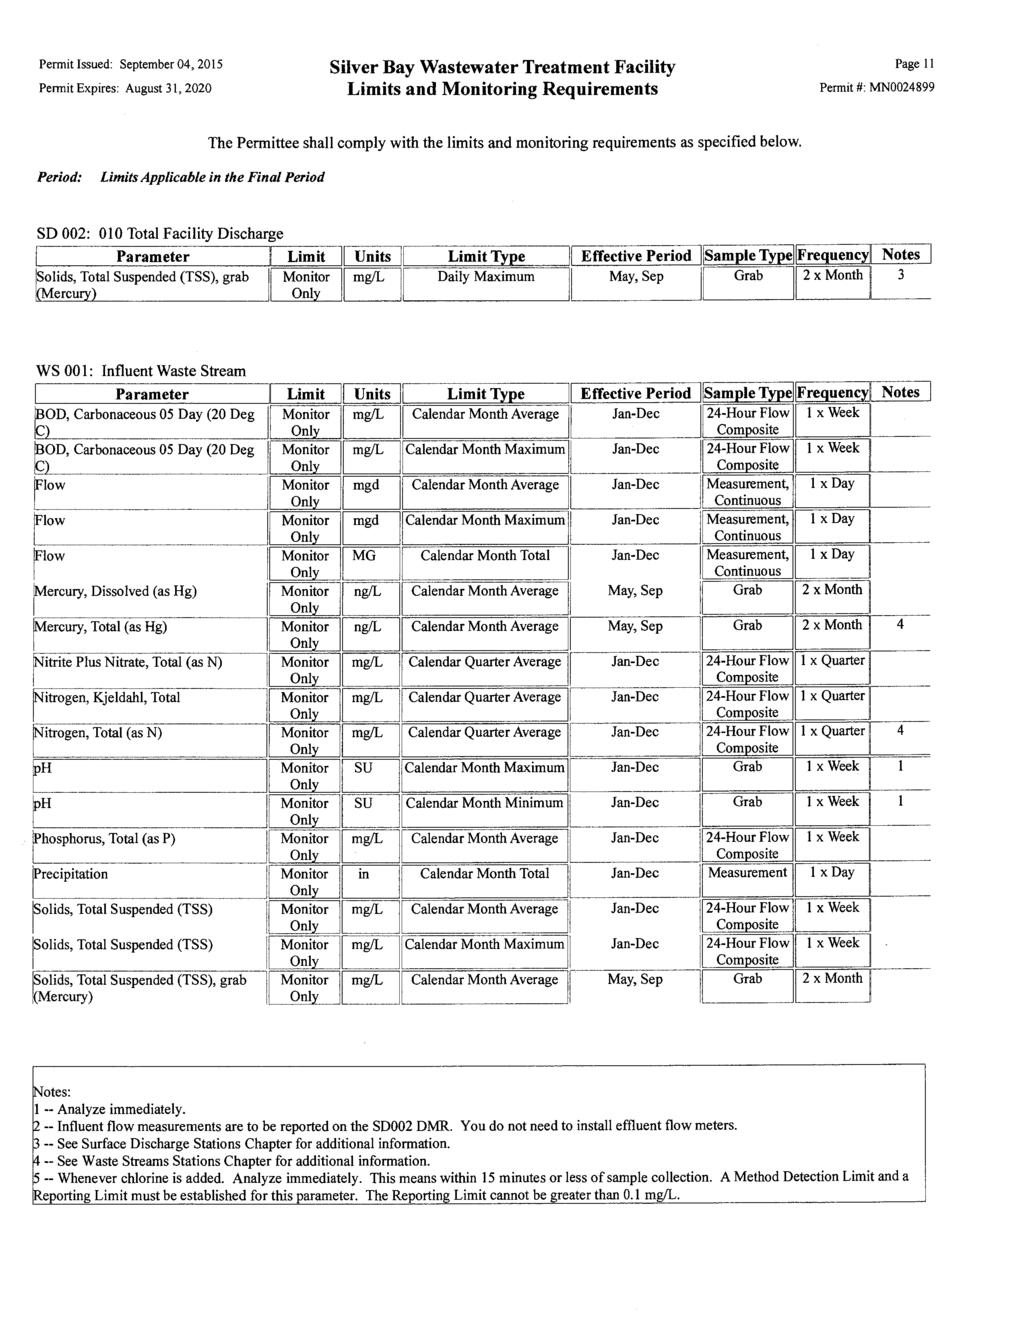
87
88
89
90
91
92
93
94
95
96
97
98
99
100
101
102
103
104
105
106
107
108
109
110
111
112
113 Appendix B: Public Hearing Presentation Material, Notice and Publication, and Comments* *The public hearing presentation will be submitted at a later date after the public hearing.
114
115 Appendix C: Signed Resolution Adopting Facility Plan* *The signed resolution will be submitted at a later date after the City Council Meeting to approve the Facility Plan.
116
117 Appendix D: SERP Mailing List
118
 will use to public notice the Environmental Summary or other")
119 State Environmental Review Process (SERP) Mailing List Form Clean Water State Revolving Fund Program Minnesota Rules , subp. 2.a.A. Minnesota Rules , subp. 3.B. Doc Type: Wastewater Point Source Instructions: This is the complete mailing list that the Minnesota Pollution Control Agency (MPCA) will use to public notice the Environmental Summary or other environmental review documents. Please type names and addresses on this form and return to the MPCA staff engineer. This list should be considered minimum. If a more substantial mailing list is available for the Public Participation Program, it should be added to this mailing list. Please return this mailing list in MS Word format only. Example address blocks: The Honorable Mark Anderson Minnesota State Senator 135 State Office Building St. Paul, MN Marv Johnson, City Administrator City of Willmar 236 Oriole Avenue Willmar, MN Municipality name: City of Silver Bay Project number: Contact name: John Graupman Phone number: (person completing the form) Public notice address information 1. The Honorable State Senator: 6. City Administrator/Clerk: Thomas Bakk Capital Office 95 University Avenue W. Minnesota Senate Bldg., Room 2221 St. Paul, MN Lana Fralich City Hall 7 Davis Drive Silver Bay, MN The Honorable State Representative: 7. Engineering Consultant: Rob Ecklund 311 State Office Building 100 Rev. Dr. Martin Luther King Jr. Blvd. St. Paul, MN John Graupman Bolton & Menk, Inc Premier Drive Mankato, MN The Honorable County Board Chair: 8. County Planning and Zoning Office: Richard Hogenson rd Ave Two Harbors, MN Lake County Environmental Services/Planning & Zoning rd Avenue Two Harbors, MN The Honorable Mayor: 9. Watershed District (if established): Scott Johnson City Hall 7 Davis Drive Silver Bay, MN Dan Schutte (District Manager) rd Avenue Two Harbors, MN Township Board Clerk:* 10. Regional Development Commission: *Include if any portion of the project (including the facility, interceptor, influent or outfall lines) will be located in the township(s) Use your preferred relay service Available in alternative formats wq-wwtp2-16 2/8/16 Page 1 of 4
120 To add rows, place your cursor in the last row of the second column and hit tab. Interested citizens: Interested groups: (i.e., homeowners associations, environmental, business, civic, etc., organizations) Use your preferred relay service Available in alternative formats wq-wwtp2-16 2/8/16 Page 2 of 4
121 To add rows, place your cursor in the last row of the second column and hit tab. Property owners: Property owner list should include all property owners of the site to be, or which has been previously acquired. For pond systems, include the property owner(s) of the pond site, spray irrigation site(s) and all property owners of homes within one-fourth mile of the pond site and any clusters of homes within one-half mile of the pond site Use your preferred relay service Available in alternative formats wq-wwtp2-16 2/8/16 Page 3 of 4
122 Federal agencies: ATTN: Field Supervisor U.S. Fish and Wildlife Service Twin Cities Field Office 4101 American Boulevard East Bloomington, MN ATTN: Environmental Compliance Chief U.S. Army Corps of Engineers St. Paul District 180 Fifth Street East, Suite 700 St. Paul, MN ATTN: Regional Environmental Officer Federal Emergency Management Agency Region V Office 536 South Clark Street, 6 th Floor Chicago, IL State agencies: ATTN: Environmental Review Supervisor MN Department of Natural Resources Division of Ecological and Water Resources 500 Lafayette Road, Box 25 St. Paul, MN ATTN: Manager of Government Programs and Compliance MN Historical Society Minnesota Historic Preservation Office 345 West Kellogg Boulevard St. Paul, MN ATTN: Cultural Resource Director MN Indian Affairs Council 161 St. Anthony Avenue, Suite 919 St. Paul, MN MPCA regional office(s): Use your preferred relay service Available in alternative formats wq-wwtp2-16 2/8/16 Page 4 of 4
123 Appendix E: Preliminary Effluent Limit Request
124
125 Preliminary Effluent Limit Review Request EAO Effluent Limits Unit Doc Type: Effluent Limit Standards Review Purpose: This form is required for all preliminary effluent limit requests for: 1) new facilities with a surface water discharge; 2) where the design flow, outfall location, or quality of the effluent is changing for an existing facility with a surface water discharge; or 3) changes to treatment type that would impact quality of the effluent. Complete application by typing or printing in black ink. Instructions on page 3. MN MPCA Use Only Application number Date received Contact Information 1. Engineer or consultant or requester Employer/Company: Bolton & Menk, Inc. Name: John Graupman Title: Principal Environmental Engineer Mailing address: 1960 Premier Drive City: Mankato State: MN Zip code: Phone: Fax: johngr@bolton-menk.com 2. Permittee or Facility Name: Silver Bay Wastewater Treatment Plant County: Lake City: Silver Bay State: MN Zip code: NPDES/SDS Permit #: MN (complete only for existing permitted facilities) Address of facility (if known): Facility Information (If more space is needed, attach additional page(s) to the request.) 3. Reason for request: (Describe in detail: design flow, outfall locations, and/or changes to treatment type impacting the quality of the effluent.) Design flows may increase above current design flows. AWW design flow will not change from previous design. The facility discharges to Lake Superior. 4. Identify design flows and waste flow type for the proposed facility: See the Minnesota Pollution Control Agency (MPCA) website regarding Design Flow and Loading Determination Guidelines for Wastewater Treatment Plants at: For domestic wastewater facilities only Average Wet Weather Design Flow: mgd (million gallons/day) Average Dry Weather Design Flow: mgd (million gallons/day) Waste Flow Type: Continuous Controlled For industrial and other wastewater facilities only Maximum Daily Design Flow: Average Daily Design Flow: mgd (million gallons/day) mgd (million gallons/day) Waste Flow Type: Continuous Controlled Periodic/Seasonal Intermittent Waste flow type: A description of the discharge type Continuous: Continuous, year-round discharge where flows occur without interruption throughout operating hours of the facility, except for infrequent shutdowns for maintenance, process changes, or other similar activities (40 CFR 122.2). Most domestic mechanical facilities are considered to have continuous discharges. Controlled: Discharge permitted during pre-defined periods or windows which are generally during periods of higher receiving water flow and lower temperatures. For northern MN [MPCA regions I, II, III] these periods are 3/1-6/30 and 9/1-12/31. For southern MN [MPCA regions IV, V, Metro] these periods are 3/1-6/15 and 9/15-12/31. These discharges are almost exclusively stabilization ponds with controlled discharges in spring and fall. Intermittent: Discharge that occurs sometimes, but not regularly (40CFR pt.122). Intermittent discharges occur infrequently and/or for short durations. Examples include water treatment plants with backwash discharge such as once every ten days or a few hours every week, and stormwater detention ponds with discharges that are precipitation dependent. Periodic/Seasonal: Discharge that occurs regularly, but is not continuous all year, where discharge is intentional at specified times following treatment (e.g., monthly or seasonally) and of longer duration, as opposed to the short duration of intermittent discharges (40CFR 122). Examples include canning facilities that discharge process wastewater continuously during packing season (May-Sep or other months) and quarries and gravel mining operations. This excludes stabilization ponds with pre-defined discharge periods or windows TTY or Available in alternative formats wq-wwprm7-47 1/22/2013 Page 1 of 3
126 5. Facility description: (Provide a description of the proposed wastewater treatment facility, including the type of treatment units.) Manual bar screen, grit chamber, comminuter, primary clarifiers, trickling filter, secondary clarification, disinfection (chlorination/dechlorination), tertiary solids contact clarifiers, heated anaerobic digesters. 6. Wetland impacts: (For new or expanded discharges, will construction or operation of the proposed facility result in wetland filling, drainage, excavation, or permanent inundation?) Yes No If yes, please provide the following information: a. Location of impacted wetland: b. Acreage of impacted wetland: c. Wetland type/classification: (See U.S. Fish and Wildlife Service National Wetlands Inventory at 7. Is the facility located on tribal land? Yes No If yes, also contact U.S. Environmental Protection Agency (EPA) Region V, John Coletti Identify all wastewater facility locations for which preliminary effluent limits are requested: County: Lake City/Township: Silver bay Township Range Section ¼ Section ¼ of ¼ Section (26-71 or ) (1-51) (1-36) (NW, NE, SW, SE) (NW, NE, SW, SE) T56 N R7 E W 32 SE NE County: City/Township: Township Range Section ¼ Section ¼ of ¼ Section (26-71 or ) (1-51) (1-36) (NW, NE, SW, SE) (NW, NE, SW, SE) T N R E W County: City/Township: Township Range Section ¼ Section ¼ of ¼ Section (26-71 or ) (1-51) (1-36) (NW, NE, SW, SE) (NW, NE, SW, SE) T N R E W Existing/Proposed Surface Water Discharge 9. Identify all surface water discharge locations for which preliminary effluent limits are requested: Complete the table for each surface water discharge point. If this is an existing facility, refer to the current National Pollutant Discharge Elimination System/State Disposal System (NPDES/SDS) Permit for Station ID. For new facilities, enter as much information as available. If more space is needed for additional stations, attach additional pages. The location of a surface water discharge is defined as the location where a wastewater discharge enters a surface water (not where the pipe leaves the wastewater facility structure). If a pipe extends out into a river or lake, the location is identified where the pipe leaves the shore and enters the body of water. If the discharge is to a tile line or storm sewer the location is identified where the tile line or storm sewer enters a surface water. If the discharge is into an open ditch or ravine, the location is identified as the point where the discharge leaves the pipe and enters the open ditch. Station ID: SD 002 Township (26-71 or ) Range (1-51) Section (1-36) ¼ Section (NW, NE, SW, SE) ¼ of ¼ Section (NW, NE, SW, SE) T50N R7 E W 32 SE NE Latitude Longitude Datum Coordinate Collection Method 47 deg 17' 30"N 91 deg 14' 50" W WGS84 Digitized February 2017 Receiving Water Name: Lake Superior Station ID: SD Township (26-71 or ) Range (1-51) T N R E W Section (1-36) ¼ Section (NW, NE, SW, SE) Latitude Longitude Datum Coordinate Collection Method ¼ of ¼ Section (NW, NE, SW, SE) Receiving Water Name: TTY or Available in alternative formats wq-wwprm7-47 1/22/2013 Page 2 of 3
127 Surface water discharge locations for which preliminary effluent limits are requested - continued: Station ID: SD Township (26-71 or ) Range (1-51) T N R E W Section (1-36) ¼ Section (NW, NE, SW, SE) Latitude Longitude Datum Coordinate Collection Method ¼ of ¼ Section (NW, NE, SW, SE) Receiving Water Name: Attachments Did you attach a map? Attach a map, U.S. Geological Survey topographic map (7.5 minute series) or other map of comparable detail that shows surface water bodies, roads, and other pertinent landmarks. The map should show and label the exact location of the existing or proposed facility, and the location of all existing and proposed wastewater discharge points into receiving waters. Mark and label all surface water discharge locations at the point where the wastewater enters the receiving water. If the discharge is to a tile line or storm sewer, label the tile line or storm sewer and show its flow path to the receiving water. Note: Please ensure this form and all applicable attachments are complete. Please make a copy for your records. Application Fee An application fee is required under Minn. Stat , subd. 4d (1990) and Minn. R. ch (Permit Fee Rules). This application fee must be submitted with the application. The current application fee is $1,550 with the dollar amount determined by point assignments contained in the Permit Fee Rules. Please refer to the application fee table located at: Submittal Requests that are submitted without the required fee and attachments will be returned. Please make your check payable to the Minnesota Pollution Control Agency. Send the completed request, attachments, and check to: Attn: Fiscal Services 6 th floor Minnesota Pollution Control Agency 520 Lafayette Road North St. Paul, MN Contact Information If you have questions or need further assistance, contact Steven Weiss at or Carol Sinden at Effluent Limits Unit, Environmental Analysis and Outcomes Division. Instructions Surface water discharge location example: Station ID: SD 1 Township (26-71 or ) Range (1-51) Section (1-36) ¼ Section (NW, NE, SW, SE) ¼ of ¼ Section (NW, NE, SW, SE) T 109 N R 28 E W 5 NW NW Latitude Longitude Datum Coordinate Collection Method NAD83 DOQ (aerial photo) Receiving Water: County Ditch 4 A datum for latitude/longitude should be specified. For latitude/longitude coordinates, this will either be NAD83 or WGS84 (the default on most GPS units). NAD83 is preferred. For latitude/longitude indicate the method of collection and the date of collection. Methods of collection include: GPS Survey Quality GPS Recreational Receiver WAAS enabled (Real Time Differential Corrected) GPS Recreational Receiver Uncorrected GPS Unknown Digitized Web Map Google / Yahoo / Microsoft Digitized Digital Raster Graph (DRG) (USGS 7.5 min topographic map 1:24,000 scale) Digitized Digital Ortho Quad (DOQ) (USGS aerial photo 1:24,000 scale) TTY or Available in alternative formats wq-wwprm7-47 1/22/2013 Page 3 of 3
128 Wastewater Treatment Facility City of Silver Bay, MN February 2017 CEDA R CREEK RD Map Document: \\METROSOUTH1\gis\SILVERBY_CI_MN\M \ESRI\Maps\113173_Water_Treatment_85x11P.mxd Date Saved: 2/13/2017 9:08:13 AM Beaver Bay Township MILE POST 7 SERVICE GcWX Beaver Bay RD GdWX GOLF COURSE RD LAX LAKE RD HWY 61 MARKS DR H AYS NELSON CIR PENN BLV D DR WEST RD EDISON BLVD DAVISDR BANKS BLVD?ÝA@ R OCKY WAL BURK DR OUTER DR MT ROCKWOOD RD LRD SN OWSHOE TR L ADAMS BLVD INDUSTRIALPRK E LA K EVIEW c( DR Legend R WILLI A M S!I c( Wastewater Treatment Facility City Limits 0 3,000 Feet Source: MnGeo, MnDOT, Google Imagery D
129 Wastewater Treatment Facility City of Silver Bay, MN Project Boundary & Discharge Location February INDUSTRIAL PRK HWY 61 Silver Bay Map Document: \\METROSOUTH1\gis\SILVERBY_CI_MN\M \ESRI\Maps\113173_WWTF_Discharge_85x11P.mxd Date Saved: 2/21/2017 9:49:59 AM E LAKEVIEW DR Beaver Bay Township SD 002 "!;Î Legend "!;Î!I Surface Discharge Project Boundary City Limits Feet Source: MnGeo, MnDOT, Google Imagery
130
131 Appendix F: SHPO Letter
132
133


134 Location Map City of Silver Bay, MN February 2017 Canada Map Document: \\METROSOUTH1\gis\SILVERBY_CI_MN\M \ESRI\Maps\113173_LocationMap_85x11.mxd Date Saved: 2/13/2017 3:30:16 PM Cook County Lake A Lake Superior St. Louis County ^ _? A City of Silver Bay Legend ^ _! I Silver Bay Location State Highway County Highway Lake County Boundary Surrounding Counties Protected Waters - Basin Protected Waters - Watercourse 0 Source: MnGeo, MnDOT 10 Miles Local Road Railroad


135 Wastewater Treatment Facility City of Silver Bay, MN February 2017 CEDA R CREEK RD Map Document: \\METROSOUTH1\gis\SILVERBY_CI_MN\M \ESRI\Maps\113173_Water_Treatment_85x11P.mxd Date Saved: 2/13/2017 9:08:13 AM Beaver Bay Township MILE POST 7 SERVICE GcWX Beaver Bay RD GdWX GOLF COURSE RD LAX LAKE RD HWY 61 MARKS DR H AYS NELSON CIR PENN BLV D DR WEST RD EDISON BLVD DAVISDR BANKS BLVD?ÝA@ R OCKY WAL BURK DR OUTER DR MT ROCKWOOD RD LRD SN OWSHOE TR L ADAMS BLVD INDUSTRIALPRK E LA K EVIEW c( DR Legend R WILLI A M S!I c( Wastewater Treatment Facility City Limits 0 3,000 Feet Source: MnGeo, MnDOT, Google Imagery D

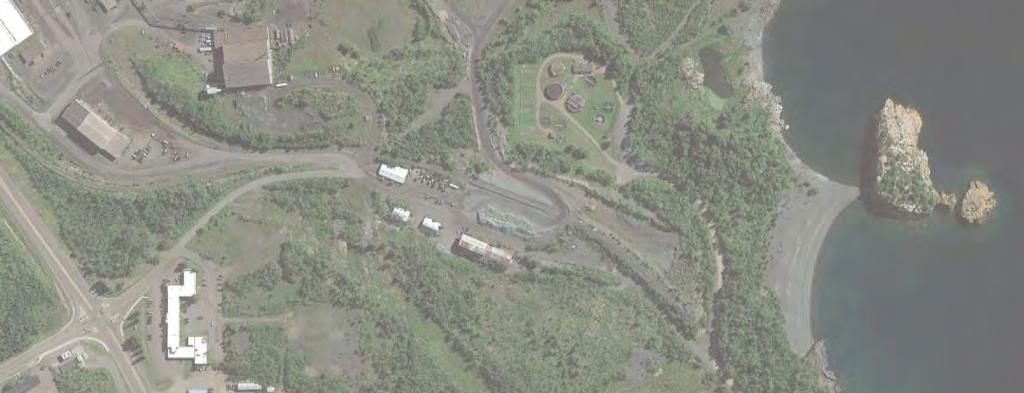

136 Wastewater Treatment Facility City of Silver Bay, MN Project Boundary & Discharge Location February INDUSTRIAL PRK HWY 61 Silver Bay Map Document: \\METROSOUTH1\gis\SILVERBY_CI_MN\M \ESRI\Maps\113173_WWTF_Discharge_85x11P.mxd Date Saved: 2/21/2017 9:49:59 AM E LAKEVIEW DR Beaver Bay Township SD 002 "!;Î Legend "!;Î!I Surface Discharge Project Boundary City Limits Feet Source: MnGeo, MnDOT, Google Imagery
137 Appendix G: Silver Bay Environmental Information Worksheet (EIW)
138
139 Environmental Information Worksheet (EIW) Form Clean Water State Revolving Fund Minnesota Rule Chapter , subp. 2.a.F. Minnesota Rule Chapter , subp. 3.E. Doc Type: Environmental Information Worksheet Eligible applicants seeking funds for clean water (stormwater and wastewater) projects through the Clean Water State Revolving Fund (commonly referred to as the CWSRF Program) are required by Minn. R. ch , subp. 2.a. F. and Minn. R. ch , subp. 3.E., to complete an Environmental Information Worksheet (EIW). This information will be used to assess environmental impacts, if any, caused by the project. For assistance with this worksheet, please visit the Minnesota Pollution Control Agency s website at for detailed instructions on completing this form. 1. Project title: Silver Bay Facility Plan 2. Proposer: City of Silver Bay Contact person: John Graupman Title: Principal Environmental Engineer Address: 1960 Premeir Dr. Mankato, MN Phone: Fax: Project location: County: Lake City/Twp: Silver Bay NE 1/4 SE 1/4 Section: 32 Township: 56N Range: 7W Tables, Figures, and Appendices attached to the EIW: County map showing the general location of the project; United States Geological Survey 7.5 minute, 1:24,000 scale map indicating project boundaries (photocopy acceptable); Site plan showing all significant project and natural features. 4. Description: a. Provide a project summary of 50 words or less. Rehabilitation of the preliminary treatment process at the WWTF and the addition of tertiary filters. b. Give a complete description of the proposed project and related new construction. Attach additional sheets as necessary. Emphasize construction, operation methods and features that will cause physical manipulation of the environment or will produce wastes. Include modifications to existing equipment or industrial processes and significant demolition, removal or remodeling of existing structures. Indicate the timing and duration of construction activities. Rehabilitation of the existing preliminary treatment process including new mechanical fine screen equipment and new vortex grit removal equipment. A new building will be constructed to house the pre-treatment equipment in the same location as the existing grit removal building. The exsiting grit building will be demolished. The existing tertiary soilds contact clarifiers will receive aluminum covers. A new filtration building will be constucted to house filters for mercury removal. No other buildings will be demolished or added. Minor site work is required to accommodate the new buildings and improve site drainage TTY or Available in alternative formats wq-wwtp2-20 8/17/12 Page 1 of 6
140 c. Explain the project purpose; if the project will be carried out by a governmental unit, explain the need for the project and identify its beneficiaries. Become compliant with the effluent mercury limit set in the NPDES permit and to improve preliminary treatment performance. d. Are future stages of this development including development on any outlots planned or likely to happen? Yes No If yes, briefly describe future stages, relationship to present project, timeline and plans for environmental review. e. Is this project a subsequent stage of an earlier project? Yes No If yes, briefly describe the past development, timeline and any past environmental review. 5. Project magnitude data Total Project Area (acres) 3 or Length (miles) NA Number of Residential Units: Unattached NA Attached NA maximum units per building Commercial/Industrial/Institutional Building Area (gross floor space): total square feet Indicate area of specific uses (in square feet): Office NA Manufacturing NA Retail NA Other Industrial NA Warehouse NA Institutional NA Light Industrial NA Agricultural NA Other Commercial (specify) sf Building height Greater than 10' If over 2 stories, compare to heights of nearby buildings 6. Permits and approvals required. List all known local, state and federal permits, approvals and financial assistance for the project. Include modifications of any existing permits, governmental review of plans, and all direct and indirect forms of public financial assistance including bond guarantees, Tax Increment Financing and infrastructure. Unit of government Type of application Status MPCA NPDES Permit Approved MPCA Facility Plan Approval To be submitted Public Facilities Authority Finacial Assistance To be submitted 7. Land use. Describe current and recent past land use and development on the site and on adjacent lands. Discuss project compatibility with adjacent and nearby land uses. Indicate whether any potential conflicts involve environmental matters. Identify any potential environmental hazards due to past site uses, such as soil contamination or abandoned storage tanks, or proximity to nearby hazardous liquid or gas pipelines. The current lake use is City owned property which contains the WWTF. All construction will be conducted within the existing land used for the existing treatment facility. There are no known environmental hazards on or near the project site. 8. Cover types. Estimate the acreage of the site with each of the following cover types before and after development: Before After Before After Types 1-8 wetlands 0 0 Lawn/landscaping Wooded/forest Impervious Surfaces 0 0 Brush/grassland 0 0 Other (describe) 0 0 Cropland 0 0 Total TTY or Available in alternative formats wq-wwtp2-20 8/17/12 Page 2 of 6
141 9. Fish, wildlife, and ecologically sensitive resources. a. Identify fish and wildlife resources and habitats on or near the site and describe how they would be affected by the project. Describe any measures to be taken to minimize or avoid impacts. Not Applicable b. Are any state (endangered or threatened) species, rare plant communities or other sensitive ecological resources such as native prairie habitat, colonial waterbird nesting colonies or regionally rare plant communities on or near the site? Yes No If yes, describe the resource and how it would be affected by the project. Indicate if a site survey of the resources has been conducted and describe the results. If the Minnesota Department of Natural Resources (DNR) Natural Heritage and Nongame Research program has been contacted give the correspondence reference number: Describe measures to minimize or avoid adverse impacts. A review request as been sent to the MN DNR and the review is pending. 10. Physical impacts on water resources. Will the project involve the physical or hydrologic alteration (dredging, filling, stream diversion, outfall structure, diking, and impoundment) of any surface waters such as a lake, pond, wetland, stream or drainage ditch? Yes No If yes, identify water resource affected. Describe alternatives considered and proposed mitigation measures to minimize impacts. Give the DNR Protected Waters Inventory (PWI) number(s) if the water resources affected are on the PWI. 11. Water use. Will the project involve installation or abandonment of any water wells, connection to or changes in any public water supply or appropriation of any ground or surface water (including dewatering)? Yes No If yes, as applicable, give location and purpose of any new wells; public supply affected, changes to be made, and water quantities to be used; the source, duration, quantity and purpose of any appropriations; and unique well numbers and DNR appropriation permit numbers, if known. Identify any existing and new wells on the site map. If there are no wells known on site, explain methodology used to determine. 12. Water-related land use management districts. Does any part of the project involve a shoreland zoning district, a delineated 100-year flood plain, or a state or federally designated wild or scenic river land use district? Yes No If yes, identify the district and discuss project compatibility with district land use restrictions. 13. Water surface use. Will the project change the number or type of watercraft on any water body? Yes No If yes, indicate the current and projected watercraft usage and discuss any potential overcrowding or conflicts with other uses. 14. Erosion and sedimentation. Give the acreage to be graded or excavated and the cubic yards of soil to be moved: 1 Acres: cubic yards. Describe any steep slopes or highly erodible soils and identify them on the site map. Describe any erosion and sedimentation control measures to be used during and after project construction. Best management practices to control erosion and sedimentation will be employed where necessary. 15. Water quality surface-water runoff. a. Compare the quantity and quality of site runoff before and after the project. Describe permanent controls to manage or treat runoff. Describe any storm water pollution prevention plans. The quality and quantity of the site runoff will not change as there is not a signifnicant change in impervious surfaces from this project TTY or Available in alternative formats wq-wwtp2-20 8/17/12 Page 3 of 6
142 b. Identify routes and receiving water bodies for runoff from the site; include major downstream water bodies as well as the immediate receiving waters. Estimate impact runoff on the quality of receiving waters. Site runoff will flow towards Lake Superior. There is no major impact from runoff on the quality of the receiving water since the volume of runoff will not significnly change. 16. Water quality wastewater. a. Describe sources, composition and quantities of all sanitary, municipal and industrial wastewater produced or treated at the site. Silver Bay has domestic wastewater sources. The mining industry managnes the water they dischare and limits it to restroom and shower facilites. The facility expansion will be designed to treat a flow of MGD. b. Describe waste treatment methods or pollution prevention efforts and give estimates of composition after treatment. Identify receiving waters, including major downstream water bodies, and estimate the discharge impact on the quality of receiving waters. If the project involves on-site sewage systems, discuss the suitability of site conditions for such systems. The proposed treatment facility expansion will be designed to remove mercury to below permitted limits. Part of the expansion includes improving preliminary treatment and solids removal. The receiving water body is Lake Superior. c. If wastes will be discharged into a publicly owned treatment facility, identify the facility, describe any pretreatment provisions and discuss the facility s ability to handle the volume and composition of wastes, identifying any improvements necessary. Not applicable d. If the project requires disposal of liquid animal manure, describe disposal technique and location and discuss capacity to handle the volume and composition of manure. Identify any improvements necessary. Describe any required setbacks for land disposal systems. Not Applicable 17. Geologic hazards and soil conditions. a. Approximate depth (in feet) to Groundwater minimum; less than 17' average. Bedrock: minimum; less than 15 average. Describe any of the following geologic site hazards to groundwater and also identify them on the site map: sinkholes, shallow limestone formations or karst conditions. Describe measures to avoid or minimize environmental problems due to any of these hazards. None known b. Describe the soils on the site, giving U.S. Soil Conservation Service (SCS) classifications, if known. Discuss soil granularity and potential for groundwater contamination from wastes or chemicals spread or spilled onto the soils. Discuss any mitigation measures to prevent such contamination. 18. Solid wastes, hazardous wastes, storage tanks. a. Describe types, amounts and compositions of solid or hazardous wastes, including solid animal manure, sludge and ash, produced during construction and operation. Identify method and location of disposal. For projects generating municipal solid waste, indicate if there is a source separation plan; describe how the project will be modified for recycling. If hazardous waste is generated, indicate if there is a hazardous waste minimization plan and routine hazardous waste reduction assessments. Debris and screenings from the raw wastewater will collect in dumpsters and will need to be disposed of in a landfill. Additional solids will be produced from the filters. b. Identify any toxic or hazardous materials to be used or present at the site and identify measures to be used to prevent them from contaminating groundwater. If the use of toxic or hazardous materials will lead to a regulated waste, discharge or emission, discuss any alternatives considered to minimize or eliminate the waste, discharge or emission. Not Applicable c. Indicate the number, location, size and use of any above or below ground tanks to store petroleum products or other materials, except water. Describe any emergency response containment plans. Not Applicable TTY or Available in alternative formats wq-wwtp2-20 8/17/12 Page 4 of 6
143 19. Traffic. Parking spaces added: 0 Existing spaces (if project involves expansion): 3 Estimated total average daily traffic generated: 3-6 trips Estimated maximum peak hour traffic generated (if known) and its timing: Not Applicable Provide an estimate of the impact on traffic congestion affected roads and describe any traffic improvements necessary. If the project is within the Twin Cities metropolitan area, discuss its impact on the regional transportation system. Not Applicable 20. Vehicle-related air emissions. Estimate the effect of the project s traffic generation on air quality, including carbon monoxide levels. Discuss the effect of traffic improvements or other mitigation measures on air quality impacts. Note: If the project involves 500 or more parking spaces, consult Environmental Assessment Worksheet (EAW) Guidelines about whether a detailed air quality analysis is needed. Vehicle related air emissions will increase slightly during construction due to the use of diesel powered equipment. 21. Stationary source air emissions. Describe the type, sources, quantities and compositions of any emissions from stationary sources of air emissions such as boilers, exhaust stacks or fugitive dust sources. Include any hazardous air pollutants (consult EAW Guidelines for a listing), any greenhouse gases (such as carbon dioxide, methane, and nitrous oxides), and ozonedepleting chemicals (chlorofluorocarbons, hydrofluorocarbons, perfluorocarbons or sulfur hexafluoride). Also describe any proposed pollution prevention techniques and proposed air pollution control devices. Describe the impacts on air quality. None 22. Odors, noise, and dust. Will the project generate odors, noise or dust during construction or during operation? Yes No If yes, describe sources, characteristics, duration, quantities or intensity and any proposed measures to mitigate adverse impacts. Also identify locations of nearby sensitive receptors and estimate impacts on them. Discuss potential impacts on human health or quality of life. (Note: fugitive dust generated by operations may be discussed at item 23 instead of here.) Noise will be generated during the construction process but limited to the work hours designated by the City of Silver Bay. Measures to mitigate dust will be applied when appropriate. 23. Nearby resources. Are any of the following resources on or in proximity to the site? Projects should search the State Historic Preservation Office s (SHPO) National Register of Historic Places database by calling *Note: Project proposers must contact the SHPO at Thomas.cinadr@mnhs.org or to request a database review to obtain information on any known historical or archaeological sites in the project area. Include a copy of correspondence with SHPO with the submittal of this EIW form. a. Archaeological, historical, or architectural resources? Yes No b. Prime or unique farmlands or land within an agricultural preserve? Yes No c. Designated parks, recreation areas, or trails? Yes No d. Scenic views and vistas? Yes No e. Other unique resources? Yes No If yes, describe the resource and identify any project-related impacts on the resources. Describe any measures to minimize or avoid adverse impacts. The State HIstoric Preservation Office has been contacted and a review is pending on any historical or archeological sites in the area. 24. Visual impacts. Will the project create adverse visual impacts during construction or operation? Such as glare from intense lights, lights visible in wilderness areas and large visible plumes from cooling towers or exhaust stacks? Yes No If yes, explain. 25. Compatibility with plans and land use regulations. Is the project subject to an adopted local comprehensive plan, land use plan or regulation, or other applicable land use, water, or resource management plan of a local, regional, state or federal agency? Yes No If yes, describe the plan, discuss its compatibility with the project and explain how any conflicts will be resolved. If no, explain. The project will occur at the existing WWTF site. This project is compatible with planned land uses for the project location TTY or Available in alternative formats wq-wwtp2-20 8/17/12 Page 5 of 6
144 26. Impact on infrastructure and public services. Will new or expanded utilities, roads, other infrastructure or public services be required to serve the project? Yes No If yes, describe the new or additional infrastructure or services needed. (Note: any infrastructure that is a connected action with respect to the project must be assessed in the EAW; see EAW Guidelines for details.) 27. Cumulative impacts. Minn. R , subp. 7, item B requires that the RGU consider the cumulative potential effects of related or anticipated future projects when determining the need for an environmental impact statement. Identify any past, present or reasonably foreseeable future projects that may interact with the project described in this EAW in such a way as to cause cumulative impacts. Describe the nature of the cumulative impacts and summarize any other available information relevant to determining whether there is potential for significant environmental effects due to cumulative impacts (or discuss each cumulative impact under appropriate item(s) elsewhere on this form). None 28. Other potential environmental impacts. If the project may cause any adverse environmental impacts not addressed by items 1 to 28, identify and discuss them here, along with any proposed mitigation. Not applicable 29. Summary of issues. List any impacts and issues identified above that may require further investigation before the project is begun. Discuss any alternatives or mitigative measures that have been or may be considered for these impacts and issues, including those that have been or may be ordered as permit conditions. Not applicable TTY or Available in alternative formats wq-wwtp2-20 8/17/12 Page 6 of 6
145 Appendix H: Silver Bay Preliminary Phase I Report
146
147 Phase I Final Report Silver Bay Mercury Removal Full-Scale Pilot Studies BMI Project No. M Submitted by: Bolton & Menk, Inc Sunwood Drive NW Ramsey, MN P: F:
148
149 Certification Phase I Final Report for Silver Bay Mercury Removal Full Scale Pilot Silver Bay, MN BMI Project No. M January 2017 I hereby certify that this plan, specification or report was prepared by me or under my direct supervision, and that I am a duly Licensed Professional Engineer under the laws of the State of Minnesota. By: John Graupman, P.E. License No Date: January 30, 2017 Prepared by: Bolton & Menk, Inc. Silver Bay, MN Phase 1 Mercury Removal Full Scale Pilot Studies ǀ M Certification
150
151 Table of Contents Figures Tables I. Introduction... 1 Background... 1 Purpose of Report... 1 Report Organization... 1 II. WWTF Background... 3 Overview... 3 Solids Contact Clarifiers (Tertiary Clarifiers)... 5 Clarifier Rehabilitation Project... 7 III. Mercury Testing Results and Discussion... 9 Background... 9 Full-Scale Pilot Study Pilot Testing Mercury Sampling Results Operational Processes IV. Recommendations and Conclusions Summary Recommendation and Conclusion Figure 2.1: Silver Bay WWTF Process Schematic... 4 Figure 2.2: Aerial View of Silver Bay WWTF... 5 Figure 2.3: Solids Contact Clarifier No Figure 2.4: Solids Contact Clarifier No Table 3.1 Historical Mercury Data... 9 Table 3.2 Full-Scale Mercury Pilot Data Appendix Appendix A: NPDES Permit Appendix B: Silver Bay Coagulation Study Appendix C: MPCA Alternative Coagulant Approval Request Appendix D: MPCA Alternative Coagulant Approval Letter Appendix E: Letter Detailing Compliance Schedule Delays Appendix F: Phase I Preliminary Report Appendix G: Laboratory Results Prepared by: Bolton & Menk, Inc. Silver Bay, MN Phase 1 Mercury Removal Full Scale Pilot Studies ǀ M Introduction Page i
152
153 I. Introduction Background The City of Silver Bay, MN owns and operates a Wastewater Treatment Facility (WWTF) that discharges into Lake Superior. The WWTF has a current NPDES permit (No. MN ) that was issued on September 4, 2015 and will expire August 31, See Appendix A for a copy of the permit. Within the permit are requirements for mercury monitoring and effluent limits. In accordance with the Great Lakes Initiative, the permit includes both interim and final effluent limits on total mercury. The interim limits are 3.8 nanograms per liter (ng/l) calendar month average and 7.0 ng/l daily maximum. The final limits are 1.9 ng/l calendar month average and 3.5 ng/l daily maximum. The City must comply with the final limits no later than March 31, The permit also includes a monitor only requirement for dissolved mercury and a requirement to collect total suspended solids (TSS) and mercury at the same time. With the limits set by the Minnesota Pollution Control Agency (MPCA) in the City s NPDES permit, the City must evaluate if the WWTF can meet the mercury limits with the current treatment process, or if additional construction is necessary to upgrade the facility for mercury removal. If the study results show that additional mercury treatment is necessary, a Facility Plan must be submitted to the Minnesota Pollution Control Agency (MPCA) by March 6, 2017 detailing options and costs for improving the existing facility to remove mercury to below permitted limits. Purpose of Report The purpose of this report is to evaluate the effectiveness of mercury removal by using the tertiary solids contact clarifiers, coupled with chemcial addition, for sustainable mercury removal below permitted limits set forth in the NPDES permit. The objective of the fullscale pilot study was to sample and evaluate mercury concentrations from the solids contact clarifiers. The report will detail mercury-testing data from the effluent waste stream and provide conclusions and recommendations based on the data. Report Organization This report is organized into four sections: 1. Introduction 2. WWTF Background 3. Mercury Testing Results and Discussion 4. Recommendations and Conclusion Prepared by: Bolton & Menk, Inc. Introduction Silver Bay, MN Phase 1 Mercury Removal Full Scale Pilot Studies ǀ M Page 1
154 This page intentionally left blank Prepared by: Bolton & Menk, Inc. Introduction Silver Bay, MN Phase 1 Mercury Removal Full Scale Pilot Studies ǀ M Page 2
155 II. WWTF Background Overview The City of Silver Bay owns and operates a mechanical wastewater treatment facility that has a continuous discharge to Lake Superior. A process flow schematic and aerial photo of the treatment plant are shown in Figures 2.1 and 2.2, respectively. Pre-treatment processes include a manual bar screen, a high flow diversion structure to bypass the bar screen and grit removal chamber, and a comminuter. Primary treatment includes two primary clarifiers, one 60-foot diameter trickling filter with rock media, and a secondary clarifier. Tertiary treatment was originally constructed to aid in phosphorus removal, using chemical addition, and includes two tertiary solids contact clarifiers. A chlorination/dechlorination unit provides disinfection. Biosolids are processed in two heated anaerobic digesters. The treated wastewater flows through a manhole and finally to the outfall where it is discahrged into Lake Superior. The pilot study results for using the solids contact clarifiers for mercury removal are discussed in section three of this report. Prepared by: Bolton & Menk, Inc. WWTF Background Silver Bay, MN Phase 1 Mercury Removal Full Scale Pilot Studies ǀ M Page 3
156 Figure 2.1: Silver Bay WWTF Process Schematic Prepared by: Bolton & Menk, Inc. WWTF Background Silver Bay, MN Phase 1 Mercury Removal Full Scale Pilot Studies ǀ M Page 4
157 Figure 2.2: Aerial View of Silver Bay WWTF Solids Contact Clarifiers (Tertiary Clarifiers) As discussed earlier in this report, the City has two tertiary clarifiers that were originally designed to reduce effluent phosphorus loads, but are also currently being used to test the effectiveness of reducing mercury levels with chemical addition in a full-scale pilot study. Tertiary clarifier number one was constructed in 1975 and is 40 feet in diameter with a sidewater depth of 11 feet. Four sludge hoppers collect the settled sludge where it is pumped to the anaerobic digesters. A second clarifier was added in 1994 and is 45 feet in diameter with a sidewater depth of 10.8 feet. The second clarifier has a sloped floor that conveys settled sludge to one centralized sludge hopper. Clarifier number one can be seen in Figure 2.3 while clarifier number two is shown in Figure 2.4. Prepared by: Bolton & Menk, Inc. WWTF Background Silver Bay, MN Phase 1 Mercury Removal Full Scale Pilot Studies ǀ M Page 5
158 Figure 2.3: Solids Contact Clarifier No. 1 Figure 2.4: Solids Contact Clarifier No. 2 Prepared by: Bolton & Menk, Inc. WWTF Background Silver Bay, MN Phase 1 Mercury Removal Full Scale Pilot Studies ǀ M Page 6
159 Solids contact clarifiers operate on a similar basis to conventional clarifiers. The overall goal is to remove solids from the wastewater. However, unlike conventional clarifiers, chemical addition, mixing, flocculation, and settling are all done in the clarifier. There are three zones within a solids contact clarifier. The first one is the rapid mix zone where chemicals, such as alum and polymer, are typically added and completely mixed. The second zone is the flocculation zone where chemicals are given time to form flocs heavy enough to settle in the third zone, the settling zone. In the settling zone, flocs produced in the flocculation zone are settled to the bottom of the clarifier and removed in the sludge hopper. Effluent collector troughs with V-notch weirs run from the outside of the clarifier to the center to a main collection trough. The clarifiers act as tertiary treatment since a majority of the treatment for CBOD 5 and total suspended solids (TSS) occurs in the trickling filter and secondary clarifier. However, the tertiary clarifiers are being used to serve a dual purpose to polish the effluent wastewater by removing phosphorus and mercury with chemical addition. 1. Chemical Addition for Pollutant Removal Chemical addition is an effective way at removing pollutants, such as phosphorus or mercury. Alum is typically added in tertiary treatment to destabilize colloidal particles in the water and promote floc formation. The clarifiers allow time for good heavy, fast settling flocs to form and settle. The application point is critical for the effectiveness of alum. Environmental conditions, such as air temperature, wastewater temperature, sun, wind, and ph, can all affect the reaction rate and effectiveness of the chemical. Colder temperatures slow down the kinetics of the chemical reaction. When the chemical reaction slows down, there is less energy to form precipitates in the wastewater. Longer detention times and more chemical are needed for precipitates to form in cold conditions. The clarifiers at the Silver Bay WWTF are not covered. Freezing temperatures in the winter historically have caused ice to form in the clarifiers. Colder wastewater temperatures and ice formation could cause the alum to be less effective in forming precipitates, thus reducing the removal efficiency of phosphorus and mercury. Polymer is added to help bind the flocs together and keep them together so they do not break apart and re-suspend. Similar to alum, cold temperatures slow the down the kinetics of the chemical reaction of the polymer. With uncovered clarifiers, chemical addition in the winter months could be less effective. This leads towards increased chemical usage (which increases costs), and poor removal efficiency. Details on process changes used by the City to investigate different coagulants and strategies for mercury removal are provided in section three of this report. Clarifier Rehabilitation Project To improve mercury removals, the City conducted a rehabilitation project on the tertiary clarifiers in Solids contact clarifier number one was rehabilitated with new equipment and a new coating, while clarifier number two received only a new coating. In the compliance schedule in the permit, the construction for the rehabilitation of the clarifiers was to be completed by October 1, However, due to unexpected delays, construction on the project was started after the original starting date and was not completed until December of Prepared by: Bolton & Menk, Inc. WWTF Background Silver Bay, MN Phase 1 Mercury Removal Full Scale Pilot Studies ǀ M Page 7
160 2016, three months after the original final completion date. This in turn, delayed the start of the full-scale pilot study for using the clarifiers for mercury removal. The delays were noted by the City in a letter that is attached in Appendix E. Because of these unexpected delays, the City missed three months of critical data collection. Data collection during pilot studies is critical to determine the effectiveness of the proposed system. With the mercury limits set forth in the NPDES permit, the City is evaluating the effectiveness that the rehabilitated tertiary clarifiers have on mercury removal with chemical addition. In the compliance schedule in the City s NPDES permit, it is required to submit a report to the MPCA by January 31, 2017, which evaluates if the tertiary clarifiers can sustain mercury removal to levels below permitted limits. If not, then the City must submit a Facility Plan by March 6, 2017 that will describe upgrades to the facility for mercury removal beyond the solids contact clarifiers. Details on the pilot study and mercury testing data are provided in the next section. Prepared by: Bolton & Menk, Inc. WWTF Background Silver Bay, MN Phase 1 Mercury Removal Full Scale Pilot Studies ǀ M Page 8
161 Sample Date III. Mercury Testing Results and Discussion Background In accordance with the NPDES permit, mercury sampling and analysis began in June of The following presents a summary of WWTF operations related to mercury removal since that time. In 2014, chemical dosing included alum fed to the tertiary clarifier splitter box at a dose of 125 mg/l, and Hawkins Inc. polymer (AH937) fed to the center feedwell of clarifier number two. Tertiary clarifier number one was not in use at the time in the treatment process. The City was collecting influent and effluent total and dissolved mercury samples during this period. Future sampling will continue with the collection of grab samples of TSS and temperature at the same time and location as the mercury samples. With limited historical mercury and TSS data, a correlation cannot be made between mercury levels and TSS levels during this period. Evaluation of historic mercury sampling is provided in Table 3.1. The City has data going back to 2014 for mercury sampling. Total Mercury (ng/l) Influent Dissolved Mercury (ng/l) Table 3.1 Historical Mercury Data Effluent Clarifier No. 1 Total Mercury (ng/l) * Clarifier No. 1 Dissolved Mercury (ng/l) * Clarifier No. 2 Total Mercury (ng/l) Clarifier No. 2 Dissolved Mercury (ng/l) WWTF Flow (MGD) Total Mercury Percent Removal June 18, % Oct. 22, % Nov. 9, Jan. 14, < % Feb. 4, < April 1, % May 31, % Sep. 30, % Jan 6, < % May 18, % May 31, < % July 6, % Oct. 18, % Oct. 27, % Average % Clarifier number one was out of service until August 25, 2016 and came online on August 26, 2016 when renovations began on tertiary clarifier number two. Both clarifiers became operational on November 14, The average influent total mercury concentration over this reporting period is 67.1 ng/l with an average dissolved concentration of 2.3 ng/l. While clarifier number one was offline for a majority of the period of historical data, clarifier two had a long-term average effluent total mercury concentration of 2.36 ng/l and an average dissolved concentration of approximately 1.0 ng/l. When clarifier one came back online after it was rehabilitated, clarifier two was shut down for renovations. The average effluent total mercury concentration in tertiary clarifier number one was 2.55 ng/l with an average dissolved concentration of ng/l. Historically, the clarifiers have been removing approximately 93% of the influent mercury. Prepared by: Bolton & Menk, Inc. Mercury Testing Results and Discussion Silver Bay, MN Phase 1 Mercury Removal Full Scale Pilot Studies ǀ M Page 9
162 Although the treatment facility has achieved a high percentage of mercury removal, historical effluent mercury concentrations have exceeded final limits of 1.9 ng/l for a calendar month average and 3.5 ng/l for a daily maximum set forth in the permit. To be proactive with mercury removal, the City took a two-pronged approach to improving mercury removals in the tertiary clarifiers. They first conducted bench-scale jar tests to optimize mercury removal through chemical addition and rehabilitated the tertiary clarifiers to improve solids removal. In 2015, the City worked with Hawkins to conduct a series of bench-scale jar tests to evaluate the impact of various chemical coagulants on settling and mercury removal. The report from Hawkins is provided in Appendix B. The bench tests performed by Hawkins focused mainly on improving settling rates and building a more dense sludge blanket. Based on this testing, Hawkins recommended replacing the alum and polymer combination with AH5167 (a poly aluminum chloride). No mercury data was collected during the Hawkins tests to determine the level of mercury removal associated with an improved sludge bed. The City requested approval from the MPCA for use of the AH5167 chemical to aid in mercury removal in June of 2015, prior to the current permit becoming active. The letter to the MPCA asking for approval is attached in Appendix C. In January 2016, the MPCA approved use of AH5167 in the City s WWTF. This approval letter is found in Appendix D. AH5167 was fed solely starting on May 6, 2016 through August 26, At this point, the City went back to feeding regular alum and polymer to tertiary clarifier number two. The City performed another trial run with AH5167 starting on October 20, 2016 and ran until December 3, There appeared to be no significant mercury removal improvement from using AH5167 over regular alum and polymer. From December 3 until the date of this report, the City is adding a combination of alum plus polymer. Clarifier renovations occurred during 2016 and both clarifiers were operational beginning approximately December 6, After rehabilitation of the clarifiers, an operational change was made to feed alum in the splitter box upstream of the clarifiers and polymer to the center of each clarifier. December 6, 2016 is considered the official start of the full-scale pilot study. A preliminary Phase I report was submitted to the MPCA detailing a process description and a description of the rehabilitation of the clarifiers that was to be completed. This report is provided in Appendix F. This present Phase I Final report will be used to help determine if the full-scale pilot study, using the tertiary clarifiers with chemical addition for mercury removal, can sustainably remove mercury to below final permitted limits. Full-Scale Pilot Study The main goal of the pilot study was to evaluate performance of the solids contact clarifiers ability to remove total mercury levels to below permitted limits. Historically, the Silver Bay WWTF has met all limits set forth in the NPDES permit for everything except mercury. The process behind using the clarifiers for mercury removals includes chemical mixing to form flocs (zone one), directing the water down to the bottom of the clarifier where the sludge settles (zone two), rising of the flow through the sludge blanket, separation of solids and water through settling (zone three), and collection of the wastewater in the effluent troughs. City staff have been taking mercury samples from each clarifier on a weekly basis on the same day each week, at the same time each day. If environmental conditions are not Prepared by: Bolton & Menk, Inc. Mercury Testing Results and Discussion Silver Bay, MN Phase 1 Mercury Removal Full Scale Pilot Studies ǀ M Page 10
163 favorable, the City will wait until optimal environmental conditions. Mercury sampling and analysis follows the United States Environmental Protection Agency (EPA) Method 1631E. It is important to take great care not to contaminate the sample from outside sources when sampling for low-level mercury, especially from outside environmental sources. Environmental conditions can play a key role in low-level mercury sampling and cause significant error. It is critical to evaluate field blank samples to see if there has been any contamination. Mercury sampling for the pilot study started in December of 2016 after the rehabilitation project on the clarifiers was completed and both clarifiers were operational. The City is continuing to sample for mercury weekly. Mercury analysis is done by North Shore Analytical, Inc. located in Duluth, MN. Some of the laboratory data is provided in Appendix G. Pilot Testing Mercury Sampling Results Table 3.2 summarizes the mercury testing results for the full-scale pilot study at the Silver Bay WWTF. Two sample dates (December 21, 2016 and January 11, 2017) show results from when the mercury concentrations from each individual clarifier were tested. All other sampling results represent the concentration of the combined samples from clarifiers one and two. Future testing results will show the mercury concentration from each individual clarifier.. An operational change was made on January 10, The alum feed point was moved from the splitter box to the center of each of the clarifiers. The polymer is still being fed into the center well. Dedicated chemical feed pumps were installed to allow each clarifier to be fed chemical independently. After the alum dose point was changed, staff found a plug in the alum feed line into tertiary clarifier number two. There is potential that with that line being plugged, alum that would have normally been fed to tertiary clarifier number two was most likely fed to tertiary clarifier number one, leading to the higher mercury levels in tertiary clarifier number two. In Table 3.2, mercury results prior to January 11 correspond to operations in which alum was fed in the upstream splitter box, and mercury results from January 11 and later correspond to operations where alum was fed in the center well of each clarifier. Prepared by: Bolton & Menk, Inc. Mercury Testing Results and Discussion Silver Bay, MN Phase 1 Mercury Removal Full Scale Pilot Studies ǀ M Page 11
164 Sample Date Total Mercury (ng/l) Influent Dissolved Mercury (ng/l) Table 3.2 Full-Scale Mercury Pilot Data Clarifier No. 1 Total Mercury (ng/l) Clarifier No. 2 Total Mercury (ng/l) Effluent Average Effluent Total Mercury (ng/l) (1) Average Effluent Dissolved Mercury (ng/l) WWTF Flow (MGD) Total Mercury Percent Removal Dec. 7, < % Dec. 13, % Dec. 21, < % Dec. 28, < % Jan. 4, < % Jan. 11, 2017 (2) % Jan. 18, 2017 (3) Jan. 25, 2017 (3) (1) Average effluent total mercury concentrations are the average mercury concentrations between samples taken from tertiary clarifier number one and tertiary clarifier number two. (2) Alum feed point was moved to the center of each tertiary clarifier shortly before this date. All samples after this date correspond to samples taken with the Alum feed point in the center of each clarifier. (3) Mercury testing results for these dates were not available at the time this report was written and submitted. The average monthly effluent total mercury concentrations for December 2016 and January 2017 are 2.67 ng/l and 3.23 ng/l, respectively. Average influent concentrations of total mercury for December 2016 and January 2017 are 28.0 ng/l and 28.0 ng/l, corresponding to removals of 90% and 88%, respectively. The permitted calendar month average total mercury limit is 1.9 ng/l with a daily maximum limit of 3.5 ng/l. Based on the data above, effluent monthly average total mercury concentrations exceed permitted final limits. On the two dates where mercury sampling results for each individual clarifier are shown, it can be seen that clarifier number one has much lower effluent mercury concentrations than clarifier number two. The poor removals in clarifier number two could be one reason why the average monthly effluent mercury concentration for the combined samples, is above permitted final limits. Reasons for poor removals in clarifier number two could be due to underfeeding of alum or poor mixing of the coagulant, or from flocs breaking apart in the mixing area of the clarifier. Even though some single data points of the combined or individual samples are below the limits, it is important to average the entire month s data and compare to the permitted limit since it is based on a calendar month average. Currently, the WWTF must meet the interim limits in the permit for mercury concentrations in the effluent until final limits must be met. Based on the interim limits of 3.8 ng/l for a calendar month average and a daily maximum of 7.0 ng/l, and the data provided in Table 3.1, the WWTF has met or exceeded these interim permitted limits. There is no limit on dissolved mercury in the permit. The dissolved mercury concentration in the influent waste stream has averaged less than 3 ng/l with effluent concentrations less than 0.5 ng/l. Historically, the dissolved mercury concentration has remained low and it is predicted that this trend will continue. Environmental conditions can have a significant impact on mercury levels in the effluent waste stream. One important item to note is that the tertiary clarifiers are not covered. Generally, it is a good idea to have clarifiers covered to prevent outside environmental Prepared by: Bolton & Menk, Inc. Mercury Testing Results and Discussion Silver Bay, MN Phase 1 Mercury Removal Full Scale Pilot Studies ǀ M Page 12
165 contamination, especially when testing for ultra-low level mercury concentrations. During the winter months, staff at the WWTF has observed the clarifiers forming ice on the surface. This can affect the performance of the clarifier and the performance for mercury removal. As discussed earlier, when the clarifiers have a layer of ice on them, the kinetics of the chemical reactions to form precipitates decreases, reducing the overall efficiency of chemical addition for pollutant removal. The data provided in Table 3.2 is only from the winter months when temperatures are cold and the wastewater flows are generally low. With the current length of the study (less than 2 months), there is not enough data to accurately gauge how much increased wastewater flows, temperature, and outside environmental factors affect mercury removal with the clarifiers being un-covered. Rainfall in the spring and summer could affect mercury removals as well as snowmelt in the spring. Sampling into the summer may help provide enough data to gauge how well the clarifiers remove mercury and to what levels. Operational Processes One aspect of the process the City has been focusing on to try and help facilitate more mercury removal is fine-tuning the mixer variable frequency drives (VFDs) and optimizing the chemical feed dose and feed location of alum and polymer in the tertiary clarifiers. By fine-tuning the chemical feed and adjusting the mixing, it may be possible to achieve a level of mercury removal below permitted limits. Prepared by: Bolton & Menk, Inc. Mercury Testing Results and Discussion Silver Bay, MN Phase 1 Mercury Removal Full Scale Pilot Studies ǀ M Page 13
166 This page intentionally left blank. Prepared by: Bolton & Menk, Inc. Mercury Testing Results and Discussion Silver Bay, MN Phase 1 Mercury Removal Full Scale Pilot Studies ǀ M Page 14
167 IV. Recommendations and Conclusions Summary Using the tertiary clarifiers for mercury removal, with the assistance of coagulant and flocculants chemistries, shows significant mercury removal is possible as compared to the influent mercury concentrations. The City has consistently met the interim calendar month average and daily maximum discharge limits for mercury of 3.8 ng/l and 7.0 ng/l, respectively, since mercury monitoring began in Bench-tests with alternative coagulants were conducted to determine which one would work best to increase the density of the sludge blanket to optimize mercury removal. Trial runs using the alterative chemical did not show increased removals over adding alum plus a polymer. Upon completion of the clarifier renovation project in December of 2016, the City began a full-scale pilot study using alum and polymer feed into the tertiary clarifiers. The goal of this pilot study is to determine if the existing treatment system can consistently meet final mercury limits for calendar month average and daily maximum limits of 1.9 ng/l and 3.5 ng/l, respectively. Based on the first six weeks of data from the full-scale pilot, the effluent has not consistently met final limits. The average total mercury in the effluent in December 2016 was 2.27 ng/l, and in January 2017, it was 3.23 ng/l. Because of the short operating time of the full-scale pilot, there is not sufficient data to conclude that the current system can remove mercury to meet the final limits. Recommendation and Conclusion It is recommended to continue the full-scale pilot to optimize the tertiary clarifiers for mercury removal. Multiple approaches may be considered when optimizing tertiary treatment systems to meet mercury effluent limits. It is important to take a methodical approach to any changes being made to the system in order to accurately track the impact of each change. It is recommended to extend the current full-scale pilot study into June of 2017 and collect the following additional data from the system: TSS data from the mercury grab sample Temperature data at the time of mercury sampling Operation during various environmental conditions Use of Hawkins AH5167 chemistry for an extended period at various dosing rates with and without polymer Tertiary filter mixing operations and speed adjustments Additional monitoring and evaluation of influent mercury concentration spikes to identify additional pollution prevention measures. During this period, it is also recommended to conduct bench-scale testing on chemical options and chemical feed rates to provide insight into optimizing the existing system and other types of treatment that could be pilot tested. Bench testing allows for the studying of additional settling options in a controlled, ideal environment. Data gathered from alterations to chemical feed rates and settling times could then be used to implement changes in the full- Prepared by: Bolton & Menk, Inc. Recommendations and Conclusions Silver Bay, MN Phase 1 Mercury Removal Full Scale Pilot Studies ǀ M Page 15
168 scale pilot. This would also provide an opportunity to test mercury scavenger chemistries that have been successfully used at other facilities to meet similar low-level mercury limits. It is recommended the bench-scale tests include mercury testing to provide some insight regarding the level of mercury removal that is possible. If this testing indicates an inability to meet the final limits with chemical and settling alone, additional polishing may be needed to consistently meet final limits. Analysis of the mercury sampling data and observations of the clarifiers show that the findings of the study are inconclusive. Therefore, more data is needed before it can be concluded that the tertiary clarifiers can be used as the primary mercury removal process at the WWTF. Since current data is insufficient to prove the solids contact clarifiers can achieve effluent limits for mercury, a facility plan will be written and submitted to the MPCA by March 6, 2017 detailing alternative technologies for mercury removal. If sampling data by June 2017 indicates the contact clarifiers are able to sustain mercury removal to a level below permitted limits, then an amendment will be added to the Facility Plan stating the solids contact clarifiers with chemical addition will be the primary mercury removal process and additional treatment for mercury removal will not be required. Prepared by: Bolton & Menk, Inc. Recommendations and Conclusions Silver Bay, MN Phase 1 Mercury Removal Full Scale Pilot Studies ǀ M Page 16
169 Appendix I: PPL Application and Worksheet
170
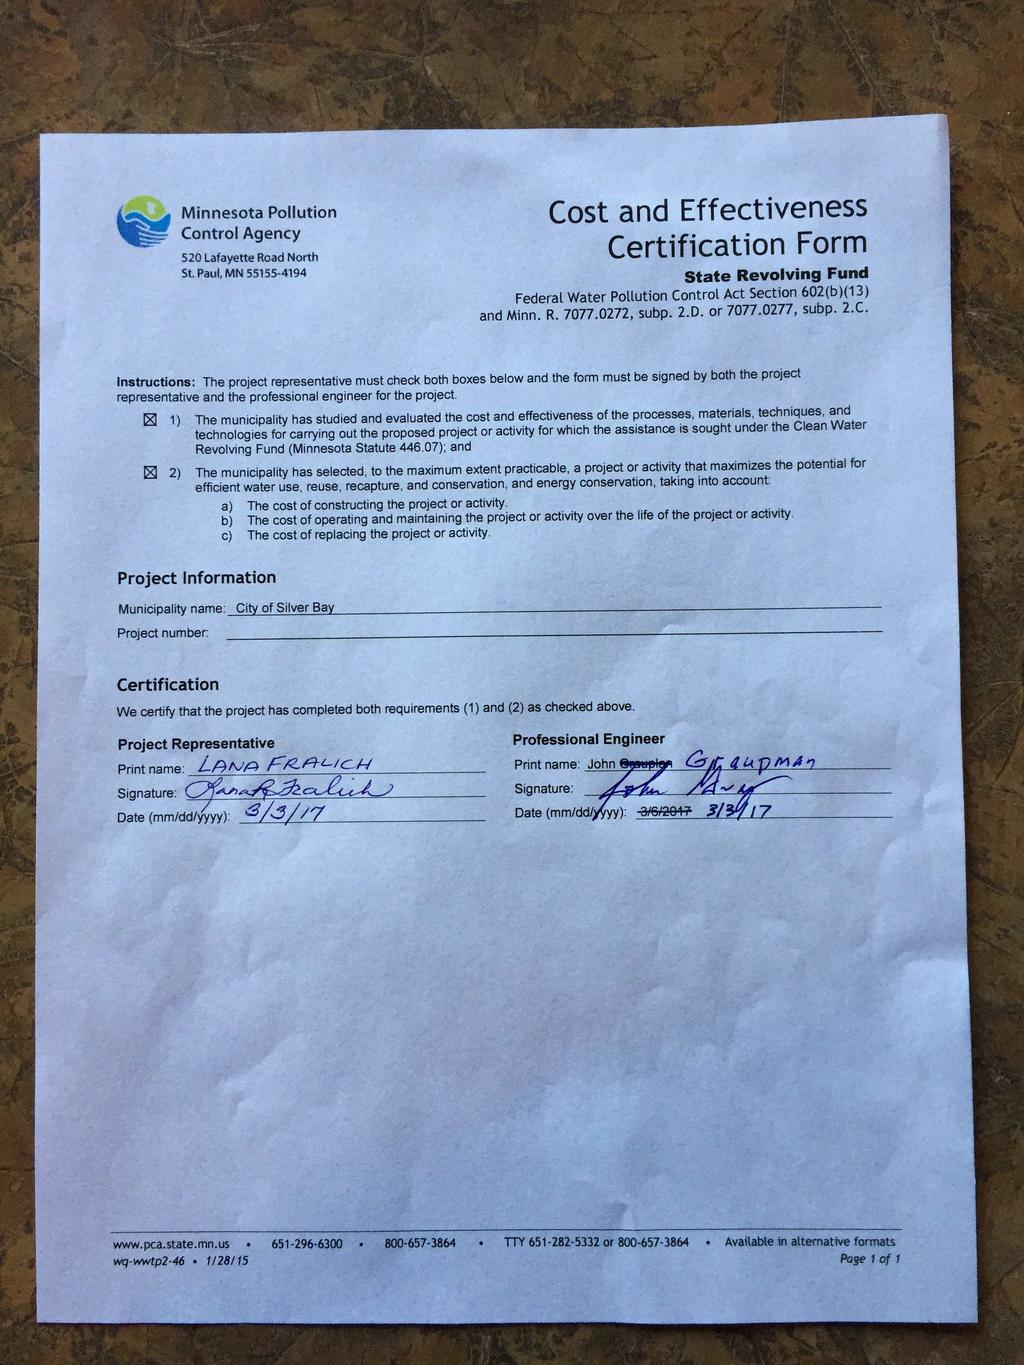
171
172 Project Priority List (PPL) Wastewater Application 1. Applicant name: City of Silver Bay Project area: Town/city: City of Silver Bay City of Silver Bay Population: County: Lake 2. Contact person: Lana Fralich Address: 7 Davis Drive Silver Bay, MN Phone: (218) Fax: (218) lanaf@silverbay.com 3. Project consultants/firm name (if applicable): Bolton & Menk, Inc. Contact name: John Graupman Address: 1960 Premeir Drive Mankato, MN Phone: (507) Fax: johngr@bolton-menk.com 4. Project area description: Sewered: Unsewered (submit map of project area) a. Number of existing households: 839 b. Number of non-residential users: 26 Need or problem project Failing on-site systems # of failing systems: addresses: Connection to an existing system Expansion of existing treatment plant (Check all that apply) Rehab of an existing facility New treatment and/or collection system Rehab collection system Advanced treatment 5. Please indicate if this project may be a Green Project Reserve (GPR) which are wastewater projects that are either categorical or non-categorical and have components or the entire project is applying to be determined GPR eligible. The U.S. Environmental Protection Agency (EPA) provided a guidance document listing examples of projects that will qualify for Green Project Reserve dollars. Below is a list of those examples. If the proposed project matches one or more of the examples, check the box next to the example that describes the project. For more information, see CW Green Guidance at Categorical eligible project types 1. Water Efficiency a. Installation of water meters (applies only to drinking water distribution systems contact the Minnesota Department of Health) b. Retrofit or replacement of water using fixtures, fittings, equipment or appliances c. Efficient landscape or agricultural irrigation equipment d. Systems to recycle gray water e. Reclamation, recycling, and reuse of existing rainwater, condensate, degraded water, stormwater, and/or wastewater streams. f. Collection system leak detection equipment g. Development and initial distribution of public education materials TTY or Available in alternative formats wq-wwtp2-32 1/22/10 Page 1 of 2
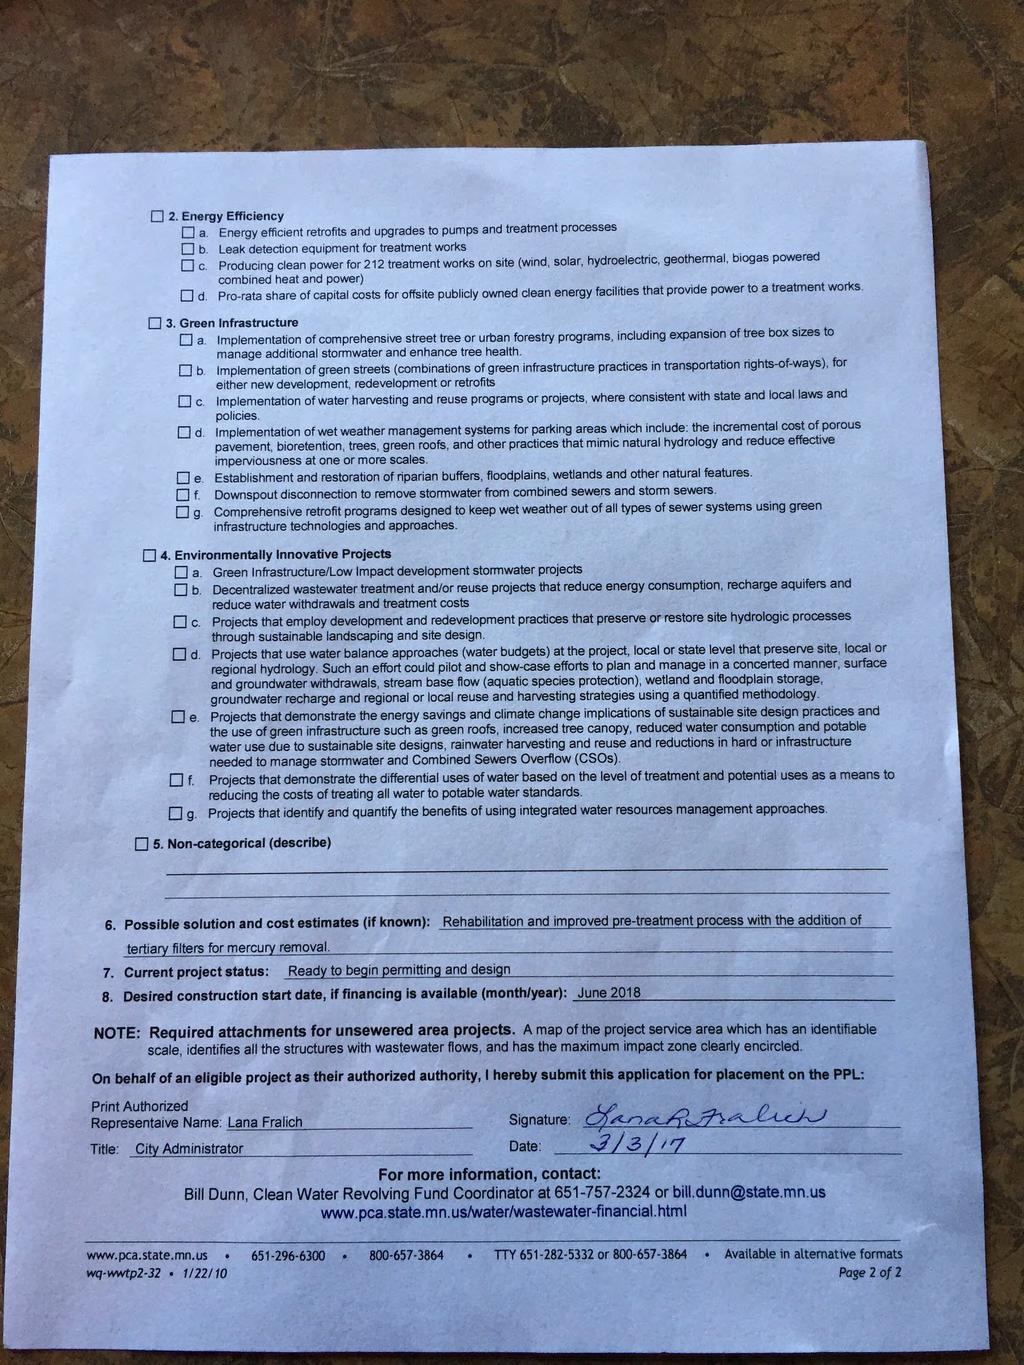
173
City of Staples, Minnesota
 Wastewater Treatment Facility Plan November 2012 City of Staples, Minnesota Bolton & Menk kproject No. W13.104619 104619 TABLE OF CONTENTS SECTION 1 INTRODUCTION... 1-1 A. Purpose... 1-1 B. Background...
Watertown Wastewater Facility Plan. August 11, 2015
 Watertown Wastewater Facility Plan August 11, 2015 Watertown Wastewater Wastewater Treatment Facility History Comprehensive Planning Wastewater Concerns Capacity Condition Permitting Requirements Watertown
Minnesota Pollution Control Agency
 Minnesota Pollution Control Agency STATE OF MINNESOTA Minnesota Pollution Control Agency MUNICIPAL DIVISION PUBLIC NOTICE OF INTENT TO REISSUE NATIONAL POLLUTANT DISCHARGE ELIMINATION SYSTEM (NPDES)/ STATE
Minnesota Pollution Control Agency
 Minnesota Pollution Control Agency STATE OF MINNESOTA Minnesota Pollution Control Agency MUNICIPAL DIVISION PUBLIC NOTICE OF INTENT TO REISSUE NATIONAL POLLUTANT DISCHARGE ELIMINATION SYSTEM (NPDES)/ STATE
Wastewater Treatment Works and Collections System Annual Report Year 2005 General Information
 Wastewater Treatment Works and Collections System Annual Report Year 2005 General Information Facility / System: Town of Farmville Wastewater Collection System and Treatment Facilities Responsible Entity:
WEFTEC.06. **Cobb County Water System, Marietta, Georgia
 CHEMICALLY ENHANCED PRIMARY TREATMENT FOR A LARGE WATER RECLAMATION FACILITY ON A CONSTRICTED SITE - CONSIDERATIONS FOR DESIGN, START-UP, AND OPERATION ABSTRACT Jeffrey A. Mills, P.E., BCEE,* Roderick
STATE OF MINNESOTA MINNESOTA POLLUTION CONTROL AGENCY FINDINGS OF FACT
 STATE OF MINNESOTA MINNESOTA POLLUTION CONTROL AGENCY IN THE MATTER OF THE DECISION ON THE NEED FOR AN ENVIRONMENTAL IMPACT STATEMENT FOR THE PROPOSED LESTER PRAIRIE WASTEWATER TREATMENT FACILITY EXPANSION
Water Resources Director: Chris Graybeal
 Water Resources Director: Chris Graybeal Our Mission To promote and protect the environment, preserve natural resources, and ensure the health and safety of our customers. Granite Falls Wastewater Treatment
Module 20: Trickling Filters Answer Key
 Module 20: Trickling Filters Answer Key Calculation Capital City WWTF, which processes 2.0 MGD, is required to nitrify to meet the 2.0 mg/l ammonia discharge limit stated in their NPDES permit. A table
BEING GOOD STEWARDS: IMPROVING EFFLUENT QUALITY ON A BARRIER ISLAND. 1.0 Executive Summary
 BEING GOOD STEWARDS: IMPROVING EFFLUENT QUALITY ON A BARRIER ISLAND Brett T. Messner, PE, Tetra Tech, Inc., 201 E Pine St, Suite 1000, Orlando, FL 32801 Brett.Messner@tetratech.com, Ph: 239-851-1225 Fred
Recovering a Failed Sand Filter Wastewater Treatment System
 Recovering a Failed Sand Filter Wastewater Treatment System By Michael C. Brandt, PE Advanced Designer of Subsurface Sewage Treatment Systems Project Manager MFRA, Inc. All subsurface treatment systems
ATTACHMENT 1 GENERAL FACILITY INFORMATION. BOD5 mg/l mg/l TSS mg/l mg/l NH3-N mg/l mg/l
 ATTACHMENT 1 GENERAL FACILITY INFORMATION 1. Facility Name: 2. Type of Facility: 3. Population Served: Present: Design: 4. Flow: Average Maximum Peak 5. Water Quality: Present Design Assumed Actual Source:
CITY OF OXFORD WASTEWATER TREATMENT FACILITY ANNUAL PERFORMANCE REPORT FOR THE CALENDAR YEAR OF 2012
 CITY OF OXFORD WASTEWATER TREATMENT FACILITY ANNUAL PERFORMANCE REPORT FOR THE CALENDAR YEAR OF 2012 PREPARED: January 2013 2012 ANNUAL PERFORMANCE REPORT FOR THE CITY OF OXFORD WASTEWATER TREATMENT FICILITY
Water Quality Permitting Program Monitoring Matrix 1,2,3
 State of Oregon Department of Environmental Quality Water Quality Permitting Program Monitoring Matrix 1,2,3 ITEM OR PARAMETER Total Flow (influent and/or effluent) 4 Flow Meter Calibration 5 (influent
Operations Report. September 10, 2015
 Operations Report September 1, 215 Plant Loading and Operations Summary August 215 Biochemical Oxygen Demand, 5-Day (Avg. 2,151 lb./day) Total Suspended Solids (Avg. 33,197 lb./day) Average Daily Flow
Biological Phosphorus Removal Technology. Presented by: Eugene Laschinger, P.E.
 Biological Phosphorus Removal Technology Presented by: Eugene Laschinger, P.E. Overview What is phosphorus and why do we care? How can you remove phosphorus? Biological phosphorus removal Biological phosphorus
CHAPTER 1 - WASTEWATER SYSTEM DESCRIPTION
 CHAPTER 1 - WASTEWATER SYSTEM DESCRIPTION 1.1 Introduction The GWA provides wastewater services for Guam s general population and for Andersen Air Force Base. The wastewater system is made up of seven
STATE OF MINNESOTA MINNESOTA POLLUTION CONTROL AGENCY
 STATE OF MINNESOTA MINNESOTA POLLUTION CONTROL AGENCY In the Matter of the Decision on the Need for an Environmental Impact Statement for the Proposed Remer Wastewater Treatment Facility Expansion FINDINGS
Combined Sewer Overflows July 2012-December 2013
 CSO Facilities Summary Report 213 Combined Sewer Overflows July 212-December 213 Overview MWRA monitored four CSO facilities in the North System during the period covered in this report (July 212 December
FAIRMONT WASTEWATER TREATMENT PLANT
 FAIRMONT WASTEWATER TREATMENT PLANT 2006 Page 1 PUBLIC UTILIES COMMISSION Bill Supalla Joe Kurtzman Andy Noll Jeff Ziemer David Kuhl SPECIAL THANKS TO CITY STAFF Jim Zarling, City Administrator Mike Humpal,
Lagoons Operation and Management in New Brunswick
 Lagoons Operation and Management in New Brunswick Lagoons Provide secondary treatment to domestic wastewater by the action of bacteria stabilizing the organic matter in the wastewater. Benefits of lagoons:
Facilities Plan. Technical Memorandum No. TM-WW-7 Hydraulic Analysis and Effluent Pump Station
 City of St. Joseph, Missouri Hydraulic Analysis and Effluent Pump Station By Work Order No. 09-001 B&V Project 163509 May 20, 2010 Table of Contents 1.0 Executive Summary...1 2.0 Purpose of Study...2 3.0
National Pollutant Discharge Elimination System (NPDES)/State Disposal System (SDS) Permit Program Fact Sheet
/State Disposal System (SDS) Permit Program Fact Sheet") National Pollutant Discharge Elimination System (NPDES)/State Disposal System (SDS) Permit Program Fact Sheet Permittee: City of Litchfield Facility Name: Litchfield WWTF Permit Number: MN0023973 126 N
National Pollutant Discharge Elimination System (NPDES)/State Disposal System (SDS) Permit Program Fact Sheet Permittee: City of Litchfield Facility Name: Litchfield WWTF Permit Number: MN0023973 126 N
CHAPTER 10 PRELIMINARY TREATMENT
 CHAPTER 10 PRELIMINARY TREATMENT TM 5-814-3/AFM 88-11, Volume III 10-1. General considerations. Preliminary treatment of wastewater includes screening, grinding, grit removal, flotation, equilization,
Taylor Creek Treatment Plant. Metropolitan Sewer District of Greater Cincinnati
 Taylor Creek Treatment Plant Metropolitan Sewer District of Greater Cincinnati Who is this guy and what is he talking about? Brad Blankenship Taylor Creek Operator 3.5 years MSD Operator 5.5 years (total)
Fremont Water Pollution Control Center Plant Expansion for Nutrient Removal and Wet Weather Flow Treatment
 OWEA 2013 Annual Conference June 19, 2013 Fremont Water Pollution Control Center Plant Expansion for Nutrient Removal and Wet Weather Flow Treatment Jeff Lamson, Superintendent, WPCC Robert Hrusovsky,
CEE 371 May 14, 2009 Final Exam
 CEE 371 May 14, 2009 Final Exam Closed Book, two sheets of notes allowed Please answer questions 3, 6 and 7. In addition, answer either question 1 or 2, and answer either question 4 or 5. The total potential
Sanitary Sewer Systems. Sewage Collection System. Types of Sewage 10/12/2016. General Overview
 Sanitary Sewer Systems General Overview Sewage Collection System Pipes Pumping stations Maintenance entry points manholes Types of Sewage Sanitary Domestic sewage: human wastes and washwater from public
W O C H H O L Z R E G I O N A L W A T E R R E C L A M A T I O N F A C I L I T Y O V E R V I E W
 Facility Overview The recently upgraded and expanded Henry N. Wochholz Regional Water Reclamation Facility (WRWRF) treats domestic wastewater generated from the Yucaipa-Calimesa service area. The WRWRF
Maine Department of Environmental Protection Program Guidance on Combined Sewer Overflow Facility Plans
 Maine State Library Maine State Documents Land and Water Quality Documents Environmental Protection 9-1-1994 Maine Department of Environmental Protection Program Guidance on Combined Sewer Overflow Facility
GUIDELINES FOR PREPARATION OF CAPACITY ANALYSIS REPORTS
 GUIDELINES FOR PREPARATION OF CAPACITY ANALYSIS REPORTS Florida Department of Environmental Regulation July 1992 TABLE OF CONTENTS PURPOSE AND APPLICABILITY................... 1 Purpose............................
MUNICIPAL WATER POLLUTION PREVENTION (MWPP) ANNUAL REPORT
 ANNUAL REPORT") MUNICIPAL WATER POLLUTION PREVENTION (MWPP) ANNUAL REPORT SUBMITTED BY: TREATMENT FACILITY: NPDES #: MUNICIPALITY: COUNTY: CONTACT PERSON: Responsible Official Title Telephone #: Fax #: Email Address:
MUNICIPAL WATER POLLUTION PREVENTION (MWPP) ANNUAL REPORT SUBMITTED BY: TREATMENT FACILITY: NPDES #: MUNICIPALITY: COUNTY: CONTACT PERSON: Responsible Official Title Telephone #: Fax #: Email Address:
Chapter 2: Description of Treatment Facilities
 2020 Facilities Plan Treatment Report 2.1 Introduction Chapter 2: Description of Treatment Facilities This chapter defines the Milwaukee Metropolitan Sewerage District (MMSD) service area. It also describes
Thornton Sewer Plant Operations Manual -DRAFT-
 Thornton Sewer Plant Operations Manual -DRAFT- February 2014 Prepared for: HOUSING AUTHORITY OF THE COUNTY OF SAN JOAQUIN P.O. BOX 447 421 S. EL DORADO STREET STOCKTON, CA 95203 Prepared by: BLACK WATER
SSO Reduction Program. WWTP Effluent Violation Corrective Actions
 SSO Reduction Program WWTP Effluent Violation Corrective Actions Report to United States Environmental Protection Agency: SSO Reduction Program This page intentionally left blank i WWTP Effluent Violation
ENVIRONMENTAL ASSESSMENT
 ENVIRONMENTAL ASSESSMENT Project Identification Name: Piqua Wastewater Plant Expansion NRD WPCLF#: CS390755-0009, AIMS #5945 Contact: Gary Huff, City Manager City of Piqua 201 Water Street Piqua, OH 45356
Hillsdale Wastewater Treatment Plant
 Hillsdale Wastewater Treatment Plant SRF Project Plan Public Hearing sdgfdgdf June 10, 2014 Presented by: Jeff Pugh, PE and Elaine Venema, PE Synopsis/Agenda Purpose of Presentation Project Background
Algae Removal from a Facultative Lagoon System Using Dissolved Air Flotation. J. Patrick Pierce, P.E. Environmental Treatment Systems, Inc.
 Algae Removal from a Facultative Lagoon System Using Dissolved Air Flotation J. Patrick Pierce, P.E. Environmental Treatment Systems, Inc. Facultative Lagoon System Designed for 1.5 MGD Discharging 1.15-1.35
COMPARISON OF SBR AND CONTINUOUS FLOW ACTIVATED SLUDGE FOR NUTRIENT REMOVAL
 COMPARISON OF SBR AND CONTINUOUS FLOW ACTIVATED SLUDGE FOR NUTRIENT REMOVAL Alvin C. Firmin CDM Jefferson Mill, 670 North Commercial Street Suite 201 Manchester, New Hampshire 03101 ABSTRACT Sequencing
City of Clinton: Wastewater Systems Annual Performance Report
 City of Clinton: Wastewater Systems Annual Performance Report January 2016 through December 2016 I. General Information Facility/System Name: City of Clinton Collection System and Norman H. Larkins Wastewater
SEWER SYSTEM DESIGN GUIDELINES
 SEWER SYSTEM DESIGN GUIDELINES PART 1 GENERAL 1.1 GENERAL GUIDELINES A. The following sewer system design guidelines are based on Federal, State and Local health requirements, and the Berkeley County Water
Background Where did CSO systems begin? Combined Sewer Overflow (CSO) Control. Background. Background. Background
 Control. Background. Background. Background") Background Where did CSO systems begin? Combined Overflow (CSO) Control Eric Bergstrom HDR Engineering Background System Development Before About 196 House Background System Development After 196 Building
Background Where did CSO systems begin? Combined Overflow (CSO) Control Eric Bergstrom HDR Engineering Background System Development Before About 196 House Background System Development After 196 Building
Volume 1 Executive Summary
 2013 Cheyenne Water and Wastewater Master Plans Final November 27, 2013 Prepared for: City of Cheyenne Board of Public Utilities 2416 Snyder Ave. Cheyenne, WY 82001 Prepared by: HDR Engineering AMEC Earth
Northfield Township WWTP Capacity Evaluation Report
 Northfield Township WWTP Capacity Evaluation Report March 18, 2015 PRESENTED TO PRESENTED BY Northfield Township 8350 Main Street Suite A Whitmore Lake, Michigan 48189 Tetra Tech 710 Avis Drive Suite 100
Copies: Mark Hildebrand (NCA) ARCADIS Project No.: April 10, Task A 3100
 ARCADIS Project No.: April 10, Task A 3100") MEMO To: Jeff Pelz (West Yost) Kathryn Gies (West Yost) Copies: Mark Hildebrand (NCA) ARCADIS U.S., Inc. 200 Harvard Mills Square Suite 430 Wakefield Massachusetts 01880 Tel 781 224 4488 Fax 781 224 3033
MEMO To: Jeff Pelz (West Yost) Kathryn Gies (West Yost) Copies: Mark Hildebrand (NCA) ARCADIS U.S., Inc. 200 Harvard Mills Square Suite 430 Wakefield Massachusetts 01880 Tel 781 224 4488 Fax 781 224 3033
Appendix D JWPCP Background and NDN
 Appendix D JWPCP Background and NDN JWPCP Background JWPCP Water Quality Primary Clarifiers HPO Reactors Final Clarifiers Unit Influent Primary Effluent Secondary Effluent BOD mg/l 460 240
NPDES WASTEWATER DISCHARGE PERMIT EVALUATION
 NPDES WASTEWATER DISCHARGE PERMIT EVALUATION Department of Environmental Quality Eastern Region - Pendleton Office 700 SE Emigrant, Suite 330, Pendleton, OR 97801 Telephone: (541) 276-4063 PERMITTEE: City
AS A COURTESY, PLEASE TURN OFF CELL PHONES AND PAGERS WHILE MEETING IS IN PROGRESS.
 Table of Contents Agenda 2 Wastewater Treatment Plant (WWTP) Hydraulic Capacity Update Staff Report 3 WWTP Capacity Outline 5 WWTP Capacity Charts 6 Drainage Concerns on Oak Hill Drive and Quail Drive
City of Surrey, ND Municipal Infrastructure Needs Assessment September 2012
 City of Surrey, ND Municipal Infrastructure Needs Assessment September 2012 Project made possible by US Dept. of HUD Regional Substantiality Planning Grant and ND Energy Development Infrastructure and
Dealing with Unexpected Wastewater Treatment Plant Disruptions. February 16, 2017
 Dealing with Unexpected Wastewater Treatment Plant Disruptions February 16, 2017 Location Map WPCP History Original WPCP constructed on this site in 1928 consisting of primary treatment and chlorination;
City of Grosse Pointe Park Sanitary Sewer System Inflow and Infiltration Investigation Smoke Testing
 City of Grosse Pointe Park Sanitary Sewer System Inflow and Infiltration Investigation Smoke Testing August 2017 Definitions Sanitary Sewer System Sanitary sewer pipes and pump stations that collect wastewater
Startup and Performance of the World s first Large Scale Primary Dissolved Air Floatation Clarifier ABSTRACT KEYWORDS INTRODUCTION
 Startup and Performance of the World s first Large Scale Primary Dissolved Air Floatation Clarifier Bruce R. Johnson 1 *, Jennifer Phillips 2, Tim Bauer 3, Greg Smith 4, George Smith 5, John Sherlock 6
Minnesota Pollution Control Agency Municipal Division
 DRAFT DRAFT DRAFT STATE OF MINNESOTA Minnesota Pollution Control Agency Municipal Division National Pollutant Discharge Elimination System (NPDES)/ State Disposal System (SDS) Permit MN0030066 PERMITTEE:
Ann Arbor Wastewater Treatment Plant Facilities Renovations Project October 2017
 Ann Arbor Wastewater Treatment Plant Facilities Renovations Project October 2017 The Facilities Master Plan was completed in 2004 and identified the need for improvements to the City of Ann Arbor s Wastewater
November 28, Dear Mr. Bechtold:
 4000 Hollywood Boulevard Seventh Floor, North Tower Hollywood, Florida 33021 (954) 987-0066 Fax: (954) 987-2949 November 28, 2012 Wastewater Compliance and Enforcement Section FLORIDA DEPARTMENT OF ENVIRONMENTAL
Infiltration and Inflow. Michael Sassaman Phone
 Infiltration and Inflow Michael Sassaman msassaman@entecheng.com Phone 610-373-3345 Inflow and Infiltration PA DEP Learning Objectives Do you have Excessive I/I? Sources of Inflow and Infiltration I/I
New York State Department of Environmental Conservation
 May 2012 New York State Department of Environmental Conservation Award Submission for Environmental Excellence Awards Port Washington Water Pollution Control District (PWWPCD) Submitted by D&B Engineers
Streamlining I/I Repairs in Berlin Charter Township
 Case Study: Streamlining I/I Repairs in Berlin Charter Township Presented by: Rich Grant, PE Agenda Discussion of the problems & the SAW I/I Evaluation & SSES = Asset Management Groundtruthing of Results
CHAPTER 12 TRICKLING FILTER PLANTS
 CHAPTER 12 TRICKLING FILTER PLANTS TM 5-814-3/AFM 88-11, Volume III 12-1. General considerations. Trickling filter plants have been justified by their low initial cost, low operating and maintenance costs,
Carbon Canyon Water Recycling Facility Title 22 Engineering Report
 Carbon Canyon Water Recycling Facility Title 22 Engineering Report April 2014 Introduction Regulatory Requirements Inland Empire Utilities Agency Carbon Canyon Water Recycling Facility Title 22 Engineering
Permit for Construction of an Extension to a JEA Drinking Water Distribution System and/or JEA Wastewater Collection/Transmission System
 Permit for Construction of an Extension to a JEA Drinking Water Distribution System and/or JEA Wastewater Collection/Transmission System INSTRUCTIONS: This form shall be completed and submitted (in duplicate)
Deicing Fluid and Stormwater Management At Cincinnati/Northern Kentucky International Airport
 Deicing Fluid and Stormwater Management At Cincinnati/Northern Kentucky International Airport Kenton County Airport Board 2009 ACI-N/A/ATA/RAA Deicing Management Conference July 8, 2009 Don Chapman CVG
ENHANCING THE PERFORMANCE OF OXIDATION DITCHES. Larry W. Moore, Ph.D., P.E., DEE Professor of Environmental Engineering The University of Memphis
 ENHANCING THE PERFORMANCE OF OXIDATION DITCHES Larry W. Moore, Ph.D., P.E., DEE Professor of Environmental Engineering The University of Memphis ABSTRACT Oxidation ditches are very popular wastewater treatment
FAYOUM CITY SEWAGE TREATMENT PLANT, DEVELOPMENT STAGES, CASE STUDY
 FAYOUM CITY SEWAGE TREATMENT PLANT, DEVELOPMENT STAGES, CASE STUDY Ahmed El-Zayat, Environmental Engineering Group, Egypt Emaill: ahmed_el_zayat@yahoo.com Introduction This case study focuses on three
Inland Empire Utilities Agency Regional Plant No. 1 Title 22 Engineering Report
 Regional Plant No. Title 22 Engineering Report Table of Contents Page Introduction. Background... -.2 Objective... - 2 Regulatory Requirements 2. Types of Reuse... 2-2.2 Water Recycling Criteria... 2-2.3
International Joint Commission Water & Wastewater Treatment Best Management Practices Forum Monday, March 26, 2012 Wayne State University, Detroit MI
 STARTUP AND OPERATION OF A BIOLOGICAL AERATED FILTER (BAF) FOR SIMULTANEOUS BOD REMOVAL AND NITRIFICATION AT THE LOU ROMANO WATER RECLAMATION PLANT WINDSOR ONTARIO CANADA International Joint Commission
Chapter 8 Addressing I/I Issues and High Flows
 Chapter Outline Chapter 8 Addressing I/I Issues and High Flows This chapter is organized into the following sections: Introduction Background Estimation of Infiltration Volume Conveyance Costs Effect of
PEIRCE ISLAND WASTEWATER TREATMENT FACILITY UPGRADE
 REQUEST FOR QUALIFICATIONS CITY OF PORTSMOUTH NEW HAMPSHIRE Public Works Department ENGINEERING SERVICES PEIRCE ISLAND WASTEWATER TREATMENT FACILITY UPGRADE VALUE ENGINEERING REVIEW RFQ No. 59-14 City
CITY OF LONDON ENVIRONMENTAL & ENGINEERING SERVICES DEPARTMENT WASTEWATER TREATMENT OPERATIONS GREENWAY POLLUTION CONTROL CENTRE 2013 ANNUAL REPORT
 CITY OF LONDON ENVIRONMENTAL & ENGINEERING SERVICES DEPARTMENT WASTEWATER TREATMENT OPERATIONS GREENWAY POLLUTION CONTROL CENTRE 2013 ANNUAL REPORT FEBRUARY 2014 SUMMARY This annual report is in response
AUTHORITY OF THE BOROUGH OF CHARLEROI WASHINGTON COUNTY, PENNSYLVANIA ACT 537 SEWAGE FACILITIES PLAN UPDATE
 PLAN SUMMARY AUTHORITY OF THE BOROUGH OF CHARLEROI WASHINGTON COUNTY, PENNSYLVANIA ACT 537 SEWAGE FACILITIES PLAN UPDATE The Pennsylvania Sewage Facilities Act (Act 537) was enacted by the Pennsylvania
Water supply components
 Water supply components Water sources structures (Dams, wells, reservoirs) Surface water Groundewater Pipelines from source Water treatment plant components Pumping stations Storage (elevated tanks) Distribution
Sanitary and Environmental Engineering I (4 th Year Civil)
") Sanitary and Environmental Engineering I (4 th Year Civil) Prepared by Dr.Khaled Zaher Assistant Professor, Public Works Engineering Department, Faculty of Engineering, Cairo University Wastewater Flow
Sanitary and Environmental Engineering I (4 th Year Civil) Prepared by Dr.Khaled Zaher Assistant Professor, Public Works Engineering Department, Faculty of Engineering, Cairo University Wastewater Flow
WASTEWATER & STORM WATER COLLECTION AND REMOVAL
 CVE 471 WATER RESOURCES ENGINEERING WASTEWATER & STORM WATER COLLECTION AND REMOVAL Assist. Prof. Dr. Bertuğ Akıntuğ Civil Engineering Program Middle East Technical University Northern Cyprus Campus CVE
c: Don Labossiere, Director, Environmental Compliance and Enforcement Public Registries
 Climate Change and Environmental Protection Division Environmental Approvals Branch 123 Main Street, Suite 160, Winnipeg, Manitoba R3C 1A5 T 204 945-8321 F 204 945-5229 www.gov.mb.ca/conservation/eal CLIENT
Technical Memorandum. 201 N. Civic Drive, #115 Walnut Creek, CA Tel: Fax:
 201 N. Civic Drive, #115 Walnut Creek, CA 94596-3867 Tel: 925.937.9010 Fax: 925.937.9026 Technical Memorandum Prepared for: City of Sunnyvale, Sunnyvale, CA Project Title: Sunnyvale Strategic Infrastructure
Wastewater Flow Monitoring Services
 Wastewater Flow Monitoring Services For San Gabriel, CA July 13, 2015 through July 21, 2015 Revised October 9, 2015 Leaders in Sewer Flow Monitoring Services 601 N. Parkcenter Dr., Suite 209 Santa Ana,
OJAI VALLEY SANITARY DISTRICT A Public Agency
 OJAI VALLEY SANITARY DISTRICT A Public Agency 1072 Tico Road, Ojai, California 93023 (805) 646-5548 FAX (805) 640-0842 WWW.OJaISan.org NOTICE OF SPECIAL MEETING & INFORMATIONAL WORKSHOP NOTICE IS HEREBY
TABLE OF CONTENTS. SECTION 1 INTRODUCTION 1.1 Background Purpose and Scope
 TABLE OF CONTENTS EXECUTIVE SUMMARY... Page ES-1 SECTION 1 INTRODUCTION 1.1 Background... 1-1 1.2 Purpose and Scope... 1-2 SECTION 2 BASIS OF DESIGN 2.1 Existing Discharge Permit... 2-1 2.2 Plant Capacity
GRAY WATER SYSTEMS FOR RESIDENTIAL BUILDINGS
 INFORMATION BULLETIN / PUBLIC - PLUMBING CODE REFERENCE NO.: LAMC 94.1502.0 Effective: 01-01-2017 DOCUMENT NO.: P/PC 2017-012 Revised: Previously Issued As: P/PC 20014-012 GRAY WATER SYSTEMS FOR RESIDENTIAL
Providing Infrastructure Redundancy at the Rocky River WWTP. Timothy McCann AECOM Keith Bovard Rocky River WWTP
 Timothy McCann AECOM Keith Bovard Rocky River WWTP WWTP Infrastructure Redundancy Redundancy As NASA Would Say: A Backup Plan for the Backup Plan Nuclear Power Plant Wastewater Treatment Plant Page 3 Infrastructure
Sewer Charge & Surcharge Provision Development, Implementation & Benefits
 Sewer Charge & Surcharge Provision Development, Implementation & Benefits 2013 Industrial Wastewater Conference Bethlehem, PA (October 4, 2013) Human Waste Treatment History (1) Historically dilution in
Wet Detention Ponds, MCTTs, and other Options for Critical Area Stormwater Control. Robert Pitt University of Alabama, Tuscaloosa, AL
 Wet Detention Ponds, MCTTs, and other Options for Critical Area Stormwater Control Robert Pitt University of Alabama, Tuscaloosa, AL Critical Source Area Controls for Stormwater Treatment Detention Pond
CEDAR CREEK Wastewater Treatment Facility
 CEDAR CREEK Wastewater Treatment Facility Where does the waste originate Private homes Businesses from? Condominium complexes Nursing homes Apartments ANY DWELING THAT USES WATER AND IS CONNECTED TO THE
Project Name: Central WWTP Capacity Improvements and CSO Reduction Project. MWS Project Number: 14-SC-0153 Last Updated: 12/19/14
 Project Name: Central WWTP Capacity Improvements and CSO Reduction Project MWS Project Number: 14-SC-0153 Last Updated: 12/19/14 BACKGROUND / PURPOSE Metro Water Services (MWS), in order to comply with
WWTF Capacity Assessment Project
 Wastewater Treatment Facility Evaluation The Richland WWTF was constructed in 1985 to provide primary and secondary treatment for the City's wastewater. Section 3 includes a general description of the
CHAPTER IV EXISTING SEWAGE TREATMENT FACILITIES IN THE PLANNING AREA
 CHAPTER IV EXISTING SEWAGE TREATMENT FACILITIES IN THE PLANNING AREA A. EXISTING FACILITIES 1. Westtown-Chester Creek Plant Westtown Township acquired the Westtown-Chester Creek Treatment Plant (WCC Plant)
Costs and Benefits of Requiring On-Site Wastewater System Treatment Standards Greater Than Nationally Recognized Standards
 Costs and Benefits of Requiring On-Site Wastewater System Treatment Standards Greater Than Nationally Recognized Standards Session Law 2015-286, Section 4.15.(d) Report to The Environmental Review Commission
Polishing Ponds. Biosolids Storage. Ammonia Removal. Digesters. Thickeners. Pretreatment. Final Clarifiers. Primary Clarifiers.
 Wastewater Treatment Facility (2012) Polishing Ponds Biosolids Storage Ammonia Removal Digesters Thickeners Pretreatment Primary Clarifiers Activated Sludge Final Clarifiers OVERVIEW Whenever a home, business,
Wastewater Treatment Works... The Basics
 United States EPA 833-F-98-002 Environmental Protection May 1998 Agency Office of Water (4204) Wastewater Treatment Works... The Basics O ne of the most common forms of pollution control in the United
A NEW METHOD FOR EVALUATING PRIMARY CLARIFIERS Alex Ekster and Cristina Pena San Jose/Santa Clara Water Pollution Control Plant City of San Jose
 A NEW METHOD FOR EVALUATING PRIMARY CLARIFIERS Alex Ekster and Cristina Pena San Jose/Santa Clara Water Pollution Control Plant City of San Jose ABSTRACT A new method has been developed for evaluating
DRIP EMITTER SYSTEM STUDY GUIDE
 DRIP EMITTER SYSTEM STUDY GUIDE Minimum Criteria for Pressurized Subsurface Absorption Fields Utilizing Emitters. Subsurface systems utilizing emitters may be used in lieu of conventional or other alternative
TOWN OF LONDONDERRY, NEW HAMPSHIRE WASTEWATER FACILITIES PLAN UPDATE TABLE OF CONTENTS
 6%34(6%4(2 )%&+-+4+(3 1-%/ 51 %4( :=>?;9 406/ 0) -0/ 0/ (227! /(6 *%.13*+2(,8A #""$ TOWN OF LONDONDERRY, NEW HAMPSHIRE WASTEWATER FACILITIES PLAN UPDATE TABLE OF CONTENTS SECTION DESCRIPTION PAGE ES
HOW TO SAVE COSTS AND IMPROVE SUSTAINABILITY WHILE REDUCING EFFLUENT NITROGEN
 HOW TO SAVE COSTS AND IMPROVE SUSTAINABILITY WHILE REDUCING EFFLUENT NITROGEN Introduction Donna Kaluzniak, CEP, Utility Director, City of Atlantic Beach, Florida John E. Collins, Jr., P.E., J. Collins
REGULATION NO. 62 COLORADO DEPARTMENT OF PUBLIC HEALTH AND ENVIRONMENT WATER QUALITY CONTROL COMMISSION REGULATIONS FOR EFFLUENT LIMITATIONS
 REGULATION NO. 62 COLORADO DEPARTMENT OF PUBLIC HEALTH AND ENVIRONMENT WATER QUALITY CONTROL COMMISSION REGULATIONS FOR EFFLUENT LIMITATIONS ADOPTED: March 18, 1975 FORMAT CHANGED: January 4, 1977 AMENDED:
This document can be made available in other accessible formats as soon as practicable and upon request. Staff Report. Infrastructure & Public Works
 This document can be made available in other accessible formats as soon as practicable and upon request Staff Report Infrastructure & Public Works Report To: Committee of the Whole Meeting Date: March
Your Guide to the. Budd Inlet Treatment Plant
 Your Guide to the Budd Inlet Treatment Plant How does LOTT know the plant is working correctly? All activity within the treatment plant is monitored 24 hours a day, 7 days a week. A highly trained team
APPENDIX L Hydrology and Stormwater Pond Analysis
 APPENDIX L Hydrology and Stormwater Pond Analysis This page is left intentionally blank. Hydrology and Stormwater Pond Analysis Liesch Associates, Inc. June 1, 2012 Minneapolis-St. Paul International Airport
9-1. Wet-weather high-speed wastewater filtration system
 9-1.Wet-weather high-speed wastewater filtration system N. Horie 1, M.Kabata 2, K.Sano 3, S.Kanamori 4 Director, Chief Researcher,Senior Researcher 3, Researcher 4 First Research Department Japan Institute
SUBSURFACE INFILTRATION SYSTEM DESCRIPTION. Alternative Names: Sump, Drywell, Infiltration Trench, Infiltration Galleries, Leach Fields
 4.1-d SUBSURFACE INFILTRATION SYSTEM Alternative Names: Sump, Drywell, Infiltration Trench, Infiltration Galleries, Leach Fields BMP DESIGN APPROACH Pollutant Source Control Hydrologic Source Control Stormwater