CONTENTS. List of Figures List of Tables List of Boxes List of Abbreviation Executive Summary. 1 Introduction 1
|
|
|
- Rudolph Caldwell
- 5 years ago
- Views:
Transcription
1 Contents CONTENTS Contents List of Figures List of Tables List of Boxes List of Abbreviation Executive Summary Page I III V VI IX Sr. Section No. 1 Introduction 1 2 Section I Pressures Air Pollutants Pressures on Air Quality Meteorological & Climatic Conditions Population Growth & Urbanisation Urban Heat Islands Industrialisation Power Sector Mining Vehicular Growth Fuel Usage Travel Mode Characteristics Indoor Air Pollution 36 3 Section II State Trends in Annual Average Concentration of SO 2 in Residential Areas Trends in Annual Average Concentration of SO 2 in Industrial Areas Trends in Annual Average Concentration of NOx in Residential Areas Trends in Annual Average Concentration of NOx in Industrial Areas Trends in Annual Average Concentration of SPM in Residential Areas Trends in Annual Average Concentration of SPM in Industrial Areas Trends in Annual Average Concentration of RSPM in Residential Areas Trends in Annual Average Concentration of RSPM in Industrial Areas Trends in PM 2.5 in Ahmedabad Monitoring of VOCs Noise Monitoring Odour Monitoring Hot Spots 67 Page i
2 Contents 3 Section III Impact Economic Impacts Health Impacts Health Impacts due to Indoor Air Pollution Health Impacts due to Mining Health Impacts due to Noise Pollution Health Impacts due to Heat Islands Health Impacts due to Odour Other Impacts Some Impact Studies Carried Out In Recent Past National Environmental Health Profile and 77 Comparative Health Risk Assessment of Ahmedabad, sponsored by WHO through Ministry of Environment & Forests. Conducted by NIOH Survey of Traffic Policemen conducted by Traffic Department in January Health Impacts of Air Pollution in Ahmedabad Effect of Air Pollution on Human Health (adults)in Delhi 79 4 Section IV Response At National Level Ambient Air Quality Norms Preparation of Zoning Atlas Improved Vehicle Emission Norms Improved Fuel Quality Norms At State Level Air Action Plans Monitoring of Industries Roping in Technical Institutes to Control Air Pollution Strengthening of PUC Stations CNG/LPG Infrastructure for Auto Gas Supply Registration of Retrofitters Banning of Old Autos & Conversion to CNG in Ahmedabad Improved Public Transport System Promoting Renewable Energy At Individual Level Conversion of Vehicles to Cleaner Fuel (CNG/LPG) Use of Natural Gas by Industries Households having PNG 95 5 Section V Recommendation Need To Extend Ambient Air Quality Monitoring Programme Source Apportionment Studies Health Impact Studies Pollution Control from Vehicles Regulatory Agencies Awareness Programmes 98 Page ii
3 Contents 6 References 99 7 Annexure I 12 8 Annexure II 19 9 Annexure III Annexure IV 145 Page iii
4 List of Figures Introduction LIST OF FIGURES 1. Fig A: Performance of Gujarat in ESI 1 2. Fig B: PSIR Framework 2 Section I Pressures 1. Fig 1.1: Climate in Gujarat 5 2. Fig 1.2: Soil Map of Gujarat 5 3. Fig 1.3: Physiography in Gujarat 6 4. Fig 1.4: Rainfall in Gujarat 6 5. Fig 1.5: Industrial Estates, SEZs, SIRs & DMIC Nodes in Gujarat Fig 1.6: Jurisdiction Area of Regional Offices of GPCB Fig 1.7: Location of Thermal Power Plants in Gujarat Fig 1.8: Fuel wise distribution in total installation Fig 1.9: Percentage of Renewable Energy Sources in Gujarat Fig 1.1: Mining Areas of Gujarat Fig 1.11: Categorywise Distribution of Vehicles In Gujarat (31/3/211) Fig1.12 Vehicle Population : All Vehicles Fig 1.13: Transport and NonTransport Vehicles in Gujarat Fig 1.14: Distribution of Vehicles in Major Urban Centers of Gujarat Fig 1.15: Travel Mode Chracteristics Ahmedabad Fig 1.16: Fuel Usage for Rural Gujarat at HH Level NFHS Fig 1.17: Fuel Usage for Rural Gujarat at HH Level NFHS Fig 1.18: Fuel Usage in Gujarat State 38 Section II State 1. Fig 2.1: Air Quality Monitoring Stations in Gujarat Fig 2.2: RSPM Ahmedabad (Residential Areas) Fig 2.3: RSPM Vadodara (ResidentialAreas) Fig 2.4: RSPM Surat (Residential) Fig 2.5: RSPM Rajkot (Residential Area) Fig 2.6: RSPM Jamnagar (Residential Area) 53 7 Fig 2.7: RSPM levels at Important Industrial Locations 55 8 Fig 2.8: GIDC Naroda(Above Police Chowki) Industrial Area 57 Page No. Page I
5 List of Figures 9 Fig 2.9: Nehru Bridge Traffic Junction 57 1 Fig2.1: Satellite Area, Chinmay Seva Trust Residential Area Fig 2.11: Ambient Air Quality Monitoring Stations for VOCs in Gujarat 6 12 Fig 2.12: Benzene Concentration Pandesara Fig 2.13: Benzene Concentration Ankleshwar Fig 2.14: Benzene Concentration Dahej Fig 2.15: Benzene Concentration Panoli Fig 2.16: Benzene Concentration Naroda Fig 2.17: Benzene Concentration Vatva 62 Section IV Response 1. Fig 4.1: Samples Collected under Air Act 86 Page II
6 List of Tables LIST OF TABLES Page No. Section I Pressures 1 Table 1.1: Air Pollutants & their Sources of Generation 3 2 Table 1.2: Climatic Regions of Gujarat 4 3 Table 1.3: Climate in Gujarat 6 4 Table 1.4: Increase in Number of Towns in Gujarat 7 5 Table1.5: Population Characteristics in Gujarat Table 1.6: Cities Having Population 1 lac & Above 9 7 Table 1.7: Industries Registered with GPCB 12` 8 Table 1.8: Distribution of air polluting industries in Gujarat (as on 2/5/212) 13 9 Table 1.9: Large Industries under 17 Most Polluting Categories (28/2/212) 14 1 Table 1.1: Generation Installed Capacity (Mw) Public Private Sector Table 1.11: Installed Capacity (Mw) Thermal and Renewable Energy Table 1.12: Mining activities and potential sources of air pollution 2 13 Table 1.13: District wise Distribution of Mining Area in Gujarat Table 1.14: Growth of Vehicular Population in Gujarat over decades Table 1.15: Distribution of Vehicles in Various RTOs of Gujarat Table 1.16: Retail Fuel Sale Details for Gujarat Table 1.17: Vehicular Growth and Fuel Consumption Table 1.18: Percentage Usage of Fuel at Household Level 38 Section II State 1 Table 2.1: Classification of Air Quality 4 2 Table 2.2: Annual Averages SO2 in Residential Areas 4 3 Table 2.3: Annual Averages SO2 in Industrial Areas 42 4 Table 2.4: Annual Averages NOx in Residential Areas 43 5 Table 2.5: Annual Average NOx in INDUSTRIAL AREAS 45 6 Table 2.6: Annual Averages SPM in Residential Areas 46 7 Table 2.7: Annual Averages SPM in Industrial Areas 48 8 Table 2.8: Annual Averages RSPM in Residential Areas 49 9 Table 2.9: Annual Average RSPM Industrial Areas 53 Page III
7 List of Tables 1 Table 2.1: PM 25 for Ahmedabad Table 2.11: Ambient Air Quality Monitoring Stations for VOCs in Gujarat Table 2.12: Noise Standards Table 2.13: Noise Monitoring During The Navratri Festival Table 2.14: Noise Monitoring During the Diwali Festival Table 2.15: District wise Contribution to Population and Vehicles of Gujarat Table 2.16: Ranking of Districts 69 Section III Impact 1 Table: 3.1: Air Pollutants & their Health Impacts 74 2 Table 3.2: Reasons for Air pollution 77 3 Table 3.3: Diseases Identified Due To Air Pollution 77 4 Table 3.4: Disease Pattern Related to Air Pollution in Gujarat 79 Section IV Response 1 Table 4.1: Pre Revised Norms 81 2 Table 4.2: Revised Norms since 18th Nov Table 4.3: Vehicle Emission Norms 83 4 Table 4.4: Improved Fuel Quality Norms 84 5 Table 4.5: District Wise Approved PUC Centers 88 6 Table 4.6: CNG/LPG Stations for Auto Gas Supply 89 7 Table 4.7: Retrofitters Data 9 8 Table 4.8: AMTS Operations ( ) 91 9 Table 4.9: Phase Wise Details of BRTS 92 1 Table: 4.1: CNG/LPG Vehicles in Gujarat Table 4.11: CNG/LPG Vehicles in Ahmedabad Table 4.12: Industries having Natural Gas Connection 95 Page IV
8 List of Boxes LIST OF BOXES Page No. Section III Impact 1 Box 3.1: WHO Study on Indoor Air Pollution 75 2 Box 3.2: Effect of Air Pollution on Human Health (adults) in Delhi 79 Section IV Response 3 Box 4.1: Jurisdiction Area of Regional Offices of GPCB 85 4 Box 4.2: On Line Stack Emission Monitoring Narol, Ahmedabad 86 Page V
9 List of Abbreviation LIST OF ABBREVIATION C Degree Celsius am APCD API B(a)P BRTS C C 6 H 6 CH 4 CNG CO CPCB db e.g. GEMI GIDC GPCB H HH Hr I IOC ISO KWh L LPG LULC M M m 3 mm Ante Meridiem Air Pollution Control Device Air Polluting Industries Benzo(A) Pyrene Bus Rapid Transport System Critical Benzene Methane Compressed Natural Gas Carbon Monoxide Central Pollution Control Board Decibel Example Given Gujarat Environment Management Institute Gujarat Industrial Development Corporation Gujarat Pollution Control Board High Household Hour Industrial Indian Oil Corporation International Organization for Standardization Kilowatt Hour Low liquefied Petroleum Gas Landuse Landcover Meter Moderate Meter Cube Millimeter Page VI
10 List of Abbreviation MoEF Ministry of Environment and Forest MoPNG Union Ministry of Petroleum And Natural Gas MW Mega Watt NAAQS National Ambient Air Quality Standards NAMP National Air Quality Monitoring Programme NFHS National Family Health Survey NG Natural Gas NH 3 Ammonia Ni Nickel NIOH National institute of Occupational Hazard NO Nitric Oxide No. Number NO 2 Nitrogen Dioxide NO x Oxides of Nitrogen O 3 PAHs Pb PM pm Ozone Polycyclic Aromatic Hydrocarbons Lead Particulate Matter Post meridiem PM 1 Particles having diameter of less than 1 µm PM 2.5 Particles having diameter of less than 2.5 µm ppm Parts Per Million PSU Public Sector Undertaking PUC Pollution Under Control Pvt. Ltd. Private Limited R Residential R & D Research and Development RO Regional Office RSPM Respiratory Suspended Particulate Matter SAMP State Air Quality Monitoring Programme SMEs Small and Medium Enterprises SO 2 Sulfur Dioxide SPM Suspended Particulate Matter Page VII
11 List of Abbreviation TB ug/m3 um UNEP UV viz. VOCs WHO Tuberculosis Microgram/cubic meter Micro Meters United Nations Environment Program UltraViolet Videlicet (namely) Volatile Organic Compounds World Health Organisation Page VIII
12 Executive Summary
13 Executive Summary EXECUTIVE SUMMARY Air is an important life sustaining resource. Given the fact that a person breathes in more than six liters of air every minute, the quality of air becomes a prime concern. The composition of air in natural environment is constant but is being changed due to release of large amount of emissions by industries, automobiles and other sources. This changed quality became a great threat to survival of life, properties, materials and ecosystem as a whole. Gujarat was among the States scoring minimum percentile ( 2) for Air quality in a study undertaken by Center for Development Finance Institute For Financial Management & Research Chennai in 211 named Environmental Sustainability Index for Indian States. This report on Air is divided into five sections namely Pressure which discusses the factors which contribute to the quality of Air in Gujarat, State elaborates the present quality of Air with respect to various parameters such as SO2, NOx, SPM, RSPM, PM2.5, VOCs etc, Impact details out the impact of air quality especially on human health and other things, Response features various steps taken at national and state level to improve overall air quality and Recommendations suggest some measures which can help improve the present scenario of Air Quality at policy level. Local initiatives that can go a long way in improving quality of air have also been mentioned. The contributing factors to air pollution are largely Population, Urbanisation, Industries, Vehicles, domestic sources etc. In addition, meteorological and climatic conditions of any area are responsible for contributing to the background air quality levels. Rainfall, wind speed, temperature and soil type are important in this category. Urban population in Gujarat has risen from per cent in 21 to 42.58% in 211, making it one of the fastest growing urbanised states. This Concentration of population in urban centers makes huge pressures on land, air and water pollution. Ahmedabad is the largest city of Gujarat with 7.2 million people living here. Surat and Vadodara are other two major cities with high number of urban population followed by Rajkot with population of 1.5 million. As per Census 211, Gujarat has 3 urban centers with more than 1 lac population. Seven Municipal Corporations contribute to 56.12% of the total urban population of the state. The air temperatures in densely built urban areas are often higher than the temperatures of the surrounding countryside. The State has continued to witness impressive industrial development since its inception. There are 182 industrial estates spread throughout the State covering an area of 32 hectares, 83 industrial clusters, 6 notified SEZs and 11 notified SIRs. Also a major part of DMIC corridor (38%) is going to pass through Gujarat. The total number of industries having pollution potential as registered with Gujarat Pollution Control Board as on 2/5/212 is out of which belong to air polluting category. Coal based power generation is considered to be a major contributor to air pollution and in Gujarat; power generation is largely coal based to the tune of 54%. Among air polluting sectors, minerals industry ranks among the top. The impact of mining on air starts from exploration phase, increases manifold during operational phase and may even extend beyond the mine closure. The fugitive emission is a common phenomena related to mining, which is very significant in case of open cast mining as compared to undergrounding. In addition to this, waste handling, transportation and its storage also have high dust potential. Mining covers only.33% of Page IX
14 Executive Summary the total state area. Though Kachchh (28.18km2) has maximum area under mining, Sabarkantha has highest percentage in landuse under mining. Mining in Gujarat is usually done for production of Agate, Steatite, Gypsum, Limestone, Lignite, Bauxite, Laterite, Dolomite, Clay (others), China Clay, Bentonite, Quartz,Silica sand and Chalk. Vehicular air pollution is one of the major contributors to the overall air pollution in any area. The fleet of vehicles in Gujarat has been growing at phenomenal proportion. The vehicular population in the last decade has grown from to (133%). In 211 major contributor to the fleet are the two wheelers forming 73.17%, followed by private cars and goods vehicles. Public transport systems have not been able to keep pace with the rapid and substantial increases in demand over the past few decades. Another major source of air pollution is burning of fossil fuels. The household sector is the second largest consumer of energy in India after the industrial sector. Gujarat still has 77.3% rural population using unprocessed solid fuel. The improvement in 5 years from NFHS 2 and NFHS 3 is marginal and the usage of unprocessed fuel is reduced only by marginal 4.7 % in rural areas. For a progressive state like Gujarat having abundant natural resources, this is an alarming figure. An inventory of air pollutants is a necessary first step towards control of air pollution. The ambient air quality is monitored in the State by Gujarat Pollution Control Board. The parameters being monitored are SO 2, NOx, SPM & RSPM. The data for the years 26 to 21 has been analysed. Monitoring of PM 2.5 has also been started in Ahmedabad since June 211. Monitoring of VOCs for 25 industrial clusters in Gujarat has also been initiated since May 211. Noise levels are being monitored only during festivals of Navratri and Diwali. Trends in Annual Average Concentration of SO 2, NOx, SPM and RSPM show that the air pollution in residential areas with respect to SO 2 and NOx is within limits but SPM and RSPM levels are a cause for concern in most cities in the state. Trends in PM 2.5 for Ahmedabad which is a recent addition have also been shown. Values are consistently high at traffic junctions like Nehru Bridge in Ahmedabad. At other locations, higher values are observed during winter months and lower levels are observed during monsoon months. The winter months are relatively much calmer than other months. The prevailing calm conditions facilitate more stability to atmosphere and consequently slow dispersion of pollutants generated and help in build up of pollutants in vicinity of the pollutant sources. If we look into the industrial clusters, the values of SO2, NOx, SPM and RSPM do not cross the critical levels in general. However, if we consider benzene, then industrial areas of Naroda, Vatva, Pandesara, Ankleshwar, Panoli and Dahej exhibit continuously higher values. Hot Spots based on the pressures have been identified in the state. Major contributors to air pollution are Population, industries and Vehicles. Rate of urbanisation and industrialization leading to growth of vehicles overall make cities Ahmedabad, Surat, Vadodara and Rajkot the hot spots for air pollution. The United Nations Environment Programme has estimated that globally 1.1 billion people breathe unhealthy air (UNEP, 22). Epidemiological studies have shown that concentrations of ambient air particles are associated with a wide range of effects on human health, especially on the cardiorespiratory system. Beyond its human health impacts, air pollution is also detrimental to ecosystems. Through direct exposure and accumulation, reactive compounds negatively impact plant growth and are primary contributors to acid rain, which can diminish fish stocks, decrease biological diversity in Page X
15 Executive Summary sensitive ecosystems, degrade forests and soils, and diminish agricultural productivity. Air pollution is also known to have damaging effect on non living materials in the form of corrosion of metal, soiling and eroding of building surfaces etc. No health impact studies due to air pollution have been carried out in Gujarat in recent past. Various efforts have been made by stakeholders to abate air pollution from different sources. These efforts are being made at national, state and individual level to adopt strategies that can reduce the impacts due to air pollution. Government of India enacted the Air (Prevention and Control of Pollution) Act 1981 to arrest the deterioration in the air quality. At national level, the efforts were in the form of Tightening of Ambient Air Quality Norms, Preparation of Zoning Atlas, Improved Vehicle Emission Norms, Improved Fuel Quality Norms etc. At state level, efforts are in the form of Air Action Plans, Monitoring of Industries, Strengthening of PUC Stations, CNG/LPG Infrastructure for Auto Gas Supply, Registration of Retrofitters, Banning of Old Autos & Conversion to CNG in Ahmedabad, Improved Public Transport System. Promoting public bus transport is viewed as a top priority area to improve urban road traffic and for controlling air pollution from automobiles. Efforts at individual level are in the form of Conversion of Vehicles to Cleaner Fuel (CNG/LPG), Use of Natural Gas by Industries, shifting from solid fuels at household level. To focus the actions in right direction to reduce ambient air pollution; source apportionment exercises to find out the qualitative and quantitative contribution of various sources are needed to be carried out. Also there is a need to extend Ambient Air Quality Monitoring Programme to remaining areas in the State and to incorporate other parameters in monitoring as per the ambient air quality standards notified in 29. More epidemiological studies need to be conducted at regular intervals to detect and analyze the health effects of air pollution. There is a need to strengthen Mass Transportation in cities and to promote use of cleaner fuel. Improvement in traffic management system to relieve congestion is urgently called for by linking the by lanes and introducing parallel road system. Pedestrianising busy areas in peak periods, permitting parking at nodal points by designating parking areas need to be implemented. Since there are multiple contributors to air pollution like vehicles, industries, fuel burning etc., therefore, control strategies require active cooperation among all the concerned agencies and require creation of some common form where all the agencies can come together to plan strategies and programmes to prevent and control air pollution. Page XI
16 Introduction
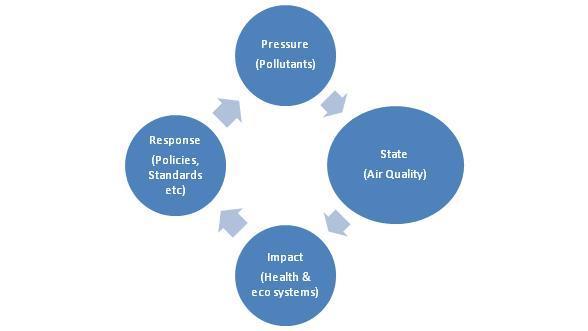
17 Introduction INTRODUCTION Air is an important life sustaining resource. Given the fact that a person breathes in more than six liters of air every minute, the quality of air becomes a prime concern. Air pollution as defined under Air (Prevention & Control of Pollution) Act 1981 is presence of any solid, liquid or gaseous substance (including noise) in the atmosphere in such concentrations as may be injurious to human beings or other living creatures or plants or property or environment. The composition of air in natural environment is constant but is being changed due to release of large amount of emissions by industries, automobiles and other sources. This changed quality has become a great threat to survival of life and ecosystem as a whole. The World Bank has predicted that India s water, air, soil and forest resources will be under more human pressure than those of any other country by the year 22. India is also ranked lowest (132) for its air quality (effect on Human Health) in the recent Environmental Performance Index conducted by Environmental Research Centers at Yale and Columbia Universities in 211. A study Environmental Sustainability Index for Indian States undertaken by the Center for Development Finance of Institute For Financial Management & Research Chennai indicates that Gujarat faces maximum challenge in maintaining environment. ESI is constructed as a composite index using 41 key environmental indicators which are further grouped into nine thematic sub indices air quality and pollution, water quality and availability, land use and agriculture, forest and biodiversity, waste generation and management, energy management, impact on human health & disaster, population pressure on ecosystem and environmental budget. Gujarat has obtained very low Sustainability percentile ranging between -2 as compared to other industrial states of Maharashtra and Tamil Nadu which have a sustainability percentile of Sub Index for Air Quality for Gujarat is also negative as shown in Fig 1.1. Fig A: Performance of Gujarat in ESI (28) Source: Center for Development Finance, IFMR, Chennai Page 1
18 Introduction Another study titled Comprehensive Environmental Assessment of Industrial Clusters was done by CPCB in 29 for 88 industrial clusters. From Gujarat; Ahmedabad, Ankleshwar, Junagadh, Rajkot, Surat, Vadodara, Vapi, and Vatva figure in this list in terms of air pollution. The current study analyses the state of Air Environment for Gujarat. The framework used is Pressure, State, Impact and Response (PSIR) which is the same as used in preparation of State of Environment Report at National level. State of Environment for Gujarat was last published in 25. Fig B: PSIR Framework Pressure (Pollutants) Response (Policies, Standards etc) State (Air Quality) Impact (Health & eco systems) The report has been arranged as follows. Section I discusses the pressures which alter the natural composition of atmosphere. These include natural as well as anthropogenic factors like meteorological and climatic conditions, population growth, urbanisation, industrilisation, use of fossil fuels, mining activities, vehicular growth and fuel consumption by domestic and industrial sectors. Following the identified pressures, Section II describes the present state of environment with respective to various pollution parameters for last five years. Trends in SO2, NOx, SPM, RSPM, PM2.5 are established. VOCs and their influence in the industrial areas of Gujarat are also considered. Odour and Noise also contribute to pollution categorized as nuisance and cause discomfort to population near to source and these are also discussed in brief in this section. Identification of Hot Spots in the State has been done based on various pressure parameters. Section III details out the impacts of air pollution from economic and health aspects. This section also looks into some specific health studies conducted at State level. Responses at National, State and individual levels are reviewed for maintaining and improving the air quality in Section IV. This also includes the policies, strategies and the legal measures undertaken to improve the air quality. Finally, Section V lists out the recommendations which may help in making Gujarat a sustainable and environment friendly state. Page 2

19 Section I - Pressures
20 Section I Pressure SECTION I - PRESSURE The study of air pollution requires a clear understanding of all sources contributing to air pollutants. Even from the control point of view; the sources of pollution need to be identified to take corrective measures in the right direction. Following sub sections describe the various sources which exert pressure on air quality. 1.1 Air Pollutants Air pollutants can be natural or may be the result of various anthropogenic activities like industrial, vehicular or other emissions. Further the air pollutants can be primary or secondary depending upon their formation mechanism. Primary pollutants are directly emitted from the source and secondary pollutants are formed in the atmosphere. Air pollutants are classified into particulate matter and gaseous pollutants. Table 1.1 highlights various air pollutants and their most common sources of generation. Table 1.1: Air Pollutants & their Sources of Generation Air Pollutant Typical Sources Particulate Matter Mines and quarries, pottery and ceramics, power stations, cement factories, vehicles, natural sources Sulphur dioxide Power houses, sulphuric acid plants, petroleum industry, oil refining, domestic use of fuel, vehicles Nitrogen dioxide Acid manufacture, automobile exhaust, explosive industry Carbon monoxide Fuel gases, automobile exhaust, mines, blast furnaces Hydro carbons Vehicles, fossil fuel burning PAHs Vehicles, fossil fuel burning Volatile organic compounds Vehicles Page 3
21 Section I Pressure 1.2 Pressures on Air Quality Meteorological & Climatic Conditions Meteorological variables are a major contributor to the overall air quality of an area. Even though the total discharge of air pollutants into the atmosphere may remain constant, the ambient concentrations of air pollutants may vary depending upon the meteorological conditions. The main parameters which directly affect concentrations of pollutants are geophysical features of an area, rainfall and wind speed. Higher concentrations are observed in the winter months when poor dispersion conditions prevail. This relationship is reflected in the seasonal variation in the pollutant concentrations. Another important contributing factor is ambient temperature. Low temperatures during the winter months lead to increased fuel usage for heating purposes. When solid fuels are combusted for domestic heating, particulate emissions increase. This, together with poor dispersion conditions, is likely to be key contributor to high concentration of air pollutants in winter. During summer, the phenomenon of natural dust-laden winds from arid and semi arid regions increase the PM levels. Table 1.2: Climatic Regions of Gujarat Region Districts Climate Rainfall (mm) Soil Southern Hills Dang &Valsad Semi arid dry sub humid 1793 Deep black and coastal alluvial Southern Gujarat Surat, Bharuch Semi arid dry sub humid 974 Deep black and coastal alluvial Middle Gujarat North Gujarat Vadodara, Kheda, Panchmahals Ahemdabad, Mehsana,Gandh inagar, Semi arid 94 Medium black Arid 735 North west arid Kachchh Arid 34 Gray brown costal alluvial Gray brown Deltic alluvial North Saurashtra South Saurashtra Amreli, Bhavnagar, Jamnagar, Semi Arid 537 Junagadh Dry sub humid 844 Medium Black Calcarous Costal Alluvium Medium blacks Source:GEC Report 27 Page 4


22 Section I Pressure In Gujarat, winters are mild, pleasant, and dry with average daytime temperatures of 29 C and average night time temperature of 12 C with 1 percent sunny days and clear nights. The summers are extremely hot and dry with average daytime temperatures of 41 C and average night time temperature of 29 C. Monsoon season starts around mid June. During monsoon, the average day temperatures gets lowered to 35 C and average night time temperature to 27 C, however, this season has high humidity levels. The northern region receives a rainfall ranging from 51 to 12 centimeters; whereas the southern region receives 76 to 152 centimeters of rainfall. Rainfall in the southern regions of Saurashtra and the Gulf of Cambay is low compared to the other parts of Gujarat. Gujarat receives more than 3 to 32 hours of bright sunshine in a year and more than 2 kwh/m2/year of global solar radiation. Fig 1.1: Climate in Gujarat Fig 1.2: Soil Map of Gujarat Source: SOE 25 Source: SOE 25 Page 5


23 Section I Pressure Table 1.3: Climate in Gujarat Sr. No. Criteria Details 1. Summer Temperature Day: ºC, Night: 27 to 32 ºC. 2. Winter Temperature Day: 1 25 ºC Night: 4 1 ºC 3. Relative Humidity 2 25 % in dry periods % in wet periods 4. Annual Precipitation 5 13 mm 5. Wind Strong winds during monsoons from the southeast and dry cold winds from the north-east. In summer, the winds are hot and dusty. Source: SP25, National Building Code of India 25, Bureau of Indian Standards, New Delhi, 25 Fig 1.3: Physiography in Gujarat Fig 1.4: Rainfall in Gujarat Source: SOE 25 Source: SOE 25 Page 6

24 Section I Pressure Population Growth & Urbanisation Gujarat has witnessed a decent growth in its population in the last 6 years. From a small figure of Lacs in 1951, the population was more 6.3 crores in 211. Gujarat is now the 1th most populous state of India and has 5 per cent share of the country's population with a 6 per cent share of geographical area. Gujarat's population has increased by 97,12,611 during the decade of 21 to 211. The urban population has seen a rise from per cent in 21 to per cent in 211, making it one of the fastest growing urbanised states. In terms of Population, Ahmedabad is the largest city of Gujarat and Surat and Vadodara are at number two and three. Rajkot is the fourth largest city. The districts like Bhavnagar, Bhuj, Junagadh and Jamnagar have a high percentage of urban population. The concentration of population in urban centers exerts huge pressure on land, air and water quality. Ahmedabad ranks 52 nd and Surat 77 th in the list of most populated urban cities in the world. The broad changes in the state of Gujarat since census 21 are as follows: Table 1.4: Increase in Number of Towns in Gujarat Sr. No. Level Variation 1 Districts Talukas Towns Statutory Towns Census Towns Industrially Notified Area Villages Source: Census 211 Statutory Town (ST): All places with a municipality, corporation, cantonment board or notified town area committee etc. Census Town (CT): Places that satisfy the following criteria are termed as Census Towns. a)minimum population of 5; b) At least 75% of the male main working population engaged in non-agricultural pursuits; c) A density of population of at least 4 per sq. km. Population characteristics of Gujarat highlight that three districts of Ahmedabad, Surat and Vadodara contribute to 29% of the population of Gujarat. Nearly 5% of the state s population resides in 7 districts viz. Ahmedabad, Surat, Vadodara, Rajkot, Banaskantha, Bhavnagar and Junagadh. Surat has the highest decadal growth rate and population density, though urban population is maximum in Ahmedabad Disrict. It can be noted that the characteristics of a district depend on the size of urban centers belonging to it. Page 7
25 Population Decadal Growth Rate % of State Population % Rural % Urban Population Density Section I Pressure Table1.5: Population Characteristics in Gujarat 211 Sr. No. DISTRICT 1 Ahmedabad Amreli Anand Banaskantha Bharuch Bhavnagar Dahod Gandhinagar Jamnagar Junagadh Kachchh Kheda Mehsana Narmada Navsari Panchmahal Patan Porbandar Rajkot Sabarkantha Surat Surendranag ar Tapi The Dang Vadodara Valsad Gujarat India Source: Provisional Population Totals, Census of India 211 The State with a percent urban population in 211 has 3 urban centers with more than 1 lac population. Seven Municipal Corporations contribute to percent of the total urban population of the state. Page 8
26 Section I Pressure Table 1.6: Cities Having Population 1 lac & Above Sr. No. Dist Code City Population 1 7 Ahmedabad (M Corp.) 5,57, Surat (M Corp.) 4,462, Vadodara (M Corp.) 1,666, Rajkot (M. Corp) 1,286, Bhavnagar (M Corp.) 593, Jamnagar (M Corp.) 529, Junagadh (M Corp.) 32, Gandhidham (M) 248, Nadiad (M) 218, Gandhinagar (NA) 28, Anand (M) 197, Morvi (M) 188, Mahesana (M) 184, Surendranagar Dudhrej (M) 177, Bharuch (M) 168, Vapi (M) 163, Navsari (M) 16, Veraval (M) 153, Porbandar (M) 152, Bhuj (M) 147, Godhra (M) 143, Botad (M) 13, Palanpur (M) 127, Patan (M) 125, Jetpur Navagadh (M) 118, Valsad (M) 114, Kalol (M) 112, Gondal (M) 112, Deesa (M) 111, Amreli (M) 15,98 Source: Provisional Population Totals, Census of India 211 Page 9


27 Section I Pressure Urban Heat Islands The air temperatures in densely built urban areas are often higher than the temperatures of the surrounding countryside. The term urban heat island refers to increased surface temperatures in some pockets of a city, caused by an ever changing microclimate. The difference between the maximum city temperature (measured at the city center) and the surrounding countryside is the urban heatisland intensity. The density of the built environment and the extent of tree cover or vegetation primarily affect the heat-island intensity. Pollution and heat due to vehicular traffic, industrialisation and human activities are other contributing factors. The heat released from combustion of fuels also adds to the ambient temperature of a city. The hot and still anti-cyclonic weather conditions that are responsible for intense urban heat island events also produce high air pollution levels. The chemical reactions that produce ozone and smog are accelerated by high temperatures whilst low wind speeds ensure that the heat and pollution remains trapped in the city. Climate Variables affecting Heat Island are temperature, wind speed, solar irradiance & cloud cover, relative humidity and precipitation. Very few Heat island studies have been conducted so far and the pressure of Heat Island in urban India is deliberated only in some conferences, seminars and papers published in various journals. Remote Sensing and image processing tools are used to analyse the heat island phenomenon. Detailed studies for Heat Island Intensity of Gujarat cities are not available. It is likely that Amedabad and Surat may have a high Heat Island Intensity due to high urbanization, vehicular growth and industrialisation. Vadodara and Rajkot with their urban expansion and reducing tree cover may also possess moderate Heat Island Intensity Industrialisation Gujarat has continued to witness impressive industrial development. Government of Gujarat while announcing Industrial Policy in 23 and 29 had given strong emphasis on making Gujarat based industries competitive enough to meet with challenges of globalization. For this purpose Government also announced various schemes such as assistance for cleaner technology, upgradation of technology for manufacturing and environmental management system, subsidy for R & D activities and interest subsidy to SMES etc. An important feature of the Industrial Policy is the scheme of cluster development. In the state, 83 clusters have been identified with a range of industries. They are being Page 1

28 Section I Pressure strengthened with Government assistance in the form of developing common facilities centers, up gradation of infrastructure, conducting training programmes for skill up gradation etc. Gujarat Industrial Development Corporation is the agency responsible for developing industrial estates in the State & industrial units get developed plots/sheds with all amenities for setting up their units. There are 182 industrial estates spread throughout the State covering an area of 32 hectares. Also 6 SEZs have been notified in the State so far. SIR Act was enacted by the State in 29 for creating large size investment regions in the State and to develop these regions as global hubs of economic activity having world class infrastructure. Eleven such SIRs have been notified so far and are at various stages of planning and development. Delhi-Mumbai Industrial Corridor is an industrial development to be facilitated along the proposed Dedicated Rail Corridor connecting Delhi to Mumbai covering an overall length of 1483km.Gujarat contributes a staggering 38% to this proposed corridor with six investment zones and industrial areas along this corridor. Fig 1.5: Industrial Estates, SEZs, SIRs & DMIC Nodes in Gujarat Source: GIDC & Perspective Plan DMIC The total number of industries having pollution potential as registered with Gujarat Pollution Control Board as on 2/5/212 is The details are shown below. Page 11

29 Section I Pressure Table 1.7: Industries Registered with GPCB Details of Industries Number Total industries registered with GPCB Industries falling under Water Act 1932 Industries falling under Air Act 1659 Industries falling under Hazardous Waste Rules Industry under Red category 1378 Industry under Orange category 4694 Industry under Green category 3651 Small Scale industries Medium Scale Industries 984 Large Scale Industries 26 Source: GPCB Red category industries have the maximum pollution potential, orange medium and green industry have low potential. This classification has been provided by the Central Pollution Control Board. (pl refer Ann I for industrial sectors covered under Red/Orange/Green categories). Table 1.9 lists the industries with air pollution potential registered with GPCB. The jurisdiction area of various Regional Offices of GPCB is shown in Fig 1.6. Fig 1.6: Jurisdiction Area of Regional Offices of GPCB Source: GPCB Page 12
30 Section I Pressure Table 1.8: Distribution of Air Polluting Industries in Gujarat (as on 2/5/212) Source: GPCB Sr. No. RO name Air Polluting Units 1 Ahmedabad Anand Ankleshwar 12 4 Bharuch Bhavnagar 75 6 Bhuj Gandhinagar Godhra Himatnagar Jamnagar Jetpur Junagadh Mehsana Nadiad Navsari Palanpur Porbandar Rajkot Surat SurendraNgr Vadodara Vapi 1353 Total 1659 Note: Gandhinagar RO also covers rural areas of Ahmedabad district, therefore number of Air Polluting Industries is high under this RO. Of the 17 most polluting categories classified, Gujarat has 15 categories except Tannery and Zinc Smelters. (Table 1.1) Page 13
31 Section I Pressure Table 1.9: Large Industries under 17 Most Polluting Categories (28/2/212) Sr. No. CPCB Category Operational 1 Chlor Alkali 6 2 Aluminium 1 3 Cement 23 4 Copper 1 5 Dyes & Intermediates 57 6 Distillery 7 Fertilizers 8 8 Iron & steel 2 9 Oil Refineries 5 1 Pulp & Paper Petrochemicals Pesticides Pharmaceuticals Sugar Tannery 16 Thermal Power Zinc Source: GPCB Page 14

32 Section I Pressure Power Sector In Gujarat, private sector contributes 6 % and public sector contributes 4% to the total power generation. Power generation is largely coal based and there is no nuclear power generation in the state. Thermal Power including coal, gas and diesel as fuel, contributes 8% to the total power generation in the State. Hydro power and renewable energy contribute 5.3% and 15% respectively. In Renewable energy, solar energy has a contribution of 3%, biomass 1% & remaining is wind energy. The installed capacities are shown in Table 1.1 and Power generation from fossil fuels contribute heavily to the carbon footprint. It is expressed as grams of CO 2 equivalent per kilowatt hour of generation (gco 2 eq/kwh). The carbon footprint of fossil-fuelled power plants is dominant due to emissions during their operation. Indirect emissions during other life-cycle phases such as raw material extraction and plant construction are relatively minor. Coal burning power systems have the largest carbon footprint of all the power generation systems. Generation technologies based on non-fossil fuel such as wind, solar (photovoltaic), hydro, biomass, wave/tidal and nuclear power are 'low carbon' or 'carbon neutral' because they do not emit CO 2 during their operation. However, they are not 'carbon free' since CO 2 emissions arise in other phases of their life cycle such as during extraction, construction, maintenance and decommissioning. S. No. Source Carbon footprint range (gco 2 eq/kwh) 1. Conventional coal combustion systems ~1, or more 2. Gas powered electricity generation ~5 3. photovoltaic power systems ~6 4. hydro power schemes with storage ~ Run-of-river hydro power schemes ~ 5 6. Onshore and offshore wind plants ~ Onshore and offshore wind plants ~ Nuclear power generation ~5 Source: The 'carbon footprint' of power generation; Prakash Nayak, chairman, IET Power Panel Page 15

33 Section I Pressure Fig 1.7: Location of Thermal Power Plants in Gujarat Source: CEA & GPCL Page 16
34 Section I Pressure Table 1.1 Installed Capacity (MW) Public and Private Sector Particulars Total Capacity State (GSECL) 4995 (58%) 4996 (33%) 8792 (29%) State IPPs Owned 711 (8%) 1567(1%) 3276 (11%) Private IPPs 1445 (16%) 5563 (36%) Centre Share 1532(18%) 318 (21%) 1792 (35%) 7477 (25%) Table 1.11: Installed Capacity (MW) Thermal and Renewable Fuel MW % Coal Gas Lignite 14 7 Hydro Nuclear Total Page 17


35 Section I Pressure Fig 1.8: Fuel Wise Distribution in Installed Capacity - 31/3/212 Nuclear Hydro 4% Lignite 5% 7% Gas 27% Coal 57% Page 18

36 Section I Pressure Fig 1.9: Percentage of Renewable Energy Sources in Gujarat solar 3% biomass 1% wind 96% Source: GEDA Mining Among the air polluting sectors, minerals industry ranks among the top. The impact of mining on air starts from exploration phase, increases manifold during operational phase and may even extend beyond the mine closure. The fugitive emission is a common phenomena related to mining, which is very significant in case of open cast mining as compared to underground mines. In addition, waste handling, transportation and its storage also have high dust potential. The intensity of dust generation in the mine lease area are also influenced by various factor such as wind speed, hardness of the rock, mining technology, mode of transportation and level of mechanisation. Inadequate dust suppression measures and poor mine management practices may, sometime, also cause widespread impact on local public health and occupational diseases. Page 19

37 Section I Pressure Table 1.12: Mining activities and potential sources of air pollution Pollution Dust pollution Dust and gaseous pollutants like sulfur dioxide and oxides of nitrogen Air pollution and water pollution Mining activities Drilling, Loading operation, Haul road, Crushing and Storage of ore, Solid waste handling & handling Blasting, Transportation Tailing waste Source: Centre for Science and Environment, New Delhi Figure 1.11 shows the mining areas in Gujarat. District wise distribution of mining areas in the State is shown in Table According to the Map, mining covers only.33% of the total state area. Kachchh with km2 has maximum area under mining in the state. But mining contributes only.62% to landuse of the total district area. Sabarkantha has highest percentage in landuse under mining (.115%). Mining in Gujarat is usually done for production of Agate, Steatite, Gypsum, Limestone, Lignite, Bauxite, Laterite, Dolomite, Clay (others), China Clay, Bentonite, Quartz,Silica sand and Chalk. Fig 1.1: Mining Areas in Gujarat Source: LULC Info (25-6) Bhuvan beta Thematic Services Map Page 2

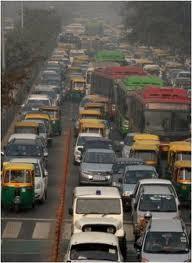
38 Section I Pressure Table 1.13: District wise Distribution of Mining Area in Gujarat Sr. No. District Area km2 Mining Area km2 % Area under Mining Gujarat Kachchh Sabarkantha Surendranagar Panchmahals Kheda Rajkot Vadodara Amreli Bhavnagar Junagarh Jamnagar Patan Ahmedabad Surat Mahesana Source: LULC Info (25-6) Bhuvan beta Thematic Services Map Vehicular Growth The increasing urbanisation and industrialisation has increased demand for transport. Public transport systems have not been able to keep pace with the rapid and substantial increases in demand over past few decades. The urban road chaos is increasing day by day with ever increasing share of personalized modes especially of two wheelers and four wheelers. Infrastructure shortages are evident with traffic snarls and grid locks. Bus services in particular have deteriorated and their relative output has been further reduced as passengers have turned to personalised modes and intermediate public transport (such as three-wheelers and taxis). Major Factors contributing to poor air quality on road are as below: Congestion Low speeds on major corridors Fleet sizes of public transport Increase in trip lengths due to urban sprawl Operating buses in congested streets Increase in purchase power of people Completely inadequate facilities for cycling Page 21
39 Section I Pressure Vehicular air pollution is one of the major contributors to overall air pollution in any area. The continuous rise in the number of vehicles is adding to the problem. The pollutants in vehicular pollution like carbon monoxide, sulphur, nitrogen oxide, hydrocarbon, lead, sulphur dioxide, and particulate matter affect human health and cause diseases like cold, cough, asthma, headache, cancer etc. The vehicular population in the last decade has grown from to (133.2%) in Gujarat. In 211 major contributor to the fleet are the two wheelers forming 73.17%, followed by private cars and goods vehicles as seen in Fig Tractors, 3.41 Fig1.11 Categorywise Distribution of Vehicles In Gujarat (31/3/211) Trailors, 2.27 Other Vehicles(including Ambulance),.35 Goods Vehicles, 5.22 Passenger Vehicles,.65 Private Cars, 9.37 Taxi Cab,.38 Jeeps, 1.24 Two Wheelers, Autorikshaw, 3.93 Source: Office of Transport Commissioner Growth of vehicle fleet in Gujarat from 1961 to 211 is shown in Table In 1961, there were maximum number of private cars (36.84%) followed by goods vehicles (25.76%). Two wheelers formed only 18.81% of total vehicular population. The percentage of two wheelers was 73.17% in 211, private cars formed 9.37% and good vehicles only 5.22%. Proportion of other categories of vehicles has almost remained same. Passenger vehicles in 211 contribute only.65% to the total number. In Table 1.14, actual numbers of private cars, taxi cabs, jeeps, autorickshaws, tractors, trailors and other Vehicles (Including ambulance) have been taken and the rest are covered as under: Goods Vehicles Passenger Vehicles Two Wheelers Trucks Tankers 3Wheel Vehicles Other Light Vehicles State Carriage Contract Carriage Maxi Cabs School Buses Priv.Serv.Vehicles Police Vans Motorcycles/Scooters Mopeds Page 22
40 Total Other Vehicles (including Ambulance) Trailors Tractor s Two Wheelers Autorik shaw Jeeps Taxi Cab Private Cars Passenger Vehicles Goods Vehicles Type of Vehicle 1961 % of total vehicle 1971 % of total vehicle 1981 % of total vehicle 1991 % of total 21 % of total vehicle 211 % of total vehicle Section I Pressure Table 1.14: Growth of Vehicular Population in Gujarat over decades Source: Transport Department Page 23
41 No. of Vehicles (') Section I Pressure 14 Fig 1.12: Vehicle Population : All Vehicles Source: Office of Transport Commissioner From the total fleet of vehicles, non transport vehicles are more than 85% and transport vehicles form the remaining 15%. Trends of last decade show that proportion of non transport vehicles has increased from 85 % to 87% and transport vehicles reduced in the same proportion. The Transport and Non Transport vehicles are categorized as under: 2-3 All Vehicles Transport Vehicles Goods Vehicles Truck/ Lorries Tankers Wheeler Goods Vehicles Other Light Goods Vehicles Passenger Vehicles Buses Maxi-Cab School Bus Private Service Vehicles Taxi Auto-Rickshaw Non Transport Vehicles Police Van Motor Car& Station Wagons Jeep Tractor Motor Cycle Scooters Mopeds Others Ambulance Trailors Page 24
42 Number Section I Pressure Fig 1.13:Transport and NonTransport Vehicles in Gujarat Transport NonTransport Total Source: Office of Transport Commissioner RTO wise Vehicle Distribution There are 27 RTO and ARTOs in Gujarat. The Dangs district is dealt by Valsad RTO whereas Surat district consists of two RTOs, viz in Surat & Bardoli. The RTO of Vyara is constituted for Tapi District. The trend for proportion of vehicles in each district is similar to that of the state. But the proportion of two wheelers in districts of Rajkot, Dahod, Navsari, Rajpipla, Surat and Vyara is more than 8% of the total vehicle fleet. Detailed vehicular information from till 211 is provided in Annexure IV. Page 25
43 Goods Vehicle Passenger Vehicle Auto Rickshaw 2Wheeler Tractor Trailor Other Section I Pressure Table 1.15: Distribution of Vehicles in Various RTOs of Gujarat RTO Year Total Ahmedabad Mahesana Rajkot Bhavnagar Surat Vadodara Page 26
44 Goods Vehicle Passenger Vehicle Auto Rickshaw 2Wheeler Tractor Trailor Other Section I Pressure RTO Year Total Nadiad Palanpur Himmatnagar Jamnagar Junagarh Page 27
45 Goods Vehicle Passenger Vehicle Auto Rickshaw 2Wheeler Tractor Trailor Other Section I Pressure RTO Year Total Bhuj Surendranagar Amreli Valsad Page 28
46 Goods Vehicle Passenger Vehicle Auto Rickshaw 2Wheeler Tractor Trailor Other Section I Pressure RTO Year Total Bharuch Godhara Gandhinagar Bardoli Dahod Page 29
47 Goods Vehicle Passenger Vehicle Auto Rickshaw 2Wheeler Tractor Trailor Other Section I Pressure RTO Year Total Navsari Patan Porbandar Rajpipla Anand 2-21 Page 3
48 Goods Vehicle Passenger Vehicle Auto Rickshaw 2Wheeler Tractor Trailor Other Section I Pressure RTO Year Total Vyara GUJARAT Source: Office of Transport Commissioner Note: The year wise and RTO wise vehicle details for the period V TO is presented in Annexure IV. Page 31
49 Section I Pressure Vehicle Distribution in Urban Centers In Urban centers of Ahmedabad, Surat, Vadodara and Rajkot, two wheelers form the largest proportion of vehicle fleet, followed by three wheeler and four wheelers. Following figure shows the population of these vehicles upto March 29. Fig 1.14: Distribution of Vehicles in Major Urban Centers of Gujarat Ahmedabad as on 31/3/29 6% 16% 78% 2 Wheelers 3 Wheelers 4 & more Vadodara as on 31/3/28 5% 15% 8% 2 Wheelers 3 Wheelers 4 & more Page 32
50 Section I Pressure Surat as on 31/3/29 5% 12% 83% 2 Wheelers 3 Wheelers 4 & more Rajkot as on 31/3/28 3% 17% 8% 2 Wheelers 3 Wheelers 4 & more Source: Office of Transport Commissioner Fuel Usage Table 1.16 shows retail sales of petrol and diesel in Gujarat. More than 9% of sale of these fuels is through public sector companies ie IOC, BPCL and HPCL. With conversion of vehicles to cleaner technologies, slight change is observed in consumption of petrol and diesel from 29 onwards. Page 33
51 Section I Pressure Table 1.16: Retail Fuel Sale Details for Gujarat Petrol - Retail Sales (in KL) IOC BPC HPC IBP RIL ESSAR Total % increase 3% 6% 5% 11% 9% PSU Subtotal PSU % 77% 78% 9% 98% 94% 92% HSD - Retail Sales (in KL) IOC BPC HPC IBP RIL ESSAR Total % increase 6% 2% 7% 9% 9% PSU Subtotal PSU % 67% 76% 93% 98% 88% 9% Source: IOCL Ahmedabad Page 34
52 Total Vehicles % increase HSD % increase MS % increase CNG % Increase Section I Pressure Retail CNG Sales Due to Government initiative to promote switching over of the vehicles to cleaner fuel CNG, the retail network started getting established in Gujarat since 26. Following table shows percentage change in sale of petrol, diesel and CNG for the years 27-8 to The percentage increase in sale of CNG is higher than petrol and diesel. Table 1.17: Vehicular Growth and Fuel Consumptionis % % % % % % % % % % % % Source: IOCL Ahmedabad Travel Mode Characteristics Ahmedabad district contributes 2% to the total vehicular population of Gujarat. In the City, trips by two wheelers form 45.2% of the total trips followed by bicycles and buses % of the commuting population still walks to its destination. The trips by Public Transport are meagre 8.97%. (Fig 1.17). Page 35

53 Section I Pressure Fig 1.15: Travel Mode Chracteristics-Ahmedabad % 8.97% 16.77% 4.96% 45.2% 19.66% Walk Bicycle TW Car Auto Rickshaw Bus Source: CEPT, Ahmedabad Indoor Air Pollution A considerable amount of air pollution results from burning of fossil fuels. The household sector is the second largest consumer of energy in India after the industrial sector. National Family Health Survey-3 (NFHS-3) found that 71% of India's households use solid fuels for cooking whereas this figure is 91 % for rural households. According to the same survey, more than 6% of Indian households depend on traditional sources of energy like fuel-wood, dung and crop residue for meeting their cooking and heating needs. Burning of traditional fuels produces large quantities of CO 2 in the atmosphere, but if there is an incomplete combustion followed by oxidation, CO is produced in addition to hydrocarbons. Sick Building Syndrome is a growing concern worldwide. Smoke from solid cooking fuels such as wood, charcoal, and animal dung leads to a range of serious health problems including respiratory infections, low birth weight, and eye problems. Prevalence of TB can be associated to type of house and main cooking fuel. Page 36
54 Section I Pressure Fig 1.16: Fuel 1.5 Usage for Rural Gujarat at HH Level NFHS Wood Coal/coke/lignite/charcoal Crop residues Dung cakes Electricity Kerosene LPG 78 Biogas Other Source: NFHS As the surveys suggest, Gujarat still has 77.3% rural population using unprocessed solid fuel. The improvement in 5 years from NFHS- 2 and NFHS -3 is marginal and usage of unprocessed fuel is reduced only by 4.7 % in rural areas. For a progressive state like Gujarat having abundant natural resources, this is an alarming figure. It indicates lack of implementation of national plans at the grass root level. Fig 1.17: Fuel Usage 1.4 for.7 Rural Gujarat at HH Level NFHS Wood Coal/coke/lignite/charcoal Crop residues Dung cakes Electricity Kerosene LPG Biogas Other Source: NFHS Page 37
55 Fuel Usage in Percentage Section I Pressure Table 1.18: Percentage Usage of Fuel at Household level Sr. Proportion of Households by NFHS 2 CENSUS 21 NFHS 3 Type of Fuel Usage Urban Rural Urban Rural Urban Rural 1. Wood Coal/coke/lignite/charcoal Crop residues Dung cakes Unprocessed Solid Fuel Electricity Kerosene Liquid petroleum gas Biogas Other Cleaner Fuel Total Fuel Source: NFHS and Census Fig 1.18: Fuel Usage at Household level in Gujarat State Unprocessed Solid Fuel Cleaner Fuel Urban Rural 21 Urban 21 Rural 25-6 Urban 25-6 Rural Page 38


56 Section II- State
57
. In Gujarat there are 19 NAMP stations.")
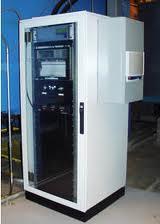
58 Section II State SECTION II - STATE An inventory of air pollutants is a necessary step towards control of air pollution. Central Pollution Control Board is executing a nation-wide programme of ambient air quality monitoring known as National Air Quality Monitoring Programme (NAMP). In Gujarat there are 19 NAMP stations. GPCB, on behalf of State government also monitors air quality at another 25 stations under State Ambient Air Quality Monitoring Programme (SAMP). There are another set of stations where air monitoring is done only once in a year. HC and CO are also monitored at three stations in Vadodara - CETP Nandesari, RO GPCB and Dandiya Bazar. Fig 2.1: Air Quality Monitoring Stations in Gujarat Source: GPCB Based on the annual mean concentration in microgram per cubic metre of ambient air (μg/m3); levels of SO2, NO2, SPM have been described as Low (L), Moderate (M), High (H) and Critical (C) for various regions such as Industrial (I), Residential and mixed use (R) areas as per the classification shown in Tables 2.1. Page 39
59 Section II State Table 2.1: Classification of Air Quality Pollution Level Industrial (I) Residential (R ) SO2, NOx RSPM SPM SO2, NOx, RSPM SPM Low (L) Moderate (M) High (H) Critical (C ) >12 >18 >54 >9 >21 Source: CPCB (25) Note: Classification is based on the ambient air quality standards which were applicable before 18th Nov 29. The data presented for SO2, NOx, SPM, RSPM for the period 26 to Dec 21 uses this classification as the monitoring of new parameters was not initiated in the State. All the monitoring stations are classified into residential or industrial depending upon their characteristics. 2.1 Trends in Annual Average Concentration of SO 2 in Residential Areas The trends for SO 2 in Residential Areas in the last five years show that the values are well within the permissible limits. Table 2.2: Annual Averages- SO2 in Residential Areas Sr. No. Location City District Behrampura referl Hospital 2 Cadila Laboratories Ahmedabad Ahmedabad Ahmedabad Ahmedabad LD Engg College Ahmedabad Ahmedabad Naroda,S.P.Ring Road Ahmedabad Ahmedabad NA Nava vadaj Ahmedabad Ahmedabad NA R.C Tech High School Ahmedabad Ahmedabad Page 4
60 Section II State Sr. No. Location City District Satelite Ahmedabad Ahmedabad NA Durga Traders Ankleshwar Bharuch Piramal Vill. Ankleshwar Bharuch NA Fisheries Office Jamnagar Jamnagar GPcb Office Jamnagar Jamnagar NA Fire Brigade Station Rajkot Rajkot NA GPCB Office Rajkot Rajkot Air India Building Surat Surat Delhi GatePolice chowki Surat Surat NA SVR Engg College Surat Surat Bapod Vadodara Vadodara NA Chhani Vadodara Vadodara NA Dandiya Bazzar Vadodara Vadodara Gotri Vadodara Vadodara NA GPCB Office Vadodara Vadodara Nagar Palika Vapi Valsad Page 41
61 Section II State 2.2 Trends in Annual Average Concentration of SO 2 in Industrial Areas The trends for SO 2 in Industrial Areas in the last five years show that the values are well within permissible limits. Only at one location in Surat, SO 2 is relatively high but it is still within the permissible limits. Table 2.3: Annual Averages- SO2 in Industrial Areas Sr. No. Location City District Mukesh Industries Ahmedabad Ahmedabad NA Naroda GIDC Ahmedabad Ahmedabad Shardaben Hospital 4 Vatva-Odhav, S.P.Ring Road 5 Alang-ship Breaking Yard Ahmedabad Ahmedabad Ahmedabad Ahmedabad NA Alang Bhavnagar NA Rallis India Ankleshwar Bharuch Valia Road Ankleshwar Bharuch NA Lunwa Bhachau Kutcch NA Chitra GIDC Bhavnagar Bhavnagar NA Sosiya Ship Breaking Yard 11 Gandhidham - Kandla Bhavnagar Bhavnagar NA Kandla Kutcch NA Morbi GIDC Morbi Rajkot NA Near Sardhara Corpn 14 High Choice Processors Rajkot Rajkot Surat Surat NA Kadodara Surat Surat NA Page 42
62 Section II State Sr. No. Location City District BRC Highschool Udhna Surat GIDC Nandesari Vadodara Vadodara GEB Vapi Valsad GIDC Estate Vapi Valsad NA Gpcb Office Vapi Valsad NA Wankaner Gidc Wankaner Rajkot NA Trends in Annual Average Concentration of NOx in Residential Areas The trends for NOx in Residential Areas in the last five years show that the values are well within the permissible limits. Table 2.4: Annual Averages- NOx in Residential Areas Sr. No. Location City District Behrampura referl Hospital 2 Cadila Laboratories Ahmedabad Ahmedabad Ahmedabad Ahmedabad LD Engg College Ahmedabad Ahmedabad Naroda,S.P.Ring Road Ahmedabad Ahmedabad NA Nava vadaj Ahmedabad Ahmedabad NA R.C Tech High School Ahmedabad Ahmedabad Satelite Ahmedabad Ahmedabad NA Durga Traders Ankleshwar Bharuch Page 43
63 Section II State Sr. No. Location City District Piramal Vill. Ankleshwar Bharuch NA Fisheries Office Jamnagar Jamnagar GPcb Office Jamnagar Jamnagar NA Fire Brigade Station Rajkot Rajkot NA GPCB Office Rajkot Rajkot Air India Building 15 Delhi GatePolice chowki 16 SVR Engg College Surat Surat Surat Surat NA Surat Surat Bapod Vadodara Vadodara NA Chhani Vadodara Vadodara NA Dandiya Bazzar Vadodara Vadodara Gotri Vadodara Vadodara NA GPCB Office Vadodara Vadodara Nagar Palika Vapi Valsad Trends in Annual Average Concentration of NOx in Industrial Areas The trends for NOx in Industrial Areas in the last five years show that the values are well within permissible limits. Only at GIDC Nandesari, NOx is relatively high but it is still within the permissible limits. Page 44
64 Section II State Table 2.5: Annual Average - Nox in Industrial Areas Sr. No. Location City District Mukesh Industries Ahmedabad Ahmedabad NA Naroda GIDC Ahmedabad Ahmedabad Shardaben Hospital 4 Vatva - Odhav, S. P. Ring Road 5 Alang-ship Breaking Yard Ahmedabad Ahmedabad Ahmedabad Ahmedabad NA Alang Bhavnagar NA Rallis India Ankleshwar Bharuch Valia Road Ankleshwar Bharuch NA Lunwa Bhachau Kutcch NA Chitra GIDC Bhavnagar Bhavnagar NA Sosiya Ship Breaking Yard 11 Gandhidham - Kandla Bhavnagar Bhavnagar NA Kandla Kutcch NA Morbi GIDC Morbi Rajkot NA Near Sardhara Corpn 14 High Choice Processors Rajkot Rajkot Surat Surat NA Kadodara Surat Surat NA BRC Highschool Udhna Surat GIDC Nandesari Vadodara Vadodara GEB Vapi Valsad Page 45
65 Section II State Sr. No. Location City District GIDC Estate Vapi Valsad NA Gpcb Office Vapi Valsad NA Wankaner Gidc Wankaner Rajkot NA Trends in Annual Average Concentration of SPM in Residential Areas SPM values at all monitoring stations in Residential areas are above the permissible limits. Only two locations at Bapod and GPCB office in Vadodara show the values to be lower than the permissible limits during the years 28, 29 and 21. Table 2.6: Annual Averages- SPM in Residential Areas Sr. No. Location City District Behrampura referl Hospital Ahmedabad Ahmedabad Cadila Laboratories Ahmedabad Ahmedabad LD Engg College 4 Naroda, S.P.Ring Road Ahmedabad Ahmedabad Ahmedabad Ahmedabad NA Nava vadaj Ahmedabad Ahmedabad NA R.C Tech High School Ahmedabad Ahmedabad Satelite Ahmedabad Ahmedabad NA Durga Traders Ankleshwar Bharuch Piramal Vill. Ankleshwar Bharuch NA Page 46
66 Section II State Sr. No. Location City District Fisheries Office Jamnagar Jamnagar GPcb Office Jamnagar Jamnagar NA Fire Brigade Station Rajkot Rajkot NA GPCB Office Rajkot Rajkot Air India Building Surat Surat Delhi GatePolice chowki Surat Surat NA SVR Engg College Surat Surat Bapod Vadodara Vadodara NA Chhani Vadodara Vadodara NA Dandiya Bazzar Vadodara Vadodara Gotri Vadodara Vadodara NA GPCB Office Vadodara Vadodara Nagar Palika Vapi Valsad Trends in Annual Average Concentration of SPM in Industrial Areas SPM values at all monitoring stations in industrial are within the permissible limits. Only Mukesh Industries and GIDC Naroda in Ahmedabad show values higher than the permissible limits. Mukesh Industries has shown consistently higher values since 27. Page 47
67 Section II State Table 2.7: Annual Averages- SPM in Industrial Areas Sr. No. Location City District Mukesh Industries 2 Naroda GIDC 3 Shardaben Hospital 4 Vatva- Odhav, S.P.Ring Road 5 Alang-ship Breaking Yard Ahmedabad Ahmedabad NA Ahmedabad Ahmedabad Ahmedabad Ahmedabad Ahmedabad Ahmedabad NA Alang Bhavnagar NA Rallis India Ankleshwar Bharuch Valia Road Ankleshwar Bharuch NA Lunwa Bhachau Kutcch NA Chitra GIDC Bhavnagar Bhavnagar NA Sosiya Ship Breaking Yard Bhavnagar Bhavnagar NA Gandhidham - Kandla Kandla Kutcch NA Morbi GIDC Morbi Rajkot NA Near Sardhara Corpn 14 High Choice Processors Rajkot Rajkot Surat Surat NA Kadodara Surat Surat NA BRC Udhna Surat Page 48
68 Section II State Sr. No. Location City District Highschool 17 GIDC Nandesari Vadodara Vadodara GEB Vapi Valsad GIDC Estate Vapi Valsad NA Gpcb Office Vapi Valsad NA Wankaner Gidc Wankaner Rajkot NA Trends in Annual Average Concentration of RSPM in Residential Areas RSPM values at all monitoring stations in residential areas are above the permissible limits. Fisheries office and GPCB office Jamnagar are consistently above critical level. Only two locations at Bapod and GPCB office in Vadodara have shown values to be lower than permissible limits. Table 2.8: Annual Averages- RSPM in Residential Areas Sr. No. Location City District Behrampura referl Hospital Ahmedabad Ahmedabad Cadila Laboratories Ahmedabad Ahmedabad LD Engg College Ahmedabad Ahmedabad Naroda,S.P.Ring Road Ahmedabad Ahmedabad NA Nava vadaj Ahmedabad Ahmedabad NA R.C Tech High School Ahmedabad Ahmedabad Satelite Ahmedabad Ahmedabad NA Page 49
69 Section II State Sr. No. Location City District Durga Traders Ankleshwar Bharuch Piramal Vill. Ankleshwar Bharuch NA Fisheries Office Jamnagar Jamnagar GPcb Office Jamnagar Jamnagar NA Fire Brigade Station Rajkot Rajkot NA GPCB Office Rajkot Rajkot Air India Building 15 Delhi GatePolice chowki 16 SVR Engg College Surat Surat Surat Surat NA Surat Surat Bapod Vadodara Vadodara NA Chhani Vadodara Vadodara NA Dandiya Bazzar Vadodara Vadodara Gotri Vadodara Vadodara NA GPCB Office Vadodara Vadodara Nagar Palika Vapi Valsad Page 5
70 ug/m3 ug/m3 Section II State 12 1 Fig 2.2: RSPM - Ahmedabad (Residential Areas) Location 14 Fig 2.3: RSPM - Vadodara (ResidentialAreas) Bapod Chhani Dandiya Bazzar Gotri GPCB Office Location Page 51
 12 1 8 6 4 2 26 27 28 29 21 Air India Building Delhi GatePolice chowki SVR Engg College Location 1 Fig 2.")
71 μg/nm3 μg/nm3 Section II State 14 Fig 2.4: RSPM - Surat (Residential) Air India Building Delhi GatePolice chowki SVR Engg College Location 1 Fig 2.5: RSPM - Rajkot (Residential Area) Fire Brigade Station Location GPCB Office Page 52
72 μg/nm3 Section II State 12 Fig 2.6: RSPM - Jamnagar (Residential Area) Fisheries Office Location GPcb Office 2.8 Trends in Annual Average Concentration of RSPM in Industrial Areas RSPM values at all monitoring stations in industrial are within the permissible limits. Mukesh Industries and GIDC Naroda in Ahmedabad show values to be higher than the permissible limits. Lunva Bhachau and GIDC Nandesari also exhibit the same characteristics. Table 2.9: Annual Average RSPM in Industrial Areas Sr. No. Location City District Mukesh Industries Ahmedabad Ahmedabad NA Naroda GIDC Ahmedabad Ahmedabad Shardaben Hospital Vatva- Odhav, S.P.Ring Ahmedabad Ahmedabad Ahmedabad Ahmedabad NA Page 53
73 Section II State Sr. No. Location City District Alang-ship Breaking Yard Alang Bhavnagar NA Rallis India Ankleshwar Bharuch Valia Road Ankleshwar Bharuch NA Lunwa Bhachau Kutcch NA Chitra GIDC Bhavnagar Bhavnagar NA Sosiya Ship Breaking Yard 11 Gandhidha m - Kandla Bhavnagar Bhavnagar NA Kandla Kutcch NA Morbi GIDC Morbi Rajkot NA Near Rajkot Rajkot Sardhara Corpn 14 High Choice Processors Surat Surat NA Kadodara Surat Surat NA BRC Highschool Udhna Surat GIDC Nandesari Vadodara Vadodara GEB Vapi Valsad GIDC Estate 2 Gpcb Office 21 Wankaner Gidc Vapi Valsad NA Vapi Valsad NA Wankaner Rajkot NA Page 54
74 Jun-11 Jul-12 Aug-12 Sep-12 Oct-12 Nov-12 Dec-11 Jan-12 Feb-12 Mar-12 Standard ug/m3 Section II State 24. Fig 2.7: RSPM levels at Important Industrial Locations Location Note: In addition to above stations, GPCB also monitors the air quality at certain locations only once in a year. The details of these stations and observed ambient air quality values for various parameters are provided in Annexure II. 2.9 Trends in PM 2.5 in Ahmedabad Ambient air quality standards with respect to PM 2.5 have been notified since 18 th Nov 29. GPCB initiated monitoring of this parameter in Ahmedabad since June 211. The monthly averages for these stations are provided in following Table 2.1. Table 2.1: PM 2.5 for Ahmedabad Location GIDC Naroda (Above Police Chowki) Cadila Laboratory, Narol Page 55
75 Jun-11 Jul-12 Aug-12 Sep-12 Oct-12 Nov-12 Dec-11 Jan-12 Feb-12 Mar-12 Standard Section II State Location L D Engineering College, Navrangpur Shardaben Hospital, Saraspur R C Technical School, Mirzapur Behrampura Referral Hospital Mukesh Ind Narol S P Ring Road Naroda, Nr HP Petrol Pump Satellite Area, Chinmay Seva Trust Vatva Odhav Ring Rd, Rel Petrol Pump Nehru Bridge Source: GPCB; All values in µg/nm 3 The trends for a few residential and industrial areas in Ahmedabad are graphically shown below. The values are compared with annual standards though we don t have annual average for this parameter as the monitoring was started recently. PM 2.5 is higher in winter months and lower in monsoon months. The calmer conditions in winter facilitate more stability to atmosphere and consequently reduce dispersion of pollutants generated and help in build up of pollutants in proximity of pollutant sources. Lower average mixing height in winter season results in less volume of troposphere available for mixing and results in higher SPM concentrations. Page 56
76 PM 2.5 Values in µg/nm3 PM2.5 Values in µg/nm3 Section II State Fig 2.8: GIDC Naroda(Above Police Chowki) - Industrial Area Jun-11 Jul-11 Aug-11 Sep-11 Oct-11 Nov-11 Dec-11 Jan-12 Feb-12 Mar-12 Month Jun-11 Fig 2.9: Nehru Bridge - Traffic Junction Jul-11 Aug-11 Sep-11 Oct-11 Nov-11 Dec-11 Jan-12 Feb-12 Mar-12 Month Page 57
77 PM 2.5 Valves in µg/nm3 Section II State Fig2.1: Satellite Area, Chinmay Seva Trust - Residential Area Jun-11 Jul-11 Aug-11 Sep-11 Oct-11 Nov-11 Dec-11 Jan-12 Feb-12 Mar-12 Month 2.1 Monitoring of VOCs VOCs are organic compounds with boiling points between 5 C to 26 C and vapour pressure equal to or more than.1 kpa at 25 C. The term encompasses a very large and diverse group of carbon containing compounds including aliphatic, aromatic and halogenated hydrocarbons, aldehydes, esters, acids, alcohols, ketones and others. The sources of Volatile Organic Compounds (VOCs) are numerous and broadly they can be divided into: 1. Natural (forests, termites, wetlands and tundras) 2. Anthropogenic (industrial namely manufacturing of paints, varnishes, solvents, chemical, fertilizers and petroleum refining and processing, fossil fuel combustion in transportation and electricity generation, landfills and waste treatment plants, and household products) Monitoring of VOCs has been initiated by GPCB for 25 industrial clusters in Gujarat. List of these clusters is shown in following table and location map is shown in Fig Page 58
78 Section II State Table 2.11: Ambient Air Quality Monitoring Stations for VOCs in Gujarat Sr. No. Name of Cluster Sampling Location 1 GIDC, Vapi, Valsad Club 3 Building 2 GIDC, Sarigam, Valsad Meckloyed Pharma, Road No.: 25, GIDC Sarigam 3 Hazira Area, Surat Ichachhapore Village 4 GIDC, Sachin, Surat Hi Choice Processors Pvt. Ltd. 5 GIDC, Pandesara, Surat Pandesara GIDC Office 6 GIDC, Ankleshwar, Bharuch Rallis (India) Ltd., Ankleshwar 7 Jagadia Industrial Estate, DCM Shreeram Pharma 8 Bharuch Dahej area, Bharuch Gujarat Alkali Chemical Ltd. 9 GIDC, Panoli, Bharuch Hikal Ltd., Plot No ECP Office, NR. IPCL, Vadodara ECPL Pump House, Chiku Wadi, Baroda 11 Nandesari, Vadodara Nandesari Common Effluent Treatment Plant 12 Savli, Vadodara Lubrizol Advanced Materials India Pvt. Ltd. 13 Ekalbara, Vadodara Above Mahuvad Fire Station, Near Transpec Company 14 GIDC, Odhav, Ahmedabad Odhav Industrial Association, L-23, GIDC Estate 15 GIDC, Naroda, Ahmedabad Udhyog Nagar Police Chowki, Naroda GIDC 16 GIDC, Vatva, Ahmedabad Vatva Industrial Association, GIDC Estate. 17 Changodar Bavala (Kerala Gmbell Healthcare (India) Pvt. Ltd. 18 GIDC), Ahmedabad GIDC, Chhatral, Kalol Sairam Industries, Chhatral GIDC, Gandhinagar 19 Sanand Area Loxim Industries Limited, Iyava Village, Sanand 2 Aji Vasahat / Morbi Wankaner Near Aji Vasahat, GIDC Rajkot 21 Moti Khavadi, Jamnagar Hirabhai Solanki s Terrace, Near Water Tank 22 GIDC, Chitra, Bhavnagar Plot No Mundra, Kutch Amrut Chamber, Baroi Road, Mundra. 24 Anjar, Kutch Gangotri, Plot No. 3, Anjar. 25 Bhachau-Gandhidham Road, Kutch Source: GEMI, Gandhinagar Lunva Bhachau, Kutch Page 59
79 Section II State Fig 2.11: Ambient Air Quality Monitoring Stations for VOCs in Gujarat Source: GPCB Monitoring is carried out fortnightly for these 25 clusters. Standard for annual average for VOCs is 5 ug/m3. Details for compounds within VOC for each station can be referred to in Annexure III. The following graphs shows the level of benzene in certain clusters where they have been found to be consistently higher. Please note that the values are not annual averages as VOC monitoring is a recent initiative by GPCB and annual averages were not available whereas standard is for annual average. Another interesting observation is that concentration of Benzo-a-pyrene is less than.5 ng/m3 in all clusters whereas standard for this is 1 ng/m3. Trends for benzene at select clusters are depicted in Fig 2.12 to Fig Page 6
80 Section II State Fig 2.12: Benzene Concentration -Pandesara May A May B June A June B July A JulyB 2 Fig 2.13: Benzene Concentration - Ankleshwar May A May B June A June B July A JulyB Fig 2.14: Benzene Concentration - Dahej May A May B June A June B July A JulyB Page 61
81 Section II State Fig 2.15: Benzene Concentration - Panoli May A May B June A June B July A JulyB Fig 2.16: Benzene Concentration - Naroda May A May B June A June B July A JulyB 1 Fig 2.17: Benzene Concentration - Vatva May A May B June A June B July A JulyB Page 62
82 Section II State 2.11 Noise Monitoring Noise is known to cause psychological stress in both human beings and animals. The source of noise could be domestic, industrial or vehicles. The permissible noise levels vary for different landuses. (Table 2.12) Table 2.12: Noise Standards Sr. No. Category Of Area Limits In db Day Time 6 am 1 pm Night Time 1 pm 6 am 1. Industrial Area Commercial Area Residential Area Silence Zone i.e. Hospital, Educational Institutes Etc. 5 4 Note: Day time is reckoned between 6 am to 1 pm. Night time is reckoned between 1 pm to 6 am. Silence zone is defined as areas up to 1 m around premises such as hospitals, educational institutions and courts. The silence zones are to be declared by the competent authority. Note: The noise levels are not monitored by GPCB on regular basis. This exercise is carried out only during Navratri and Diwali festivals. The number of noise monitoring done by each RO during these festivals is presented in following table. For getting the values, one can refer to the GPCB Annual Reports for these years. Page 63
83 Section II State Table 2.13: Noise Monitoring During The Navratri Festival Regional Office Number of Monitoring Station Year wise Ahmedabad Bharuch Bhavnagar Jamnagar Mehasana Rajkot Surat Vadodara Vapi Godhara Bhuj Junagarh Nadiad Gandhinagar Anand Source: GPCB Annual Reports Page 64
84 Section II State Table 2.14: Noise Monitoring During Diwali Festival Regional Office Number of Monitoring Station Year wise Ahmedabad Bharuch Bhavnagar Jamnagar Mehasana Rajkot Surat Vadodara Vapi Godhara Bhuj Junagarh Nadiad Gandhinagar Source: GPCB Annual Reports The ambient noise levels in Gujarat during the monitoring period at all time are above specified ambient noise standards. The fire cracker bursting and traffic are two important contributors of ambient noise. Residential areas are affected significantly by higher noise levels. The emission of smoke arising out of bursting of fire crackers add to increased levels of air pollution, particularly in terms of Nitrogen Oxides (NOx), SPM and Respiratory Suspended Particulate Matter. Page 65
85 Section II State 2.12 Odour Monitoring Most commonly reported odour-producing compounds are hydrogen sulfide (rotten egg odour) and ammonia (sharp pungent odour). Carbon disulfide, mercaptans, product of decomposition of proteins (especially of animal origin) phenols and some petroleum hydrocarbons are other common odorants. Most offensive odour is created by the anaerobic decay of wet organic matter such as flesh, manure etc. For example, odour originating from livestock manure is a result of a broad range of over 168 odour producing compounds. Warm temperature enhances anaerobic decay and foul odour production. Odour can arise from many sources and most of the sources are man-made. Garbage dumping on vacant land is a common phenomenon. It leads to foul smell due to putrefaction of dumped garbage, which lies uncollected for days together. Unscientific design of landfill & improper sewage treatment practices produce unpleasant odour. Industries such as Pulp & Paper, Fertilizer, Pesticides, Tanneries, Sugar & Distillery, Chemical, Dye & Dye Intermediates, Bulk Drugs & Pharmaceuticals, Large Livestock operations, Poultry Farms, Slaughter Houses, Food and Meat processing industries and Bone Mills are among major contributors to odour pollution. Agricultural activities like decaying of vegetation, production and application of compost etc. also contribute to odour pollution. In urban areas, improper handling of public amenities like toilets of cinema hall, bus / railway stations, hospitals, shopping complex etc. generate pungent odour, which affects the users as well as neighbourhood residents. Congested markets do not allow the escape of odour from markets, thus causing problems to shop-owners and customers. Vehicular sector also has its share in odour pollution. Rapidly growing vehicular population as well as pollutants emitted by them generate harmful and pungent odour. Measurement of Odour Pollution Of the five senses, the sense of smell is the most complex and unique in structure and organization. Sense of smell is accomplished with two main nerves. The olfactometry nerve (first cranial nerve) processes the perception of chemicals. The trigeminal nerve (fifth cranial nerve) processes the irritation or pungency (sensation) of chemicals. All olfactory signals meet in the olfactory bulb where the information is distributed to two different parts of the brain. One major pathway of information is to the limbic system which processes emotion and memory response of the body. The second major information pathway is to the frontal cortex. This is where conscious sensations take place, as the information is processed with other sensations and is compared with accumulated life experiences for the individual to possibly recognize the odour and make some decisions about the experiences. The entire trip, from nostril to signal in the brain, takes as little as 5 milliseconds. In India, Schedule II and Schedule VI (General standards for discharge of effluents) under Environmental (Protection) Rules, 1986 prescribe that all efforts shall be made to remove unpleasant odour as far as practicable. Nonetheless, there are only two industries, wherein industry specific standards under Schedule I of these Rules have made odour removal compulsory. These are the fermentation industries and the natural rubber industries. The standards for many other major odour pollution causing industries such as pulp and paper Page 66
86 Section II State mills, tanneries, meat processing industries, bulk drug and pharmaceutical units, food and fruit processing units, dairies and milk plants etc. do not specify odour control. However, several countries such as Australia, Belgium, Canada, Denmark, Germany, Japan, New Zealand, The Netherlands, United Kindom, United States have developed and adopted Legislations for measurement of odour. The EN was released in year 23 and now EN unifies the odour sampling and testing standards of 18 countries (Austria, Belgium, Denmark, Finland, France, Greece, Germany, Iceland, Ireland, Italy, Luxembourg, Netherlands,Norway, Portugal, Spain, Sweden, Switzerland, and the United Kingdom). Also EN follows ISO 9 quality assurance and scientific testing protocols. The new European standard EN has been adopted by Australia and New Zealand as AS / NZS 4323:3:21 (AS, 21) Hot Spots Major contributors to air pollution are Population, industries and Vehicles. Table 2.15 shows that districts of Ahmedabad, Surat, Vadodara and Rajkot alone form 35% population and 54% of vehicles in the state in 211. Percentage of the population from these districts has almost remained the same over the last decade (34.77% in 21) but percentage contribution of vehicles has reduced (55.87% in 21). Districts of Tapi, Porbandar, Narmada and The Dangs contribute least to the population as well as vehicles in Gujarat. Table 2.15: District wise Contribution to Population and Vehicles of Gujarat Sr. No. District Population 211 % To Total Population Vehicles % To Total Vehicles 1 Ahmedabad Surat Vadodara Rajkot Banaskantha Bhavnagar Junagadh Sabarkantha Panchmahal Page 67
87 Section II State Sr. No. District Population 211 % To Total Population Vehicles % To Total Vehicles 1 Kheda Jamnagar Dahod Kachchh Anand Mehsana Surendranagar Valsad Bharuch Amreli Gandhinagar Patan Navsari Tapi Narmada Porbandar The Dang NA NA Gujarat Source: Census 211 and Transport Department Classifying the districts of Gujarat in terms of their population, industries and vehicle fleet has been done in Table Page 68
88 Sabarkantha Junagadh Bhavnagar Banaskantha Rajkot Vadodara Surat Ahmedabad District Population Population Rank Air Polluting Industries Air Polluting Industries Rank Vehicle Population Vehicle Population Rank Population Density Population Density Rank Decadal Growth Decadal Growth Rank Urban Population % Urban Population Rank Rural Population % Rural Population Rank Section II State Table 2.16: Ranking of Districts Sr. No Page 69
89 Section II State Page 7 9 Panchmahal Kheda Jamnagar Dahod in s Kachchh Anand Mehsana Surendranagar Valsad Bharuch Amreli in s
90 Gujarat The Dang in s. 17 NA NA Porbandar Narmada in s ins Tapi Navsari Patan in s Gandhinagar Section II State *Note: Gandinagar includes Gandhinagar district with Ahmedabad Rural districts, Banaskantha includes Patan district, Panchmahal includes Dahod District, Navsari includes Tapi District, Valsad includes The Dangs district, Bhavnagar includes Amreli district. Jetpur RO is falls under Rajkot district and Ankleshwar under Bharuch district. Page 71
91 Section II State Rate of urbanisation and industrialization leading to growth of vehicles make cities Ahmedabad, Surat, Vadodara and Rajkot the hot spots for air pollution. The density of population and vehicles is also highest in these urban centres. Surat leads followed by Ahmedabad, Anand and Gandhinagar districts respectively for density of population. The districts have grown differently in last decade with highest growth in Surat followed by Kachchh, Dahod, Banaskantha and Ahmedabad. The Dangs district which has 89 % rural population follows Ahmedabad with 84% urban population in decadal growth. According to the pressure due to air polluting industries, Rajkot has maximum API followed by Ahmedabad, Gandhinagar, Valsad, Vadodara and Surat. If we look into the industrial clusters, the values of SO2, NOx, SPM and RSPM do not cross the critical levels in general. However, if we consider benzene, then industrial areas of Naroda, Vatva, Pandesara, Ankleshwar, Panoli and Dahej exhibit continuously higher values. Page 72


92 Section III - Impact
93
94 Section III Impact SECTION III - IMPACT The United Nations Environment Programme has estimated that globally 1.1 billion people breathe unhealthy air (UNEP, 22). Epidemiological studies have shown that concentrations of ambient air particles are associated with a wide range of effects on human health, especially on the cardio-respiratory system. Beyond its human health impacts, air pollution is also detrimental to ecosystems. Through direct exposure and accumulation, reactive compounds negatively impact plant growth and are primary contributors to acid rain, which can diminish fish stocks, decrease biological diversity in sensitive ecosystems, degrade forests and soils, and diminish agricultural productivity. Air pollution is also known to have damaging effect on non living materials in the form of corrosion of metal, soiling and eroding of building surfaces etc. People with low immune systems, those suffering from other diseases, children, the aged, and people with lung diseases are the people who suffer more. There is no dependable database to track these disease and death rates so it is difficult to produce scientific evidence. 3.1 Economic Impacts Improvement of air quality is associated with reduction in the number of premature deaths, episodes of acute illness such as asthma attacks and the number of chronic respiratory illness cases. Economic value of an illness episode is quantified as: The value of work time lost due to the illness by the patient or the caregiver, or both The medical cost of treatment The amount paid to avoid the pain and suffering associated with the illness, and The value of leisure time lost due to the illness by the patient or caregiver. Not many studies have been conducted to estimate the economic loss due to effect of air pollution on materials. Depreciation in property value occurs near odour causing operations/ industries and odorous environment. 3.2 Health Impacts Several epidemiological studies have established a direct relationship between the pollutants and health hazards ranging from morbidity (illness) to mortality (death from illness).the health impacts of various air pollutants are summarized in Table 3.1. Page 73
95 Section III Impact Table: 3.1: Air Pollutants & their Health Impacts Air Pollutants Particulates SO 2 NO x CO HC O 3 Respiratory diseases Acute respiratory infections, asthma, bronchitis, pneumonia, skin diseases, chronic conjunctivitis Irritates respiratory system, causes bronchitis Burning of eyes, nose etc, severe irritation of respiratory system, influenza Deprive body cell of oxygen, causes unconsciousness Affects central nervous system Eye irritation, pulmonary congestion, edema, hemorrhage Chlorine H 2 S Ammonia Asbestos Lead PAHs VOCs Severe lung irritation, irritates the eye Respiratory paralysis, causes immediate unconsciousness Skin and respiratory tract irritation Lung cancer Brain damage, muscular paralysis, convulsions Lung cancer Cancer, affects central nervous system, respiratory track irritation Health Impacts due to Indoor Air Pollution A number of studies have been carried out to address the health effects of use of various fuels. Exposure to combustion products from solid fuels has been considered an important cause of several diseases, including acute respiratory infections, chronic obstructive pulmonary disease, and cancer of the lung, nasopharynx, and larynx. Biomass and coal smoke contain a large number of pollutants, including particulate matter, carbon monoxide, nitrogen dioxide, sulfur oxides, formaldehyde, polycyclic organic compounds, and metals, such as arsenic. Smoky coal has been found to be more carcinogenic than cleaner coal and wood smoke when tested on mouse skin. There is growing evidence that exposure to indoor smoke can cause serious respiratory and other adverse health effects which may include Acute Respiratory Infections (ARI) in children and chronic obstructive pulmonary disease (COPD) or chronic bronchitis in women. Studies show risks for acute respiratory infections (ARI), COPD, and lung cancer. Tuberculosis (TB), asthma, and blindness may also be caused due the long exposures. Page 74
96 Section III Impact Box 3.1: WHO Study on Indoor Air Pollution According to World Health Organization, Household Air Pollution from Solid Fuels ranks 1 st and Pollution from other sources ranks 6 th in the top 1 risk factors for diseases in 21 in Asia (mainly India). Indoor Air Pollution was claiming 5,, lives in India every year, most of whom were women and children. India accounted for 8% of the 6,, premature deaths that occur in south east Asia annually due to exposure to Indoor Air Pollution. Nearly 7% of rural households don t even have ventilation. WHO has estimated that pollution levels in rural Indian kitchens are 3 times higher than recommended levels and 6 times higher than air pollution level Health Impacts due to Mining The generation of fugitive dust during mining activities is a serious concern. It not only causes direct impact on the health of the workers and community, but also affects the land productivity and general well being of a region. The incidence of respiratory and ophthalmic illness is far more acute in mining workers, whose workplaces are choked with dust. In addition to pneumoconiosis and bronchitis, coal miners also experiences various other diseases such as black lung diseases like sever dyspnea (shortness of breath) and air ways obstruction. Tuberculosis, blood dysentery and seasonal fevers are quite common. The common ailments associated with mining sector include Respiratory diseases: Pneumoconiosis including silicosis and asbestosis bronchitis, asthma, tuberculosis Eye ailments: cataract, conjunctivitis, corneal ulcers, glaucoma and squint trachoma Health Impacts due to Noise Pollution Often neglected, noise induces a severe impact on humans and on living organisms. Some of the adverse effects are summarised below. Annoyance Physiological effects Loss of hearing Human performance Nervous system Sleeplessness It creates annoyance to the receptors due to sound level fluctuations. The physiological features like breathing amplitude, blood pressure, heart-beat rate, pulse rate, blood cholesterol are effected. Long exposure to high sound levels cause loss of hearing. This is mostly unnoticed, but has an adverse impact on hearing function. The working performance of workers/human will be affected as they'll be losing their concentration. It causes pain, ringing in the ears, feeling of tiredness, thereby affecting the functioning of human system. It affects the sleeping thereby inducing the people to become restless and suffer from lose of concentration. Page 75
97 Section III Impact Health Impacts due to Heat Islands Hot weather places additional stress on the body, raising health risks for the vulnerable and increasing discomfort for everyone. During extreme weather events such as heat waves, the urban heat island has the potential to prevent the city from cooling down, maintaining night time temperatures at a level that affects human health and comfort. The consequences for the health can be severe with increased chances of heat stroke, physiological disruption, organ damage, and even death Health Impacts due to Odour Odour affects human beings in a number of ways. Strong, unpleasant or offensive smells can interfere with a person s enjoyment of life especially if they are frequent and / or persistent. Though foul odour may not cause direct damage to health, toxic stimulants of odour may cause ill health or respiratory symptoms. Secondary effects may be nausea, insomnia and discomfort. Very strong odour can result in nasal irritation, trigger symptoms in individuals with breathing problems or asthma. 3.3 Other Impacts Mining also has impact on climate change due to release of methane gas from the coal seams. On an average, Indian open cast coal mine release 1 m3 of methane per ton of coal, whereas in underground mine, methane release varies from 1 to 23 m 3 /ton of coal produced. The buildings and materials may get damaged by exposure to infrasonic / ultrasonic waves and even get collapsed. Evapo-transpiration rates will also be enhanced by high urban temperatures and plants & trees will potentially extract water from the soil at greater rates than normal. Plant growth is inhibited due to reduction in photosynthesis as the layers of particulates deposit on the leaves. Page 76
98 Section III Impact 3.4. Some Impact Studies Carried Out In Recent Past National Environmental Health Profile and Comparative Health Risk Assessment of Ahmedabad, sponsored by WHO through Ministry of Environment & Forests. Conducted by NIOH 24-5 The study has enumerated the reasons for air pollution in Ahmedabad as listed out in Table 3.2. The air pollutants have then been linked to major diseases as listed in Table 3.3. Table 3.2: Reasons for Air pollution Vehicles Industrial Miscellaneous Adulterated fuel Poor maintenance Thermal Power Plants Textile Process House Open burning of leaves, waste, etc Road borne dust Dyes, Dyes intermediates and chemical industry Road side dust Construction activities Dairy, Flour mills, bakeries, gram and ground nut roasting units Foundries, crushing and grinding units Brick kilns and incinerators Coal yards and ash yards/ ponds Soil type Desertification Meteorological conditions Cyclones/storms Domestic chulas Firing of crackers during festivals and marriage ceremonies Table 3.3: Diseases Identified Due to Air Pollution S. No. Disease S.No. Disease 1. Diphtheria 6. Congenital defects 2. Pneumonia 7. AGA 3. Measles 8. Cancer 4. TB 9. Cardiac Respiratory arrests 5. Acute Myocardial infraction 1. Asthma Page 77
99 Section III Impact Survey of Traffic Policemen conducted by Traffic Department in January 212 The survey was conducted to find pulmonary problems like Chronic Obstructive Pulmonary Diseases (COPD), asthma, pulmonary fibrosis and cystic fibrosis in traffic policemen. Lung Function tests conducted on the traffic police men confirmed that 45 % of the policemen tested were suffering from breathing and other respiratory problems. Some of them have been found to have definite abnormalities Health Impacts of Air Pollution in Ahmedabad A medical study was conducted by National Institute of Occupational Health (NIOH) in 23 in three different areas of Ahmedabad, viz. Residential area (L.D.Engg. College), Commercial area (Nehru Bridge), Industrial area (Naroda). Distribution of percentage morbidity is as follows: (Total families covered: 679 Residential: 2, Commercial: 242, Industrial: 237) Morbidity Industrial area Commercial area Residential area No. % No. % No. % Chronic Cough Breathlessness while Wheezing Hemoptysis Asthma T. B Nausea Eye Irritation Cataract Observations of NIOH The study showed that symptoms like cough, breathlessness while walking, haemoptysis have been more in industrial area. Asthma, Tuberculosis and chronic bronchitis were also higher in industrial area. Wheezing has been significantly higher in industrial area. The medical data from the different hospitals from Ahmedabad were also collected; however correct database regarding disease pattern due to air pollution was not available. Amongst air borne disease pattern, maximum cases of T.B. were reported in 1997 to 23. While cases of Pneumonia, Diphtheria and Measles were comparatively less reported. High RSPM levels probably enhance chest disease pattern. Page 78
100 Section III Impact Disease Pattern Related to Air Pollution The following table presents the number of reported cases of diseases in Gujarat which can be linked to air pollution. Though we do not have any study which directly links these cases to air pollution; this is an indicative pattern. The numbers of cases reported for Cardio Vascular Diseases, Cancer and Pulmonary Pneumonia have substantially increased in the last five years. Though the number of cases reported in whooping cough is very nominal the trend of increased patients in last five years is observed. Numbers of cases reported in lung diseases have also doubled. Table 3.4: Disease Pattern Related to Air Pollution in Gujarat S. Disease No. of Sputum Cardio Vascular Lungs disease Cancer * Whooping Cough Acute respiratory Pneumonia Pulmonary Source: Health Report *including Cancer Hospital Ahmedabad Box 3.2: Effect of Air Pollution on Human Health (adults) in Delhi In order to determine health effects of air pollution, CPCB initiated an Epidemiological Study in Delhi with the help of Chittaranjan National Cancer Institute, Kolkata. The study was carried out during November 22 and August 25 in various parts of Delhi and in different seasons and the report was published in 28. The study findings had shown that 33.2% residents of Delhi had one or more respiratory symptoms as compared to 19.6% of control subjects. Lung function was reduced in 4.3% individuals of Delhi compared with 2.1% in control group. Lung function reduction was more prevalent in women than in men both in rural and urban settings. People from lower SES had greater prevalence of lung function deficits. Besides gender, smoking habit, Body mass index and Socio economic status, particulate air pollution was positively associated with lung function deficits. hronic Page 79
101

102 Section IV - Response
103
104 Section IV Response SECTION IV - RESPONSE Efforts have been made by various stakeholders to abate air pollution from different sources. These efforts are being made by national & state agencies and individuals to adopt strategies that can reduce the impacts due to air pollution. Government of India had enacted the Air (Prevention and Control of Pollution) Act 1981 to arrest the deterioration in the air quality. The efforts by various stakeholders can be categorized into three main categories: 1. At National Level 2. At State Level 3. At Individual Level A set of initiatives have been taken under all the three categories. These are discussed in detail in the following paragraphs. 4.1 At National Level The Central Government enjoys the powers to make Acts, Rules, Regulations, Norms and Standards for the purpose of protecting the environment. The State Government agencies are mainly enforcing agencies. The State agencies normally adopt these standards or make them stringent where they would like to prevent the air pollution and improve upon the air quality Ambient Air Quality Norms Standards are a pre-requisite for effective management of ambient air quality. The objectives of air quality standards are: To indicate the levels of air quality necessary with an adequate margin of safety to protect the public health, vegetation and property To assist in establishing priorities for abatement and control of pollutant level To provide uniform yardstick for assessing air quality at national level To indicate the need and extent of monitoring programme The Central Pollution Control Board introduced Ambient Air Quality Standards on November 11, 1982 as per section 16 (2) (h) of the Air (Prevention and Control of Pollution) Act, The air quality standards have been revised by the Central Pollution Control Board on April 11, These have been further made stringent by notification dated 18 th Nov 29. These standards are presented in following tables. Page 8
105 Section IV Response Table 4.1: Pre Revised Ambient Air Quality Norms Pollutant Concentration (μg/nm 3 ) Annual Average 24 Hourly average Industrial Area Residenti al Area Sensitive Area Industrial Area Residential Area Sensitive Area SO NO SPM Pb CO 6 (8 hr) 2 (8 hr) 1 (8 hr) 1 (8 hr) 4 (8 hr) 2 (8 hr) RSPM Ammonia Source: Table 4.2: Revised Norms since 18 th Nov. 29 Sr. No. Pollutants Time-weighted average Concentration in ambient air Industrial, Residential, Rural and Other Areas Ecologically Sensitive Areas(notified by Central Govt) 1 SO 2 Annual 5 g/m 3 2 g/m g/m 3 8 g/m 3 2 NO x hours** Annual 4 g/m 3 3 g/m 3 Average* 24 8 g/m 3 8 g/m 3 3 PM 1 hours** Annual 6 g/m 3 6 g/m 3 4 PM 2.5 Average* 24 hours** Annual 1 g/m 4 g/m 3 1 g/m 4 g/m 3 Average* 24 6 g/m 3 6 g/m 3 5 O 3 hours** 8 1 g/m 3 1 hour g/m Pb Annual g/m.5 3 g/m.5 3 Average* 24 g/m 1. 3 g/m CO hours** 8 g/m 2. 3 g/m 2. 3 hours** 1 mg/m 4. 3 mg/m NH 3 Annual mg/m 1 3 mg/m 1 3 Average* 24 g/m 4 3 g/m C 6 H 6 hours** Annual g/m 5 g/m 3 g/m 5 g/m 3 1 Benzo Pyrene Annual As Annual ng/m 6. 3 ng/m Ni Annual ng/m 2 ng/m 3 ng/m 2 ng/m 3 Source: Page 81
106 Section IV Response * Annual Arithmetic mean of min 14 measurements in that year. Monitoring conducted for 24 hours at uniform intervals. ** 24 hourly / 8 hourly/ 1 hourly monitored values, as applicable shall be complied with 98% of the time in a year. However 2% of the time it may exceed but not on two consecutive days of monitoring Preparation of Zoning Atlas The "Zoning Atlas" programme covering various spatial environmental planning activities has been conceived as a tool for protection of the environmental resources and for achieving developmental targets in an environmentally sound manner. Zoning Atlas for Siting of Industries zones and classifies the environment and presents the pollution receiving potential of various sites/zones in the State. It identifies the possible alternate sites for industries, through easy-to-read maps. For Gujarat, interactive GIS based Zoning Atlas prepared at taluka level along with revenue map is ready for utilisation. Its incorporation in the State Industrial Policy can result in optimization of pollution abatement. Pollution Control Board can use it as a ready reckoner for granting No Objection Certificates. In continuation of the Zoning Atlas studies, the Industrial Estate Planning (IEP) studies have been taken up at micro-level by GPCB to identify environmentally acceptable sites for industrial estates, to suggest wastewater disposal points and to provide suggestions on control of surrounding land uses. More IEP studies will be helpful to the Industrial Development Corporation and the Industries Departments to properly locate the industrial estates and provide the needed pollution abatement infrastructure Improved Vehicle Emission Norms In 1991 and 1994, the European Environment council and European Commission regulated the permissible pollution limit for vehicles within the European Union. Standards were set for the amount of carbon monoxide (CO), oxides of nitrogen (NOx), hydrocarbon (CO) and particulate matter a vehicle could emit. These emission norms are known as Euro I. These were followed by stricter Euro II norms in 1998 and so on. In India, the first emission norms came into force for petrol and diesel vehicles in 1991 which were further made stricter over time. Euro I norms were introduced in India in the National Capital Region (NCR) Delhi in India introduced its similar vehicle emission norms series to Euro norms known as Bharat Stage norms. Currently the country is following Bharat Stage IV norms. All the vehicle manufacturers need to implement these standards for the vehicles being manufactured by them. The details of permissible vehicular emissions under various norms are given in following tables: Page 82
107 Section IV Response Table 4.3: Vehicle Emission Norms Emission norms for passenger cars Norms CO( g/km) HC+ NOx(g/km) 1991Norms (Only HC) 1996 Norms Norms India stage 2 norms Bharat stage-ii Bharat Stage-III (combined) Bharat Stage-IV 1..18(combined) Emission Norms for Heavy Diesel Vehicles Norms CO( HC (g/kmhr) NOx PM(g/kwhr) g/kmhr) (g/kmhr) 1991Norms Norms India stage 2 norms Bharat stage-ii Bharat Stage-III Bharat Stage-IV Emission Norms for 2/3 wheeler Norms CO( g/km) HC+ NOx(g/km) 1991Norms (only HC) 1996 Norms India stage 2 norms Bharat stage-ii Bharat Stage-III Source: Improved Fuel Quality Norms Ministry of environment and Forest in close association with Ministry of Petroleum and Natural Gas explored possibilities of improvement in fuel quality which lead to emission reductions. Gradual improvements have been made to increase the cetane number and reduce the percentage content of sulphur, lead, benzene etc. The details of gradual improvement in fuel quality over time is detailed out in Table 4.4. Page 83
108 Section IV Response Table 4.4: Improved Fuel Quality Norms Diesel Specification YEAR Cetane No, Min sulphur % W/w, Max (metro) Distillation T Polyaromatic Gasoline Specification RVP at 38Deg.c,kpa BENZENE %by Vol.,max (all) 1. 3.(Metro) 1.(Metro) Lead G/m3, max.15 %(low pb) % (unleaded) Sulphur % by mass, max.1(unleaded) (leaded) Aromatics % v/v., Max Oxygen %by Vol., Max Source: At State Level Air Action Plans The Honorable Supreme Court of India, in the matter of CWP No of 1995, passed the orders on , regarding formulation and implementation of action plans for control of pollution in cities which do not meet the ambient air quality standards. EPCA popularly known as Bhurelal Committee was set up by Honourable Supreme Court of India under Environment Protection Act. Initially this was set up for addressing the air pollution problem in Delhi alone. Later on sixteen other cities were added which included Agra, Ahmedabad, Bangalore, Chennai, Faridabad, Hyderabad, Jharia, Jodhpur, Kanpur, Kolkata, Lucknow, Mumbai, Patna, Pune, Solapur and Varanasi. Meanwhile Central Pollution Control Board (CPCB) under the advice of Government of India also identified other cities and towns which suffer from Air Pollution. In all, 85 cities and towns are monitored periodically by CPCB. In addition to Ahmedabad, the other cities of Gujarat which appear in this list are Vapi, Surat, Ankleshwar, Vadodara, Rajkot and Jamnagar. Air Action Plans were prepared for these cities. An action plan presents the prioritized list of abatement and other measures to improve air quality, and to maintain it within pre-described levels in the short and medium term. It outlines the steps required to implement a full air quality management system in any given city, consistent with the city s circumstances, capabilities and needs. Page 84
109 Section IV Response Ahmedabad is being monitored by a Task Force headed by the Chief Secretary of Gujarat. District level Task Force headed by Collector was set up for coordination and implementation of Action Plans for other cities. The rank of Ahmedabad improved from 4 th in year 21 to 13 th in year 25, 43 rd in year 26 and 66 th in year Monitoring of Industries Gujarat Pollution Control Board is the prime agency involved in the monitoring of air pollution or any other form of pollution in the State. The regulatory body through its network of 22 Regional Offices and 4 Vigilance offices monitors the polluting industries in the state. The individual industries are required to install air pollution control equipment for the control of emissions of emissions of particulate matter(pm), sulphur dioxide (SO 2 ), ammonia (NH 3 ), chlorine (CL 2 ), hydrogen sulphide (H 2 S) etc. Fig4.1 shows the number of samples collected and analysed from industrial units each year by GPCB. These samples are collected from various plants of thermal power, bulk drugs, pesticides, chemicals, fertilizers, petrochemicals, oil refineries etc. Actions are taken against the defaulting industries under the provisions of Air (Prevention & Control of Pollution) Act Box 4.1: Jurisdiction Area of Regional Offices of GPCB Page 85
110 No of Samples Section IV Response Fig 4.1: Samples Collected under Air Act No of Samples Source: GPCB Annual Reports Box 4.2: On Line Stack Emission Monitoring Narol, Ahmedabad On Line Stack Emission Monitoring Narol, Ahmedabad GPCB has initiated a pilot project to have a constant watch on 89 chimneys in Narol area of Ahmedabad with the help of close circuit TVs. Mostly textile processing units are located in this area. 57 CCTVs will record emissions coming out from these chimneys. The footage of these cameras can be viewed in the office itself. Recordings can be made of chimneys emitting seemingly higher pollution levels. Detailed sampling of these units can be then carried out of these units. Notices can then be issued to the polluting units. Source: GPCB Roping in Technical Institutes to Control Air Pollution A Case of Narol Area- Ahmedabad Narol earlier used to be on the outskirt of Ahmedabad city but with the expansion of urban area, it has now become a link between developed city area and developing peripheral area. At present, it is a mixed urban zone consisting of commercial activities, residential area and industrial activities housing more than 2 industries belonging to mainly textile processing sector along with few dyes and chemicals manufacturing industries. These industries have high Air pollution potential in terms of Flue gas emission from their boilers or thermic fluid heat heaters due to use of Coal, Lignite, Saw dust, Wood etc. Each unit is required to install and operate the Air Pollution Control Device (APCD) and a chimney for the better dispersion of the flue gas. Air pollution problem in the region is due to mainly two reasons: (i) Design lacunae (ii) Operational problems. Technical institute like L D College of Engineering, Ahmedabad were roped in by GPCB for the design modification and checking of the adequacy of the existing APCD of each individual textile unit. The exercise will include study of the existing APCD, operational aspects of the existing system, design improvement in existing system, alternate modes of APCDs etc. The whole exercise will be completed in Page 86
111 Section IV Response next three months and up-gradation of the existing APCD will be carried out by the unit in time bound manner. The Board will co-ordinate with Ahmedabad Textile Printing Association to finish the project in time. The study is in its advance stage and the institute has made some observations for the technical interventions. This will help to reduce the air pollution problem of the area. A Case of Vatva- Ahmedabad Spray drying is the process in dye manufacturing in which liquid slurry is converted in to the powder form. This is done by the Spray dryer in which hot gases mix get mixed with slurry and converts it into the fine powder. This process has air pollution potential in terms of fine particles which escape into the atmosphere. Vatva industrial estate of Ahmedabad is a hub of such dye manufacturing and has significance presence of such spray dryers. For the effective pollution control from such spray drying equipments, GPCB in co-ordination with the Vatva Green Environment Society Limited roped in DDIT-Nadiad for in depth study of each of such unit & thorough inspection of the APCD of spray dryer from the design point of view and preparation of the Standard Operating Procedure (SOP) for operation and maintenance of the equipment. The DDIT carried out the study and suggested some technical inputs for better management and control of APCD to reduce the air pollution. Suggestions like installation of the pressure gauge, regulation of the RPM of ID fan, Nozzle cleaning of wet scrubber, Re-circulation rate regulation of the scrubbing media has improved the efficiency of the APCD and resulted in improvement in the emission quality Strengthening of PUC Stations The process of setting up PUC centers in the state had started since 13/12/1994.Since April 25, new norms have been made applicable for PUC centers. The existing centers were asked to upgrade and re-register with RTO. The new PUC centers were to issue computerized photo PUC certificates. It was made compulsory for PUC centers which test petrol vehicles to have 4 Gas analysers (CO, HC, CO 2, O 2 ) as concentration of CO and HC emitted is so small that it cannot be measured by two gas analyzer. The density of smoke emitted by diesel vehicles was to be measured by Smoke meters. The district wise details of PUC centers in Gujarat is shown in Tab4.5. Page 87
112 Section IV Response Table 4.5: District Wise Approved PUC Centers Approved PUC center in Gujarat State as on 2/4/211 Sr. Name of Office Petrol/Gas Diesel Total No. 1 Ahemdabad Mehsana Rajkot Bhavnagar Surat Vadodara Nadiad Palanpur Himatnagar Jamnagar Junagadh Bhuj Surendranagar Amreli Valsad Bharuch Godhra Gandhinagar Bardoli Dahod Navsari Narmada 23 Anand Patan Porbandar Total Source: Office of Transport Commissioner Page 88
113 Section IV Response CNG/LPG Infrastructure for Auto Gas Supply In order to facilitate conversion of autos, cars, buses and other vehicles to cleaner fuel like CNG or LPG, State Government took proactive measures in facilitating the creation of CNG/LPG outlets in the State. The infrastructure in this area has been created by Adani Energy Ltd, HPCL, Gujarat Gas Company Ltd, GSPC & GAIL. The following table shows the gradual increase in the number of CNG/LPG outlets in the cities for which air action plans have been prepared by GPCB and Gandhinagar which is capital city of the State. These cities appear in the list of 85 cities prepared by CPCB which are high on air pollution. Table 4.6: CNG/LPG Stations for Auto Gas Supply City As on 31/3/27 As on 31/3/28 As on 31/3/29 Ahmedabad Vadodara Ankleshwar Surat Rajkot Jamnagar Vapi Gandhnagar Source: Annual Reports GPCB As on 31/3/21 In addition CNG/LPG stations are also installed in other cities of Gujarat like Morbi. Wadhwan, Limbdi, Sanand, Ananad, Navsari etc.however, the number of outlets in these cities is very small in the range of 1-4.The total number of CNG stations in Gujarat as on 31 March 212 is 227 out of which 57 have been set up by Adani, 44 by Gujarat Gas and 126 by GSPC and GAIL Registration of Retrofitters Earlier there was no system of registering CNG/LPG kit retrofitters and verifying the quality of services provided by them. Office of Transport Commissioner later started the procedure of registering these retrofitters after verifying the kind of infrastructure provided by them. The following table provides the details of registered retrofitters in Gujarat. Page 89
114 Section IV Response Table 4.7: Retrofitters Data Sr. No. District Name Number of Retrofitter 1 Ahmedabad Amreli 1 3 Anand 9 4 Bardoli 1 5 Bharuch 7 6 Bhavnagar 4 7 Gandhinagar 13 8 Godhra 4 9 Himatnagar 3 1 Jamnagar 8 11 Junagadh 7 12 Kheda 2 13 Mehsana Nadiad 2 15 Navsari 8 16 Palanpur 1 17 Panchmahal 4 18 Patan 3 19 Rajkot 13 2 Sabarkantha 4 21 Surat Surendranagar 2 23 Vadodara Valsad 3 Total 374 Source: Office of Transport Commissioner Banning of Old Autos & Conversion to CNG in Ahmedabad Regional transport authority has banned plying of old autorickshaws (autorickshaws registered before 1991) with effect from 31 Dec 25 in the areas under the jurisdiction of Ahmedabad Municipal Corporation and Ahmedabad Urban Development Authority. The autos were made to convert to CNG in Ahmedabad. There has now been a gradual increase in CNG autos in the city which is shown by the data below: As on 31/3/27 31 As on 31/3/28 38 As on 31/3/ As on 31/3/ As on 31/3/ As on 31/3/ Page 9
115 Section IV Response Improved Public Transport System Promoting public bus transport is viewed as a top priority area to improve urban road traffic and for controlling air pollution from automobiles. Public Transport System in Ahmedabad As on 31/3/212, AMTS operates a fleet size of 1152 buses along 171 routes in the city. Table4.8 presents details of fleet size of Ahmedabad over time. Table 4.8: AMTS Operations ( ) Year-ending 31 st March Fleet-size (Buses) AMTS Private Bus Rapid Transit System (BRTS) In the light of the current problems of public transportation and with the objective to promote and enhance regional mobility and serve public by providing quality transit services and solutions that improve the overall quality of life of the residents of Ahmedabad, the Government of Gujarat with respective authorities (AMC, AUDA and GIDB) is building Bus Rapid Transit System (BRTS) at various corridors. The Ahmedabad BRTS was officially named as Janmarg, which means people's way - a street that would carry the citizens of Ahmedabad in safety, comfort and at high speeds. BRTS network was created based on passenger studies, road inventory, road infrastructure attributes, existing land use and future development plans. The current BRT network connects the important origins and destination points plus the transit interchanges such as railway stations, regional bus terminals, University areas, industrial areas such as Narol, Naroda; residential and commercial hubs and recreational public spaces such as Kankaria Lake. BRTS network is planned in four phases and currently 45 Km of the BRTS corridor is operational and another 43 Km is under construction. Page 91

 Number of Stations 67 Total Fleet 112 (Including 11 AC buses) Note: Initiatives are also")
116 Section IV Response Table 4.9: Phase Wise Details of BRTS BRTS Phase wise details Length (Km) No. of Stations Status Phase - I In operation Phase - II Under construction Phase III 4 - Proposal Phase-IV 87 - Proposal Source: 25 th Month Report, AJL, CoE in Urban Transport, CEPT University. Operational BRTS Network Length 45 Km (Phase I) Number of Stations 67 Total Fleet 112 (Including 11 AC buses) Note: Initiatives are also taken in Gujarat for development of BRTS in Surat and Rajkot and they are at various stages of planning and development. Page 92
117 Section IV Response Promoting Renewable Energy Gujarat Government in form of Gujarat Energy Development Agency promoted various sources of renewable energy in the state. Number of projects have been under taken in Solar Energy, Wind Energy, Bio Energy, Energy Conservation and education. The biggest achievement has been development of Gujarat Solar Park, Charanka-Patan which hosts about 17 different projects by different developers. It also became the world's largest photovoltaic power station. This Solar Park will host 6 MW of solar power projects using state-of-the-art thin film technology. 6 MW of solar panels will save around 8 million tonnes of carbon dioxide from being released into the atmosphere and save around 9, tonnes of coal and natural gas per year. 4.3 At Individual Level Conversion of Vehicles to Cleaner Fuel (CNG/LPG) A large number of vehicles in Gujarat have converted to cleaner fuel. The drivers to this change are mainly economics but they do have an impact on air quality as CNG/LPG is considered to be cleaner than petrol/diesel. This change is supported by the availability of gas grid in Gujarat and the presence of CNG/LPG retail outlets in major cities. Table: 4.1: CNG/LPG Vehicles in Gujarat CNG/LPG Vehicles : As on 31st March, 211 Type of Vehicle New/ Conversion No. of Vehicles LPG CNG Total Autorickshaw New Conversion LMV Motor Car New Conversion Passenger Bus New Conversion Other Vehicles New Conversion Total New Source: Office of Transport Commissioner Conversion All Vehicles Page 93
118 Section IV Response Vehicles to Cleaner Fuel in Ahmedabad Ahmedabad has seen a surge of vehicles converting to cleaner fuel ie CNG/LPG. The reason for conversion for private vehicles is more to do with economics benefits but nevertheless, it does lead to reduction in air pollution. The public vehicles are converting to cleaner fuel due to government initiatives. Table 4.11: CNG/LPG Vehicles in Ahmedabad CNG/LPG Vehicles as on 31 March 212 Autos LMV Passenger Bus Motorcycle Delivery Van Total Grand Total CNG LPG CNG LPG CNG LPG CNG LPG CNG LPG CNG LPG Source: RTO Ahmedabad Use of Natural Gas by Industries A large number of industrial units are also shifting to cleaner fuel. Table 4.12 provides details of industrial connections in Gujarat by various natural gas suppliers. This is being encouraged by regulatory agencies as natural gas is a cleaner fuel. Page 94
119 Section IV Response Table 4.12: Industries having Natural Gas Connection Commissioned Industrial Customers as on 31 Jan 212 GSPC Adani Energy Ltd Gujarat Gas North Gujarat Ahmedabad Vatva 259 Naroda 136 Memco 1 Narol 63 Odhav 92 Changodar 62 Rakhial 1 South Gujarat Sarigam 86 Vapi 264 Valsad 28 Navsari 14 Hazira 5 Umargam 47 Bilimora 8 Surat 875 Central Gujarat Vadodara 75 Karjan-Palej 3 Halol 42 Dahej 7 Gandhinagar 17 Nadiad 12 Khambat 4 North Saurashtra Surendranagar 59 Rajkot 171 Morbi Morbi 561 Thangadh 153 Total Source: GSPC & Adani Energy Ltd Households having PNG Use of cleaner fuel at house hold level has also increased. Between NFHS- 2 and NFHS -3 an additional 2 % households shifted to cleaner fuel in urban areas, in rural areas, additional 5% households shifted to cleaner fuel taking total percentage to 81.8% and 23% in urban and rural areas respectively. Page 95
120 Section V - Recommendation
121
122 Section V Recommendations SECTION V - RECOMMENDATIONS For improved air quality, there is a need to involve all stake holders - government agencies, NGOS, academic institutions, R & D organisations and public. State of art air quality monitoring equipments, modeling techniques, meteorological data, source apportionment studies and regular health surveys are a prerequisite to pragmatic policy interventions. 5.1 Need to Extend Ambient Air Quality Monitoring Programme Most of the ambient air quality monitoring stations measuring annual averages are located in the golden corridor. Only 9 districts are covered by them. There is a need to spread this network to remaining districts in Gujarat to start building temporal data. More stations are needed particularly in hot spots where the vehicular and industrial emissions are high. Potential air pollutants in ambient air namely Volatile organic compounds and polycyclic aromatic hydrocarbons should be monitored regularly in order to minimize their emissions to protect public health. Currently these are being monitored only in industrial clusters. A need is there to extend this to major traffic junctions in the major urban centers as vehicular traffic is a major contributor to these VOCs. Annual averages are measured only for four parameters namely SO 2, NO X, SPM and RSPM. Twelve parameters are now notified under the Ambient Air Quality norms since 18 th Nov 29. There is an urgent need to extend the parameters being monitored. The collected air quality data should be comprehensively and statistica l ly analyzed to get an insight into temporal and spatial trends. The performance of existing stations needs to be overhauled for strict quality control. Also there is a need for relocation of monitoring equipment at some locations to have data indicating actual ambient air quality status. 5.2 Source Apportionment Studies Source Apportionment Studies for ambient air quality attributing contribution of various sources of air pollutants have not been initiated in Gujarat. Such studies when undertaken periodically will highlight the impact of policy interventions for improvement of air quality. Page 96
123 Section V Recommendations 5.3 Health Impact Studies Data on health effects of air pollution from Indian cities is minimal and investigation on the health effects of chronic, long-term exposures to ambient air pollution is almost absent. It is important to undertake health impact studies to know the effect of specific air pollutants on public health. Collaboration of impact analysis on health with air monitoring data and various research and development initiatives will improve policy interventions for air quality. There is utmost requirement to collect better and systematic information about actual exposure levels experienced by households and develop a model for predicting the exposure levels based on fuel use and other household data (exposure atlas). Effective tackling of indoor air pollution also requires collaboration and commitment between agencies responsible for health, energy, environment, housing and rural development. 5.4 Pollution Control from Vehicles Traffic mode characteristics show that trips by Public Transport are only 8.97% in 27 for Ahmedabad. For other cities, this data was not available. For cities like Ahmedabad, this percentage is very low and should have been more than 2% as per the study on Traffic & Transportation Policies and Strategies in Urban Areas in India, 28, conducted by Ministry Of Urban Development, New Delhi. Therefore, there is a need to strengthen Mass Transportation in cities. Diesel exhausts contain fine and ultrafine particles that are very harmful particularly for children. School buses and other vehicles used for transportation of the school children everywhere in the country should be changed from diesel to cleaner fuel like CNG or LPG. The State Government needs to make necessary amendments to Motor Vehicles Act, to enable spot checking of vehicles and levy fines on owners, who fail to pass tests for carbon monoxide, hydrocarbons and lead emissions. Regulation to restrict the registration of two-stroke motored vehicles and movements of diesel transport vehicles in major cities could also be initiated. Improvement in traffic management system to relieve congestion is urgently called for by linking the bylanes and introducing parallel road system. Congested areas should be designated as Pedestrian Streets during peak periods. Parking should be allowed only in designated parking areas at nodal points. Page 97
124 Section V Recommendations 5.5 Regulatory Agencies There are multiple contributors to air pollution like vehicles, industries, fuel burning etc. Therefore control strategies require active co-operation among all the concerned agencies and require developing some common platform where they can plan strategies and programmes to prevent and control air pollution. Suitability of a new industry or industrial estate with environment can be assessed by using the Zoning Atlas for Gujarat which provides a taluka level GIS based interactive approach for site suitability. This is based on pollution potential of an industry taking into account its effect on Land, Air, Water and Environmentally Sensitive Zones. Integration of local policies for air, water, soil and waste in cities will lead to better environmental quality. Staggering of holidays and workdays for business establishments, rescheduling of timings of schools and cinema theatres in different parts of the cities may be implemented. 5.6 Awareness Programmes Accelerating the national programmes for dissemination of solar cookers and improved fuel wood stoves suited to local cooking practices and biomass resources can help in preventing health impacts from indoor air pollution. Encouraging public to walk or use bicycles for traveling short distances and to share vehicles for long distances will help in controlling vehicular air pollution. The individual level action that can be initiated to minimise pollution from vehicles should also be popularised. City and land use pattern should encourage designing and redevelopment of communities to promote mass transit, carpooling, pedestrian walkways, and bicycle use. Saving the existing trees and planting more trees wherever possible will help in controlling air pollution. A mass awareness campaign should be carried out on air pollution and its impact on our health. Page 98
125


126 References
127
128 References REFERENCES 1. Annual Reports 26-7, 27-8, 28-9,29-21, Central Pollution Control Board, New Delhi 2. Annual Reports 26-7, 27-8, 28-9,29-21, Gujarat Pollution Control Board, Gandhinagar 3. Air Quality Trends And Action Plan For Control Of Air Pollution For Seventeen Cities 26, 27, 28, Central Pollution Control Board, New Delhi 4. Minimising Release And Environmental Implications Of Chlorine And Its Compounds, 28, Central Pollution Control Board, New Delhi 5. Guidelines On Odour Pollution & Its Control, 28, Central Pollution Control Board, New Delhi 6. Status Of The Vehicular Pollution Control Programme In India, 21, Central Pollution Control Board, New Delhi 7. Evaluation Study On National Project On Biogas Development Programme, May 22, Planning Commission, Government Of India, New Delhi 8. Dr. Arunachalam Gunasekar, Tracking Delhi s Air Quality 212, New York Times 9. Environmental Performance Index, 212, Environmental Research Centers At Yale And Columbia Universities 1. Study On Traffic And Transportation Policies And Strategies In Urban Areas In India, 28, Ministry of Urban Development, New Delhi 11. Epidemiological Study On Effect Of Air Pollution On Human Health (Adults) In Delhi, 28, Central Pollution Control Board, New Delhi 12. Study On Ambient Air Quality, Respiratory Symptoms And Lung Function Of Children In Delhi, 28, Central Pollution Control Board, New Delhi 13. Study Of Urban Air Quality In Kolkata For Source Identification And Estimation Of Ozone, Carbonyls, NOx And VOC Emissions, 21, Central Pollution Control Board, New Delhi 14. Tishyarakshit Chatterjee, (29) Reorienting Environment Policy In India Towards A Local Area-Based Development And Management Paradigm, The Journal Of Trans disciplinary Environmental Studies Vol. 8, No Sruthijith K K, CNG: Environmentalism Vs Economics, Centre For Civil Society 16. Sanjeev Kumar K., Ankur Paliwal, Sumana Narayanan (Jul 15, 211) Gentle On Critical Pollution, Down To Earth, Jul 15, 211 Page 99
129 References 17. Bureau Of Indian Standards, National Building Code Of India 1983 Incorporating Amendments No.1 And 2, 199, Bureau Of Indian Standards, New Delhi 18. SP 7:25, National Building Code Of India 25, Bureau Of Indian Standards, New Delhi 19. Goyal, Rohit, Khandelwal, Sumit And Kaul, Nivedita, 211, Analysis Of Relative Importance Of Parameters Representing Vegetation, Urbanization And Elevation With Land Surface Temperature Using ANN, Geo Spatial World Forum, Hydrabad 2. Prajna Paramita Mishra, 25, Impact Of Mining On Agricultural Productivity, Centre For Economic And Social Studies (CESS), Hyderabad 21. Rapid Environmental Impact Assessment Of Iron Ore Mining In Bellary-Hospet Region, 24, National Environmental Engineering Research Institute, Nagpur, 22. London s Urban Heat Island: A Summary For Decision Makers, October 26, Greater London Authority 23. For A Breath Of Fresh Air 1 year Progress And Challenges In Urban Air Quality Management In India ( ), The World Bank; Environment And Social Development Unit; South Asia Region 24. Integrated Environment Epidemiology Study In Identified Critically Polluted Areas In Country, National Institute of Occupational Hazard, Ahmedabad. 25. Determination Of Impact On Health And Vegetation Due To Air Pollution, NIOH, 23, Central Pollution Control Board Sponsored by World Bank Aided Training Program 26. Environmental Standards for Ambient Air, Automobiles, Fuels, Industries and Noise, 2, Central Pollution Control Board, Ministry Of Environment & Forests, New Delhi 27. Air Pollution Due To Vehicular Traffic In Designated Cities / Towns Of The Gujarat State And Evaluation Of Health Status Of School Children Studying Nearby Traffic Junction In Cities, 2, National Institute of Occupational Hazard, Identified By The Honble High Court, Ahmedabad 28. National Environmental Health Profile And Comparative Health Risk Assessment, 24-5, National Institute of Occupational Hazard Sponsored By WHO Through Ministry Of Environment & Forests, New Delhi 29. Socio-Economic Review, Gujarat State 27-8; February 28; Directorate of Economic and Statistics; Government of Gujarat; Gandhinagar 3. Compendium Of Environment Statistics India, 21, Central Statistics Office, Ministry Of Statistics And Programme Implementation, Government Of India Page 1
130 References 31. Smoke Screen Ambient Air Quality In India; 26, Website: ; Community Environmental Monitoring 32. Action Plans Of Various Cities In Gujarat; Ahmedabad; Vadodara; Surat; Jamnagar; Bhavnagar; Rajkot; Vapi; Ankleshwar; Etc, Gujarat Pollution Control Board 33. State Of Environment Reports; Maharashtra, Tamil Nadu, Andra Pradesh, Gujarat, India; Etc 34. Bhuvans Thematic Maps, 35. Comprehensive environmental Pollution Index, 29, Central Pollution Control Board, New Delhi 36. Mowli P Pratapa and Subbayya, Air Pollution and Control, Divyajyoti Prakashan, Jodhpur. 37. Singal S P, Air Quality Monitoring and Control Strategy, Narosa Publishing House, New Delhi. Page 11
131

132 Annexure
CHANGING DYNAMICS OF POPULATION IN GUJARAT: DISTRICT LEVEL ANALYSIS OF POPULATION, SEX RATIO AND URBANIZATION
 CHANGING DYNAMICS OF POPULATION IN GUJARAT: DISTRICT LEVEL ANALYSIS OF POPULATION, SEX RATIO AND URBANIZATION Prof. Tarang Solanki Assistant Professor Economics School of Social Science Gujarat University
GE 2211 Environmental Science and Engineering Unit III Air Pollution. M. Subramanian
 GE 2211 Environmental Science and Engineering Unit III Air Pollution M. Subramanian Assistant Professor Department of Chemical Engineering Sri Sivasubramaniya Nadar College of Engineering Kalavakkam 603
Growth Performance of Major Vegetable Crops in Gujarat State
 Agricultural Economics Research Review Vol. 30 (No.1) January-June 2017 pp 139-149 DOI: 10.5958/0974-0279.2017.00013.1 Growth Performance of Major Vegetable Crops in Gujarat State Daya Suvagiya, V.C. Shilpa,
Air Pollution Management and Modeling - Indian Perspective
 Air Pollution Management and Modeling - Indian Perspective GUFRAN BEIG Indian Institute of Tropical Meteorology, Pune - 411 008 (e-mail: beig@tropmet.res.in) 1 Contents Air Quality Concerns Current Statust
PRODUCTS OF COMBUSTION
 PRODUCTS OF COMBUSTION Some of the fuel (hydrocarbon) may not completely burn during combustion and therefore is released into the atmosphere along with the products. The products that are formed during
Chapter: 1.1 Energy Scenario
 Chapter: 1.1 Energy Scenario Part-I: Objective type questions and answers 1. The energy sources, that are either found or stored in nature are a) Secondary Energy Sources b) Primary Energy Sources c) both
The Chemical Industry and Climate Change. A Snapshot from India
 The Chemical Industry and Climate Change A Snapshot from India B.H. Rahill Lead Environmental Specialist South Asia Environment June 14, 2006 Presentation Outline The Indian Situation (Part of) LBNL Benchmarking
Jennings O Donovan & Partners Consulting Engineers Sligo
 8.0 AIR QUALITY 8.1 INTRODUCTION 8.1.1 Background Despite the ongoing deterioration in air quality on a national level due to the reliance on fossil fuel generated energy, Ireland as a whole is relatively
Family under BPL in Gujarat State District Family Poor Family Ahmedabad Amreli Anand Banaskantha
 Family under BPL in Gujarat State District Family Poor Family Ahmedabad 85603 72463 Amreli 32649 35260 Anand 78174 75577 Banaskantha 124052 103811 Bharuch 70817 45647 Bhavnagar 27937 52680 Dahod 135365
The Air Pollution Knowledge Assessment (APnA) City Program
 City Program") The Air Pollution Knowledge Assessment (APnA) City Program 1 APnA Cities (2017) Agra, Amritsar, Bengaluru, Bhopal, Bhubaneswar, Chandigarh, Chennai, Coimbatore, Dehradun, Indore, Jaipur, Kanpur, Kochi,
The Air Pollution Knowledge Assessment (APnA) City Program 1 APnA Cities (2017) Agra, Amritsar, Bengaluru, Bhopal, Bhubaneswar, Chandigarh, Chennai, Coimbatore, Dehradun, Indore, Jaipur, Kanpur, Kochi,
Centre of Excellence for Skills for Green Jobs. Skill development Government of Gujarat
 Centre of Excellence for Skills for Green Jobs Skill development Government of Gujarat Contents Project Concept 3 Market Potential 6 Growth Drivers 6 Gujarat Competitive Advantage 7 Project Information
Air Pollution- Challenges in Compliance
 Air Pollution- Challenges in Compliance Air pollution The introduction of chemicals, particulate matter, or biological materials that cause harm or discomfort to humans or other living organisms, or cause
National Symposium on Best Practices to improve the Business Environment
 Government of Gujarat National Symposium on Best Practices to improve the Business Environment 23 rd August 2014 Gujarat Industrial Development Corporation (A Government of Gujarat Undertaking) Industrial
Air Pollution. tutorial by Paul Rich. Brooks/Cole Publishing Company / ITP
 Air Pollution tutorial by Paul Rich Outline 1. The Atmosphere layers, some major processes 2. Urban Air Pollution photochemical & industrial smog 3. Regional Air Pollution from Acid Deposition acid deposition,
Urbanisation and Air Quality: A Comparative Analysis of Delhi and Kolkata
 e t International Journal on Emerging Technologies 8(1): 324-329(217) ISSN No. (Print) : 975-8364 ISSN No. (Online) : 2249-3255 Urbanisation and Air Quality: A Comparative Analysis of Delhi and Kolkata
Gujcot Trade Association
 Gujcot Trade Association WEEKLY REPORT Market Movement from RD Sep to TH Sep Gujarat Cotton prices of 29 mm remained between, to, Rs./Candy. Outstate arrivals almost ended. All India Daily Arrivals remained
Oil and Gas Sector Profile
 Oil and Gas Sector Profile 1 Gujarat : An Enduring Strong Economy Population : Over 50 million (5.0% of India) Geographical area : 1,96,000 sq. km (6.2% of India) Gross State Domestic Product (GSDP) :
STATE OF LAND RESOURCES
 STATE OF LAND RESOURCES This information deals with three main dimensions pertaining to the status of land resources land use, soils, and agriculture. The first section of this article will deal with the
Assessment of Air Pollution in Lucknow
 Assessment of Air Pollution in Lucknow Geetika Saluja* Centre For Excellence at Varmora Granito Pvt Ltd, Ahmedabad, Gujarat, India Review Article Received: 07/02/2017 Accepted: 11/07/2017 Published: 18/07/2017
ENERGY AND THE ENVIRONMENT Environmental Impacts
 ENERGY AND THE ENVIRONMENT Environmental Impacts Presented by Mr S. Mooloo, Ag Deputy Director Department of Environment MRC July 2006 Contents From Dirty to Clean fuel Environmental impacts International
Climate Change Department Government Of Gujarat
 Climate Change Action & Adaptation Climate Change Department Government Of Gujarat Gujarat-Action Against Climate Change First and only State to form a separate Climate Change Department. Allocated a budget
Impact of road traffic on air quality at two locations in Kuwait
 Air Pollution XVII 183 Impact of road traffic on air quality at two locations in Kuwait E. Al-Bassam 1, V. Popov 2 & A. Khan 1 1 Environment and Urban Development Division, Kuwait Institute for Scientific
ISPRS Archives XXXVIII-8/W3 Workshop Proceedings: Impact of Climate Change on Agriculture
 IMPACT ANALYSIS OF CLIMATE CHANGE ON DIFFERENT CROPS IN GUJARAT, INDIA Vyas Pandey, H.R. Patel and B.I. Karande Department of Agricultural Meteorology, Anand Agricultural University, Anand-388 110, India
V: PROJECT SCOPING & METHODOLOGY
 V: PROJECT SCOPING & METHODOLOGY 5.0 INTRODUCTION The scoping exercise is carried out to define the focus and scope of the EIA Study. The scoping exercise is required to understand the type of activities
State of Gujarat ( , ) Executive Summary District wise skill gap study for the
 Executive Summary District wise skill gap study for the") Executive Summary District wise skill gap study for the State of Gujarat (2012-17, 2017-22) 1 1. Executive Summary National Skill Development Corporation (NSDC) had mandated KPMG Advisory Services Pvt
Executive Summary District wise skill gap study for the State of Gujarat (2012-17, 2017-22) 1 1. Executive Summary National Skill Development Corporation (NSDC) had mandated KPMG Advisory Services Pvt
Appendix C: GHG Emissions Model
 Appendix C: GHG Emissions Model 1 METHOD OVERVIEW The Maryland Statewide Transportation Model (MSTM) Emissions Model (EM) is a CUBE-based model that uses emission rates calculated by the MOVES2010 EPA
ACTION PLAN FOR CONTROL OF AIR POLLUTION IN NON-ATTAINMENT CITY OF BIHAR (PATNA)
") ACTION PLAN FOR CONTROL OF AIR POLLUTION IN NON-ATTAINMENT CITY OF BIHAR (PATNA) BY BIHAR STATE POLLUTION CONTROL BOARD Parivesh Bhawan, Patliputra Industrial Area, P.O.-Sadakat Ashram, Patna 800 010 Action
ACTION PLAN FOR CONTROL OF AIR POLLUTION IN NON-ATTAINMENT CITY OF BIHAR (PATNA) BY BIHAR STATE POLLUTION CONTROL BOARD Parivesh Bhawan, Patliputra Industrial Area, P.O.-Sadakat Ashram, Patna 800 010 Action
Air Pollution. GEOL 1350: Introduction To Meteorology
 Air Pollution GEOL 1350: Introduction To Meteorology 1 Overview Types and Sources of Air Pollutants Factors That Affect Air Pollution Air Pollution and the Urban Environment 2 Air pollutants are airborne
Vehicular Pollution in Indian Cities: What can the Central Budget do?
 Union Budget 2017-18: Outlook Vehicular Pollution in Indian Cities: What can the Central Budget do? Sudakshina Gupta Professor Department of Economics University of Calcutta Email:sudakshinagupta@yahoo.co.in
CONTENTS CHAPTER : ONE. 1-9 CHAPTER : TWO.10-16
 CONTENTS LIST OF TABLES Page No. CHAPTER : ONE. 1-9 ENVIRONMENT STATISTICS: FRAME WORK AND INDICATORS. 1 1.3.1 Framework for Development of Environment Statistics (FDES) Information categories 3 1.3.2
Transport and the Environment
 Partnership for Clean Fuels and Vehicles Transport and the Environment Glynda Bathan Policy and Partnership Manager Clean Air Initiative for Asian Cities Center UNEP-TNT Fleet Management Toolkit Launch
GLNG PROJECT - ENVIRONMENTAL IMPACT STATEMENT
 6 J:\Jobs\42626220\07 Deliverables\EIS\FINAL for Public Release\6. Values and Management of Impacts\6-8 Air Quality\06 08 Air Quality (Section 6.8) FINAL PUBLIC track.doc GLNG Project - Environmental Impact
Air Quality & Health. Our Atmosphere. ENVIR 202: Lesson No. 14. Lesson 14: Air Quality February 6, ENVIR 202: Population & Health 1
 ENVIR 202: Lesson No. 14 Air Quality & Health February 6, 2006 Chuck Treser University of Washington Program on the Environment ENVIR 202: Lesson 14 1 Our Atmosphere Spaceship Earth Protects Us Loss of
Air Quality Policies COUNTRY NAME GOALS CURRENT STATUS CURRENT / PLANNED POLICIES & PROGRAMMES GENERAL OVERVIEW
 Air Quality Policies This document is based on research that UNEP conducted in 2015, in response to Resolution 7 of the UNEA 1. It describes countrylevel policies that impact air quality. Triple question
Sulfur oxides (SO x ) - particularly sulfur dioxide, a chemical compound with the formula SO 2. SO 2 is produced by volcanoes and in various
 - particularly sulfur dioxide, a chemical compound with the formula SO 2. SO 2 is produced by volcanoes and in various") AIR CANCER Sulfur oxides (SO x ) - particularly sulfur dioxide, a chemical compound with the formula SO 2. SO 2 is produced by volcanoes and in various industrial processes. Coal and petroleum often
AIR CANCER Sulfur oxides (SO x ) - particularly sulfur dioxide, a chemical compound with the formula SO 2. SO 2 is produced by volcanoes and in various industrial processes. Coal and petroleum often
SECTOR ASSESSMENT (SUMMARY): ENERGY
: ENERGY") Country Partnership Strategy: People s Republic of China, 2016 2020 SECTOR ASSESSMENT (SUMMARY): ENERGY Sector Road Map A. Sector Performance, Problems, and Opportunities 1. Reduction in energy intensity.
Country Partnership Strategy: People s Republic of China, 2016 2020 SECTOR ASSESSMENT (SUMMARY): ENERGY Sector Road Map A. Sector Performance, Problems, and Opportunities 1. Reduction in energy intensity.
STOCHASTIC ANALYSIS FOR VEHICULAR EMISSIONS ON URBAN ROADS- A CASE STUDY OF CHENNAI
 Harikrishna, M., Arun C. Stochastic Analysis For Vehicular Emissions On Urban Roads- A Case Study Of Chennai in Martin J. Bunch, V. Madha Suresh and T. Vasantha Kumaran, eds., Proceedings of the Third
History of significant air pollution events
 Ch17 Air Pollution A thick layer of smoke and haze covers Santiago, Chile. History of significant air pollution events Many of the worst air pollution episodes occurred in the last two centuries in London
AIR QUALITY STUDY OF SELECTED AREAS IN KERALA STATE
 AIR QUALITY STUDY OF SELECTED AREAS IN KERALA STATE Josna J Dcruz, P. Kalaiarasan, Akhil Nath.G 1 M.Tech Environmental Engineering Student, KMCT CEW, Kerala, India 2 Scientist, NATPAC, Thiruvananthapuram,
A- 1: Emissions of pollutants into the atmospheric air. 2) Relevance for environmental policy... 3
 Relevance for environmental policy... 3") A- 1: Emissions of pollutants into the atmospheric air 1) General description... 2 1.1) Brief definition... 2 a) Emissions from stationary sources... 2 b) Emissions from mobile sources... 2 c) Total emissions...
A- 1: Emissions of pollutants into the atmospheric air 1) General description... 2 1.1) Brief definition... 2 a) Emissions from stationary sources... 2 b) Emissions from mobile sources... 2 c) Total emissions...
LIST OF TABLES NUMBE R CHAPTER 1- ENVIRONMENT AND ENVIRONMENT DEGRADATION
 LIST OF TABLES NAME PAGE NUMBE R CHAPTER 1- ENVIRONMENT AND ENVIRONMENT DEGRADATION TABLE 1.3.1 FRAMEWORK FOR DEVELOPMENT OF ENVIRONMENT STATISTICS (FDES) INFORMATION CATEGORIES TABLE 1.3.2: SOME IMPACTS
Gujcot Trade Association
 Gujcot Trade Association WEEKLY REPORT Market Movement from TH Sep to TH Sep Gujarat Cotton prices of 29 mm remained between, to, Rs./Candy. Outstate arrivals almost ended. All India Daily Arrivals remained
UNSD/UNEP QUESTIONNAIRE 2004 ON ENVIRONMENT STATISTICS
 Section: AIR Guidance Definitions List of Definitions Emissions Table A1 Emissions of Sulfur Dioxide (SO 2 ) Table A2 Emissions of Nitrogen Oxides (NO x ) Table A3 Emissions of Non-Methane Volatile Organic
4 NEED AND DESIRABILITY FOR THE PROJECT
 4 NEED AND DESIRABILITY FOR THE PROJECT 4.1 Introduction In many countries, including South Africa, economic growth and social needs are resulting in substantially greater energy demands, in spite of continued
An Estimation of Air Quality Index of a Coastal Station
 ISSN: 2319-7706 Volume 3 Number 6 (2014) pp. 759-763 http://www.ijcmas.com Original Research Article An Estimation of Air Quality Index of a Coastal Station A case study Vennapu. Lakshmana Rao* Department
Air quality in the vicinity of a governmental school in Kuwait
 Air Pollution XVI 237 Air quality in the vicinity of a governmental school in Kuwait E. Al-Bassam 1, V. Popov 2 & A. Khan 1 1 Environment and Urban Development Division, Kuwait Institute for Scientific
International Journal of Advance Engineering and Research Development STUDY ON IMPACT OF TRAFFIC ON ENVIRONMENT STUDY BY AIR QUALITY INDEX
 Scientific Journal of Impact Factor (SJIF): 4.72 International Journal of Advance Engineering and Research Development Volume 4, Issue 11, November -2017 e-issn (O): 2348-4470 p-issn (P): 2348-66 STUDY
Estimating Agricultural Sustainability in Gujarat Using Sustainable Livelihood Security Index
 Agricultural Economics Research Review Vol. 30 (No.1) January-June 2017 pp 125-131 DOI: 10.5958/0974-0279.2017.00011.8 Estimating Agricultural Sustainability in Gujarat Using Sustainable Livelihood Security
ANALYTICAL HIGHLIGHTS
 IV ANALYTICAL HIGHLIGHTS 1. Reserves and Potential for Generation India s energy-mix comprises both non-renewable (coal, lignite, petroleum and natural gas) and renewable energy sources (wind, solar, small
Lecture 4 Air Pollution: Particulates METR113/ENVS113 SPRING 2011 MARCH 15, 2011
 Lecture 4 Air Pollution: Particulates METR113/ENVS113 SPRING 2011 MARCH 15, 2011 Reading (Books on Course Reserve) Jacobson, Chapter 5, Chapter 8.1.9 Turco, Chapter 6.5, Chapter 9.4 Web links in following
TheStudyEstimatesandAssessesGreenhouseGasEmissionsandRemovalsfrom thefollowingsectors: N O CH 4. Methane
 September17 Analysis of Greenhouse Gas Emission Trends from 5 to 13 TrendAnalysisof GHGEmissionsinIndia GHG Platform India is a collective civil society initiative providing an independent estimation and
8 AIR AND CLIMATE Introduction
 Table of contents 8 AIR AND CLIMATE... 8-1 8.1 Introduction... 8-1 8.1.1 Scope of the Assessment... 8-1 8.1.2 Methodology... 8-1 8.1.3 Assessment Criteria for Air Quality... 8-2 8.1.4 National Legislation
GLOBAL ENVIRONMENTAL PROBLEMS
 GLOBAL ENVIRONMENTAL PROBLEMS DR. SIREEN ALKHALDI, BDS, DRPH EPIDEMIOLOGY AND BIOSTATISTICS, 2 ND YEAR, 2017/ 2018 MEDICAL SCHOOL, THE UNIVERSITY OF JORDAN DEFINITION: ENVIRONMENT Environment is: The
ISSN: X Impact factor: (Volume3, Issue4) Available online at Analysis of Air Pollution
 Available online at Analysis of Air Pollution") ISSN: 2454-132X Impact factor: 4.295 (Volume3, Issue4) Available online at www.ijariit.com Analysis of Air Pollution Rajeshwari K. Rai BITS Pilani, India krrai77@gmail.com Abstract: This research paper
ISSN: 2454-132X Impact factor: 4.295 (Volume3, Issue4) Available online at www.ijariit.com Analysis of Air Pollution Rajeshwari K. Rai BITS Pilani, India krrai77@gmail.com Abstract: This research paper
Air Pollution Chapter 21. Atmosphere as a Resource
 Air Pollution Chapter 21 Atmosphere as a Resource Atmospheric Composition Nitrogen 78.08% Oxygen 20.95% Argon 0.93% Carbon dioxide 0.04% Ecosystem services Blocks UV radiation Moderates the climate Redistributes
Egypt s s Policies and Measures for Sustainable Transport
 Egypt s s Policies and Measures for Sustainable Transport Hydrogen Fuel Cells and Alternatives in the Transport Sector: Issues for Developing Countries UNU-INTECH, 7-97 9 November 2005 Egypt s s Current
INVENTORY OF GREEN HOUSE GASES AND OTHER POLLUTANTS FROM THE TRANSPORT SECTOR: DELHI
 Iran. J. Environ. Health. Sci. Eng., 28, Vol. 5, No. 2, pp. 117-124 INVENTORY OF GREEN HOUSE GASES AND OTHER POLLUTANTS FROM THE TRANSPORT SECTOR: DELHI 1 C. Sharma, *1,2 R. Pundir 1 Radio and Atmospheric
LONDON ATMOSPHERIC EMISSIONS INVENTORY
 LONDON ATMOSPHERIC EMISSIONS INVENTORY Julius Mattai and David Hutchinson, Greater London Authority (julius.mattai@london.gov.uk and david.hutchinson@london.gov.uk) INTRODUCTION The London Atmospheric
Layers of the Atmosphere. Troposphere Stratosphere Mesosphere Thermosphere
 Air Pollution Layers of the Atmosphere Troposphere Stratosphere Mesosphere Thermosphere Troposphere Composition Sea level 17km Composition 78% Nitrogen 20% Oxygen Other 2%... Water vapor Argon gas Carbon
A review on Assessment of Air Pollution due to Vehicular Emission in Traffic Area
 International Journal of Current Engineering and Technology E-ISSN 2277 4106, P-ISSN 2347 5161 2018 INPRESSCO, All Rights Reserved Available at http://inpressco.com/category/ijcet Review Article A review
Possible Exam Questions for Other Topics in Chemistry 10
 Climate Change (first exam) Possible Exam Questions for Other Topics in Chemistry 10 1. Convert between the following terms and definitions Anthracite = the highest rank of coal harder, glossy black coal
ENVIRONMENTAL MONITORING REPORT
 ENVIRONMENTAL MONITORING REPORT BASED ON DATA GENERATED FROM APRIL 2018 SEPTEMBER 2018 FOR OCL INDIA LIMITED At/Po: RAJGANGPUR, District: SUNDARGARH, ODISHA AT LANJIBERNA LIMESTONE & DOLOMITE MINES PROJECT
(B) PREFEASIBILITY REPORT OF EXISTING BLACK TRAP PROJECT OF
 PREFEASIBILITY REPORT OF EXISTING BLACK TRAP PROJECT OF") (B) PREFEASIBILITY REPORT OF EXISTING BLACK TRAP PROJECT OF Makwana Dineshbhai Khimjibhai AT VILLAGE:- Tithava, TALUKA:- Wankaner, DIST.:- Morbi 1 CONTENTS 1.0 INTRODUCTION 1.1 PREAMBLE 2.0 EXCUTIVE SUMMARY
(B) PREFEASIBILITY REPORT OF EXISTING BLACK TRAP PROJECT OF Makwana Dineshbhai Khimjibhai AT VILLAGE:- Tithava, TALUKA:- Wankaner, DIST.:- Morbi 1 CONTENTS 1.0 INTRODUCTION 1.1 PREAMBLE 2.0 EXCUTIVE SUMMARY
National Action Plan of Air Pollution Control
 National Action Plan of Air Pollution Control Translation by Zhang Qiyue (Rachel.Zhangqy@gmail.com) Particular Pollutant: respirable suspended particle (PM10), fine particulate matter (PM2.5) General Background:
International Journal of Scientific & Engineering Research, Volume 6, Issue 5, May-2015 ISSN
 149 INDIAN ENERGY AT PRESENT AND PLANNING TO REDUCE ENERGY PROBLEM AND TO GENERATE ELECTRICITY BY RES(RENEWABLE ENERGY SOURCES) SHAHEEN HASAN EMAIL ID:shasan39@gmail.com 1. INTRODUCTION India is a country
Road Transport in India
 Simple Interactive Models for Better Air Quality Road Transport in India 2010-30 Emissions, Pollution & Health Impacts Dr. Sarath Guttikunda Ms. Puja Jawahar November, 2012 Synopsis Report Road Transport
Major Air Pollutants
 Major Air Pollutants 1 Particulate Matter Particulate refers to all substances that are not gases. It can be suspended droplets / solid particles / mixture of two. Size: 100 µm to 0.1 µm and less. Particulates
Changes in Seoul s Air Quality Control Policy
 Changes in Seoul s Air Quality Control Policy Date 2015-06-25 Category Environment Updater scaadmin Introduction Air pollution in urban areas is caused mostly by heating, industry, development, and transportation.
Environmental Resources: Renewable & Non-Renewable Resources & Energy
 Directions: Fill in the blanks. Renewable Resources & Energy Segment 1. Renewable Resources Are significant resources which can be replenished and reused to reduce negative environmental Are used as a
P.K. Viswanathan Chandra S. Bahinipati
 Determinants of Adopting and Accessing Benefits of Environmentally Benign Technologies: A study of Micro Irrigation Systems in North Gujarat, Western India P.K. Viswanathan Chandra S. Bahinipati GGKP Annual
EVALUATION STUDY ON THE IMPLEMENTATION OF MINIMUM WAGES ACT,1948 IN STONE BREAKING & STONE CRUSHING INDUSTRY IN GUJARAT
 EVALUATION STUDY ON THE IMPLEMENTATION OF MINIMUM WAGES ACT,1948 IN STONE BREAKING & STONE CRUSHING INDUSTRY IN GUJARAT 2007 08 Government of India Ministry of Labour & Employment Labour Bureau Chandigarh
Chapter 17 Air and Air Pollution
 Chapter 17 Air and Air Pollution The Atmosphere Each layer characterized by abrupt changes in temperature, the result of differences in the absorption of incoming solar energy. Troposphere: Weather Breeder
Role of thermal power plants in particulate matter emission # A case study of NTPC Dadri plant Using DMAIC approach
 Role of thermal power plants in particulate matter emission # A case study of NTPC Dadri plant Using DMAIC approach Himanshu Kumar*, Aditya Agrawal# * Manager (P&S Deptt.) - NTPC Dadri, # Senior system
Environmental Science 101 Air Resources. Fall Lecture Outline: Terms You Should Know: Learning Objectives: Reading Assignment:
 Environmental Science 101 Air Resources Fall 2012 1 Lecture Outline: 10. AIR POLLUTION A. The Atmosphere An Introduction B. Background Information About Air Pollution C. Six Principal Pollutants D. Air
RULES OF TENNESSEE DEPARTMENT OF ENVIRONMENT AND CONSERVATION BUREAU OF ENVIRONMENT DIVISION OF AIR POLLUTION CONTROL
 RULES OF TENNESSEE DEPARTMENT OF ENVIRONMENT AND CONSERVATION BUREAU OF ENVIRONMENT DIVISION OF AIR POLLUTION CONTROL CHAPTER 1200-3-15 EMERGENCY EPISODE PLAN TABLE OF CONTENTS 1200-3-15-.01 Purpose 1200-3-15-.03
Energy (including greenhouse gas emissions from energy)
") Page 1 of 16 Energy (including greenhouse gas emissions from energy) Draft provisions for the Regional Policy Statement FOR FURTHER INFORMATION Tami Woods DDI: 04 801 1032 X/08/05/01 March 2007 Powerdocs#
Page 1 of 16 Energy (including greenhouse gas emissions from energy) Draft provisions for the Regional Policy Statement FOR FURTHER INFORMATION Tami Woods DDI: 04 801 1032 X/08/05/01 March 2007 Powerdocs#
Assessment of Ambient Air Quality in the Vicinity of Cement Industries
 INTERNATIONAL JOURNAL OF APPLIED RESEARCH AND TECHNOLOGY Research ARTICLE Assessment of Ambient Air Quality in the Vicinity of Cement Industries Sadhana Chaurasia 1 and Ashok Tiwari 2 1 Head, Dept. of
IJSER 2 METHODOLOGY. 2.3 Characteristics of Air Quality Maps. 2.1 Study area. Suspended particulate matter. 2.2 Construction of Maps
 486 International Journal of Scientific & Engineering Research, Volume 6, Issue 3, March-2015 AIR QUALITY ASSESMENT OVER YEARS ON DIWALI USING GIS APPROACH Joginder Singh Yadav, Amul Patwal Abstract Activities
THE AIR QUALITY CHALLENGE IN CHINA and ASIA
 TECHNICAL PAPER THE AIR QUALITY CHALLENGE IN CHINA and ASIA SUMMARY Global Warming as measured by increasing carbon dioxide levels is a major issue in China, and current air quality levels due to Particulates
Life Cycle Assessment of the Cement Industry in Zimbabwe
 Life Cycle Assessment of the Cement Industry in Zimbabwe Charles Mbohwa 1, Sibusiso Moyo 2 1 University of Johannesburg, Johannesburg, Gauteng, South Africa, 2 University of Zimbabwe, Harare, Zimbabwe
Air Quality 101. Presentation to the Transportation and Environment Committee
 Air Quality 101 Presentation to the Transportation and Environment Committee September 22, 2008 1 Presentation Overview Air Quality Standards Ground-Level Ozone DFW Non-Attainment Area State Implementation
MONITORING OF AIR QUALITY IN HANI ELEZIT DURING OF YEAR 2016
 MONITORING OF AIR QUALITY IN HANI ELEZIT DURING OF YEAR 16 Rushan Ceka 1, Shkumbin Shala 2, Mile Srbinovski 1, Kemajl Bislimi 3, Osman Fetoshi 4,*, Flamur Salihu 4, Murtezan Ismaili 1 1 South East European
AIR QUALITY STATUS OF BENZENE, TOLUENE, ETHYLBENZENE AND XYLENE IN MUMBAI CITY
 Proceedings of the Third International Symposium on Air Quality Management at Urban, Regional and Global Scales. pp. 726-732, 26-30 September 2005, Istanbul Turkey AIR QUALITY STATUS OF BENZENE, TOLUENE,
Clean Air Act of 1970
 Clean Air Act of 1970 Set National Ambient Air Quality Standards (NAAQS), to protect public health and welfare Set New Source Performance Standards (NSPS), that strictly regulated emissions of a new source
CLEAN AIR FOR EUROPE - THE BASELINE ASSESSMENT
 CLEAN AIR FOR EUROPE - THE BASELINE ASSESSMENT Clean air is essential for a good quality of life and it enhances the social well being of European citizens. Scientific assessments reveal a range of harmful
ANNEXURE- II Proposed TOR
 ANNEXURE- II Proposed TOR Annexure II Terms of Reference for EIA for Setting up of Ligno-Cellulosic Biomass based second generation (2G) Ethanol Bio-Refinery with capacity of 100 KLPD at village-sainjani,
Evaluation of air quality in the Miechów district, Poland
 Available online at www.worldscientificnews.com WSN 110 (2018) 219-226 EISSN 2392-2192 SHORT COMMUNICATION Evaluation of air quality in the Miechów district, Poland Rafał Bielecki 1, *, Marta Kaźmierczak
Air Quality Monitoring
 Air Quality Monitoring in the vicinity of a CNRL well blowout February 25, 2010 to March 9, 2010 Summary report Overview All monitoring sites were downwind of the Canadian Natural Resources Limited (CNRL)
1 Perception Survey results
 1 Perception Survey results Government of India and different state governments have taken several steps to combat air pollution. However, unless people can participate meaningfully in events and processes
Air Pollution. Asian Brown Cloud. Developed Countries have reduced emissions recently
 Study Questions 1. Compare and contrast primary vs. secondary pollutants, giving examples of each. 2. Compare and contrast indoor vs. outdoor pollution, listing specific examples and sources of each. 3.
 ENVIRONMENTAL MONITORING REPORT BASED ON DATA GENERATED FROM OCTOBER 2016 MARCH 2017 FOR OCL INDIA LIMITED At/Po: RAJGANGPUR, District: SUNDARGARH, ODISHA AT LANJIBERNA LIMESTONE & DOLOMITE MINES PROJECT
1. The layer that contains most of the mass of the atmosphere is the. A. Stratosphere B. Troposphere C. Mesosphere D. Exosphere
 1. The layer that contains most of the mass of the atmosphere is the A. Stratosphere B. Troposphere C. Mesosphere D. Exosphere 2. Which of the following is a secondary pollutant? A. H 2 SO 4 B. O 3 C.
Vista Canyon Transit Center - Air Quality Technical Memorandum
 803 Camarillo Springs Road, Suite C Camarillo, California 93012 (805) 437-1900 FAX (805) 437 1901 www.impactsciences.com MEMORANDUM To: Kris Markarian, City of Santa Clarita Job No. 1046.003 From: Susan
Sources of Nitrogen in Alberta
 Sources of Nitrogen in Alberta CASA Science Symposium on Nitrogen David Niemi Science & Technology Branch - CAC Environment Canada September 27, 2006 Assistance from: EC CAC Section, AB Environment: Bob
Farhad Pooran, Ph.D., P.E. Rockville, Maryland Annual Meeting of ITS Midwest
 Managing Traffic Congestion Using Air Quality Data Farhad Pooran, Ph.D., P.E. Telvent Transportation ti North America Rockville, Maryland 2009 Annual Meeting of ITS Midwest Introduction World-wide activities
FABRICATION AND TESTING OF AUTOMOBILE POLLUTANTS ABSORBERS
 International Journal of Mechanical Engineering and Technology (IJMET) Volume 8, Issue 5, May 217, pp. 3 35, Article ID: IJMET_8_5_32 Available online at http://www.iaeme.com/ijmet/issues.asp?jtype=ijmet&vtype=8&itype=5
Croatia Air Quality Policy Matrix Goals Status Current Policies & Programmes GENERAL OVERVIEW
 Croatia Air Quality Policies This document is based on research that UNEP conducted in 2015, in response to Resolution 7 of the UNEA 1. It describes country-level policies that impact air quality. Triple
GUJARAT LIVELIHOOD PROMOTION COMPANY (An irnplementirlg Agency for Mission Mangalam)
") GUJARAT LVELHOOD PROMOTON COMPANY (An irnplementirlg Agency for Mission Mangalam).d Rlbcl< No-8. rd Floor, Jd~og Rhaban, Sector-, Gandhinagar. 'h :- -85/, () 909997698 # No. MMfGLPCAclBankl Date: - 07/0/0
GUJARAT LVELHOOD PROMOTON COMPANY (An irnplementirlg Agency for Mission Mangalam).d Rlbcl< No-8. rd Floor, Jd~og Rhaban, Sector-, Gandhinagar. 'h :- -85/, () 909997698 # No. MMfGLPCAclBankl Date: - 07/0/0
Going One Step Beyond in North Denver
 Going One Step Beyond in North Denver A Neighborhood Scale Air Pollution Modeling Assessment Part I : Predicted Mobile Emissions in 2035 Michael Ogletree Denver Environmental Health Purpose To compare
EXISTING PROJECT FOR ORDINARY SAND MINING
 (C) PROJECT REPORT OF EXISTING PROJECT FOR ORDINARY SAND MINING OF JASHUBEN CHHAGANBHAI OAD AT VILLAGE:-TIMBA, TALUKA:- KAMREJ, DIST.:- SURAT 1 CONTENTS 1.0 INTRODUCTION 1.1 PREAMBLE 2.0 EXECUTIVE SUMMARY