Kerdiffstown Landfill Remediation Project
|
|
|
- Bertram Daniels
- 5 years ago
- Views:
Transcription
 Vol")
 Kildare C ounty")

")

1 Envir onmental Impact Assessment Report (EIAR) Vol ume 4 of 4: Appendices ( Part 4) Kildare C ounty Council Kerdiffstown Landfill Remediation Project Kildare County Council Environmental Impact Assessment Report (EIAR) Volume 4 of 4: Appendices (Part 4) 32EW5604 DOC 0056 Final August 2017


2 Environmental Impact Assessment Report (EIAR) Volume 4 of 4: Appendices (Part 4) Appendices List Appendix No. Title Part 1 A4.1 Road and New Site Access Design Technical Note A4.2 Assessment of Predicted Settlement A4.3 Capping and Waste Slope Stability Assessment A4.4 Leachate Management Plan A4.5 Landfill Gas Management Plan A4.6 Surface Water Management Plan A4.7 Earthworks Summary Technical Note A4.8 Landscape Masterplan Statement A4.9 Accident Prevention and Emergency Response Plan A4.10 Monitoring and Control Plan A6.1 EIA Scoping Letter Template A6.2 EIA Scoping Submissions A7.2 Dispersion Modelling Assessment Methodology A7.2 Laboratory Analysis Certificates for Dust A7.3 Laboratory Analysis Certificates Trace Gases A VOC Emission Survey A7.5 October 2016 Dust and Odour Report A Flare Emissions Monitoring Report A7.7 SKM Enviros 2013 Odour Control Plan A7.8 SKM Enviros 2013 Outline Life Cycle Assessment A7.9 Dispersion Modelling Assessment Results A8.1 Noise Monitoring Survey Report A8.2 Calibration Certificates A9.1 Visual Impact Appraisals at Selected Viewpoints A10.1 Impact Assessment and the Cultural Heritage Resource A10.2 Geophysical Survey A10.3 Recorded Monuments and Places within the Surrounding Area A10.4 Stray Finds within the Surrounding Area A10.5 Legislation Protecting the Archaeological Heritage Resources A10.6 Legislation Protection of Architectural Heritage Resource A10.7 Recorded Structures and NIAH Structures within the Surrounding Area A11.1 Legislation, Policy and Guidelines A11.2 Zones of Influence Informing the Assessment A11.3 Bat Conservation Ireland Records A11.4 Photos A11.5 Flora Species List A11.6 Bat Survey Results A11.7 Breeding Bird Survey Results A11.8 Frog Derogation Licence 2017 A11.9 Artificial Sand Martin Bank Creation A11.10 Appropriate Assessment Screening Report Part 2 A12.1 Groundwater and Surface Water Monitoring Report Quarter Part 3 A12.2 Groundwater and Surface Water Monitoring Report - December 2016 Part 4 A12.3 Groundwater DQRA Technical Note A13.1 Flood Risk Assessment A13.2 Monitoring Details A13.3 Biological Q-rating Assessment of the Morell River A13.4 EPA Hydrotool Report for the Morell River A14.1 Traffic and Transport Assessment A14.2 TRICS Output Files A14.3 Road Safety Audit
3 Environmental Impact Assessment Report (EIAR) Volume 4 of 4: Appendices Appendix A12.3 Groundwater DQRA Technical Note Page A12.3-1
4 Groundwater DQR A T echnical N ote Kildare C ounty C ouncil Kerdiffstown Landfill Remediation Project Kildare County Council Groundwater DQRA Technical Note Rev 2 10 March 2017 Document history and status Revision Date Description By Review Approved 1 15/02/2017 First issue for client comment Ryan Turner Vanina Saint Martin Rhianna Rose 2 10/03/2017 Second issue for client information Ryan Turner Mark Burston, Vanina Saint Martin Rhianna Rose Distribution of copies Revision Issue approved Date issued Issued to Comments 2 09/03/ /03/2017 Kevin Motherway For information
5 Kerdiffstown Landfill Remediation Project Project No: Document Title: Revision: 32EW5604 Groundwater DQRA Technical Note V2 Date: 10 March 2017 Client Name: Project Manager: Author: File Name: Jacobs U.K. Limited 160 Dundee Street Edinburgh EH11 1DQ United Kingdom T +44 (0) F +44 (0) Kildare County Council Rhianna Rose Ryan Turner \\Iedub1-fil001\ji\Sustainable Solutions\Kerdiffstown Landfill\4 - Documents\4.1 - Issued Documents\32EW5604 J Hydrogeological Task\2017_03_10 Kerdiffstown DQRA 2017.docx Copyright 2017 Sinclair Knight Merz (Ireland) Limited (Jacobs). The concepts and information contained in this document are the property of Jacobs. Use or copying of this document in whole or in part without the written permission of Jacobs constitutes an infringement of copyright. Limitation: This technical note has been prepared on behalf of, and for the exclusive use of Jacobs Client, and is subject to, and issued in accordance with, the provisions of the contract between Jacobs and the Client. Jacobs accepts no liability or responsibility whatsoever for, or in respect of, any use of, or reliance upon, this technical note by any third party. i
6 Contents 1. Introduction Introduction and Objectives Background Justification for Modelling Approach and Software Monte Carlo Probabilistic Risk Assessment RAM Methodology RAM3 Model Calibration and Validation LandSim Methodology Structure of this Technical Note Zone Zone 1 model construction Model output and Sensitivity Assessment Interpretation Assessment of Predicted Concentrations in the Uncapped Model Comparison of Capped and Uncapped Models Summary of Zone 1 Model Zone 2A Zone 2A Model Construction Model Output Interpretation Assessment of Uncapped Scenario Predicted Concentrations Comparison of Capped and Uncapped Models Summary of Zone 2A Model Zone 2B Zone 2B model construction Model output Interpretation Assessment of Uncapped Scenario Predicted Concentrations Comparison of capped and uncapped models Summary of Zone 2B Model Zone Zone 3 model construction Model output Interpretation Summary of Zone 3 Model Zone Zone 4 model construction Model output Interpretation Assessment of Predicted Concentrations ii
7 6.3.2 Comparison of capped and uncapped models Summary of Zone 4 Model Summary References Appendix A. Zone 1 input parameters and results Appendix B. Zone 2A specific input parameters and results Appendix C. Zone 2B specific input parameters and results Appendix D. Zone 3 input parameters Appendix E. Zone 4 specific input parameters and results iii
8 1. Introduction 1.1 Introduction and Objectives This technical note provides details of groundwater detailed quantitative risk assessments (DQRAs) undertaken to assess the potential impacts to groundwater and associated surface water receptors from the Kerdiffstown landfill site in its current condition and following the proposed remediation works. The assessment has been undertaken for each of the five identified zones at the site which contain waste material. The principal objective of the DQRAs is to quantify the effects of the proposed remediation of the Kerdiffstown landfill site on the water receptors, including assessing the likely effects of capping the site, one benefit of which is to reduce rainwater recharge into the wastes. 1.2 Background Kerdiffstown landfill is a former sand and gravel quarry which has been progressively backfilled with wastes by a variety of operators from the 1950s onwards. Details of these earlier wastes are not known. However, the site was then operated as a licenced waste facility between 1995 and 2010 and was effectively abandoned in mid in an unsecured condition. Since completion of the environmental liabilities assessment in 2010, Jacobs has been working with the EPA and KCC and was appointed as Framework Contractor in February Over the years groundwater monitoring boreholes have been installed within and outside the site to determine the extent of any groundwater contamination associated with the landfilled waste. Jacobs has completed groundwater and surface water monitoring on a monthly basis with the most recent report being produced following the six-monthly monitoring in December 2016 (Reference 1). Reference 1 describes the site setting and defines the current groundwater quality data and assesses trends in groundwater quality. The reference also contains a plan showing monitoring borehole locations. The reference also includes details of the groundwater level monitoring and the local groundwater regime. Groundwater quality and level data are not provided in this technical note and if required Reference 1 should be read to gain an understanding of groundwater quality and groundwater levels at the site. The most recent site investigation was undertaken in the autumn of Factual data from this investigation are provided in Reference 2 and relevant data from the investigation are considered in the geology and hydrogeology chapter of the Environmental Impact Assessment Report (EAIR, Reference 3). The Kerdiffstown Landfill site has been split into several zones, each zone having characteristic properties in terms of historical waste disposal and site features. Descriptions and conceptualisation of each zone are provided in the Preliminary CSM Technical Note (Jacobs, Reference 4). For each zone, conceptual Site Models (CSMs) have been defined based on zone specific waste type, geology and hydrogeology. The receptors have been identified as the groundwater within the sand and gravels or overburden deposits, the limestone aquifer (thought to be restricted to the upper 5m to 10m of weathered bedrock known as the transition zone where fractures are present) and the Morell River which is in hydraulic connection with the groundwater in the overburden. 1.3 Justification for Modelling Approach and Software The modelling approach adopted for this assessment has used two probabilistic analytical software packages, LandSim and RAM3. An outline of these modelling packages is provided in the following sections, but for more detail Reference 5 and Reference 6 should be read. Previous modelling of Zone 1 (Reference 7) utilised the LandSim software package which is modelling software developed by England s Environment Agency to assess the impacts from typical landfill sites. However, for the purpose of this assessment, the RAM3 modelling package has been used to model Zone 1 as it offers more 1
9 flexibility in terms of the contaminant sources, pathways and receptors to simulate the pathway from the saturated waste as well as that from recharge passing though the waste and unsaturated zone into the overburden groundwater. The RAM3 software package has also been used for modelling impacts from Zones 2A, 2B and 4 as these have characteristics similar to Zone 1 with the presence of waste beneath the water table (except for Zone 2A) and having no engineered liner at the base of the waste. For Zone 3, the lined landfill cell has a basal liner and, following remediation, would be completed with an engineered cap. Wastes in this zone are also above the water table and as such Zone 3 is better suited to be modelled using the LandSim program Monte Carlo Probabilistic Risk Assessment The Monte Carlo approach to probabilistic risk assessment scientifically addresses the case where a parameter may have a range of values. In this approach, parameters which have a range of values are considered in turn. Instead of assigning a single value to each parameter, a combination of data and expert judgement are used to define the distribution of possible values that the parameter might take. This allows for the possibility that a given parameter might, at this site, have a particularly low or high value, but would also incorporate the knowledge of how likely these extreme values are. Once all the parameters with a range of values have been associated with a probability distribution in this way, the model is evaluated many times. In each simulation, values are chosen for each parameter with a range of values by sampling a random value from its probability distribution. The distribution of results from the model represents our understanding of the uncertain consequences of our range of values used for the input parameters. This approach applies to both LandSim and RAM RAM Methodology RAM is an Excel spreadsheet based modelling package published by ESI Limited that provides an assessment of risk using the source-pathway-receptor methodology. In this approach, contaminant migration pathways are identified from the conceptual model. The corresponding risk of groundwater contamination is evaluated by considering the three components in sequence, with the contaminant release from the source providing the input flux to the pathway and the contaminant flux from the pathway providing the contaminant load to the receptor. The source of the contaminants is modelled based on leachate from the contaminated material. The pathway is modelled as an advection-dispersion-retardation-decay transport model, solved using a Laplace transform solution method. The receptor can be an aquifer, abstraction borehole or a river, with for example, dilution in a river being considered. The analysis along each pathway takes account of the geometry of the pathway, but is essentially one-dimensional, with a simple description of the physical parameters affecting the contaminant migration along the pathway. The sources, pathways and receptors determined in the CSM are entered into RAM as a graphical representation as shown in Figure 1 for Zone 1. The spreadsheet model represents the key properties of the migration pathway as a one-dimensional flow geometry, and through the Monte Carlo method, it is able to quantify the outcome where a range of values might apply for any given parameter. Results from the RAM models have been reported at the 50%ile and 95%ile level RAM3 Model Calibration and Validation The RAM3 models for each zone have been calibrated using groundwater quality data collected in ground investigations and monitoring works. A key consideration in the calibration of the models is the range of source concentrations which are input to each model. Source concentrations used for each zone have been determined from consideration of the leachate quality obtained from Zone 3 between 2010 and 2016, the results 2
10 of leaching tests on soil samples collected in the 2016 ground investigation and from the concentrations of the determinands measured in groundwater adjacent to each zone. For each model, the calibration has considered the concentrations in groundwater in the overburden deposits at a point 10m from the edge of the zone and in the groundwater adjacent to the surface water receptor (Morell River). Predicted concentrations in the river, following dilution, are provided in the surface water chapter of the EIA. Each zone has been modelled for substances that have been identified as being elevated in groundwater and leachate at the site which have a range of physiochemical properties. This includes organic and inorganic substances as shown in Table 1.1. Table 1.1 Substances Considered in the Assessment Substance Mobility Degradation Rate Rationale for including in the assessment Inorganic substances Chloride Ammoniacal nitrogen Nickel Zinc Organic substance* Benzene Highly mobile with no retardation. Moderate mobility with low retardation Low mobility with high retardation Low mobility with high retardation Compared to other organic substances, benzene has a relatively high mobility Substance does not degrade In the model it is assumed that there is no degradation, although under ideal circumstances ammoniacal nitrogen can degrade to nitrate Substance does not degrade Substance does not degrade Moderate degradation rate, with a half-life in the order of a few years Chloride is a key contaminant of landfill leachate and is identified as being elevated in groundwater at the Kerdiffstown site. Ammoniacal nitrogen is a key contaminant of landfill leachate and is identified as being elevated in groundwater at the Kerdiffstown site. Nickel is identified as being elevated in the leachate collected in Zone 3, although relatively low concentrations are identified in groundwater (for example up to 0.079mg/l.in borehole EMW03 at the edge of Zone 1) Leaching test data for samples from Zone 1 also showed relatively low concentrations of nickel ranging from <0.002mg/l to 0.075mg/l. Zinc is identified as being elevated in the leachate collected in Zone 3, although relatively low concentrations are identified in groundwater (although up to 0.3mg/l in EMW13 at the edge of Zone 1) Leaching test data for samples from Zone 1 showed moderate concentrations of zinc ranging from mg/l to 0.157mg/l. Benzene has a relatively low guideline value and has been detected periodically in the leachate from Zone 3, although generally it is not detected in groundwater. 3
11 Substance Mobility Degradation Rate Rationale for including in the assessment Mecoprop Compared to other organic substance, mecoprop has a relatively high mobility High degradation rate, with a half-life in the order of 10s to 100s of days. Mecoprop has been detected in groundwater at concentrations above the interim guideline value IGV* (IGV). Phenol Compared to other organic substance, phenol has a relatively high mobility High to moderate degradation rate, with a half-life in the order of year. Phenol has been detected in groundwater at concentrations above the IGV. * For organic substances, the mobility is related to the organic content of the soils as well as the organic partition coefficient ** IGVs are provided in Reference LandSim Methodology LandSim allows the computer simulation of leakage from a typical landfill site to be modelled on the basis of key site-specific parameters and the landfill s setting. This includes design of the landfill cap and liner system and the control of leachate levels within the waste. Few of the input parameters (such as rainfall infiltration, leachate concentrations) are known exactly and therefore a probabilistic model is considered to be the best approach for assessing groundwater impacts. That is because each parameter can be described by a range of possible/probable values incorporating the available information and selecting values for each simulation within this range. During each simulation the parameters are assigned a value from within the defined ranges. After say 1000 iterations, a range of possible predicted leakage or outcome values are obtained and it becomes possible to quantify the likelihood of a certain outcome. LandSim uses statistical distributions or probability density functions (PDFs) to characterise many of the input parameters. Each time a calculation is carried out, one value from the defined input distributions is chosen by the computer code and, for example, a concentration at the receptor is calculated. Each result is stored such that after repeating the same calculation many times, an output distribution for the concentration at the receptor is obtained. The distribution output is given in terms of percentiles (%iles). These %iles specify the probability with which a certain value (e.g., leakage rate) will not be exceeded. For instance, if the 95%ile of a leakage rate distribution is given as 0.1m 3 /day, there is a 95% chance that the actual leakage rate will be below or equal to 0.1 m 3 /day. It follows that there is also a 5% chance that the actual leakage rate will be above this. The 50%ile output is viewed as the most likely result from the model. Jacobs considers that the 95%ile output is sufficient to represent a worst case output for the Kerdiffstown site. 1.4 Structure of this Technical Note This technical note is divided into the models for each zone with source input data shown in a corresponding appendix for each zone. The results output from each model is also presented in the appendices with a summary of the results. The technical note also provides an assessment of the results and considers the site as a whole, the key issues identified from the models and how this fits in with the remediation of the site. 4

12 2. Zone Zone 1 model construction The CSM for Zone 1 (and other zones) is provided in the Preliminary CSM Technical Note (Reference 4). RAM has the ability to represent waste sources below and above the groundwater table. This is simulated via the user input of different pathways and a water balance using the modelling software in Advanced Mode. The conceptual breakdown of the CSM for the RAM model is shown on Figure 1. Figure 1 : Conceptual breakdown of the CSM of Zone 1 for the RAM model The Zone 1 Uncapped model was calibrated using groundwater quality concentrations recorded immediately downgradient of Zone 1, as well as in vicinity of the Morell River. Key parameters used during the calibration process were the source term concentrations and the hydraulic conductivity of the overburden deposits. Source term concentrations used as model inputs for ammoniacal nitrogen, chloride and metals were derived from available ground investigation data (Zone 1 leachability tests from 2016 and Zone 3 leachate quality data obtained between 2010 and 2016). Source inputs for formaldehyde, mecoprop and phenol were based upon a range of literature values as set out in the Groundwater DQRA Report (Reference 7). Hydraulic conductivity estimates were obtained from site specific permeability estimates for the overburden deposits and the limestone bedrock. 5
13 In addition, partition coefficient (Kd) value estimates were derived from the LandSim manual, with organic partition coefficient (Koc) values for 1 mecoprop, 2 phenol and 3 formaldehyde being derived from literature values. Groundwater head, hydraulic gradient and fraction of organic carbon (foc) values were obtained from local ground investigations and porosity estimates were derived from the LandSim help files. Dry bulk density estimates were obtained from ConSim help files and half-life estimates were derived from various literature sources (from the Environment Agency, US EPA and the LandSim and ConSim help files). Model inputs are provided in Appendix A. Following the initial model which represents Zone 1 in its current uncapped state, a further model ( Zone 1 Capped ) was created to simulate a cap being placed above the waste. For the capped scenario infiltration rates have been calculated using the RAM software based on the permeability of the cap and assuming that drains are installed around the entire edge of the zone. It should be noted that a key limitation with RAM is the ability to run the capping scenarios applying an initial phase of open waste infiltration followed by a capped period. The period during which the waste cannot be properly simulated as open waste generates a higher source concentration and a slower decrease in the source term. This generates a level of conservatism which only applies to the capped scenario. This limitation needs to be taken into account when looking at the results obtained and comparing uncapped and capped scenarios. 2.2 Model output and Sensitivity Assessment Tables 2.1 and 2.2 summarise the predicted peak concentrations at 50%ile and 95%ile for ammoniacal nitrogen in both the uncapped and capped scenarios. Results for the other substances are provided in Appendix A and Figures 2.1 to 2.8 show ammoniacal nitrogen concentrations for the 95%ile results. Results are reported in Tables 2.1 and 2.2 for: - Saturated waste : this is the source term concentration within the saturated portion of the waste; - Overburden 10m from the zone : groundwater concentration within the overburden deposits 10m away from the zone boundary; - Overburden at the Morell River: groundwater concentration within the overburden deposits adjacent to the Morell River (note this is not the concentration in the river itself, rather the groundwater adjacent to the river. Dilution of the contaminants would subsequently occur within the river); and - Limestone: groundwater concentration within the limestone aquifer 50m away from the zone boundary. Table 2.1 : Uncapped Model Results for Ammoniacal Nitrogen in Zone 1 Receptor 50%ile 95%ile Peak Concentration (mg/l) Time to Peak (years) Peak Concentration (mg/l) Time to Peak (years) Saturated waste Overburden 10m from the zone Overburden at the Morell River Environment Agency, The Effects of Contaminant Concentration on the Potential for Natural Attenuation R&D 2 Environment Agency, Compilation of data for priority organic pollutants for derivation of Soil Guideline Values 3 US EPA RBCA dataset 6
14 Receptor 50%ile 95%ile Peak Concentration (mg/l) Time to Peak (years) Peak Concentration (mg/l) Time to Peak (years) Limestone Table 2.2 : Capped Model Results for Ammoniacal Nitrogen in Zone 1 Receptor 50%ile 95%ile Peak Concentration (mg/l) Time to Peak (years) Peak Concentration (mg/l) Time to Peak (years) Saturated waste Overburden 10m from the zone Overburden at the Morell River Limestone 50m from the zone
15 Figure 2.1 : Zone 1 Uncapped Saturated Waste (95%ile) Figure 2.2 : Zone 1 Capped Saturated Waste (95%ile) It would be expected that the saturated waste concentrations are the same in both capped and uncapped scenarios in the first 20 years (or until such time the wastes are capped), at which point the capping is placed and the concentration decline shapes would diverge. However a review of Figures 2.1 and 2.2 shows that there is a saturated waste source concentration of 200mg/l higher in the capped scenario compared to the uncapped scenario for ammoniacal nitrogen at the 95%ile at the 20 year time point. This is due to the limitation of RAM to simulate a period of open waste followed by a capped waste. To attempt reducing the significance of this limitation, a sensitivity analysis on ammoniacal nitrogen was undertaken, with a reduced likely source concentration by 100mg/l and a reduced maximum source concentration by 200mg/l in the capped scenario. This resulted in concentrations of ammoniacal nitrogen 8
16 reasonably matching after 20 years the concentrations at 95%ile for saturated waste in the uncapped scenario. The results of this sensitivity analysis are provided in Table 2.3. Table 2.3 : Results of sensitivity analysis (Capped Model) Receptor Sensitivity Analysis Capped Scenario (50%ile) Sensitivity Analysis Capped Scenario (95%ile) Peak Concentration (mg/l) Time to Peak (years) Peak Concentration (mg/l) Time to Peak (years) Saturated waste Overburden 10m from the zone Overburden at the Morell River Limestone 50m from the zone A further sensitivity analysis was undertaken to explore the effect of increasing the source terms for chloride and zinc based upon recent ground investigation data which were not available during the initial modelling. The data indicated a potentially higher source concentration within Zone 1 wastes based on the leaching test results from samples collected from Zone 1. The chloride source distribution was therefore increased to range from 0.5mg/l to 500mg/l and the zinc source term was amended to range from 0.013mg/l to 3.7mg/l. The results of this secondary sensitivity analysis is summarised in Table 2.4. Table 2.4 : Results of sensitivity analysis to assess higher source concentrations (Uncapped Model) Receptor Uncapped Scenario (95%ile) Sensitivity Analysis Uncapped Scenario (95%ile) Peak Concentration (mg/l) Time to Peak (years) Peak Concentration (mg/l) Time to Peak (years) Chloride Saturated waste Overburden 10m from the zone Overburden at the Morell River Limestone 50m from the zone Zinc Saturated waste Overburden 10m from the zone Overburden at the Morell River Limestone 50m from the zone 1.91x x x
17 Figure 2.3 : Zone 1 Uncapped Overburden Receptor 10m from Zone (95%ile) Figure 2.4 : Zone 1 Capped Overburden Receptor 10m from Zone (95%ile) 10
18 Figure 2.5 : Zone 1 Uncapped Overburden at the River Morell Receptor (95%ile) Figure 2.6 : Zone 1 Capped Overburden at the River Morell Receptor (95%ile) 11
19 Figure 2.7 : Zone 1 Uncapped Limestone Receptor (95%ile) Figure 2.8 : Zone 1 Capped Limestone Receptor (95%ile) 2.3 Interpretation Assessment of Predicted Concentrations in the Uncapped Model The uncapped scenario modelling results show the following: - For ammoniacal nitrogen the peak concentration would occur at around 50 to 100 years at the 10m overburden compliance point. For the point in the aquifer at the Morell River, the peak ammoniacal nitrogen concentration occurs at 80 to 150 years. The model results do largely agree with the 12
20 concentrations seen for ammoniacal nitrogen in the groundwater beneath and to the east of Zone 1 with concentrations in EMW03 on the zone s eastern boundary being in the order of 10s of mg/l, and up to 93mg/l. - For chloride, as this substance is not retarded, the peak concentrations are shown to occur slightly earlier at around 20 to 30 years for the 10m point in the overburden deposits and 30 to 40 years at the Morell River. To get concentrations in the model to be the same order of magnitude as measured close to the Morell River, a relatively low source term is required. The sensitivity analysis undertaken with an increased chloride source term produces concentrations in the overburden, 10m beyond the site boundary, of 141mg/l after 20 years, which fits in with the range of concentrations of chloride recorded in groundwater at the site boundary. Concentrations of chloride in groundwater at the site boundary are variable by location, and the value of 28mg/l in the original model agreed well with the majority of recorded chloride groundwater concentrations to the east of the site boundary. This points to the likely variability of the waste in this area in terms of chloride leachability. - For the metals (arsenic, nickel and zinc), in the 2000 years simulated, the concentrations remain below the IGVs at all off-site receptors, although with concentrations increasing as time progresses. The long times to observe peak impacts for the metals relate to the retardation coefficients with the metals being less mobile than chloride and ammoniacal nitrogen. The concentrations actually measured in the boreholes on the east of the landfill do tend to be higher than the model predicts, even though the modelled source term for nickel and arsenic are relatively elevated based on the abstracted leachate results from Zone 3 and the sensitivity analysis for zinc shows that with a high source term the concentrations still do not exceed the observed concentrations. - For mecoprop the model shows there would be no impact above the IGV 0f 0.01mg/l on the off-site receptors due to the retardation and degradation of this compound. Low concentrations of mecoprop are recorded in the groundwater to the east of Zone 1 in certain boreholes, with the maximum concentration typically being measured in EMW03 (for example 0.013mg/l in December 2016) with lower concentrations in boreholes closer to the river (for example in EMW05 where mecoprop was not detected in December 2016). - For formaldehyde, there is no IGV for comparison but the model results do show concentrations remain at a value significantly below the laboratory limit of detection. The groundwater monitoring for formaldehyde does show this compound to generally be absent in boreholes to the east of Zone 1. - For phenol both the concentrations for capped and uncapped scenarios would be marginally above the IGV 0f mg/l at the overburden receptor point 10m from the edge of the landfill for a short period with the peak concentration occurring at around 20 years. Groundwater monitoring does show phenol to be measured in boreholes immediately on the site boundary, but is generally not recorded in boreholes closer to the river. Overall, this model is believed to be a reasonable representation of the current site conditions for Zone 1, albeit that the metal concentrations recorded in the groundwater are higher than the model predicts Comparison of Capped and Uncapped Models For ammoniacal nitrogen, the capped model predicts greater peak concentrations than the uncapped model at each receptor for the 95%ile (although at the 50%ile the models do predict a lower concentration in the limestone aquifer). As previously discussed, the higher concentrations in the capped model is thought to be due largely to the limitations of the model to simulate the sequence of open waste followed by capping and resulting in source concentrations remaining higher in the first 20 years in the capped model. The sensitivity analysis, with a reduced source term to simulate source concentrations after 20 years matching the uncapped scenario records ammoniacal nitrogen concentrations 15 to 25% lower in overburden and 10 to 20% lower in bedrock than in the original capped model. Overall, there is no clear difference in ammoniacal nitrogen concentrations between the capped and uncapped models. That is believed to be caused that the saturated waste dominating the inflow into the groundwater system. 13
21 For chloride, the models show that at the overburden receptors 10m from the landfill and at the Morell River the peak concentrations are broadly similar, although as with ammoniacal nitrogen for the capped model the peak chloride concentration does occur at a later time. For the limestone aquifer, the models do show that the peak chloride concentration for the capped model is around 50% of the predicted concentration in the uncapped model. For the metals and organic substances, the model results show little difference between the peak concentrations for capped and uncapped models with all peak concentrations at all compliance points in the overburden and limestone being less than 0.004mg/l (4 g/l). The greatest difference is for formaldehyde in the limestone aquifer with the capped model showing a lower concentration than the uncapped model. 2.4 Summary of Zone 1 Model For Zone 1, the model suggests that the source term is dominated by the saturated waste component, and this is likely to remain the case for this zone such that even after capping, the saturated wastes would continue to have the major input of contaminants to groundwater. The cap will cause the rainfall infiltration which is migrating through the waste to reduce leachate generation and lead to a reduction in the build-up of leachate within the cell and potentially reduce the water levels beneath the landfill (any potential reduction in groundwater level is not included in the RAM model). A reduction in groundwater level beneath the waste, even if this reduction is small, would have benefits to the groundwater environment by: - Reducing the amount of waste that is saturated and hence reducing the source term; - Reducing the hydraulic gradient between the site and the Morell River such that the migration of contaminants would be slowed (allowing more time for degradation of organic compounds) and the volume of groundwater discharging to the river would be reduced; and - Reducing the difference in groundwater levels between the overburden and bedrock water bodies and therefore reducing the flow of groundwater from the overburden deposits to the bedrock transition zone. In addition, an engineered cap on Zone 1 has the benefit of providing better control for landfill gas and preventing the fugitive emissions of landfill gas and odour and allows surface water runoff to be controlled. It also prevents human contact with the waste materials present within the zone. 14
22 3. Zone 2A 3.1 Zone 2A Model Construction A similar conceptualisation was developed for Zone 2A compared to Zone 1. Waste geometry and travel distances to receptors have been adjusted although for Zone 2A it is assumed that there is no significant waste present below the groundwater table. Chemical characteristics (i.e source terms and Kd values) and overburden hydraulic conductivity estimates have been amended in line with zone specific ground investigation data. The other parameters are the same as those used in the Zone 1 model. As with Zone 1, a capped ( Zone 2A Capped ) and uncapped ( Zone 2A Uncapped ) model was produced. For the capped scenario infiltration rates have been calculated using the RAM software based on the permeability of the cap and assuming that drains are installed around the entire edge of the zone. Specific model inputs are provided in Appendix B. As for Zone 1, it should be noted that a key limitation with RAM is the ability to run the capping scenarios applying an initial phase of open waste infiltration followed by a capped period. The period during which the waste cannot be properly simulated as open waste generates higher source concentrations and a slower decrease in source term in the capped model, which generates a level of conservatism in the capped scenarios that does not apply to the uncapped scenarios. This limitation needs to be taken into account when looking at the factual results obtained with the capped scenarios. 3.2 Model Output Tables 3.1 and 3.2 summarise the peak values at 50%ile and 95%ile for ammoniacal nitrogen in both the uncapped and capped scenarios with output graphs in Figures 3.1 to 3.6. Results for the other substances are provided in Appendix B. Results are reported in Tables 3.1 and 3.2 for: - Overburden 10m from the zone : groundwater concentration within the overburden deposits 10m away from the zone boundary; - Overburden at the Morell River : groundwater concentration within the overburden deposits adjacent to the Morell River; and - Limestone: groundwater concentration within the limestone aquifer 50m away from the zone boundary. Table 3.1 : Uncapped Model Results for Ammoniacal Nitrogen in Zone 2A Receptor 50%ile 95%ile Peak Concentration (mg/l) Time to Peak (years) Peak Concentration (mg/l) Time to Peak (years) Overburden 10m from the zone Overburden at the Morell River Limestone
23 Table 3.2 : Capped Model Results for Ammoniacal Nitrogen in Zone 2A Receptor 50%ile 95%ile Peak Concentration (mg/l) Time to Peak (years) Peak Concentration (mg/l) Time to Peak (years) Overburden 10m from the zone Overburden at the Morell River Limestone 50m from the zone
24 Figure 3.1 : Zone 2A Uncapped Overburden Receptor 10m from Zone (95%ile) Figure 3.2 : Zone 2A Capped Overburden Receptor 10m from Zone (95%ile) 17
25 Figure 3.3 : Zone 2A Uncapped Overburden at the River Morell Receptor (95%ile) Figure 3.4 : Zone 2A Capped Overburden at the River Morell Receptor (95%ile) 18
26 Figure 3.5 : Zone 2A Uncapped Limestone Receptor (95%ile) Figure 3.6 : Zone 2A Capped Limestone Receptor (95%ile) 3.3 Interpretation Assessment of Uncapped Scenario Predicted Concentrations For Zone 2A there are currently limited monitoring data available for the zone. Borehole EMW11 is situated to the north-west of the zone and this borehole shows relatively low chloride concentrations and ammoniacal nitrogen is recorded as being below the limit of detection. The data do not appear to be representative of wastes identified in Zone 2A as shown on the borehole logs. To the east of the zone (in the direction of the Morell 19
27 River) Zone 1 and Zone 2B is present and as such it is not possible to determine the concentrations of substances due solely to Zone 1A. The uncapped scenario modelling results show the following: - For ammoniacal nitrogen the peak concentration for the uncapped zone would occur at around 30 to 40 years at the 10m compliance point. For the point in the aquifer at the Morell River, the peak ammoniacal nitrogen concentration occurs at 50 to 70 years. - For chloride, as this substance is not retarded, the peak concentrations are shown to occur slightly earlier than ammoniacal nitrogen at around 20 years for the 10m point in the overburden aquifer and 40 years at the Morell River. - For the metals (arsenic, nickel and zinc), the model shows that as with Zone 1, in the 2000 years that are simulated, the concentrations remain below the IGVs at all receptors, although with concentrations increasing as time progresses. - For mecoprop there would be no impact above the IGV on the receptors due to the retardation and degradation of this compound. - For formaldehyde there is no IGV for comparison but the model results do show concentrations do remain at a value significantly below the laboratory limit of detection. - The models do show that for the uncapped scenario the phenol concentration would be above the IGV at the overburden receptor point 10m from the edge of the landfill for a short period with the peak concentration occurring at around 10 years. The concentration of phenol in the capped model does not exceed the IGV at this point or other points in the overburden or limestone aquifers Comparison of Capped and Uncapped Models For all determinands, the capped model predicts lower concentrations at all receptors than the uncapped model with the exception of the 50%ile value in the limestone aquifer which shows a slight increase in the capped model. The reduction in groundwater concentrations occurs due to the lower recharge through the waste and more dilution in the groundwater flowing beneath the site for the capped model (for this zone it is assumed that input from waste beneath the water table is negligible). In the case of ammoniacal nitrogen and chloride, the predicted peak concentration for the capped scenario for ammoniacal nitrogen and chloride is around 40% of the uncapped concentration. For ammoniacal nitrogen the model predicts that the IGV concentration of 0.15mg/l would be exceeded at all compliance points. As with Zone 1, the peak concentration for the capped model occurs at a later time than the uncapped model. For the metals and organic substances, the model results show the peak concentrations for the capped scenario to be lower than the uncapped scenario, although in absolute terms the difference is not that great. However, as noted above for phenol the peak concentration for the capped model does not exceed the IGV whereas it does for the uncapped model. Because of the RAM limitation described earlier, the concentrations generated in the capped model are expected to be higher than the reality and the capped model has conservatism not present in the uncapped model. However, the original source term in Zone 2A is less significant than for Zone 1 and therefore the conservatism introduced for the capped Zone 2A is expected to be more minor than for Zone 1. Overall, this suggests that the capping would provide an overall betterment for Zone 2A. 20
28 3.4 Summary of Zone 2A Model For Zone 2A, the uncapped and capped models do show that there would be an improvement in groundwater quality following installation of the low permeability materials in this zone. This occurs due to lower infiltration into the wastes and subsequent higher dilution of leachate in the groundwater for the capped scenario. As this zone is modelled as having negligible saturated waste, there is no input of leachate from this source as dominates the other zones. In addition to the predicted improvements to groundwater quality, the emplacement of low permeability materials in Zone 2B has the benefit of providing better control for landfill gas and preventing the fugitive emissions of landfill gas and odour and allows surface water runoff to be controlled. It also prevents human contact with the waste materials present within the zone. 21
29 4. Zone 2B 4.1 Zone 2B model construction A similar conceptualisation was developed for Zone 2B compared to Zone 1. Waste geometry and travel distances to receptors have been adjusted and in the case of Zone 2B it is assumed that for this zone that waste is present beneath the groundwater table throughout the zone. Chemical characteristics (eg source terms and Kd values) and overburden hydraulic conductivity estimates have been amended in line with zone specific ground investigation and monitoring data. The model was calibrated using groundwater quality concentrations recorded immediately downgradient of Zone 2B as well as in vicinity of the Morell River. As with the other zones, a capped ( Zone 2B Capped ) and uncapped ( Zone 2B Uncapped ) model was produced. For the capped scenario infiltration rates have been calculated using the RAM software based on the permeability of the cap and assuming that drains are installed around the entire edge of the zone. Specific model inputs are provided in Appendix C. As for Zone 1, it should be noted that a key limitation with RAM is the ability to run the capping scenarios applying an initial phase of open waste infiltration followed by a capped period. The period during which the waste cannot be properly simulated as open waste generates higher source concentrations and a slower decrease in source term, which generates a level of conservatism in the capped scenarios that does not apply to the uncapped scenarios. This limitation needs to be taken into account when looking at the factual results obtained with the capped scenarios. 4.2 Model output Table 4.1 and Table 4.2 summarise the peak values at 50%ile and 95%ile for ammoniacal nitrogen in both the uncapped and capped scenarios with output graphs in Figures 4.1 to 4.8. Results for the other substances are provided in Appendix C. Table 4.1 : Uncapped Model Results for Ammoniacal Nitrogen in Zone 2B Receptor 50%ile 95%ile Peak Concentration (mg/l) Time to Peak (years) Peak Concentration (mg/l) Time to Peak (years) Saturated Waste Overburden 10m from the zone Overburden at the Morell River Limestone Table 4.2 : Capped Model Results for Ammoniacal Nitrogen in Zone 2B Receptor 50%ile 95%ile Peak Concentration Time to Peak Peak Concentration Time to Peak (mg/l) (years) (mg/l) (years) Saturated Waste Overburden 10m from the zone Overburden at the
30 Receptor 50%ile 95%ile Peak Concentration (mg/l) Time to Peak (years) Peak Concentration (mg/l) Time to Peak (years) Morell River Limestone 50m from the zone Figure 4.1 : Zone 2B Uncapped Saturated Waste (95%ile) Figure 4.2 : Zone 2B Capped Saturated Waste (95%ile) 23
31 Figure 4.3 : Zone 2B Uncapped Overburden Receptor 10m from Zone (95%ile) Figure 4.4 : Zone 2B Capped Overburden Receptor 10m from Zone (95%ile) 24
32 Figure 4.5 : Zone 2B Uncapped Overburden at the River Morell Receptor (95%ile) Figure 4.6 : Zone 2B Capped Overburden at the River Morell Receptor (95%ile) 25
33 Figure 4.7 : Zone 2B Uncapped Limestone Receptor (95%ile) Figure 4.8 : Zone 2B Capped Limestone Receptor (95%ile) 4.3 Interpretation Assessment of Uncapped Scenario Predicted Concentrations The uncapped scenario modelling results show the following: - for ammoniacal nitrogen the peak concentration for the uncapped zone would occur at around 30 to 40 years at the 10m compliance point. For the point in the aquifer at the Morell River, the peak ammoniacal nitrogen concentration occurs at 30 to 50 years. With respect to the observed concentrations in the groundwater, the model results do largely agree with the concentrations seen for ammoniacal nitrogen in the groundwater beneath and to the east of Zone 2B with concentrations in EMW07 and EMW19 on 26
34 the zone s eastern boundary being in the order of 5 mg/l. In both the model case and the actual monitoring results, ammoniacal nitrogen concentrations do exceed the IGV of 0.15mg/l. - For chloride, as this substance is not retarded, the peak concentrations are shown to occur slightly earlier at around 20 years for the 10m point in the overburden aquifer and at the Morell River. For chloride, to get concentrations in the model to be the same order of magnitude as measured in groundwater between the zone and the Morell River in EMW08 a relatively low source concentration is required such that the chloride model results at the overburden 10m assessment point (20mg/l at the 95%ile) are lower than measured in borehole EMW07 and EMW19 (these being 31mg/l and 27mg/l respectively in December 2016). - For the metals (arsenic, nickel and zinc), as with other zones the model shows that in the 2000 years that are simulated, the concentrations remain below the IGVs at all off-site receptors, although with concentrations increasing as time progresses. - For mecoprop there would be no impact above the IGV on the receptors due to the retardation and degradation of this compound. - For formaldehyde there is no IGV for comparison but the model results do show concentrations do remain at a value significantly below the laboratory limit of detection. - The uncapped model shows that for phenol the concentration would be above the IGV at the overburden receptor point 10m from the edge of the landfill for a short period with the peak concentration occurring at around 10 years. This is also the case for the capped scenario Comparison of capped and uncapped models For the majority of determinands and assessment points, the capped model predicts lower concentrations than the uncapped model (the 50%ile for impact on limestone does show the capped scenario to have slightly greater impact). In the case of ammoniacal nitrogen the predicted peak concentration for the capped scenario is around 75% of the uncapped concentration and for chloride the value is around 50%. For ammoniacal nitrogen the model predicts that the IGV concentration of 0.15mg/l would be exceeded at all compliance points. As with the other zones, the peak concentration for the capped model occurs at a later time than the uncapped. For the metals and organic substances, the model results show that for the majority of the substances the peak concentrations for the capped scenario to be lower than the uncapped scenario, although in absolute terms the difference is not significant. However, as noted above for phenol the peak concentration for both the capped and uncapped model does exceed the IGV although the peak concentration for the capped model is around 30% lower than for the uncapped model. Because of the RAM limitation described earlier, the concentrations generated in the capped model are expected to be higher than the reality and the capped model has conservatism not present in the uncapped model. However, the original source term in Zone 2B is less significant than for Zone 1 and therefore the conservatism introduced for the capped Zone 2B is expected to be more minor than for Zone 1. Overall, this suggests that the capping would provide an overall betterment for Zone 2B. 27
35 4.4 Summary of Zone 2B Model For Zone 2B, the uncapped and capped models do show that there would be an improvement in groundwater quality following installation of the low permeability materials in this zone. This occurs due to lower infiltration into the wastes and subsequent higher dilution of leachate in the groundwater for the capped scenario. However, as the saturated waste provides the input component for this zone and the wastes are likely to remain saturated after the zone is capped, the predicted improvement in groundwater quality is not that great. In addition to the predicted improvements to groundwater quality, the emplacement of low permeability materials in Zone 2B has the benefit of providing better control for landfill gas and preventing the fugitive emissions of landfill gas and odour and allows surface water runoff to be controlled. It also prevents human contact with the waste materials present within the zone. 28
36 5. Zone Zone 3 model construction Four LandSim models have been produced; two to represent the current site conditions and two to represent the site conditions following the filling of the lined cell and installation of an engineered cap. For each capped and uncapped scenario, two models were produced as follows: One model called overburden pathway to determine risks to the overburden groundwater quality, in particular in vicinity of the Morell River; and A second model called bedrock pathway to determine risks to the bedrock aquifer. Model inputs are provided in Appendix D. It should be noted that the capped model represents an enlarged waste area (as wastes are removed from other zones and placed into Zone 3). For the current site condition models, the source concentrations are based on recorded leachate concentrations from Zone 3, leachability tests and literature values. For the capped and fully landfilled scenario, the source concentrations were altered to reflect the source characteristics of waste moved from other zones at the site, using the predicted source outputs from the Zone 1 RAM model after 10 years. 5.2 Model output Table 5.1 summarises the peak values at 50%ile and 95%ile for the contaminants of concern modelled in Zone 3 up to 1000 years and compares them against the IGV criteria. Any contaminant concentration beyond 1000 years is considered of low significance from the point of view site management and legacy. It should be noted that the concentrations for hazardous substances are taken prior to entry into the groundwater body considered as receptor, and non-hazardous substances are taken within the receptor groundwater body at its point of compliance. These point of compliance for non-hazardous substances are considered to be the overburden groundwater adjacent to the River Morell and the bedrock groundwater immediately downgradient of Zone 3. It should be noted that for Zone 3, all other determinands included in the LandSim model (arsenic, benzene, cadmium, formaldehyde, mecoprop, mercury, nickel, phenol and zinc) did not show any breakthrough at the compliance points in the 1000 years that was simulated. Table 5.1 : Predicted Concentrations at Relevant Compliance Points LandSim Model Time to peak impact (years^) Peak Concentration (mg/l) Criteria Comparison 50%ile 95%ile 50%ile 95%ile IGV (mg/l) Exceedance Y/N? Ammoniacal Nitrogen Current Model (Bedrock Pathway) Current Model (Overburden Pathway) N/A 1000 ND 2.6x No x No Capped Model (Bedrock Pathway) N/A 1000 ND 1.5x No Capped Model (Overburden Pathway) x No 29
37 LandSim Model Time to peak impact (years^) Peak Concentration (mg/l) Criteria Comparison 50%ile 95%ile 50%ile 95%ile IGV (mg/l) Exceedance Y/N? Chloride Current Model (Bedrock Pathway) Current Model (Overburden Pathway) No No Capped Model (Bedrock Pathway) No Capped Model (Overburden Pathway) No Note: arsenic, benzene, cadmium, formaldehyde, mecoprop, mercury, nickel, phenol and zinc were also modelled but showed no breakthrough and are therefore not included in the table 5.3 Interpretation Table 5.1 shows that the scenarios simulated result in concentrations below IGVs. As a consequence, the restoration of Zone 3, with the addition of waste redistributed from other site zones is not expected to generate any additional contamination to the bedrock aquifer nor groundwater in the overburden deposits in close proximity to the Morell River. Whilst the capped model does show slightly greater concentrations than the uncapped model for ammoniacal nitrogen and chloride, this occurs principally due to the larger area of waste being present in the capped scenario due to the importation of materials from other zones on the site and the concentrations remain below IGV. This is therefore expected to have no impact on water receptors. A drainage failure scenario was simulated with an increased leachate head of 1m, and exceedances were only recorded for ammoniacal nitrogen after 800 years. The drainage failure scenario was simulated to reflect on temporary failures of the drainage system, and this sensitivity analysis shows that only a continuous and long term drainage failure would be a cause for concern for the site. 5.4 Summary of Zone 3 Model Due to the capped model having a larger area than the uncapped model, the capped scenario is shown to generate slightly higher concentrations of ammoniacal nitrogen and chloride in the groundwater than the uncapped scenario. However, in both cases the predicted impacts result in concentrations below the IGVs and have therefore no impact on the water receptors. It should also be considered that by transferring waste materials from other parts of the site to Zone 3, the risks in those other areas is reduced and placing the materials in a fully engineered landfill cell would provide overall betterment for the site. 30
38 6. Zone Zone 4 model construction A similar conceptualisation was developed for Zone 4 compared to Zone 1. However, waste geometry and travel distances to receptors have been adjusted. For Zone 4 it is assumed that there is both saturated and unsaturated waste and that the saturated waste is an area to the north of the zone. Chemical characteristics (eg source terms and Kd values) and overburden hydraulic conductivity estimates have been amended in line with zone specific ground investigation and monitoring data. The model was calibrated using groundwater quality concentrations recorded immediately downgradient of Zone 4. As with the other zones, a capped ( Zone 4 Capped ) and uncapped ( Zone 4 Uncapped ) model was produced. For the capped scenario infiltration rates have been calculated using the RAM software based on the permeability of the cap and assuming that drains are installed around the entire edge of the zone. Specific model inputs are provided in Appendix E. As for Zone 1, it should be noted that a key limitation with RAM is the ability to run the capping scenarios applying an initial phase of open waste infiltration followed by a capped period. The period during which the waste cannot be properly simulated as open waste generates higher source concentrations and a slower decrease in source term, which generates a level of conservatism in the capped scenarios that does not apply to the uncapped scenarios. This limitation needs to be taken into account when looking at the factual results obtained with the capped scenarios. 6.2 Model output Table 6.1 and Table 6.2 summarise the peak values at 50%ile and 95%ile for ammoniacal nitrogen in both the uncapped and capped scenarios. Results for the other substances are provided in Appendix E. Table 6.1 : Uncapped Model Results for Ammoniacal Nitrogen in Zone 4 Receptor 50%ile 95%ile Peak Concentration (mg/l) Time to Peak (years) Peak Concentration (mg/l) Time to Peak (years) Saturated Waste Overburden 10m from the zone Overburden at the Morell River Limestone Table 6.2 : Capped Model Results for Ammoniacal Nitrogen in Zone 4 Receptor 50%ile 95%ile Peak Concentration (mg/l) Time to Peak (years) Peak Concentration (mg/l) Time to Peak (years) Saturated Waste Overburden 10m from the zone Overburden at the Morell River
39 Receptor 50%ile 95%ile Peak Concentration (mg/l) Time to Peak (years) Peak Concentration (mg/l) Time to Peak (years) Limestone 50m from the zone Figure 6.1 : Zone 4 Uncapped Saturated Waste (95%ile) Figure 6.2 : Zone 4 Capped Saturated Waste (95%ile) 32
40 Figure 6.3 : Zone 4 Uncapped Overburden Receptor 10m from Zone (95%ile) Figure 6.4 : Zone 4 Capped Overburden Receptor 10m from Zone (95%ile) 33
41 Figure 6.5 : Zone 4 Uncapped Overburden at the River Morell Receptor (95%ile) Figure 6.6 : Zone 4 Capped Overburden at the River Morell Receptor (95%ile) 34
42 Figure 6.7 : Zone 4 Uncapped Limestone Receptor (95%ile) Figure 6.8 : Zone 4 Capped Limestone Receptor (95%ile) 6.3 Interpretation Assessment of Predicted Concentrations The uncapped scenario modelling results show the following: - For ammoniacal nitrogen, the peak concentration for the uncapped zone would occur at around 20 years at the 10m compliance point. For the point in the aquifer at the Morell River, the peak ammoniacal nitrogen concentration would also occur at around 20 years due to the relatively short distance from the zone s eastern boundary to the Morell River. The model results do largely agree with the concentrations seen for ammoniacal nitrogen in the groundwater beneath and to the east of Zone 4 with concentrations 35
43 in EMW18 on the zone s eastern boundary generally being below 1 mg/l and concentrations in EMW17 typically being between 1mg/l and 2mg/l. Both actual and model results exceed the IGV for ammoniacal nitrogen of 0.15mg/l. - For chloride, as this substance is not retarded, the peak concentrations are shown to occur slightly earlier at around 8 years for the 10m point in the overburden aquifer and at the Morell River. For chloride, the uncapped model largely agrees with the concentration in EMW18 (model results of 23mg/l at the 95%ile compared to monitoring results in the order of 20mg/l) but there are no boreholes further from the site towards the Morell River to allow further assessment. - For the metals (arsenic, nickel and zinc), as with other zones the model shows that in the 2000 years that are simulated, the concentrations remain below the IGVs at all off-site receptors, although with concentrations increasing as time progresses. - For mecoprop and phenol there would be no impact above the IGV on the receptors due to the retardation and degradation of these compounds. In the December 2016 monitoring round the concentrations of mecoprop and phenol were below the limit of detection. - For formaldehyde there is no IGV for comparison but the model results do show concentrations do remain at a value significantly below the laboratory limit of detection Comparison of capped and uncapped models For the majority of determinands and assessment points, the capped model predicts lower concentrations than the uncapped model. In the case of ammoniacal nitrogen the predicted peak concentration for the capped scenario is around 35% of the uncapped concentration and for chloride the value is around 35%. As with the other zones, the peak concentration for the capped model occurs at a later time than the uncapped. For the organic substances, the model results show that the peak concentrations for the capped scenario to be lower than the uncapped scenario, although in absolute terms the difference is limited. For the metals, the capped model does show the peak concentrations to be marginally higher than for the uncapped model, although in all cases the difference in peak concentration is less than mg/l (1 g/l). Because of the RAM limitation described earlier, the concentrations generated in the capped model are expected to be higher than the reality and the capped model has conservatism not present in the uncapped model. However, the original source term in Zone 4 is less significant than for Zone 1 and therefore the conservatism introduced for the capped Zone 4 is expected to be more minor than for Zone 1. Overall, this suggests that the capping would provide an overall betterment for Zone Summary of Zone 4 Model For Zone 4, the uncapped and capped models do show that there would be an improvement in groundwater quality following installation of the low permeability materials in this zone. This occurs due to lower infiltration into the wastes and subsequent higher dilution of leachate in the groundwater for the capped scenario. However, as the saturated waste provides the major input component for this zone, and the wastes are likely to remain saturated after the zone is capped, the predicted improvement in groundwater quality is limited. In addition to the predicted improvements to groundwater quality, the emplacement of low permeability materials in Zone 4 has the benefit of preventing human contact with the waste materials present within the zone. 36
44 7. Summary The DQRA undertaken for the five zones has shown that the proposed remediation works would improve groundwater quality in the majority of the zones although for Zone 1 and Zone 3 the model do not predict an improvement on groundwater quality for the capped scenarios. For Zone 1, the higher concentrations in the capped model is thought to be due to the limitations of the model to simulate the sequence of open waste followed by capping and resulting in source concentrations remaining higher in the first 20 years in the capped model combined with a high concentration source term and a significant proportion of saturated waste. In Zone 3, it is proposed that the capped landfill would take waste materials from other zones, resulting in a larger area containing waste compared to the current uncapped scenario. However, it should be borne in mind that by taking wastes from other zones which are currently not contained in a fully engineered landfill would reduce the risks in these other zones for the betterment of the site as a whole. The modelling does show that where wastes are present beneath the groundwater table it is this saturated waste that provides the dominant source of contaminants to the groundwater system. Capping of the site is unlikely to reduce groundwater levels to the extent that wastes are no longer saturated and these wastes would provide an on-going contaminant source. These saturated wastes are likely to provide a source of contamination over a shorter time period than the unsaturated wastes as groundwater flowing through the saturated wastes is likely to deplete the source quicker than the infiltration through the unsaturated waste. Whilst the contaminant mass in the unsaturated zone would eventually leach/seep downwards and act as a constantly replenishing source, with the cap the rate of this movement to the groundwater is reduced. It should be noted that the cap may lead to a reduction in groundwater levels, particularly beneath Zone 1, and this could have benefit by: - Marginally reducing the amount of waste that is saturated and hence reducing this aspect of the source term; - Reducing the hydraulic gradient between the site and the Morell River such that the migration of contaminants would be slowed (allowing more time for degradation of organic compounds) and the volume of groundwater discharging to the river would be reduced; and - Reducing the difference in groundwater levels between the overburden and bedrock water bodies and therefore reducing the flow of groundwater from the overburden deposits to the bedrock transition zone. Whilst the modelling of capping of the site to reduce infiltration does not predict a vast improvement in groundwater quality, the proposed remediation works have benefits outside of the groundwater improvements including. - Providing better control for landfill gas and preventing the fugitive emissions of landfill gas and odour. - Allowing surface water runoff to be collected and controlled. - Preventing human contact with the waste materials present within the site. These overall improvements allow for the site to be redeveloped for a beneficial community use. 37
45 8. References 1. Jacobs, Kerdiffstown Landfill Remediation Project. Groundwater and Surface Water Monitoring Report - December IGSL, Factual Report of 2016 Ground Investigation (in preparation). 3. Jacobs, Kerdiffstown Landfill Remediation Project. Environmental Impact Assessment Report (EIAR) - Chapter 13 Soils, Geology, Hydrogeology and Contaminated Land (in preparation). 4. Jacobs, Kerdiffstown Landfill. Preliminary CSMs Technical Note. 5. Environment Agency, The Development of LandSim ESI Limited, Guide to Using RAM3 Risk Assessment Model. 7. Jacobs, Kerdiffstown Landfill Remediation Project. Groundwater DQRA Report. 8. Environmental Protection Agency (undated). Towards Setting Guideline Values for the Protection of Groundwater in Ireland. Interim Report. 38
46 Appendix A. Zone 1 input parameters and results MODEL INPUTS 1
47 LANDFILL WASTE: Parameter Units Ammoniacal nitrogen Arsenic Chloride Formaldehyde (o) Mecoprop (o) Nickel Phenol (o) Zinc Distribution triangular triangular triangular triangular triangular triangular triangular triangular Landfill waste leaching test concentration Minimum mg/l Landfill waste leaching test concentration Likely mg/l Landfill waste leaching test concentration Maximum mg/l DIMENSIONS OF ZONE: Parameter Units Saturated Waste Unsaturated Waste Total for Zone Width (perpendicular to groundwater flow) m Length (in direction of groundwater flow) m Area m 2 45,000 45,000 90,000 Waste thickness m CONTAMINANTS: Parameter Units Ammoniacal nitrogen Arsenic Chloride Formaldehyde (o) Mecoprop (o) Nickel Phenol (o) Zinc Contaminants Organic Carbon Water Partition Coefficient, Koc L/kg E E E+01 - Attenuation partition coefficient Kd Distribution uniform uniform constant - - uniform - uniform 1
48 Parameter Units Ammoniacal nitrogen Arsenic Chloride Formaldehyde (o) Mecoprop (o) Nickel Phenol (o) Zinc Attenuation partition coefficient Kd Minimum L/kg Attenuation partition coefficient Kd Maximum L/kg Attenuation half-life distribution constant constant constant constant uniform constant uniform constant Attenuation half-life Minimum days No Decay No Decay No Decay No Decay 7.3 No Decay Attenuation half-life Maximum days Contaminants free water diffusion coefficient m 2 /s 2.00E E E E E E E E-09 HYDROGEOLOGY: Parameter Units Sand and Gravel Limestone Unsaturated sand and gravel Hydrogeology unit thickness distribution uniform constant uniform Hydrogeology unit thickness Minimum m Hydrogeology unit thickness Maximum m 10 5 Hydrogeology hydraulic conductivity distribution triangular triangular triangular Hydrogeology hydraulic conductivity Minimum m/s 1.05E E E-08 Hydrogeology hydraulic conductivity Likely m/s 1.34E E-06 Hydrogeology hydraulic conductivity Maximum m/s 6.60E E-06 2
49 Parameter Units Sand and Gravel Limestone Unsaturated sand and gravel Hydrogeology head m Hydrogeology hydraulic gradient distribution [-] uniform uniform constant Hydrogeology hydraulic gradient Minimum Hydrogeology hydraulic gradient Maximum Hydrogeology porosity distribution [-] uniform uniform constant Hydrogeology porosity Minimum Hydrogeology porosity Maximum Hydrogeology tortuosity [-] Distribution constant constant constant 3
50 ATTENUATION Parameter Units Sand and Gravel Limestone Unsat SandG Attenuation dry bulk density kg/m Attenuation fraction organic carbon distribution triangular uniform triangular Attenuation fraction organic carbon Minimum [-] Attenuation fraction organic carbon Likely [-] Attenuation fraction organic carbon Maximum [-]
51 MODEL RESULTS 5
52 Saturated Waste Uncapped 50 th Percentile Concentrations in mg/l in Haz Subs Capped 50 th Percentile Concentrations in mg/l in Haz Subs Time(years) Ammoniacal nitrogen Arsenic Chloride Formaldehyde (o) Mecoprop (o) Nickel Phenol (o) Zinc Time(years) Ammoniacal nitrogen Arsenic Chloride Formaldehyde (o) Mecoprop (o) Nickel Phenol (o) Zinc E E E E E E E E E E E E E E E E E E E E E E E E E E E E E E E E E E E E E E E E E E E E E E E E E E E E E E E E E E E E E E E E E E E E E E E E E E E E E E E E E E E E E E E E E E E E E E E E E E E E E E E E E E E E E E E E E E E E E E E E E E E E E E E E E E E E E E E E E E E E E E E E E E E E E E E E E E E E E E E E E E E E E E E E E E E E E E E E E E E E E E E E E E E E E E E E E E E E E E E E E E E E E E E E E E E E E E E E E E E E E E E E E E E E E E E E E E E E E E E E E E E E E E E E E E E E E E E E E E E E E E E E E E E E E E E E E E E E E E E E E E E E E E E E E E E E E E E E E E E E E E E E E E E E E E E E E E E E E E E E-06 Uncapped 95 th Percentile Concentrations in mg/l in Haz Subs Capped 95 th Percentile Concentrations in mg/l in Haz Subs Time(years) Ammoniacal nitrogen Arsenic Chloride Formaldehyde (o) Mecoprop (o) Nickel Phenol (o) Zinc Time(years) Ammoniacal nitrogen Arsenic Chloride Formaldehyde (o) Mecoprop (o) Nickel Phenol (o) Zinc E E E E E E E E E E E E E E E E E E E E E E E E E E E E E E E E E E E E E E E E E E E E E E E E E E E E E E E E E E E E E E E E E E E E E E E E E E E E E E E E E E E E E E E E E E E E E E E E E E E E E E E E E E E E E E E E E E E E E E E E E E E E E E E E E E E E E E E E E E E E E E E E E E E E E E E E E E E E E E E E E E E E E E E E E E E E E E E E E E E E E E E E E E E E E E E E E E E E E E E E E E E E E E E E E E E E E E E E E E E E E E E E E E E E E E E E E E E E E E E E E E E E E E E E E E E E E E E E E E E E E E E E E E E E E E E E E E E E E E E E E E E E E E E E E E E E E E E E E E E E E E E E E E E E E E E E E E E E E E E E-06 6
53 Overburden Uncapped 50 th Percentile Concentrations in mg/l in Overburden Capped 50 th Percentile Concentrations in mg/l in Overburden Time(years) Ammoniacal nitrogen Arsenic Chloride Formaldehyde (o) Mecoprop (o) Nickel Phenol (o) Zinc Time(years) Ammoniacal nitrogen Arsenic Chloride Formaldehyde (o) Mecoprop (o) Nickel Phenol (o) Zinc E E E E E E E E E E E E E E E E E E E E E E E E E E E E E E E E E E E E E E E E E E E E E E E E E E E E E E E E E E E E E E E E E E E E E E E E E E E E E E E E E E E E E E E E E E E E E E E E E E E E E E E E E E E E E E E E E E E E E E E E E E E E E E E E E E E E E E E E E E E E E E E E E E E E E E E E E E E E E E E E E E E E E E E E E E E E E E E E E E E E E E E E E E E E E E E E E E E E E E E E E E E E E E E E E E E E E E E E E E E E E E E E E E E E E E E E E E E E E E E E E E E E E E E E E E E E E E E E E E E E E E E E E E E E E E E E E E E E E E E E E E E E E E E E E E E E E E E E E E E E E E E E E E E E E E E E E E E E E E E E-10 Uncapped 95 th Percentile Concentrations in mg/l in Overburden Capped 95 th Percentile Concentrations in mg/l in Overburden Time(years) Ammoniacal nitrogen Arsenic Chloride Formaldehyde (o) Mecoprop (o) Nickel Phenol (o) Zinc Time(years) Ammoniacal nitrogen Arsenic Chloride Formaldehyde (o) Mecoprop (o) Nickel Phenol (o) Zinc E E E E E E E E E E E E E E E E E E E E E E E E E E E E E E E E E E E E E E E E E E E E E E E E E E E E E E E E E E E E E E E E E E E E E E E E E E E E E E E E E E E E E E E E E E E E E E E E E E E E E E E E E E E E E E E E E E E E E E E E E E E E E E E E E E E E E E E E E E E E E E E E E E E E E E E E E E E E E E E E E E E E E E E E E E E E E E E E E E E E E E E E E E E E E E E E E E E E E E E E E E E E E E E E E E E E E E E E E E E E E E E E E E E E E E E E E E E E E E E E E E E E E E E E E E E E E E E E E E E E E E E E E E E E E E E E E E E E E E E E E E E E E E E E E E E E E E E E E E E E E E E E E E E E E E E E E E E E E E E E-04 7
54 Overburden at the River Morell Uncapped 50 th Percentile Concentrations in mg/l in River Morell Capped 50 th Percentile Concentrations in mg/l in River Morell Time(years) Ammoniacal nitrogen Arsenic Chloride Formaldehyde (o) Mecoprop (o) Nickel Phenol (o) Zinc Time(years) Ammoniacal nitrogen Arsenic Chloride Formaldehyde (o) Mecoprop (o) Nickel Phenol (o) Zinc E E E E E E E E E E E E E E E E E E E E E E E E E E E E E E E E E E E E E E E E E E E E E E E E E E E E E E E E E E E E E E E E E E E E E E E E E E E E E E E E E E E E E E E E E E E E E E E E E E E E E E E E E E E E E E E E E E E E E E E E E E E E E E E E E E E E E E E E E E E E E E E E E E E E E E E E E E E E E E E E E E E E E E E E E E E E E E E E E E E E E E E E E E E E E E E E E E E E E E E E E E E E E E E E E E E E E E E E E E E E E E E E E E E E E E E E E E E E E E E E E E E E E E E E E E E E E E E E E E E E E E E E E E E E E E E E E E E E E E E E E E E E E E E E E E E E E E E E E E E E E E E E E E E E E E E E E E E E E E E E-15 Uncapped 95 th Percentile Concentrations in mg/l in River Morell Capped 95 th Percentile Concentrations in mg/l in River Morell Time(years) Ammoniacal nitrogen Arsenic Chloride Formaldehyde (o) Mecoprop (o) Nickel Phenol (o) Zinc Time(years) Ammoniacal nitrogen Arsenic Chloride Formaldehyde (o) Mecoprop (o) Nickel Phenol (o) Zinc E E E E E E E E E E E E E E E E E E E E E E E E E E E E E E E E E E E E E E E E E E E E E E E E E E E E E E E E E E E E E E E E E E E E E E E E E E E E E E E E E E E E E E E E E E E E E E E E E E E E E E E E E E E E E E E E E E E E E E E E E E E E E E E E E E E E E E E E E E E E E E E E E E E E E E E E E E E E E E E E E E E E E E E E E E E E E E E E E E E E E E E E E E E E E E E E E E E E E E E E E E E E E E E E E E E E E E E E E E E E E E E E E E E E E E E E E E E E E E E E E E E E E E E E E E E E E E E E E E E E E E E E E E E E E E E E E E E E E E E E E E E E E E E E E E E E E E E E E E E E E E E E E E E E E E E E E E E E E E E E-04 8
55 Limestone Aquifer Uncapped 50 th Percentile Concentrations in mg/l in Limestone Aquifer Capped 50 th Percentile Concentrations in mg/l in Limestone Aquifer Time(years) Ammoniacal nitrogen Arsenic Chloride Formaldehyde (o) Mecoprop (o) Nickel Phenol (o) Zinc Time(years) Ammoniacal nitrogen Arsenic Chloride Formaldehyde (o) Mecoprop (o) Nickel Phenol (o) Zinc E E E E E E E E E E E E E E E E E E E E E E E E E E E E E E E E E E E E E E E E E E E E E E E E E E E E E E E E E E E E E E E E E E E E E E E E E E E E E E E E E E E E E E E E E E E E E E E E E E E E E E E E E E E E E E E E E E E E E E E E E E E E E E E E E E E E E E E E E E E E E E E E E E E E E E E E E E E E E E E E E E E E E E E E E E E E E E E E E E E E E E E E E E E E E E E E E E E E E E E E E E E E E E E E E E E E E E E E E E E E E E E E E E E E E E E E E E E E E E E E E E E E E E E E E E E E E E E E E E E E E E E E E E E E E E E E E E E E E E E E E E E E E E E E E E E E E E E E E E E E E E E E E E E E E E E E E E E E E E E E-26 Uncapped 95 th Percentile Concentrations in mg/l in Limestone Aquifer Capped 95 th Percentile Concentrations in mg/l in Limestone Aquifer Time(years) Ammoniacal nitrogen Arsenic Chloride Formaldehyde (o) Mecoprop (o) Nickel Phenol (o) Zinc Time(years) Ammoniacal nitrogen Arsenic Chloride Formaldehyde (o) Mecoprop (o) Nickel Phenol (o) Zinc E E E E E E E E E E E E E E E E E E E E E E E E E E E E E E E E E E E E E E E E E E E E E E E E E E E E E E E E E E E E E E E E E E E E E E E E E E E E E E E E E E E E E E E E E E E E E E E E E E E E E E E E E E E E E E E E E E E E E E E E E E E E E E E E E E E E E E E E E E E E E E E E E E E E E E E E E E E E E E E E E E E E E E E E E E E E E E E E E E E E E E E E E E E E E E E E E E E E E E E E E E E E E E E E E E E E E E E E E E E E E E E E E E E E E E E E E E E E E E E E E E E E E E E E E E E E E E E E E E E E E E E E E E E E E E E E E E E E E E E E E E E E E E E E E E E E E E E E E E E E E E E E E E E E E E E E E E E E E E E E-04 9
56 Appendix B. Zone 2A specific input parameters and results MODEL INPUTS 1
57 LANDFILL WASTE: Parameter Units Ammoniacal Formaldehyde Arsenic Chloride nitrogen (o) Mecoprop (o) Nickel Phenol (o) Zinc Distribution triangular triangular triangular triangular triangular triangular triangular triangular Landfill waste leaching test concentration Minimum mg/l Landfill waste leaching test concentration Likely mg/l Landfill waste leaching test concentration Maximum mg/l DIMENSIONS OF ZONE: Parameter Units Saturated Unsaturated Total for Zone Waste Waste Width (perpendicular to groundwater flow) m Length (in direction of groundwater flow) m Assumed that there is no Area m 2 saturated waste 18,000 18,000 Waste thickness m 8 - CONTAMINANTS: Parameter Ammoniacal Formaldehyde Mecoprop Phenol Units Arsenic Chloride Nickel nitrogen (o) (o) (o) Zinc Contaminants Organic Carbon Water Partition Coefficient, Koc L/kg E E E+01 - Attenuation partition coefficient Kd Distribution uniform uniform constant - - uniform - uniform 1
58 Parameter Units Ammoniacal nitrogen Arsenic Chloride Formaldehyde (o) Mecoprop (o) Nickel Phenol (o) Zinc Attenuation partition coefficient Kd Minimum L/kg Attenuation partition coefficient Kd Maximum L/kg Attenuation half-life distribution constant constant constant constant uniform constant uniform constant Attenuation half-life Minimum days No Decay No Decay No Decay No Decay 7.3 No Decay Attenuation half-life Maximum days Contaminants free water diffusion coefficient m 2 /s 2.00E E E E E E E E-09 HYDROGEOLOGY: Parameter Units Sand and Gravel Limestone Unsaturated sand and gravel Hydrogeology unit thickness distribution uniform constant constant Hydrogeology unit thickness Minimum m Hydrogeology unit thickness Maximum m 12 Hydrogeology hydraulic conductivity distribution triangular triangular triangular Hydrogeology hydraulic conductivity Minimum m/s 2.31E E E-05 Hydrogeology hydraulic conductivity Likely m/s 6.60E E-05 Hydrogeology hydraulic conductivity Maximum m/s 1.56E E-04 2
59 Parameter Units Sand and Gravel Limestone Unsaturated sand and gravel Hydrogeology head m Hydrogeology hydraulic gradient distribution [-] uniform uniform constant Hydrogeology hydraulic gradient Minimum Hydrogeology hydraulic gradient Maximum Hydrogeology porosity distribution [-] uniform uniform constant Hydrogeology porosity Minimum Hydrogeology porosity Maximum Hydrogeology tortuosity [-] Distribution constant constant constant 3
60 ATTENUATION Parameter Units Sand and Gravel Limestone Unsat SandG Attenuation dry bulk density kg/m Attenuation fraction organic carbon distribution triangular uniform triangular Attenuation fraction organic carbon Minimum [-] Attenuation fraction organic carbon Likely [-] Attenuation fraction organic carbon Maximum [-]
61 MODEL RESULTS 5
62 Overburden Uncapped 50 th Percentile Concentrations in mg/l in Overburden Capped 50 th Percentile Concentrations in mg/l in Overburden Time(years) Ammoniacal nitrogen Arsenic Chloride Formaldehyde (o) Mecoprop (o) Nickel Phenol (o) Zinc Time(years) Ammoniacal nitrogen Arsenic Chloride Formaldehyde (o) Mecoprop (o) Nickel Phenol (o) Zinc E E E E E E E E E E E E E E E E E E E E E E E E E E E E E E E E E E E E E E E E E E E E E E E E E E E E E E E E E E E E E E E E E E E E E E E E E E E E E E E E E E E E E E E E E E E E E E E E E E E E E E E E E E E E E E E E E E E E E E E E E E E E E E E E E E E E E E E E E E E E E E E E E E E E E E E E E E E E E E E E E E E E E E E E E E E E E E E E E E E E E E E E E E E E E E E E E E E E E E E E E E E E E E E E E E E E E E E E E E E E E E E E E E E E E E E E E E E E E E E E E E E E E E E E E E E E E E E E E E E E E E E E E E E E E E E E E E E E E E E E E E E E E E E E E E E E E E E E E E E E E E E E E E E E E E E E E E E E E E E E-10 Uncapped 95 th Percentile Concentrations in mg/l in Overburden Capped 95 th Percentile Concentrations in mg/l in Overburden Time(years) Ammoniacal nitrogen Arsenic Chloride Formaldehyde (o) Mecoprop (o) Nickel Phenol (o) Zinc Time(years) Ammoniacal nitrogen Arsenic Chloride Formaldehyde (o) Mecoprop (o) Nickel Phenol (o) Zinc E E E E E E E E E E E E E E E E E E E E E E E E E E E E E E E E E E E E E E E E E E E E E E E E E E E E E E E E E E E E E E E E E E E E E E E E E E E E E E E E E E E E E E E E E E E E E E E E E E E E E E E E E E E E E E E E E E E E E E E E E E E E E E E E E E E E E E E E E E E E E E E E E E E E E E E E E E E E E E E E E E E E E E E E E E E E E E E E E E E E E E E E E E E E E E E E E E E E E E E E E E E E E E E E E E E E E E E E E E E E E E E E E E E E E E E E E E E E E E E E E E E E E E E E E E E E E E E E E E E E E E E E E E E E E E E E E E E E E E E E E E E E E E E E E E E E E E E E E E E E E E E E E E E E E E E E E E E E E E E E-05 6
63 Overburden at the River Morell Uncapped 50 th Percentile Concentrations in mg/l in River Morell Capped 50 th Percentile Concentrations in mg/l in River Morell Time(years) Ammoniacal nitrogen Arsenic Chloride Formaldehyde (o) Mecoprop (o) Nickel Phenol (o) Zinc Time(years) Ammoniacal nitrogen Arsenic Chloride Formaldehyde (o) Mecoprop (o) Nickel Phenol (o) Zinc E E E E E E E E E E E E E E E E E E E E E E E E E E E E E E E E E E E E E E E E E E E E E E E E E E E E E E E E E E E E E E E E E E E E E E E E E E E E E E E E E E E E E E E E E E E E E E E E E E E E E E E E E E E E E E E E E E E E E E E E E E E E E E E E E E E E E E E E E E E E E E E E E E E E E E E E E E E E E E E E E E E E E E E E E E E E E E E E E E E E E E E E E E E E E E E E E E E E E E E E E E E E E E E E E E E E E E E E E E E E E E E E E E E E E E E E E E E E E E E E E E E E E E E E E E E E E E E E E E E E E E E E E E E E E E E E E E E E E E E E E E E E E E E E E E E E E E E E E E E E E E E E E E E E E E E E E E E E E E E E-09 Uncapped 95 th Percentile Concentrations in mg/l in River Morell Capped 95 th Percentile Concentrations in mg/l in River Morell Time(years) Ammoniacal nitrogen Arsenic Chloride Formaldehyde (o) Mecoprop (o) Nickel Phenol (o) Zinc Time(years) Ammoniacal nitrogen Arsenic Chloride Formaldehyde (o) Mecoprop (o) Nickel Phenol (o) Zinc E E E E E E E E E E E E E E E E E E E E E E E E E E E E E E E E E E E E E E E E E E E E E E E E E E E E E E E E E E E E E E E E E E E E E E E E E E E E E E E E E E E E E E E E E E E E E E E E E E E E E E E E E E E E E E E E E E E E E E E E E E E E E E E E E E E E E E E E E E E E E E E E E E E E E E E E E E E E E E E E E E E E E E E E E E E E E E E E E E E E E E E E E E E E E E E E E E E E E E E E E E E E E E E E E E E E E E E E E E E E E E E E E E E E E E E E E E E E E E E E E E E E E E E E E E E E E E E E E E E E E E E E E E E E E E E E E E E E E E E E E E E E E E E E E E E E E E E E E E E E E E E E E E E E E E E E E E E E E E E E-05 7
64 Limestone Aquifer Uncapped 50 th Percentile Concentrations in mg/l in Limestone Aquifer Capped 50 th Percentile Concentrations in mg/l in Limestone Aquifer Time(years) Ammoniacal nitrogen Arsenic Chloride Formaldehyde (o) Mecoprop (o) Nickel Phenol (o) Zinc Time(years) Ammoniacal nitrogen Arsenic Chloride Formaldehyde (o) Mecoprop (o) Nickel Phenol (o) Zinc E E E E E E E E E E E E E E E E E E E E E E E E E E E E E E E E E E E E E E E E E E E E E E E E E E E E E E E E E E E E E E E E E E E E E E E E E E E E E E E E E E E E E E E E E E E E E E E E E E E E E E E E E E E E E E E E E E E E E E E E E E E E E E E E E E E E E E E E E E E E E E E E E E E E E E E E E E E E E E E E E E E E E E E E E E E E E E E E E E E E E E E E E E E E E E E E E E E E E E E E E E E E E E E E E E E E E E E E E E E E E E E E E E E E E E E E E E E E E E E E E E E E E E E E E E E E E E E E E E E E E E E E E E E E E E E E E E E E E E E E E E E E E E E E E E E E E E E E E E E E E E E E E E E E E E E E E E E E E E E E-11 Uncapped 95 th Percentile Concentrations in mg/l in Limestone Aquifer Capped 95 th Percentile Concentrations in mg/l in Limestone Aquifer Time(years) Ammoniacal nitrogen Arsenic Chloride Formaldehyde (o) Mecoprop (o) Nickel Phenol (o) Zinc Time(years) Ammoniacal nitrogen Arsenic Chloride Formaldehyde (o) Mecoprop (o) Nickel Phenol (o) Zinc E E E E E E E E E E E E E E E E E E E E E E E E E E E E E E E E E E E E E E E E E E E E E E E E E E E E E E E E E E E E E E E E E E E E E E E E E E E E E E E E E E E E E E E E E E E E E E E E E E E E E E E E E E E E E E E E E E E E E E E E E E E E E E E E E E E E E E E E E E E E E E E E E E E E E E E E E E E E E E E E E E E E E E E E E E E E E E E E E E E E E E E E E E E E E E E E E E E E E E E E E E E E E E E E E E E E E E E E E E E E E E E E E E E E E E E E E E E E E E E E E E E E E E E E E E E E E E E E E E E E E E E E E E E E E E E E E E E E E E E E E E E E E E E E E E E E E E E E E E E E E E E E E E E E E E E E E E E E E E E E-06 8
65 Appendix C. Zone 2B specific input parameters and results 1
66 LANDFILL WASTE: Parameter Units Ammoniacal Formaldehyde Arsenic Chloride nitrogen (o) Mecoprop (o) Nickel Phenol (o) Zinc Distribution triangular triangular triangular triangular triangular triangular triangular triangular Landfill waste leaching test concentration Minimum mg/l Landfill waste leaching test concentration Likely mg/l Landfill waste leaching test concentration Maximum mg/l DIMENSIONS OF ZONE: Parameter Units Saturated Unsaturated Total for Zone Waste Waste Width (perpendicular to groundwater flow) m Length (in direction of groundwater flow) m 150 Assumed there is no 150 Area m 2 30,000 unsaturated waste 30,000 Waste thickness m CONTAMINANTS: Parameter Ammoniacal Formaldehyde Mecoprop Phenol Units Arsenic Chloride Nickel nitrogen (o) (o) (o) Zinc Contaminants Organic Carbon Water Partition Coefficient, Koc L/kg E E E+01 - Attenuation partition coefficient Kd Distribution uniform uniform constant - - uniform - uniform 1
67 Parameter Units Ammoniacal nitrogen Arsenic Chloride Formaldehyde (o) Mecoprop (o) Nickel Phenol (o) Zinc Attenuation partition coefficient Kd Minimum L/kg Attenuation partition coefficient Kd Maximum L/kg Attenuation half-life distribution constant constant constant constant uniform constant uniform constant Attenuation half-life Minimum days No Decay No Decay No Decay No Decay 7.3 No Decay Attenuation half-life Maximum days Contaminants free water diffusion coefficient m 2 /s 2.00E E E E E E E E-09 HYDROGEOLOGY: Parameter Units Sand and Gravel Limestone Unsaturated sand and gravel Hydrogeology unit thickness distribution uniform constant constant Hydrogeology unit thickness Minimum m Hydrogeology unit thickness Maximum m 13 Hydrogeology hydraulic conductivity distribution triangular triangular triangular Hydrogeology hydraulic conductivity Minimum m/s 2.31E E E-06 Hydrogeology hydraulic conductivity Likely m/s 6.60E E-06 Hydrogeology hydraulic conductivity Maximum m/s 1.56E E-05 2
68 Parameter Units Sand and Gravel Limestone Unsaturated sand and gravel Hydrogeology head m Hydrogeology hydraulic gradient distribution [-] uniform uniform constant Hydrogeology hydraulic gradient Minimum Hydrogeology hydraulic gradient Maximum Hydrogeology porosity distribution [-] uniform uniform constant Hydrogeology porosity Minimum Hydrogeology porosity Maximum Hydrogeology tortuosity [-] Distribution constant constant constant 3
69 ATTENUATION Parameter Units Sand and Gravel Limestone Unsat SandG Attenuation dry bulk density kg/m Attenuation fraction organic carbon distribution triangular uniform triangular Attenuation fraction organic carbon Minimum [-] Attenuation fraction organic carbon Likely [-] Attenuation fraction organic carbon Maximum [-]
70 MODEL RESULTS 5
71 Saturated Waste Uncapped 50 th Percentile Concentrations in mg/l in Haz Subs Capped 50 th Percentile Concentrations in mg/l in Haz Subs Time(years) Ammoniacal nitrogen Arsenic Chloride Formaldehyde (o) Mecoprop (o) Nickel Phenol (o) Zinc Time(years) Ammoniacal nitrogen Arsenic Chloride Formaldehyde (o) Mecoprop (o) Nickel Phenol (o) Zinc E E E E E E E E E E E E E E E E E E E E E E E E E E E E E E E E E E E E E E E E E E E E E E E E E E E E E E E E E E E E E E E E E E E E E E E E E E E E E E E E E E E E E E E E E E E E E E E E E E E E E E E E E E E E E E E E E E E E E E E E E E E E E E E E E E E E E E E E E E E E E E E E E E E E E E E E E E E E E E E E E E E E E E E E E E E E E E E E E E E E E E E E E E E E E E E E E E E E E E E E E E E E E E E E E E E E E E E E E E E E E E E E E E E E E E E E E E E E E E E E E E E E E E E E E E E E E E E E E E E E E E E E E E E E E E E E E E E E E E E E E E E E E E E E E E E E E E E E E E E E E E E E E E E E E E E E E E E E E E E E+00 Uncapped 95 th Percentile Concentrations in mg/l in Haz Subs Capped 95 th Percentile Concentrations in mg/l in Haz Subs Time(years) Ammoniacal nitrogen Arsenic Chloride Formaldehyde (o) Mecoprop (o) Nickel Phenol (o) Zinc Time(years) Ammoniacal nitrogen Arsenic Chloride Formaldehyde (o) Mecoprop (o) Nickel Phenol (o) Zinc E E E E E E E E E E E E E E E E E E E E E E E E E E E E E E E E E E E E E E E E E E E E E E E E E E E E E E E E E E E E E E E E E E E E E E E E E E E E E E E E E E E E E E E E E E E E E E E E E E E E E E E E E E E E E E E E E E E E E E E E E E E E E E E E E E E E E E E E E E E E E E E E E E E E E E E E E E E E E E E E E E E E E E E E E E E E E E E E E E E E E E E E E E E E E E E E E E E E E E E E E E E E E E E E E E E E E E E E E E E E E E E E E E E E E E E E E E E E E E E E E E E E E E E E E E E E E E E E E E E E E E E E E E E E E E E E E E E E E E E E E E E E E E E E E E E E E E E E E E E E E E E E E E E E E E E E E E E E E E E E+00 6
72 Overburden Uncapped 50 th Percentile Concentrations in mg/l in Overburden Capped 50 th Percentile Concentrations in mg/l in Overburden Time(years) Ammoniacal nitrogen Arsenic Chloride Formaldehyde (o) Mecoprop (o) Nickel Phenol (o) Zinc Time(years) Ammoniacal nitrogen Arsenic Chloride Formaldehyde (o) Mecoprop (o) Nickel Phenol (o) Zinc E E E E E E E E E E E E E E E E E E E E E E E E E E E E E E E E E E E E E E E E E E E E E E E E E E E E E E E E E E E E E E E E E E E E E E E E E E E E E E E E E E E E E E E E E E E E E E E E E E E E E E E E E E E E E E E E E E E E E E E E E E E E E E E E E E E E E E E E E E E E E E E E E E E E E E E E E E E E E E E E E E E E E E E E E E E E E E E E E E E E E E E E E E E E E E E E E E E E E E E E E E E E E E E E E E E E E E E E E E E E E E E E E E E E E E E E E E E E E E E E E E E E E E E E E E E E E E E E E E E E E E E E E E E E E E E E E E E E E E E E E E E E E E E E E E E E E E E E E E E E E E E E E E E E E E E E E E E E E E E E-05 Uncapped 95 th Percentile Concentrations in mg/l in Overburden Capped 95 th Percentile Concentrations in mg/l in Overburden Time(years) Ammoniacal nitrogen Arsenic Chloride Formaldehyde (o) Mecoprop (o) Nickel Phenol (o) Zinc Time(years) Ammoniacal nitrogen Arsenic Chloride Formaldehyde (o) Mecoprop (o) Nickel Phenol (o) Zinc E E E E E E E E E E E E E E E E E E E E E E E E E E E E E E E E E E E E E E E E E E E E E E E E E E E E E E E E E E E E E E E E E E E E E E E E E E E E E E E E E E E E E E E E E E E E E E E E E E E E E E E E E E E E E E E E E E E E E E E E E E E E E E E E E E E E E E E E E E E E E E E E E E E E E E E E E E E E E E E E E E E E E E E E E E E E E E E E E E E E E E E E E E E E E E E E E E E E E E E E E E E E E E E E E E E E E E E E E E E E E E E E E E E E E E E E E E E E E E E E E E E E E E E E E E E E E E E E E E E E E E E E E E E E E E E E E E E E E E E E E E E E E E E E E E E E E E E E E E E E E E E E E E E E E E E E E E E E E E E E-04 7
73 Overburden at the River Morell Uncapped 50 th Percentile Concentrations in mg/l in River Morell Capped 50 th Percentile Concentrations in mg/l in River Morell Time(years) Ammoniacal nitrogen Arsenic Chloride Formaldehyde (o) Mecoprop (o) Nickel Phenol (o) Zinc Time(years) Ammoniacal nitrogen Arsenic Chloride Formaldehyde (o) Mecoprop (o) Nickel Phenol (o) Zinc E E E E E E E E E E E E E E E E E E E E E E E E E E E E E E E E E E E E E E E E E E E E E E E E E E E E E E E E E E E E E E E E E E E E E E E E E E E E E E E E E E E E E E E E E E E E E E E E E E E E E E E E E E E E E E E E E E E E E E E E E E E E E E E E E E E E E E E E E E E E E E E E E E E E E E E E E E E E E E E E E E E E E E E E E E E E E E E E E E E E E E E E E E E E E E E E E E E E E E E E E E E E E E E E E E E E E E E E E E E E E E E E E E E E E E E E E E E E E E E E E E E E E E E E E E E E E E E E E E E E E E E E E E E E E E E E E E E E E E E E E E E E E E E E E E E E E E E E E E E E E E E E E E E E E E E E E E E E E E E E-06 Uncapped 95 th Percentile Concentrations in mg/l in River Morell Capped 95 th Percentile Concentrations in mg/l in River Morell Time(years) Ammoniacal nitrogen Arsenic Chloride Formaldehyde (o) Mecoprop (o) Nickel Phenol (o) Zinc Time(years) Ammoniacal nitrogen Arsenic Chloride Formaldehyde (o) Mecoprop (o) Nickel Phenol (o) Zinc E E E E E E E E E E E E E E E E E E E E E E E E E E E E E E E E E E E E E E E E E E E E E E E E E E E E E E E E E E E E E E E E E E E E E E E E E E E E E E E E E E E E E E E E E E E E E E E E E E E E E E E E E E E E E E E E E E E E E E E E E E E E E E E E E E E E E E E E E E E E E E E E E E E E E E E E E E E E E E E E E E E E E E E E E E E E E E E E E E E E E E E E E E E E E E E E E E E E E E E E E E E E E E E E E E E E E E E E E E E E E E E E E E E E E E E E E E E E E E E E E E E E E E E E E E E E E E E E E E E E E E E E E E E E E E E E E E E E E E E E E E E E E E E E E E E E E E E E E E E E E E E E E E E E E E E E E E E E E E E E-04 8
74 Limestone Aquifer Uncapped 50 th Percentile Concentrations in mg/l in Limestone Aquifer Capped 50 th Percentile Concentrations in mg/l in Limestone Aquifer Time(years) Ammoniacal nitrogen Arsenic Chloride Formaldehyde (o) Mecoprop (o) Nickel Phenol (o) Zinc Time(years) Ammoniacal nitrogen Arsenic Chloride Formaldehyde (o) Mecoprop (o) Nickel Phenol (o) Zinc E E E E E E E E E E E E E E E E E E E E E E E E E E E E E E E E E E E E E E E E E E E E E E E E E E E E E E E E E E E E E E E E E E E E E E E E E E E E E E E E E E E E E E E E E E E E E E E E E E E E E E E E E E E E E E E E E E E E E E E E E E E E E E E E E E E E E E E E E E E E E E E E E E E E E E E E E E E E E E E E E E E E E E E E E E E E E E E E E E E E E E E E E E E E E E E E E E E E E E E E E E E E E E E E E E E E E E E E E E E E E E E E E E E E E E E E E E E E E E E E E E E E E E E E E E E E E E E E E E E E E E E E E E E E E E E E E E E E E E E E E E E E E E E E E E E E E E E E E E E E E E E E E E E E E E E E E E E E E E E E-17 Uncapped 95 th Percentile Concentrations in mg/l in Limestone Aquifer Capped 95 th Percentile Concentrations in mg/l in Limestone Aquifer Time(years) Ammoniacal nitrogen Arsenic Chloride Formaldehyde (o) Mecoprop (o) Nickel Phenol (o) Zinc Time(years) Ammoniacal nitrogen Arsenic Chloride Formaldehyde (o) Mecoprop (o) Nickel Phenol (o) Zinc E E E E E E E E E E E E E E E E E E E E E E E E E E E E E E E E E E E E E E E E E E E E E E E E E E E E E E E E E E E E E E E E E E E E E E E E E E E E E E E E E E E E E E E E E E E E E E E E E E E E E E E E E E E E E E E E E E E E E E E E E E E E E E E E E E E E E E E E E E E E E E E E E E E E E E E E E E E E E E E E E E E E E E E E E E E E E E E E E E E E E E E E E E E E E E E E E E E E E E E E E E E E E E E E E E E E E E E E E E E E E E E E E E E E E E E E E E E E E E E E E E E E E E E E E E E E E E E E E E E E E E E E E E E E E E E E E E E E E E E E E E E E E E E E E E E E E E E E E E E E E E E E E E E E E E E E E E E E E E E E-05 9
75 Appendix D. Zone 3 input parameters 1
76 Infiltration Used in LandSim Model Parameter Units Distribution Justification Active tipping phase Infiltration to open waste or via temporary cover mm/yr Uniform (530 to 720) 70 to 95 % of average Rainfall Post-tipping phase Current model Infiltration following capping of landfill Capped model Infiltration following capping of landfill mm/yr Uniform (250 to 450) Jacobs' experience of evapotranspiration calculations and as used in previous assessment mm/yr Uniform (25 to 50) To reflect reduced infiltration following capping. Professional experience of similar simulations Landfill Geometry LandSim Model Base Area Area (Ha) Final Waste Thickness (m) Current Model 1.35 Uniform (1-15) Capped Model Uniform (4-19) Leachate Quality Uncapped Scenario Determinand Minimum (mg/l) Likely (mg/l) Maximum (mg/l) Source Ammoniacal nitrogen Zone 3 leachate quality monitoring (2010 to 2016) Arsenic Zone 3 leachate quality monitoring as used in Zone 1 DQRA (Reference 7) Benzene (o) Zone 3 leachate quality monitoring as used in Zone 1 DQRA (Reference 7) Cadmium Zone 3 leachate quality monitoring as used in Zone 1 DQRA (Reference 7) Chloride Zone 3 leachate quality monitoring (2010 to 2016) Formaldehyde (o) Text book values as used in Zone 1 DQRA (Reference 7) Mecoprop (o) Text book values as used in Zone 1 DQRA (Reference 7) Mercury Zone 3 leachate quality monitoring as used in Zone 1 DQRA (Reference 7) Nickel Zone 3 leachate quality monitoring as used in Zone 1 DQRA (Reference 7) Phenol (o) Text book values as used in 2
77 Determinand Minimum (mg/l) Likely (mg/l) Maximum (mg/l) Source Zone 1 DQRA (Reference 7) Zinc Zone 3 leachate quality monitoring as used in Zone 1 DQRA (Reference 7) (o) indicates organic compound Leachate Quality Capped and Fully Landfilled Scenario (based on Zone 1 RAM results) Determinand Minimum (mg/l) Likely (mg/l) Maximum (mg/l) Ammoniacal nitrogen Arsenic Benzene (o) Cadmium Chloride Formaldehyde (o) Mecoprop (o) Mercury Nickel Phenol (o) Zinc
78 Inputs for Declining Source Term Parameter Units Distribution Justification M C Field capacity of waste fraction Uniform (0.2, 0.3) Waste porosity fraction Uniform (0.25, 0.4) Waste density Kg/l Uniform (0.8, 1) Values as used in Zone 1 DQRA (Reference 7) Kappa values for declining source* Ammoniacal Nitrogen Kg/l Arsenic Kg/l Benzene (o) Kg/l Cadmium Kg/l Chloride Kg/l Formaldehyde (o) Kg/l Mecoprop (o) Kg/l Values as used in Zone 1 DQRA (Reference 7) Mercury Kg/l Nickel Kg/l Phenol (o) Kg/l Zinc Kg/l * m and c are the slope of the line and the x-axis intercept respectively when the experimental data are plotted with initial leachate concentration on the x axis and kappa on the y axis. Inputs Used for LandSim Unsaturated Zone Model Thickness (m) Hydraulic Conductivity (m/s) Moisture Content (fraction) Density (kg/l) Unsaturated Pathway Single (0.3) Uniform (1.16 x 10⁻⁶, 1.16 x 10⁻⁷) Uniform (0.34, 0.6) Uniform (1, 2.4) Vertical Pathway Uniform (4, 7) Uniform (1.16 x 10⁻⁶, 1.16 x 10⁻⁷) Uniform (0.34, 0.6) Uniform (1, 2.4) 4
79 Aquifer Properties Model Parameter Distribution Justification Aquifer Pathway (Bedrock) Aquifer Pathway (Overburden) Regional gradient (-) Uniform (0.002, 0.003) As measured on site Mixing zone thickness (m) Uniform (2.5, 5) Transition zone in the bedrock Pathway porosity (fraction) Uniform (0.01, 0.1) Assumes fracture flow Hydraulic conductivity (m/s) As measured in site permeability test in EMW12D and assuming transition zone has relatively high permeability Regional gradient (-) Single (0.04) As measured on site Mixing zone thickness (m) Uniform (2.5, 5) Assumes mixing is relatively narrow due to layering in overburden deposits Pathway Porosity (fraction) Uniform (0.34, 0.6) Sand and gravel aquifer from ConSim help file Hydraulic Conductivity (m/s) Uniform (1.16 x 10⁻⁷, 1.16 x 10⁻⁶) Typical value for silty sand and gravel, within the middle of the range of on-site measurements 5
80 Retardation and Decay Parameters Determinand Assumed Background Concentrati on (mg/l) Unsaturated Zone / Vertical / Aquifer Pathway half-life (years) Source Kd / KoC (l/kg) Source Fraction of Organic Carbon (foc) (fraction) - Bedrock Pathway Fraction of Organic Carbon (foc) (fraction) - Unsaturated / Vertical Pathway Source Ammoniacal nitrogen 0 single (1x10+9) uniform (0.5, 2) Arsenic 0 single (1x10+9) uniform (25, 250) Benzene (o) 0 uniform (0.003, 1) single (67.6) Uniform (0.0002,0.0159) Uniform (0.001,0.0039) Uniform (0.0002,0.0159) Uniform (0.001,0.0039) Uniform (0.0002,0.0159) Uniform (0.001,0.0039) Cadmium 0 single (1x10+9) uniform (1.6, 1500) Uniform (0.0002,0.0159) Uniform (0.001,0.0039) Chloride 0 single (1x10+9) single (0) As used for Formaldehyde 0 single (0.383) Zone 1 single (3.6) (o) DQRA (Reference 7) Mecoprop (o) 0 uniform (0.137, 1) single (12.9) As used for Zone 1 DQRA (Reference 7) Uniform (0.0002,0.0159) Uniform (0.001,0.0039) Uniform (0.0002,0.0159) Uniform (0.001,0.0039) Uniform (0.0002,0.0159) Uniform (0.001,0.0039) Results from 2016 ground investigation Mercury 0 single (1x10+9) uniform (450, 3835) Uniform (0.0002,0.0159) Uniform (0.001,0.0039) Nickel 0 single (1x10+9) uniform (20, 800) Uniform (0.0002,0.0159) Uniform (0.001,0.0039) Phenol (o) 0 uniform (0.02, 2.5) single (83.2) Uniform (0.0002,0.0159) Uniform (0.001,0.0039) Zinc 0 single (1x10+9) uniform (1, 600) Uniform (0.0002,0.0159) Uniform (0.001,0.0039) 1
81 Appendix E. Zone 4 specific input parameters and results
82 LANDFILL WASTE: Parameter Units Ammoniacal nitrogen Arsenic Chloride Formaldehyde (o) Mecoprop (o) Nickel Phenol (o) Zinc Distribution triangular triangular triangular triangular triangular triangular triangular triangular Landfill waste leaching test concentration Minimum mg/l Landfill waste leaching test concentration Likely mg/l Landfill waste leaching test concentration Maximum mg/l DIMENSIONS OF ZONE: Parameter Units Saturated Waste Unsaturated Waste Total for Zone Width (perpendicular to groundwater flow) m Length (in direction of groundwater flow) m Area m 2 26,000 34,000 60,000 Waste thickness m CONTAMINANTS: Parameter Units Ammoniacal nitrogen Arsenic Chloride Formaldehyde (o) Mecoprop (o) Nickel Phenol (o) Zinc Contaminants Organic Carbon Water Partition Coefficient, Koc L/kg E E E+01 - Attenuation partition coefficient Kd Distribution uniform uniform constant - - uniform - uniform
83 Parameter Units Ammoniacal nitrogen Arsenic Chloride Formaldehyde (o) Mecoprop (o) Nickel Phenol (o) Zinc Attenuation partition coefficient Kd Minimum L/kg Attenuation partition coefficient Kd Maximum L/kg Attenuation half-life distribution constant constant constant constant uniform constant uniform constant Attenuation half-life Minimum days No Decay No Decay No Decay No Decay 7.3 No Decay Attenuation half-life Maximum days Contaminants free water diffusion coefficient m 2 /s 2.00E E E E E E E E-09 HYDROGEOLOGY: Parameter Units Sand and Gravel Limestone Unsaturated sand and gravel Hydrogeology unit thickness distribution uniform constant constant Hydrogeology unit thickness Minimum m Hydrogeology unit thickness Maximum m 10 Hydrogeology hydraulic conductivity distribution triangular triangular triangular Hydrogeology hydraulic conductivity Minimum m/s 1.16E E E-06 Hydrogeology hydraulic conductivity Likely m/s 2.84E E-04 Hydrogeology hydraulic conductivity Maximum m/s 3.76E E-04
84 Parameter Units Sand and Gravel Limestone Unsaturated sand and gravel Hydrogeology head m Hydrogeology hydraulic gradient distribution uniform uniform constant Hydrogeology hydraulic gradient Minimum [-] Hydrogeology hydraulic gradient Maximum [-] Hydrogeology porosity distribution uniform uniform constant Hydrogeology porosity Minimum [-] Hydrogeology porosity Maximum [-] Hydrogeology tortuosity [-] Distribution constant constant constant
85 ATTENUATION Parameter Units Sand and Gravel Limestone Unsat SandG Attenuation dry bulk density kg/m Attenuation fraction organic carbon distribution triangular uniform triangular Attenuation fraction organic carbon Minimum [-] Attenuation fraction organic carbon Likely [-] Attenuation fraction organic carbon Maximum [-]
86 MODEL RESULTS
87 Saturated Waste Uncapped 50 th Percentile Concentrations in mg/l in Haz Subs Capped 50 th Percentile Concentrations in mg/l in Haz Subs Time(years) Ammoniacal nitrogen Arsenic Chloride Formaldehyde (o) Mecoprop (o) Nickel Phenol (o) Zinc Time(years) Ammoniacal nitrogen Arsenic Chloride Formaldehyde (o) Mecoprop (o) Nickel Phenol (o) Zinc E E E E E E E E E E E E E E E E E E E E E E E E E E E E E E E E E E E E E E E E E E E E E E E E E E E E E E E E E E E E E E E E E E E E E E E E E E E E E E E E E E E E E E E E E E E E E E E E E E E E E E E E E E E E E E E E E E E E E E E E E E E E E E E E E E E E E E E E E E E E E E E E E E E E E E E E E E E E E E E E E E E E E E E E E E E E E E E E E E E E E E E E E E E E E E E E E E E E E E E E E E E E E E E E E E E E E E E E E E E E E E E E E E E E E E E E E E E E E E E E E E E E E E E E E E E E E E E E E E E E E E E E E E E E E E E E E E E E E E E E E E E E E E E E E E E E E E E E E E E E E E E E E E E E E E E E E E E E E E E E+00 Uncapped 95 th Percentile Concentrations in mg/l in Haz Subs Capped 95 th Percentile Concentrations in mg/l in Haz Subs Time(years) Ammoniacal nitrogen Arsenic Chloride Formaldehyde (o) Mecoprop (o) Nickel Phenol (o) Zinc Time(years) Ammoniacal nitrogen Arsenic Chloride Formaldehyde (o) Mecoprop (o) Nickel Phenol (o) Zinc E E E E E E E E E E E E E E E E E E E E E E E E E E E E E E E E E E E E E E E E E E E E E E E E E E E E E E E E E E E E E E E E E E E E E E E E E E E E E E E E E E E E E E E E E E E E E E E E E E E E E E E E E E E E E E E E E E E E E E E E E E E E E E E E E E E E E E E E E E E E E E E E E E E E E E E E E E E E E E E E E E E E E E E E E E E E E E E E E E E E E E E E E E E E E E E E E E E E E E E E E E E E E E E E E E E E E E E E E E E E E E E E E E E E E E E E E E E E E E E E E E E E E E E E E E E E E E E E E E E E E E E E E E E E E E E E E E E E E E E E E E E E E E E E E E E E E E E E E E E E E E E E E E E E E E E E E E E E E E E E+00
88 Overburden Uncapped 50 th Percentile Concentrations in mg/l in Overburden Capped 50 th Percentile Concentrations in mg/l in Overburden Time(years) Ammoniacal nitrogen Arsenic Chloride Formaldehyde (o) Mecoprop (o) Nickel Phenol (o) Zinc Time(years) Ammoniacal nitrogen Arsenic Chloride Formaldehyde (o) Mecoprop (o) Nickel Phenol (o) Zinc E E E E E E E E E E E E E E E E E E E E E E E E E E E E E E E E E E E E E E E E E E E E E E E E E E E E E E E E E E E E E E E E E E E E E E E E E E E E E E E E E E E E E E E E E E E E E E E E E E E E E E E E E E E E E E E E E E E E E E E E E E E E E E E E E E E E E E E E E E E E E E E E E E E E E E E E E E E E E E E E E E E E E E E E E E E E E E E E E E E E E E E E E E E E E E E E E E E E E E E E E E E E E E E E E E E E E E E E E E E E E E E E E E E E E E E E E E E E E E E E E E E E E E E E E E E E E E E E E E E E E E E E E E E E E E E E E E E E E E E E E E E E E E E E E E E E E E E E E E E E E E E E E E E E E E E E E E E E E E E E-05 Uncapped 95 th Percentile Concentrations in mg/l in Overburden Capped 95 th Percentile Concentrations in mg/l in Overburden Time(years) Ammoniacal nitrogen Arsenic Chloride Formaldehyde (o) Mecoprop (o) Nickel Phenol (o) Zinc Time(years) Ammoniacal nitrogen Arsenic Chloride Formaldehyde (o) Mecoprop (o) Nickel Phenol (o) Zinc E E E E E E E E E E E E E E E E E E E E E E E E E E E E E E E E E E E E E E E E E E E E E E E E E E E E E E E E E E E E E E E E E E E E E E E E E E E E E E E E E E E E E E E E E E E E E E E E E E E E E E E E E E E E E E E E E E E E E E E E E E E E E E E E E E E E E E E E E E E E E E E E E E E E E E E E E E E E E E E E E E E E E E E E E E E E E E E E E E E E E E E E E E E E E E E E E E E E E E E E E E E E E E E E E E E E E E E E E E E E E E E E E E E E E E E E E E E E E E E E E E E E E E E E E E E E E E E E E E E E E E E E E E E E E E E E E E E E E E E E E E E E E E E E E E E E E E E E E E E E E E E E E E E E E E E E E E E E E E E E-04
89 Overburden at the River Morell Uncapped 50 th Percentile Concentrations in mg/l in River Morell Capped 50 th Percentile Concentrations in mg/l in River Morell Time(years) Ammoniacal nitrogen Arsenic Chloride Formaldehyde (o) Mecoprop (o) Nickel Phenol (o) Zinc Time(years) Ammoniacal nitrogen Arsenic Chloride Formaldehyde (o) Mecoprop (o) Nickel Phenol (o) Zinc E E E E E E E E E E E E E E E E E E E E E E E E E E E E E E E E E E E E E E E E E E E E E E E E E E E E E E E E E E E E E E E E E E E E E E E E E E E E E E E E E E E E E E E E E E E E E E E E E E E E E E E E E E E E E E E E E E E E E E E E E E E E E E E E E E E E E E E E E E E E E E E E E E E E E E E E E E E E E E E E E E E E E E E E E E E E E E E E E E E E E E E E E E E E E E E E E E E E E E E E E E E E E E E E E E E E E E E E E E E E E E E E E E E E E E E E E E E E E E E E E E E E E E E E E E E E E E E E E E E E E E E E E E E E E E E E E E E E E E E E E E E E E E E E E E E E E E E E E E E E E E E E E E E E E E E E E E E E E E E E-05 Uncapped 95 th Percentile Concentrations in mg/l in River Morell Capped 95 th Percentile Concentrations in mg/l in River Morell Time(years) Ammoniacal nitrogen Arsenic Chloride Formaldehyde (o) Mecoprop (o) Nickel Phenol (o) Zinc Time(years) Ammoniacal nitrogen Arsenic Chloride Formaldehyde (o) Mecoprop (o) Nickel Phenol (o) Zinc E E E E E E E E E E E E E E E E E E E E E E E E E E E E E E E E E E E E E E E E E E E E E E E E E E E E E E E E E E E E E E E E E E E E E E E E E E E E E E E E E E E E E E E E E E E E E E E E E E E E E E E E E E E E E E E E E E E E E E E E E E E E E E E E E E E E E E E E E E E E E E E E E E E E E E E E E E E E E E E E E E E E E E E E E E E E E E E E E E E E E E E E E E E E E E E E E E E E E E E E E E E E E E E E E E E E E E E E E E E E E E E E E E E E E E E E E E E E E E E E E E E E E E E E E E E E E E E E E E E E E E E E E E E E E E E E E E E E E E E E E E E E E E E E E E E E E E E E E E E E E E E E E E E E E E E E E E E E E E E E-04
90 Limestone Aquifer Uncapped 50 th Percentile Concentrations in mg/l in Limestone Aquifer Capped 50 th Percentile Concentrations in mg/l in Limestone Aquifer Time(years) Ammoniacal nitrogen Arsenic Chloride Formaldehyde (o) Mecoprop (o) Nickel Phenol (o) Zinc Time(years) Ammoniacal nitrogen Arsenic Chloride Formaldehyde (o) Mecoprop (o) Nickel Phenol (o) Zinc E E E E E E E E E E E E E E E E E E E E E E E E E E E E E E E E E E E E E E E E E E E E E E E E E E E E E E E E E E E E E E E E E E E E E E E E E E E E E E E E E E E E E E E E E E E E E E E E E E E E E E E E E E E E E E E E E E E E E E E E E E E E E E E E E E E E E E E E E E E E E E E E E E E E E E E E E E E E E E E E E E E E E E E E E E E E E E E E E E E E E E E E E E E E E E E E E E E E E E E E E E E E E E E E E E E E E E E E E E E E E E E E E E E E E E E E E E E E E E E E E E E E E E E E E E E E E E E E E E E E E E E E E E E E E E E E E E E E E E E E E E E E E E E E E E E E E E E E E E E E E E E E E E E E E E E E E E E E E E E E-15 Uncapped 95 th Percentile Concentrations in mg/l in Limestone Aquifer Capped 95 th Percentile Concentrations in mg/l in Limestone Aquifer Time(years) Ammoniacal nitrogen Arsenic Chloride Formaldehyde (o) Mecoprop (o) Nickel Phenol (o) Zinc Time(years) Ammoniacal nitrogen Arsenic Chloride Formaldehyde (o) Mecoprop (o) Nickel Phenol (o) Zinc E E E E E E E E E E E E E E E E E E E E E E E E E E E E E E E E E E E E E E E E E E E E E E E E E E E E E E E E E E E E E E E E E E E E E E E E E E E E E E E E E E E E E E E E E E E E E E E E E E E E E E E E E E E E E E E E E E E E E E E E E E E E E E E E E E E E E E E E E E E E E E E E E E E E E E E E E E E E E E E E E E E E E E E E E E E E E E E E E E E E E E E E E E E E E E E E E E E E E E E E E E E E E E E E E E E E E E E E E E E E E E E E E E E E E E E E E E E E E E E E E E E E E E E E E E E E E E E E E E E E E E E E E E E E E E E E E E E E E E E E E E E E E E E E E E E E E E E E E E E E E E E E E E E E E E E E E E E E E E E E-05
91 Environmental Impact Assessment Report (EIAR) Volume 4 of 4: Appendices Appendix A13.1 Flood Risk Assessment Page A13.1-1
92 Kerdiffstown Landfill Remediation Project Kildare County Council Flood Risk Assessment June 2017
93 Flood Risk Assessment Kerdiffstown Landfill Remediation Project Project no: Document title: Document No.: Revision: 1 32EW5604 Date: June 2017 Client name: Client No.: Project manager: Author: File Name: Flood Risk Assessment Kildare County Council Rihanna Rose Jennifer Johnston G:\JI\Sustainable Solutions\Kerdiffstown Landfill\4 - Documents\4.3 - Draft Documents\32EW5604 E EIA IED Planning\EIA\Specialists EIS\Hydrology\FRA Sinclair Knight Merz (Ireland) Limited (Jacobs) Merrion House, Merrion Road, Dublin Copyright 2017 Sinclair Knight Merz (Ireland) Limited (Jacobs). The concepts and information contained in this document are the property of Jacobs. Use or copying of this document in whole or in part without the written permission of Jacobs constitutes an infringement of copyright. Limitation: This report has been prepared on behalf of, and for the exclusive use of Jacobs Client, and is subject to, and issued in accordance with, the provisions of the contract between Jacobs and the Client. Jacobs accepts no liability or responsibility whatsoever for, or in respect of, any use of, or reliance upon, this report by any third party. Document history and status Revision Date Description By Review Approved Original March 2017 Issue for Planning Jennifer Johnston Mairéad Conlon Peter Smyth Rev 1 June 2017 Final EIAR Issue Sharon Sugrue Rhianna Rose 32EW5604 i
94 Flood Risk Assessment Glossary Annual Exceedance Probability Or AEP The probability of a flood event of a given magnitude being equalled or exceeded in any given year. For example: a 0.1% AEP flood event has a 0.1%, or 1 in a 1000, chance of occurring or being exceeded in any given year. a 1% AEP flood event has a 1%, or 1 in a 100, chance of occurring or being exceeded in any given year. a 10% AEP flood event has a 10%, or 1 in a 10, chance of occurring or being exceeded in any given year. Q BAR Mean Annual Flood 32EW5604 ii
95 Flood Risk Assessment Contents 1. Introduction Flood Risk Assessment Methodology Flood Risk Identification (Stage 1) Flood History of the Site OPW National Flood Hazard Mapping Eastern CFRAM Study Flood Risk Review Report Flood Risk Maps Local Libraries and Newspaper Reports Summary Initial Flood Risk Assessment (Stage 2) Potential Sources of Flooding Coastal Flood Risk Fluvial Flood Risk Estuarine Flood Risk Pluvial Flood Risk Artificial Drainage Systems Groundwater Flood Risk Flood Risk due to Climate Change Summary of Flood Risk Potential Flood Risk Impacts to Surrounding Areas from the Proposed Project Conclusions and Recommendations Conclusions Recommendations Appendix A. Information Sources Checklist Appendix B. OPW Summary Local Area Report Appendix C. Eastern CFRAM Study Flood Risk Review Maps Appendix D. OPW Eastern CFRAMS Fluvial Flood Map 32EW5604 iii
96 Flood Risk Assessment 1. Introduction Jacobs Engineering was commissioned by Kildare County Council to provide consultancy services in respect of the proposed remediation of the former Kerdiffstown Landfill site in Co. Kildare (hereafter the proposed Project ). The proposed Project includes the remediation and development of an amenity site on the former Kerdiffstown Landfill site. The planned works within the site boundary include works to re-profile the site including excavation of waste and other materials for deposition on site to achieve the proposed final landform. The works will also include the installation of landfill infrastructure such as capping, landfill gas, leachate and surface water management. The capping material used will increase the rate of pluvial runoff from the site therefore the purpose of the surface water management system is to maintain runoff from the site to greenfield runoff rates with attenuation ponds for storage. The proposed Project is shown on Figure A second stage of remediation will comprise the works required to restore the site to the proposed park end use, including planting and landscaping, installation of sports pitches, changing rooms, car parks and associated services. The proposed Project is shown on Figure In accordance with Section 28 of the Planning and Development Act 2000, Kildare County Council is required to have regard to the Guidelines on the Planning System and Flood Risk Management, These guidelines outline the requirement for a flood risk assessment to be carried out to assess the flood risk to the proposed Project, the impact that the proposed works will have on flooding in the surrounding areas and to present mitigation measures, if any, that may be required as a result. 32EW
97 Flood Risk Assessment 2. Flood Risk Assessment Methodology The FRM guidelines outline the key principles that should be used to assess flood risk to proposed development sites. It is recommended that a staged approach to flood risk assessment should be used: Stage 1: Flood risk identification to identify whether there may be any flooding or surface water management issues relating to the proposed development site that may warrant further investigations. Stage 2: Initial flood risk assessment to confirm sources of flooding that may affect the proposed development site, to appraise the adequacy of existing information and to determine what surveys and modelling approach is appropriate to match the spatial resolution required and complexity of the flood risk issues. This stage involves the review of existing studies, to assess flood risk and to assist with the development of FRM measures. Stage 3: Detailed flood risk assessment to assess flood risk issues in sufficient detail and to provide a quantitative appraisal of potential flood risk to a proposed or existing development, of its potential impacts on flood risk elsewhere and of the effectiveness of any proposed mitigation measures. This will typically involve use of an existing or construction of a hydraulic model across a wide enough area to appreciate the catchment wide impacts and hydrological process involved. This report represents a Flood Risk Identification (Stage 1 Assessment) and Initial Flood Risk Assessment (Stage 2 Assessment) and provides an overview of the potential flood risks to the proposed site and assesses the potential impact of the proposed Project. In addition it proposes mitigation principles that should be pursued as the design is progressed. A Stage 3 Assessment is not proposed as the results from the Stage 1 and 2 Assessments, as outlined in this report, indicate a Stage 3 Assessment is not required. 32EW
, all readily available data was reviewed (as per the list referenced in Table 4 Appendix A) to identify")
98 Flood Risk Assessment 3. Flood Risk Identification (Stage 1) 3.1 Flood History of the Site As part of the Stage 1 Assessment (Flood Risk Identification), all readily available data was reviewed (as per the list referenced in Table 4 Appendix A) to identify whether there may be any flooding or surface water management issues relating to the site that may warrant further investigations. The aim of this section is to outline the flood history of this site. The main historical flood events in the area were identified, assessed and are described below Local Watercourses Prior to describing historical flood risk below this section describes the watercourses adjacent to the site, illustrated in Diagram 1.1. The closest surface water body to the site is the Morell River (WBR005) which lies to the east of the proposed Project. The Morell River flows generally northwards within 50m of the site boundary before flowing into the River Liffey. The River Liffey itself lies approximately 3km north-west of the site at its closest point, also flowing generally northwards, before following a more eastward flow direction some 5 to 6km north of the landfill site. The Rathmore Stream (WBR006) lies to the south east of the proposed Project and joins the Morell River upstream east of the proposed Project. The Canal Feeder Stream (WBR004) is an engineered feature that collects surface water run-off from lands generally to the south and south-west of the site. The Canal Feeder Stream flows generally westward to the Grand Canal, which is located approximately 2km west of the site. Diagram 1.1:Local Watercourses and Site locations 32EW
99 Flood Risk Assessment OPW National Flood Hazard Mapping With reference to the OPW Flood Hazard Mapping website ( which is the national portal for retaining flood information, a number of historical flood events were identified within the areas around the proposed Project, namely the Kill, Johnstown and Sallins areas. A Summary Local Area Report detailing this information was downloaded and is included in Appendix B. The key flood event information from this report is outlined in Table 1. Ref. No. Date of Flood Event Address Description of Event / Comments 1 30 November 2009 Monread, Sallins, Co. Kildare 2 05 November 2000 River Morell, Johnstown, Co.Kildare 3 05 November 2000 Kill River, N7 Road, Co.Kildare 4 10 June 1993 Kill River, N7 Road, Co.Kildare 5 10 June 1993 River Morell, Johnstown, Co.Kildare 6 26 November 2012 Killeenmore, Co. Kildare 7 Recurring River Morell, Johnstown, Co.Kildare Flooding of the Sallins area, particularly the Waterways Estate in Sallins, Co. Kildare Flooding in Johnstown area of Co Kildare due to constrictions caused by under-capacity structures as well as some under-capacity channels. Flooding in Kill area of Co Kildare due to constrictions caused by undercapacity structures. Flooding in Kill area of Co Kildare due to constrictions caused by undercapacity structures. Flooding in Johnstown area of Co Kildare due to constrictions caused by under-capacity structures as well as some under-capacity channels. This flooding event occurred close to the location where the Dublin/Cork railway line crosses the Morrell River. The Morrell River broke its banks upstream of the railway line in this location (just downstream of the Canal). The river then flowed across the land and made its way across/through the railway line by flowing through the river culvert and two other local culverts. The water, which flowed through the local culverts, caused the flooding. Flooding frequently occurs in this area. Flooding in Johnstown area of Co Kildare due to constrictions caused by under-capacity structures as well as some under-capacity channels. Approximate Distance from Project Site 2km 0.6km 3km 3km 0.6km 2.8km 0.6km Table 1: Flood events recorded within the area from the OPW Flood Hazard Mapping Report A number of reports are also available on the OPW Flood Hazard Mapping website. A selection of these reports are listed below: Kildare County Council, National Roads Design Office, N7 Naas Road Widening & Interchanges Scheme, Kill & Johnstown Flood Alleviation Measures Report, June Kildare County Council, National Roads Design Office, N7 Naas Road Widening Interchange Scheme, Hydraulic Model & Flood Alleviation Measures Report, January Kildare County Council Memo, Report Re: Flooding In County Kildare, 5 7 November 2000 OPW Flood Event Report, Flooding at Killeenmore, Co. Kildare, 26th November Although these reports identify and describe flood events in the areas surrounding the site, flooding within the site boundary is not mentioned. 32EW
100 Flood Risk Assessment Eastern CFRAM Study Flood Risk Review Report The Eastern River Basin District Flood Risk Review was carried out as part of the Catchment Based Flood Risk Assessment and Management Study (CFRAMS) process to help validate the findings of the OPW draft Preliminary Flood Risk Assessment (PFRA). These Flood Risk Reviews informed which sites were to be taken forward for a more detailed assessment within the CFRAMS Programme. The Eastern CFRAM Study Flood Risk Review Report indicates that there is evidence of fluvial flooding from the Morell River in the areas around the proposed Project site. As stated in the Flood Risk Review Report; Both Kildare County Council and OPW regional engineering staff have identified the full Morell catchment, as an area of significant flood risk. There is a known recurring flood risk from the Morell River and associated tributaries that has flooded properties in the past. The Report indicates that there is a history of flooding of the Johnstown area, approximately 0.6km to the south of the proposed Project site, from the Morell River. The report also indicates that the Sallins area (approximately 3km from the Project site) is also at risk of flooding from the canal feeder stream which is located to the left of the proposed Project site. The Johnstown, Naas and Sallins Flood Risk Review Maps (Appendix C) indicate that the land directly adjacent to the proposed Project site is at risk of fluvial flooding in the 0.1%, 1% and 10% Annual Exceedance Probability (AEP) flood events, however it does not show the proposed Project site at risk of flooding. Although this reports identifies and describes flooding in the areas surrounding the site, flooding within the site boundary is not mentioned Flood Risk Maps The Eastern CFRAM Study Flood Extent and Depth Maps are available online ( and the relevant map tile is included in Appendix D. The CFRAM maps are the most up to date flood maps indicating the fluvial & coastal flood risk to an area. Due to the location of the proposed Project site, coastal flooding is not a risk in this area. The CFRAM fluvial extent map of the area indicates that the some of the land directly outside the site perimeter is at risk of fluvial flooding in the 0.1%, 1% and 10% fluvial AEP flood events. Although this map identifies fluvial flooding in the area surrounding the site, flooding within the site boundary is not shown Local Libraries and Newspaper Reports There are a number of newspaper articles which detail flooding in areas around the study area such as the Sallins and the Johnstown areas. However there are no newspaper articles which detail flooding of the proposed Project site. 3.2 Summary While it has been concluded that no flooding has occurred within the site boundary, flooding has previously occurred in the vicinity of the site. Proposed works to the site including re-profiling of the site and provision of a capping layer which will increase the rate of runoff from the site. On this basis, a Stage II Flood Risk Assessment has been carried out to develop an understanding of the impacts these proposed works may have to the flood risk on the site and the surrounding areas. 32EW
101 Flood Risk Assessment 4. Initial Flood Risk Assessment (Stage 2) This section assesses the risk of flooding to the site once the works are complete from a range of different sources, which is then used to develop a broad understanding of the risk characteristics to the proposed Project and if any mitigation measures are required. 4.1 Potential Sources of Flooding There is a potential risk from several sources of flooding, as listed below: Coastal - flooding from the sea; Fluvial - flooding from rivers and watercourses; Estuarine - flooding from a combination of fluvial and coastal; Pluvial flooding that is caused by runoff during high rainfall events; Artificial Drainage Systems flooding that occurs as a result of surcharging or blocking of drainage networks; Groundwater flooding when water normally stored below the ground rises above surface level or into below ground spaces (such as basements). The following sections assess the potential risk from each of these separate sources of flooding. 4.2 Coastal Flood Risk Coastal flooding is caused by higher sea levels than normal, resulting in the sea overflowing onto the land. Coastal flooding is influenced by three main factors, which often work in combination. These are: High tide levels caused by normal, and predictable, astronomical factors. Storm surges where sea levels are artificially raised by areas of low barometric pressure such as depression weather systems. Wave action this is dependent on wind speed and direction, as well as local topography and exposure. Due to the sites proximity and elevation from the sea (ground level is above 80mOD), it is reasonable to conclude that there is no flood risk to the proposed Project or site from coastal sources. 4.3 Fluvial Flood Risk Existing Situation As stated in Section 3.2, the Eastern CFRAM flood risk maps indicate that there is no fluvial flood risk to the existing site, however areas directly outside the perimeter of the site are currently at risk of fluvial flooding, from the Morell River, in the 0.1%, 1% and 10% fluvial AEP flood events. Risk Following Proposed Works As the proposed works to the site include re-profiling of the existing ground contours, this could potentially change the fluvial flood risk extents. The predicted flood level for the Morell River for the 0.1% AEP event, upstream of the site is 83.02mOD. The final landscaped contours of the proposed Project, as shown in Figure 4.20, indicate that the minimum level along the site boundary adjacent to the Morell River is 84mOD. It is therefore reasonable to conclude that the proposed ground levels at the boundary of the site, adjacent to the Morell River, will be higher than the predicted 0.1% AEP Water Level shown on the CFRAMS mapping; therefore there will be no fluvial flood risk to the site once the proposed works are complete. 32EW
102 Flood Risk Assessment 4.4 Estuarine Flood Risk Estuarine flooding occurs due to a combination of tidal and fluvial flows, rivers and the sea. A combination of a high flow and a high tide will force water back upstream, increasing water levels and leading to a river bursting its banks. For the reasons outlined in Section 4.2 regarding Coastal Flood Risk, it is reasonable to conclude that there is no estuarine flood risk to the proposed Project or site. 4.5 Pluvial Flood Risk Pluvial flooding occurs during periods of heavy rainfall, when the rainfall rate is greater than the infiltration capacity. It is usually associated with high intensity rainfall events (typically > 30mm/h) resulting in overland flow and ponding in depressions in the topography. Existing Situation No evidence of pluvial flood risk on the site was identified in Section 3. Risk Following Proposed Works The proposed capping material will increase the runoff rate from the site and limit the infiltration capacity of the site. A Surface Water Management Plan has been developed for the proposed Project. This plan describes a proposed drainage system for the site which limits outflow from the site to Q BAR, which has been calculated as 56.58l/s, in order to ensure that the surface water run-off from the site does not have a detrimental impact on the downstream river network and increase the risk of flooding. The drainage system also comprises a series of ponds which provide attenuation for additional flows during a 1% AEP event, with a 10% climate change factor applied. Further details are included in the Surface Water Management Plan (Document number 32EW5604/DOC/0042 0) but given that a design is proposed that will limit the discharge to 56.58l/s, which is equivalent to the greenfield run off rate of Q BAR, it is reasonable to conclude that there will be no pluvial flood risk to the Project or site once the works are complete. 4.6 Artificial Drainage Systems Existing Situation Section of the Environmental Impact Statement (EIS) Volume 2 of 4: Main Report outlines the Current Site Conditions and Drainage System on site. There are no known flooding issues in the existing Artificial Drainage System. Risk Following Proposed Works As detailed in Section 4.5, there will be an appropriately designed drainage network to address pluvial runoff on the site. It can therefore be concluded that there will be no flood risk to the Project or site from Artificial Drainage Systems once the works are complete. 4.7 Groundwater Flood Risk Existing Situation Groundwater flooding during times when the catchment is saturated and the ground water levels are elevated above the level of the site is unlikely as the site is elevated relative to the surrounding topography. Further to this groundwater monitoring boreholes were in place from as outlined in Chapter 13 of the EIS Volume 2 of 4: Main Report. During this time, groundwater levels only marginally increased above 83mOD. The ground levels on the site are currently higher than the monitored groundwater levels, therefore the risk of flooding from groundwater is considered low. 32EW
103 Flood Risk Assessment Risk Following Proposed Works The proposed Project involves reprofiling of the site. The lowest levels on the site will be located at the bottom of the attenuation ponds. The ponds are designed to be above groundwater levels. As there are no proposed works below existing groundwater level, it is reasonable to conclude that the risk of flooding from groundwater sources to the Project or site is not increased. 4.8 Flood Risk due to Climate Change In the future, it is predicted that climate change will increase sea levels, storm events magnitude and frequency, and rainfall depths, intensities and patterns. It is therefore necessary to consider the impact this might have on the flood risk to the proposed Project. For fluvial flow the standard allowance for climate change for the 1% AEP event is a 20% increase in flow. The final landscaped contours along the boundary of the proposed Project site will be higher than the predicted water level for the 0.1% AEP fluvial event (which is higher than the 1% AEP plus Climate Change event). Therefore the risk of fluvial flooding to the site as a result of climate change once the proposed works are complete is considered low. For pluvial flooding, as detailed in Section 4.5, the proposed drainage network design has included a 10% climate change factor. Therefore the risk of pluvial flooding to the site as a result of climate change once the proposed works are complete is considered low. 4.9 Summary of Flood Risk Table 2 below provides a summary of the potential impact from each of the sources of flooding considered, to the road once the works are complete. Flood Risk Summary of Impact Notes Coastal N/A N/A Fluvial Low The final landscaped contours along the boundary of the proposed Project will be higher than the 0.1% AEP Predicted Water Level. Estuarine N/A N/A Pluvial Artificial Drainage Systems Low Low A Surface Water Management Plan has been developed for the proposed Project which includes an adequately designed drainage network for the site. A Surface Water Management Plan has been developed for the proposed Project which includes an adequately designed drainage network for the site. Groundwater Low No works are proposed below groundwater level. Climate Change Low The final landscaped contours along the boundary of the proposed Project will be higher than the predicted water level of the 0.1% AEP fluvial event (which is higher than the 1% AEP plus Climate Change event). Table 2: Summary of Flood Risk to Proposed Project 32EW
104 Flood Risk Assessment 5. Potential Flood Risk Impacts to Surrounding Areas from the Proposed Project Section 4 considered the flood risk to the Project site once the works were completed. This section, Section 5 considers the potential increased flood risk to the surrounding areas as a result of the works. The proposed Project could result in an increase in flood risk if it: Reduces the conveyance of an existing watercourse and floodplain network; Reduces the volume of flood storage available on the watercourse floodplains; or Increases site runoff rates and volume. 5.1 Fluvial Flood Risk As described in Section 4.5 the surface water design for the proposed Project will be a controlled outfall from the site with a discharge rate of 56.58l/s (Q BAR ). The outfall will discharge from an on-site attenuation pond to the Morell River. For flood events greater than a Q BAR event the proposed drainage system will reduce the runoff from the site to the River Morell. For flood events below Q BAR the outfall from the site is negligible considering the size of the site is 0.25km 2 compared to overall catchment of 45km 2. Therefore the proposed Project has no impact on the fluvial flood risk to surrounding areas as a result of the works. 5.2 Pluvial Flood Risk As described in Section 5.1, a Surface Water Management Plan has been developed for the proposed Project which includes an adequately designed drainage network for the site. The site is landscaped to allow all runoff from the site to flow into the attenuation ponds, therefore flood risk from pluvial sources to the surrounding area will not be increased. 5.3 Artificial Drainage Systems As described in Section 5.1, a Surface Water Management Plan has been developed for the proposed Project which includes an adequately designed drainage network for the site, therefore flood risk from Artificial Drainage Systems on site to the surrounding area will not be increased. 5.4 Groundwater Flood Risk The proposed Project involves re-profiling of the site but does not include significant earthworks below groundwater levels that would increase the risk of flooding to the surrounding area from groundwater sources. 5.5 Summary of Flood Risk Table 3 below provides a summary of the potential flood risk impacts on surrounding areas as a result of the proposed Project. 32EW
105 Flood Risk Assessment Flood Risk Summary of Impact Notes Coastal Fluvial Estuarial N/A Negligible Impact N/A Any increase in Flood risk from fluvial sources to the surrounding area is considered negligible. Pluvial No Impact Flood risk from pluvial sources to the surrounding area will not be increased. Artificial Drainage Systems Groundwater Climate Change No Impact No Impact N/A Flood risk from artificial drainage systems to the surrounding area will not be increased. Flood risk from groundwater sources to the surrounding area will not be increased. The impact from the proposed Project on Climate Change is considered nonapplicable. Table 3: Summary of the potential flood risk impacts on surrounding areas as a result of the proposed Project. 32EW
106 Flood Risk Assessment 6. Conclusions and Recommendations 6.1 Conclusions This report provides an assessment of the flood risk issues that could affect the proposed Project and the surrounding area. The assessment has included desktop investigations into the potential flood risks and an assessment of the potential impacts the development could have on flood risk in the surrounding areas. In the design of the project the following mitigation measures have been applied; The proposed finished ground levels along the Morell River are above the predicted flood levels. As the proposed works reduce onsite infiltration of runoff, surface water management systems have been included as part of the design to limit runoff from the site to greenfield rates. Further to these mitigation measures all residual flood risks and impacts have been assessed as having a low categorisation as the potential increase in flow discharging from the Project is being controlled by the planned surface water management system. As per The Planning System and Flood Risk Management, Guidelines for Planning Authorities (2009), a Justification Test was not deemed necessary for the works as there is no existing flood risk to the site and the site is not located in a Flood Zone. 6.2 Recommendations It has been concluded that flood risks and impacts associated with the proposed Project are low or negligible, therefore further detailed modelling, i.e. Stage 3 Detailed Risk Assessment is not required. On securing lands necessary to facilitate the remediation of the site, detailed design will be undertaken for the final surface water management system. This design will reaffirm the landscaping and ensure that levels are maintained above the predicted flood risk levels and meets the requirements of the EIS and the Surface Water Management Plan. These levels will need to be subsequently verified during the construction phase of the works. 32EW
107 Flood Risk Assessment Appendix A. Information Sources Checklist No. Information Source Status Reference/Comments 1 OPW Preliminary Flood Risk Assessment indicative fluvial flood maps Eastern CFRAMS Preliminary Flood Risk Assessment Maps 2 National Coastal Protection Strategy Study flood and coastal erosion risk maps. N/A 3 Predictive and historic flood maps, and Benefiting Lands Map 4 Predictive flood maps produced under the CFRAM studies 5 River Basin Management Plans and reports Kildare County Development Plan , Maps 6 Indicative assessment of existing flood risk under Preliminary Flood Risk Assessment Eastern CFRAMS Flood Risk Review Report and Maps Appendix C 7 Previous Strategic Flood Risk Assessments 1) Strategic Flood Risk Assessment for Kildare County Development Plan ) Draft Strategic Flood Risk Assessment for Kildare Draft County Development Plan Expert advice from OPW who may be able to provide reports containing the results of detailed modelling and floodmapping studies including critical damage areas, and information on historic flood events and local studies etc. N/A 9 Topographical maps, in particular digital elevation models produced by aerial survey or ground survey techniques. 10 Information on flood defence condition and performance N/A 11 Alluvial deposit maps N/A 12 Liable to Flood markings on the old 6 Inch Map Historic OSI 6 Map 32EW5604
108 Flood Risk Assessment 13 Local Libraries and newspaper reports Adequate information on Flooding History was provided by OPW floodmaps.ie Interviews with local people, local history/ natural history societies etc; Walkover survey to asses potential sources of flooding, likely routes for flood water and the site's key features, including flood defences, and their condition X X The following Plans were referred to: 16 National, regional and local spatial plans, such as the National Spatial Strategy, regional planning guidelines, development plans and local area plans provide key information on existing and potential future receptors 1) Kildare County Development Plan ) Strategic Flood Risk Assessment for Kildare County Development Plan ) Kildare Draft County Development Plan ) Draft Strategic Flood Risk Assessment for Kildare Draft County Development Plan Table 4: Information Checklist Table 32EW5604
109 Flood Risk Assessment Appendix B. OPW Summary Local Area Report 32EW5604

110 Summary Local Area Report This Flood Report summarises all flood events within 2.5 kilometres of the map centre. The map centre is in: County: Kildare NGR: N This Flood Report has been downloaded from the Web site The users should take account of the restrictions and limitations relating to the content and use of this Web site that are explained in the Disclaimer box when entering the site. It is a condition of use of the Web site that you accept the User Declaration and the Disclaimer. Map Legend Flood Points Multiple / Recurring Flood Points Areas Flooded Hydrometric Stations Rivers Lakes River Catchment Areas Land Commission * Drainage Districts * Benefiting Lands * 7 Results Map Scale 1:105,097 * Important: These maps do not indicate flood hazard or flood extent. Thier purpose and scope is explained in the Glossary. 1. Monread Sallins Co Kildare 30th Nov 2009 Start Date: 29/Nov/2009 County: Kildare Flood Quality Code: 3 Additional Information: Reports (2) More Mapped Information 2. Morell Johnstown Nov 2000 Start Date: 05/Nov/2000 County: Kildare Flood Quality Code: 2 Additional Information: Reports (2) More Mapped Information 3. Kill River N7 road Nov 2000 Start Date: 05/Nov/2000 County: Kildare Flood Quality Code: 3 Additional Information: Reports (2) More Mapped Information 4. Kill River N7 road June 1993 Start Date: 10/Jun/1993 County: Kildare Flood Quality Code: 3 Additional Information: Reports (1) More Mapped Information 5. Morell Johnstown June 1993 Start Date: 10/Jun/1993 County: Kildare Flood Quality Code: 3 Report Produced: 09-Aug :21
111 Additional Information: Reports (2) More Mapped Information 6. Flooding at Killeenmore, Co. Kildare 26th November 2013 Start Date: 26/Nov/2012 County: Kildare Flood Quality Code: 3 Additional Information: Reports (1) More Mapped Information 7. Morell Johnstown Recurring Start Date: County: Kildare Flood Quality Code: 3 Additional Information: Reports (2) More Mapped Information Report Produced: 09-Aug :21
112 Flood Risk Assessment Appendix C. Eastern CFRAM Study Flood Risk Review Maps 32EW5604
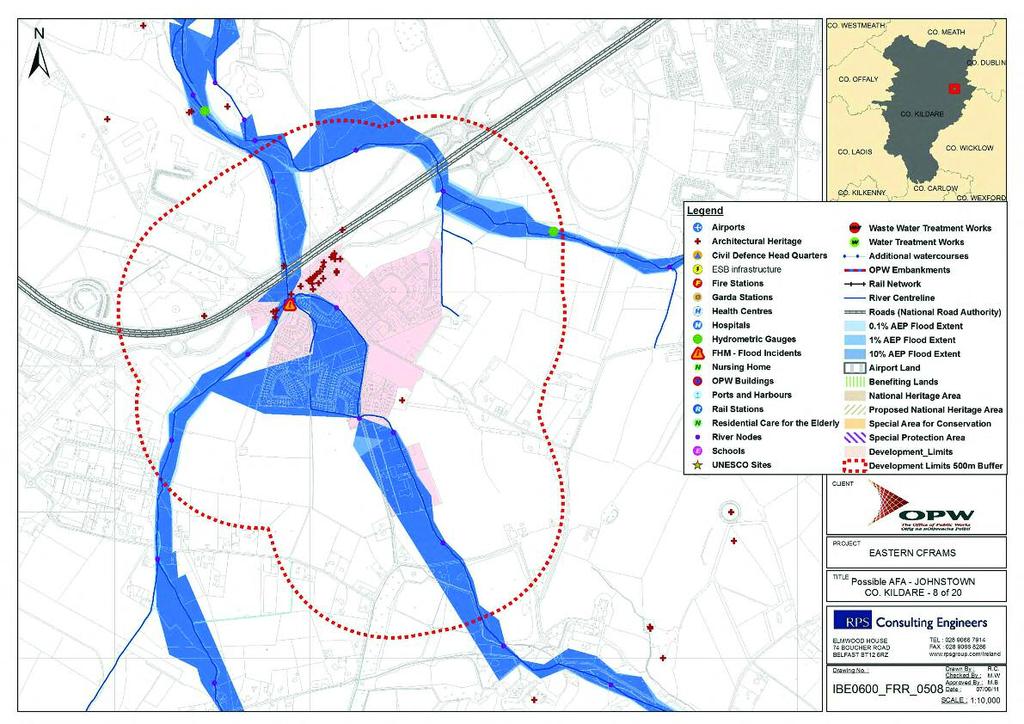
113
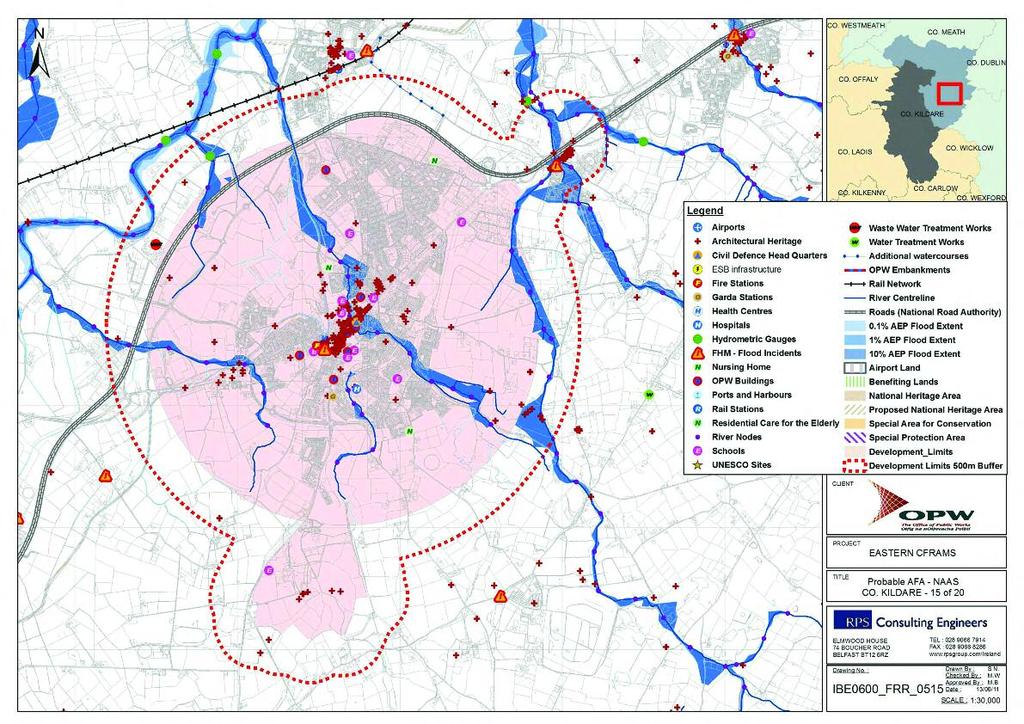
114
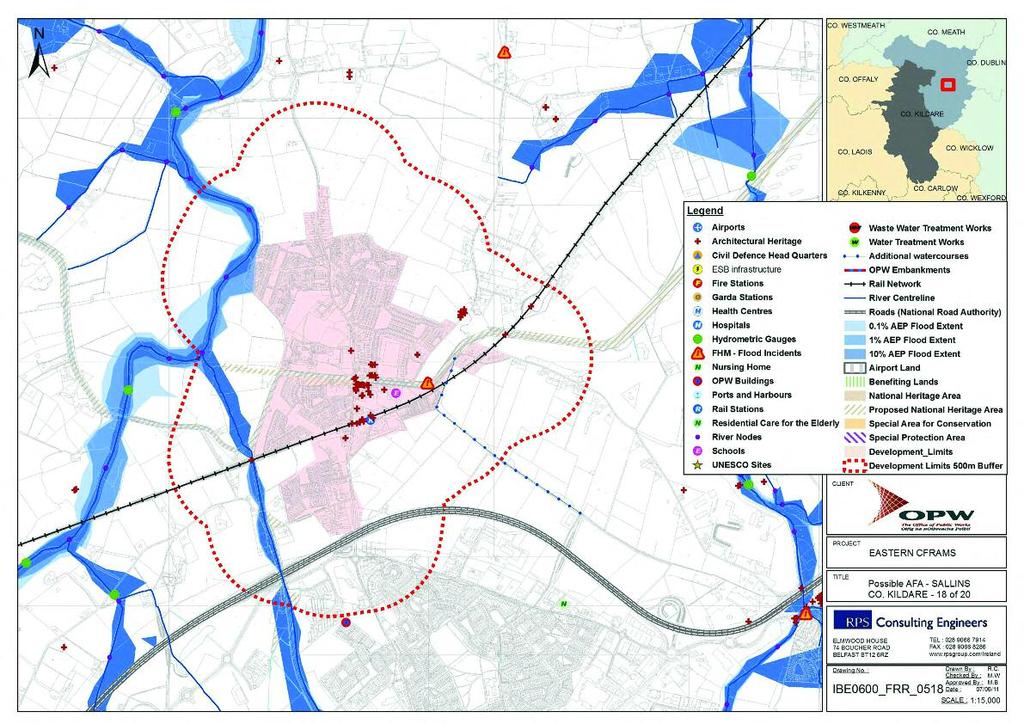
115
116 Flood Risk Assessment Appendix D. OPW Eastern CFRAMS Fluvial Flood Map 32EW5604
 Flow (m³/s) 1% AEP 1% AEP 6.86 84.82 84.07 0.08 83.27 84.11 8.80 83.14 83.")
 Flow (m³/s) 0.1% AEP 0.1% AEP 82.23 N/A 88.11 21.39 88.49 85.63 82.91 84.33 84.37 84.21 83.84 83.02 82.83 89.74 88.11 18.39 N/A 20.20 Naas 3.56 0.91 25.")

! ( REV: 01 NOTE: Amendments made to wire grid.")
117 Node Label 01NAAS Water Level (OD) Flow (m³/s) 10% AEP 10% AEP 09HART HART HART HART00096aD 09HAYN JOHN MORE MORE MORE MORE TOBE TOBE N/A Water Level (OD) Flow (m³/s) 1% AEP 1% AEP N/A N/A N/A N/A N/A Water Level (OD) Flow (m³/s) 0.1% AEP 0.1% AEP N/A N/A Naas N/A IMPORTANT USER NOTE: THE VIEWER OF THIS MAP SHOULD REFER TO THE DISCLAIMER, GUIDANCE NOTES AND CONDITIONS OF USE THAT ACCOMPANY THIS MAP. 10% Fluvial AEP Event Legend 1% Fluvial AEP Event 0.1% Fluvial AEP Event Modelled River Centreline 09HART00137 AFA Extents Embankment! ( Wall Defended Area Turnings/Killeenmore model downstream of this point % AEP Standard of Protection of! (! ( 09HART00096aD 09MORE HART TOBE00007! ( Node Point Node ID Node Label! (! ( ! ( 09HART % AEP 09MORE00806 Flood Defence 1% AEP (Walls / Embankments)! ( REV: 01 NOTE: Amendments made to wire grid. DATE: 20/09/ % AEP FINAL 1% AEP 1% AEP 01NAAS2400! ( 1% AEP! ( 1% AEP! ( MORE % AEP 09MORE % AEP The Office of Public Works Jonathan Swift Street Trim Co Meath 09HAYN00008! (! ( Naas Fluvial Flood Extents 09TOBE00050 Map Type: EXTENT Source: FLUVIAL Map Area: HPW Scenario: 09JOHN00004 Drawn By : CURRENT C.C. Date : 20 September 2016 Approved By : G.G. Date : 20 September 2016 Checked By : T.D. Drawing No. : Metres Elmwood House T +44(0) Boucher Road F +44(0) Belfast W BT12 6RZ E ireland@rpsgroup.com Map: ! ( [ Ordnance Survey Ireland. All rights reserved. Licence number EN /OfficeofPublicWorks. Date : 20 September 2016 E09NAA_EXFCD_F1_20 Map Series : Page 20 of 21 Drawing Scale : A3
Groundwater Risk Assessment
 Groundwater Risk Assessment ELQF - 6 November 2012 Katy Baker Technical Director ARCADIS (UK) Limited Imagine the result Problem definition The importance of the CSM 2 The definition of the problem: 3
DROGHEDA LANDFILL SITE COLLON ROAD, MELL, DROGHEDA
 GROUNDWATER MONITORING INFORMATION QUARTERLY REPORT FOR PERIOD APRIL TO JUNE 216 BY LOUTH COUNTY COUNCIL TO ENVIRONMENTAL PROTECTION AGENCY FOR WASTE LICENCE REFERENCE: W33-1 DROGHEDA LANDFILL SITE COLLON
Groundwater Modeling Guidance
 Groundwater Modeling Guidance Richard J. Mandle Groundwater Modeling Program Michigan Department of Environmental Quality Draft 1.0 10/16/02 Executive Summary The use of groundwater models is prevalent
4.4 MODEL CODE DESCRIPTION 4.5 WATER SOURCES AND SINKS 4.6 MODEL DOMAIN AND BOUNDARIES. SLR South Africa
 Page 4-18 The developed model should therefore be seen as an initial site model which should be refined and recalibrated once more groundwater monitoring and other data become available. 4.4 MODEL CODE
TECHNICAL GUIDANCE. Groundwater Protection Model ON CONTAMINATED SITES
 Groundwater Protection Model 13 TECHNICAL GUIDANCE ON CONTAMINATED SITES Version 2.0 November 1, 2017 This document provides guidance to qualified professionals on using the ministry s Groundwater Protection
Hydraulic containment landfills
 Assessing the risks from hydraulically contained landfill sites Dr Hugh Potter Environment Agency Hydraulic containment landfills h ~200 non-hazardous waste landfills are sub-water table h 40-50 of these
27 Land and groundwater contamination
 27 Land and groundwater contamination Overview This Chapter assesses the potential effects of the proposed Expressway on identified areas of contaminated land with the Project area. The contamination assessment
ENVIRONET Conceptual Site Model
 ENVIRONET Conceptual Site Model Peter Booth Senior Technical Director 17/04/2012 Definition The conceptual site model (CSM) can be seen as; A representation which sets out the critical pollutant linkages
How to surrender your environmental permit Additional guidance for: Landfill and other permanent deposits of waste (5.02)
") How to surrender your environmental permit Additional guidance for: Landfill and other permanent (5.02) Document Owner: National Services/ Knowledge, Planning & Strategy (KSP) Version History: Document
How to surrender your environmental permit Additional guidance for: Landfill and other permanent (5.02) Document Owner: National Services/ Knowledge, Planning & Strategy (KSP) Version History: Document
Methodology for Establishing Cleanup Levels for Contaminated Sites
 Methodology for Establishing Cleanup Levels for Introduction: In Oklahoma, appropriate cleanup levels for a specific site are provided by the Department of Environmental Quality (DEQ). Achieving these
SCREENING LEVEL RISK ASSESSMENT (SLRA) UPDATE CSR STAGE 11 AMENDMENT WEBINAR #6 DECEMBER 5, 2017
 UPDATE CSR STAGE 11 AMENDMENT WEBINAR #6 DECEMBER 5, 2017") SCREENING LEVEL RISK ASSESSMENT (SLRA) UPDATE CSR STAGE 11 AMENDMENT WEBINAR #6 DECEMBER 5, 2017 GEORGE SZEFER Senior Contaminated Sites Officer This PowerPoint presentation and a recording of the audio
SCREENING LEVEL RISK ASSESSMENT (SLRA) UPDATE CSR STAGE 11 AMENDMENT WEBINAR #6 DECEMBER 5, 2017 GEORGE SZEFER Senior Contaminated Sites Officer This PowerPoint presentation and a recording of the audio
Soil Vapor Extraction O&M Report Camp Stanley Storage Activity, Texas
 Appendix C Soil Vapor Extraction O&M Report Camp Stanley Storage Activity, Texas APPENDIX C TECHNOLOGY EVALUATION MEMORANDUM, VEG/OIL BARK MULCH ENHANCEMENT (ORIGINALLY PRESENTED DURING THE SWMU B-3 REMOVAL
Kerdiffstown Landfill Remediation Project
 Envir onmental Impact Assessment Report (EIAR) Vol ume 1 of 4: N on-technical Summar y Kildare C ounty C ouncil Kerdiffstown Landfill Remediation Project Kildare County Council Environmental Impact Assessment
Oversized quarry sumps can be used to store run-off during
 Oversized quarry sumps can be used to store run-off during large events Paved quarry yard with channels routing run-off to attenuation 3 The Hydrogeology of Quarry Dewatering Extraction below the water
Groundwater Monitoring Report
 Groundwater Monitoring Report Briefing Note 5 SC0690011C Volume 1 of 1 Final Scottish Executive BRIEFING5_FINALJR Enviros Aspinwall, 61 The Shore, Leith, Edinburgh. EH6 6RA Scottish Executive Groundwater
Silliot Hill Integrated Waste Management Facility Kilcullen, Co. Kildare. Quarterly Report: Groundwater. Report Period Q1: January 2017 March 2017
 Silliot Hill Integrated Waste Management Facility Kilcullen, Co. Kildare. Quarterly Report: Groundwater Report Period Q1: January 2017 March 2017 Waste Licence Reg: W0014-01 Original Prepared by: Kildare
Clifton Marsh Landfill Variation of planning permission 05/09/0376 & 06/09/0395 for the continuation of landfilling until Non Technical Summary
 Clifton Marsh Landfill Variation of planning permission 05/09/0376 & 06/09/0395 for the continuation of landfilling until 2035 Non Technical Summary SLR Consulting Limited Project Ref: 403.00079.00474
Evaluating Impoundment Closure Scenarios using Fate and Transport Modeling
 2017 World of Coal Ash (WOCA) Conference in Lexington, KY - May 9-11, 2017 http://www.flyash.info/ Evaluating Impoundment Closure Scenarios using Fate and Transport Modeling Jacob J. Walczak 1, Meng Wang
ALABAMA DEPARTMENT OF ENVIRONMENTAL MANAGEMENT WATER DIVISION- INDUSTRIAL SECTION
 ALABAMA DEPARTMENT OF ENVIRONMENTAL MANAGEMENT WATER DIVISION- INDUSTRIAL SECTION CLOSURE GUIDELINES FOR INDUSTRIAL WASTEWATER IMPOUNDMENTS (Revised: 03/00) I. Applicability and Certification Requirements:
2. Assessing the potential risk to Groundwater
 Page no: 1 of 11 1. Introduction 1.1 This document provides guidance on the protection of the water environment from cemetery developments. It is for developers and local authorities intending to expand
Conceptual Site Models for Environmental Investigations and Remediation
 Remediation Technology Symposium (RemTech) 2012 Conceptual Site Models for Environmental Investigations and Remediation October 18, 2012 Tai T. Wong, P.Eng. Authors and Presenter Authors: James Carss,
Refer to Chapter 3.0 (Description of Development) for a detailed site and development description.
 for a detailed site and development description.") 7. WATER: HYDROGEOLOGY & HYDROLOGY 7.1 Introduction This chapter of the EIAR comprises of an assessment of the likely impact of the proposed development on the surrounding surface water and hydrogeological
7. WATER: HYDROGEOLOGY & HYDROLOGY 7.1 Introduction This chapter of the EIAR comprises of an assessment of the likely impact of the proposed development on the surrounding surface water and hydrogeological
DREHID MECHANICAL BIOLOGICAL TREATMENT FACILITY WASTE LICENCE APPLICATION ATTACHMENTS JUNE 2012
 DREHID MECHANICAL BIOLOGICAL TREATMENT FACILITY WASTE LICENCE APPLICATION ATTACHMENTS JUNE 2012 TOBIN CONSULTING ENGINEERS ATTACHMENTS TO WASTE LICENCE APPLICATION Prepared on behalf of: Bord na Móna Plc.
Tarbolton Landfill Summary Report
 Tarbolton Landfill Summary Report Investigation into the potential for environmental impacts resulting from consolidated ash waste deposition and lack of management Scottish Environment Protection Agency
Reference Guideline #1. Hydrogeological Impact Assessment
 Reference Guideline #1 Hydrogeological Impact Assessment Reference Guideline #1 Hydrogeological Impact Assessment Hydrogeological assessments are required for some subdivision applications when triggered
Kerdiffstown Landfill Remediation Project
 Envir onmental Impact Assessment Report (EIAR) Vol ume 4 of 4: Appendices ( Part 1) Kildare C ounty Council Kerdiffstown Landfill Remediation Project Kildare County Council Environmental Impact Assessment
CSAP PD Webinar. SLRA and Groundwater Models - Nov.10th, 2016
 CSAP PD Webinar SLRA and Groundwater Models - Nov.10th, 2016 1 WEBINAR FORMAT: The Webinar consists of a Adobe Connect website portal which was supplied to you as a link and where the presentations can
Methodology for the Derivation of Remedial Targets for Soil and Groundwater to Protect Water Resources
 Methodology for the Derivation of Remedial Targets for Soil and Groundwater to Protect Water Resources P. A. Marsland and M. A. Carey Research Contractor: Aspinwall & Company Environment Agency Rio House
A684 Bedale, Aiskew and Leeming Bar Bypass Environmental Statement. Non Technical Summary. Business and Environmental Services
 A684 Bedale, Aiskew and Leeming Bar Bypass Environmental Statement Non Technical Summary Business and Environmental Services A responsive County Council providing excellent and efficient local services
12. Environmental management
 12. Environmental management 12.1 Overview This section summarises the framework for managing environmental risks associated with construction, commissioning and operation of the Project. It also includes
(,,,) = ( )exp ( + C(x,y,z,t) = the concentration of the contaminant at location x, y, z from the source at time t.
 = ( )exp ( + C(x,y,z,t) = the concentration of the contaminant at location x, y, z from the source at time t.") INTRODUCTION Quick Domenico.xls (QD) is a Microsoft Excel spreadsheet application of An Analytical Model For Multidimensional Transport of a Decaying Contaminant Species, by P.A. Domenico, Journal of Hydrology,
INTRODUCTION Quick Domenico.xls (QD) is a Microsoft Excel spreadsheet application of An Analytical Model For Multidimensional Transport of a Decaying Contaminant Species, by P.A. Domenico, Journal of Hydrology,
Groundwater Protection in the UK: from source protection to integrated catchment planning
 Groundwater Protection in the UK: from source protection to integrated catchment planning Bob Harris Environment Agency, England and Wales National Groundwater & Contaminated Land Centre www.environment-agency.gov.uk
Land Contamination Reports
 Land Contamination Reports Advice for Consultants and Developers www.south-norfolk.gov.uk Introduction and background This leaflet is aimed at consultants who have been appointed to carry out a site investigation
16.3 An Agricultural Land Classification Report is included in ES Volume 2.
 CHAPTER 16: GROUND CONDITIONS AND LAND CONTAMINATION Introduction 16.1 This section of the ES presents the results of an assessment of the impacts of the proposed development on matters associated with
Assessment Modeling of Potential 1,4-Dioxane Transport
 Building lifetime relationships with our clients and employees. Assessment Modeling of Potential 1,4-Dioxane Transport Ringwood Mines/Landfill Superfund Site September 2017 Prepared for: Ford Motor Company
Managing Risks on Brownfield Sites
 Managing Risks on Brownfield Sites Breakfast presentation at CGL Exeter 18 May 2017 Providing Ground Solutions Today s Speakers Bryn Jones Regional Director CGL Exeter Dan Matthews Director CGL Godalming
W12A Landfill Groundwater, Leachate, Water Well, Landfill Gas and Surface Water Quality Monitoring Program
 W12A Landfill Groundwater, Leachate, Water Well, Landfill Gas and Surface Water Quality Monitoring Program The groundwater, leachate, water well, landfill gas and surface water monitoring programs are
SEPA Interim Technical Guidance Note Capping for Landfill Sites
 SEPA Interim Technical Guidance Note Capping for Landfill Sites Summary All landfills will require a cap and operators should provide site specific justification for their proposals and any deviations
WASTE ACCEPTANCE CRITERIA AND DEVELOPMENT OF SOIL TRIGGER VALUES FOR EPA-LICENSED SOIL RECOVERY FACILITIES
 WASTE ACCEPTANCE CRITERIA AND DEVELOPMENT OF SOIL TRIGGER VALUES FOR EPA-LICENSED SOIL RECOVERY FACILITIES 1. Introduction This guidance document applies to soil recovery facilities which exceed the operational
MEMORANDUM. Kathy Yager USEPA OSRTI Dick Goehlert USEPA Region 1 Darryl Luce USEPA Region 1 Mindy Vanderford, GSI Environmental, Inc.
 MEMORANDUM To: From: Kathy Yager USEPA OSRTI Dick Goehlert USEPA Region 1 Darryl Luce USEPA Region 1 Mindy Vanderford, GSI Environmental, Inc. (GSI) Doug Sutton, GeoTrans, Inc. Rob Greenwald, GeoTrans,
Demonstrating Stormwater Infiltration to UICs is Protective of Groundwater Quality
 Demonstrating Stormwater Infiltration to UICs is Protective of Groundwater Quality GWPC Presentation September 28, 2010 Heidi Blischke, GSI Water Solutions, Inc. Barb Adkins, City of Portland, Oregon Rod
TABLE OF CONTENTS Attachment A. Non-Technical Summary. Attachments - Section B. General. B.1 Applicant Details
 TABLE OF CONTENTS Attachment A Non-Technical Summary B.1 Applicant Details B.1. (a). B.1. (b). B.1. (c). Attachments - Section B General A Copy of the Certificate of Incorporation Company s Registration
QUARTER GROUNDWATER SAMPLING RESULTS FOR THE CENTRAL WASTE MANAGEMENT FACILITY (CWMF), BALLYDUFFBEG, INAGH, CO. CLARE.
, BALLYDUFFBEG, INAGH, CO. CLARE.") QUARTER 4 2015 GROUNDWATER SAMPLING RESULTS FOR THE CENTRAL WASTE MANAGEMENT FACILITY (CWMF), BALLYDUFFBEG, INAGH, CO. CLARE. Prepared for: CLARE COUNTY COUNCIL ARAS AN CHONTAE NEW ROAD ENNIS 3156 January
QUARTER 4 2015 GROUNDWATER SAMPLING RESULTS FOR THE CENTRAL WASTE MANAGEMENT FACILITY (CWMF), BALLYDUFFBEG, INAGH, CO. CLARE. Prepared for: CLARE COUNTY COUNCIL ARAS AN CHONTAE NEW ROAD ENNIS 3156 January
ENVIRONMENT AGENCY GUIDANCE ON ASSESSMENT OF RISKS FROM LANDFILL SITES
 ENVIRONMENT AGENCY GUIDANCE ON ASSESSMENT OF RISKS FROM LANDFILL SITES EXTERNAL CONSULTATION VERSION 1.0 May 2004 Consultation Questions Background This guidance sets out what is required with respect
Former Gasworks, Dock Road, Limerick. Baseline Report
 Former Gasworks, Dock Road, Limerick In accordance with Article 22(2) of the Industrial Emissions Directive March 2014 For Bord Gais Ellesmere Port Exchange Station Mercury Court Tithebarn Street Liverpool
REPORT ON APPROACHES AND METHODS FOR EVALUATION VERTICAL TRANSPORT IN GROUNDWATER HYDROGEOLOGICAL ASSESSMENT TOOLS PROJECT.
 Ltd. 500 4260 Still Creek Drive Burnaby, British Columbia, Canada V5C 6C6 Telephone (604) 296-4200 Fax (604) 298-5253 REPORT ON APPROACHES AND METHODS FOR EVALUATION VERTICAL TRANSPORT IN GROUNDWATER HYDROGEOLOGICAL
Effect of the Underlying Groundwater System on the Rate of Infiltration of Stormwater Infiltration Structures.
 Effect of the Underlying Groundwater System on the Rate of Infiltration of Stormwater Infiltration Structures. Presented at: Storm Water Infiltration & Groundwater Recharge A Conference on Reducing Runoff
GROUNDWATER ASSESSMENT MONITORING REPORT APRIL 2014
 Tennessee Valley Authority John Sevier Fossil Plant GROUNDWATER ASSESSMENT MONITORING REPORT APRIL 2014 Prepared by Amos L. Smith, PG Chattanooga, Tennessee June 4, 2014 DOCUMENT CERTIFICATION I certify
METHODOLOGY FOR RISK CHARACTERISATION OF IRELAND S GROUNDWATER. Paper by the Working Group on Groundwater
 Water Framework Directive (WFD) River Basin District Management Systems METHODOLOGY FOR RISK CHARACTERISATION OF IRELAND S GROUNDWATER Paper by the Working Group on Groundwater Guidance document no. GW8
Sustainable management of Christchurch's waterways and wetlands using stormwater soakage disposal
 Impacts of Urban Growth on Surface Water and Groundwater Quality (Proceedings of IUGG 99 Symposium HS5, Birmingham, July 1999). IAHS Publ. no. 259, 1999. 365 Sustainable management of Christchurch's waterways
Water Balance Model for a Generic Near-Surface Disposal Facility
 ABSTRACT Water Balance Model for a Generic Near-Surface Disposal Facility - 10029 Andras Paksy and Ed Henderson National Nuclear Laboratory, UK Water movement into, within and out of a near-surface disposal
Viridor Waste Management. Proposed Development of an In-Vessel Composting Facility. Land at Exide Batteries, Salford Road, Bolton
 Viridor Waste Management Proposed Development of an In-Vessel Composting Facility Land at Exide Batteries, Salford Road, Bolton Non-Technical Summary January 2009 Introduction Viridor Waste Management
Draft Air Quality & Odour Net Effects Analysis & Comparative Evaluation Report
 Clean Harbors Canada Inc. Lambton Landfill Expansion Environmental Assessment Draft Air Quality & Odour Net Effects Analysis & Prepared By: JANUARY, 2014 Executive Summary Two expansion alternatives were
Ground Water Assessment. Investigating Ground Water: Discussion Topics. Leaching. Soil Impacts to Ground Water
 Ground Water Assessment Investigation, Protection, Classification, and Response Requirements OAC 3745-300-10 and parts of 3745-300-07 Certified Professional 8-Hour Training Investigating Ground Water:
Monitored natural attenuation (MNA) as a long-term management technique for contaminated sites
 as a long-term management technique for contaminated sites") Monitored natural attenuation (MNA) as a long-term management technique for contaminated sites Application and experience Prof. Phil Morgan The Sirius Group phil.morgan@thesiriusgroup.com http://www.thesiriusgroup.com
Monitored natural attenuation (MNA) as a long-term management technique for contaminated sites Application and experience Prof. Phil Morgan The Sirius Group phil.morgan@thesiriusgroup.com http://www.thesiriusgroup.com
Solidification/Stabilization
 1 Solidification/Stabilization ITRC Technical And Regulatory Guidance Document: Development of Performance Specifications for Solidification/Stabilization (S/S-1, 2011) Remediation Technologies Symposium
Definitions & Concepts
 Introduction Risk provides the answer to three key questions: what can go wrong; how likely is it; what are the consequences? (Kaplan and Garrick, 1981). To this can be added the question: what can be
Executive Summary performance assessment
 Executive Summary In the United States, low-level radioactive waste is defined as any radioactive waste arising from operations of the nuclear fuel cycle that is not classified as high-level waste (including
Comparative Evaluation Option #1 & Option #2
 Comparative Evaluation Option #1 & Option #2 Option #1 Existing Landfill Approx. 47 metres/14 stories Proposed Layout Approx. 31 metres/9.5 stories Option #2 Existing Landfill Approx. 47 metres/14 stories
Groundwater Models and Modeling Considerations
 Groundwater Models and Modeling Considerations MPCA Industrial Landfill Guidance Workgroup April 30, 2009 Terry Johnson, P.G. Waste Management Inc., The Three Legs of the Stool 1. Engineering design and
Assessment of Landfill Footprint Alternatives West Carleton Environmental Centre. Option #4 Impact on Agriculture
 Assessment of Landfill Footprint Alternatives Figure 422 99 Option #4 Impact on Agriculture The net effects with respect to continued service to customers, the optimized site life/ capacity is 65 million
VIRIDOR WASTE MANAGEMENT LTD
 VIRIDOR WASTE MANAGEMENT LTD Proposed re-phasing of landfilling operations; amended restoration levels and aftercare scheme; and provision of a new waste reception building with associated site infrastructure
Longbridge Town Centre Planning Application
 Longbridge Town Centre Planning Application Non-Technical Summary of the Environmental Statement January 2011 Introduction An application for Planning Permission has been submitted to Birmingham City Council
Groundwater flow from disused landfills in the UK Chalk
 Groundwater Quality: Natural and Enhanced Restoration of Groundwater Pollution (Proceedings ofthe Groundwater Quality 2001 Conference held at Sheffield, UK. June 2001). IAHS Publ. no. 275. 2002. 553 Groundwater
In Situ, Low Temperature Thermal Remediation of LNAPL with Pesticides and Other Recalcitrant Compounds
 In Situ, Low Temperature Thermal Remediation of LNAPL with Pesticides and Other Recalcitrant Compounds RemTech 2017, Banff Springs Hotel and Conference Centre October 11, 2017 Presented by - Jay Dablow,
Treating 1,2 Dichloroethane in a Mixed Plume Kent, UK A Remediation Case Study on the Power of ISCO and ENA
 Chemical Oxidation Enhanced Aerobic Biodegradation Treating 1,2 Dichloroethane in a Mixed Plume Kent, UK A Remediation Case Study on the Power of ISCO and ENA with Royal HaskoningDHV Geology Contaminant
11 HYDROLOGY, HYDROGEOLOGY AND DRAINAGE
 11 HYDROLOGY, HYDROGEOLOGY AND DRAINAGE 11.1 introduction 11.1.1 The objective of this section and the statements presented is to assess the existing hydrological and hydrogeological conditions to understand
DEVELOPING A GOOD CONCEPTUAL MODEL FOR FEDERAL CONTAMINATED SITES COMMON SHORTFALLS AND DATA NEEDS. Presented by: Pierre Maheux, M.Sc., P.Geo.
 DEVELOPING A GOOD CONCEPTUAL MODEL FOR FEDERAL CONTAMINATED SITES COMMON SHORTFALLS AND DATA NEEDS Presented by: Pierre Maheux, M.Sc., P.Geo. Technical contributors: Francois Lauzon, M.Eng., P.Eng., David
IX: HAZARDOUS WASTE MANAGEMENT
 IX: HAZARDOUS WASTE MANAGEMENT 9.0 INTRODUCTION The Government of India has promulgated the Hazardous Waste (Management and Handling) Rules, 1989 and the aegis of Environment (Protection) Act, 1886 through
IAEA-TECDOC-482 PREVENTION AND MITIGATION OF GROUNDWATER CONTAMINATION FROM RADIOACTIVE RELEASES
 IAEA-TECDOC-482 PREVENTION AND MITIGATION OF GROUNDWATER CONTAMINATION FROM RADIOACTIVE RELEASES A TECHNICAL DOCUMENT ISSUED BY THE INTERNATIONAL ATOMIC ENERGY AGENCY, VIENNA, 1988 PREVENTION AND MITIGATION
Holcim (Australia) Pty Limited. Lynwood Quarry Groundwater Monitoring Program Revision 2
 Pty Limited. Lynwood Quarry Groundwater Monitoring Program Revision 2") Holcim (Australia) Pty Limited Lynwood Quarry Groundwater Monitoring Program Revision 2 June 2011 Lynwood Quarry Groundwater Monitoring Program Revision 2 Prepared by on behalf of Holcim (Australia) Pty
Holcim (Australia) Pty Limited Lynwood Quarry Groundwater Monitoring Program Revision 2 June 2011 Lynwood Quarry Groundwater Monitoring Program Revision 2 Prepared by on behalf of Holcim (Australia) Pty
SEMI-QUANTITATIVE RISK ASSESSMENT FOR SMALL CLOSED LANDFILLS
 SEMI-QUANTITATIVE RISK ASSESSMENT FOR SMALL CLOSED LANDFILLS Abstract Phil Lindsay (email: plindsay@golder.co.nz) Golder Associates Ltd Level 1, 79 Cambridge Terrace Christchurch Margaret Leonard Current
4 APPROACH TO THE ENVIRONMENTAL IMPACT ASSESSMENT
 4 APPROACH TO THE ENVIRONMENTAL IMPACT ASSESSMENT 4.1 INTRODUCTION This section describes the broad principles of the methodology adopted for the EIA of the Proposed Development. EIA is a procedure required
Appendix E Landfill Gas
 Appendix E Landfill Gas Appendix E1 Background Appendix E2 Landfill Gas Generation Appendix E3 Landfill Gas Infrastructure Appendix E4 Historic Monitoring Appendix E5 Project Monitoring Appendix E6 Landfill
INSPECTORS REPORT DRAFT PD REGISTER NUMBER
 INSPECTORS REPORT DRAFT PD REGISTER NUMBER 156-1 Applicant: KTK Sand and Gravel Ltd. Facility: Kimmeens, Ballymore Eustace, Co. Kildare Inspector s Recommendation: The licence be granted subject to conditions.
Groundwater Bodies in the UK
 Groundwater Bodies in the UK Rob Ward Head of Groundwater Science British Geological Survey 15 th December 2011 2nd Workshop on Groundwater Bodies in Europe Introduction Background Delineation in UK England,
Protocol 13 Screening Level Risk Assessment May 2018
 The SLRA process occupies a current niche mode in the contaminated sites system and can be issued under numeric instruments. The use of SLRA in many cases requires a specific skill set normally defined
Resource Consent Application - Removal/Remediation of Flare/Blowdown Pit at Kapuni Well site KA2 for Shell Todd Oil Services Ltd
 27 March 2012 Project No. 42780930 South Taranaki District Council Private Bag 902 Hawera, 4640 Attention: Blair Sutherland Dear Blair Subject: Resource Consent Application - Removal/Remediation of Flare/Blowdown
Campbell River Environmental Committee 2353 Dolly Varden Road Campbell River, BC V9W 4W5 (Via ) Attention: Leona Adams
 Attention: Leona Adams") October 17, 2016 16-27 Campbell River Environmental Committee 2353 Dolly Varden Road Campbell River, BC V9W 4W5 (Via email) Attention: Leona Adams Re: Review of Upland Excavating Landfill Application Technical
October 17, 2016 16-27 Campbell River Environmental Committee 2353 Dolly Varden Road Campbell River, BC V9W 4W5 (Via email) Attention: Leona Adams Re: Review of Upland Excavating Landfill Application Technical
ATTACHMENT 12: CDISCO Description and Sensitivity to Input Parameters
 ATTACHMENT 12: CDISCO Description and Sensitivity to Input Parameters INTRODUCTION The A11. ISCO Spreadsheet Design Tool (a.k.a. Conceptual Design for ISCO or CDISCO) was developed with support from ESTCP
Environment Agency Guidance on Requirements for Land Contamination Reports. July 2005
 Environment Agency Guidance on Requirements for Land Contamination Reports July 2005 ENVIRONMENT AGENCY GUIDANCE ON REQUIREMENTS FOR LAND CONTAMINATION REPORTS Context Who is this guidance aimed at? Developers,
PROPOSED PLAN OF REMEDIAL ACTION FOR THE REICHHOLD CHEMICAL SITE CHESWOLD, DELAWARE
 PROPOSED PLAN OF REMEDIAL ACTION FOR THE REICHHOLD CHEMICAL SITE CHESWOLD, DELAWARE July 1999 DNREC Project DE-245 Prepared by: Delaware Department of Natural Resources and Environmental Control Division
A Hydrologic Study of the North Hills, Helena, Montana
 A Hydrologic Study of the North Hills, Helena, Montana Andrew Bobst, Kirk Waren, James Swierc, and Jane Madison MBMG Groundwater Investigations Program 10/6/11 MT AWRA Background Groundwater Steering Committee
Synopsis. Geoffrey R. Tick Dorina Murgulet Hydrogeology Group The University of Alabama UA Project Number Grant # 09-EI UAT-2
 Assessment of Groundwater Flow Paths and Discharge to the Coastal Region of Baldwin County, Alabama to Understand Contaminant Transport using a Cross- Sectional Groundwater Flow and Transport Synopsis
CHAPTER 6.2 WATER RESOURCES HYDROGEOLOGY AND GROUNDWATER IWMF ADDENDUM ENVIRONMENTAL STATEMENT
 6.2 Chapter 6.2 Water Resources Hydrogeology and Groundwater 6.2.1 Introduction and Current Planning Situation Across the footprint of the integrated waste management facility (IWMF) site, quarrying operations
CONSTRUCTION AND DEMOLITION DEBRIS DISPOSAL SITE GUIDELINES
 Nova Scotia Environment and Labour CONSTRUCTION AND DEMOLITION DEBRIS DISPOSAL SITE GUIDELINES Approval Date: October 24, 1997 Effective Date: October 24, 1997 Approved By: Peter Underwood Version Control:
Livingston County Department of Public Health Environmental Health Division. Hydrogeologic Investigation Requirements for Land Division Developments
 Livingston County Department of Public Health Environmental Health Division Hydrogeologic Investigation Requirements for Land Division Developments Reviewed March 1, 2013 Table of Contents Scope/Authority..1
Section 5 Relative Effects of Manure Spreading and Confined Feeding Operations on Groundwater Quality
 Section 5 Relative Effects of Manure Spreading and Confined Feeding Operations on Groundwater Quality 5.1 Introduction The third objective of the Livestock Manure Impacts on Groundwater Quality in Alberta
FAX
 21335 Signal Hill Plaza Suite 100 Sterling, Virginia 20164 www.geotransinc.com 703-444-7000 FAX 703-444-1685 Mr. William Kutash Florida Department of Environmental Protection Waste Management Division
Land to the South of Old Mill Road, Sandbach Environmental Impact Assessment Environmental Statement: Non-Technical Summary
 Environmental Impact Assessment Report prepared by: Ecus Ltd. Brook Holt 3 Blackburn Road Sheffield S61 2DW 0114 266 9292 September 2013 Page Left Intentionally Blank 2 INTRODUCTION This Non Technical
Strength. Performance. Passion. Paris Pit CAP. April 30, Permit To Take Water Application Holcim (Canada) Inc.
 Inc.") Strength. Performance. Passion. Paris Pit CAP April 30, 2013 Permit To Take Water Application 2012 Holcim (Canada) Inc. Agenda Welcome Minutes from Last Meeting Dufferin Paris Pit - General Update Review
Strength. Performance. Passion. Paris Pit CAP April 30, 2013 Permit To Take Water Application 2012 Holcim (Canada) Inc. Agenda Welcome Minutes from Last Meeting Dufferin Paris Pit - General Update Review
Numerical Modeling of Groundwater Flow in the Navajo Sandstone Aquifer at the Tuba City, Arizona, Disposal Site 15167
 Numerical Modeling of Groundwater Flow in the Navajo Sandstone Aquifer at the Tuba City, Arizona, Disposal Site 15167 ABSTRACT Richard Bush*, Timothy Bartlett** *US DOE, Office of Legacy Management **Stoller
IXPER 70C Calcium Peroxide CASE STUDY
 IXPER 70C INTRODUCTION TO ENHANCED AEROBIC BIOREMEDIATION Enhanced aerobic bioremediation is a well-established and viable remediation technology for in situ degradation of a variety of petroleum hydrocarbon
David Hall, Jan Gronow and David Drury Golder Associates Environment Agency
 Monolithic WAC David Hall, Jan Gronow and David Drury Golder Associates Environment Agency Introduction Waste Acceptance Criteria (WAC) are about to be introduced for wastes sentenced to hazardous and
GROUNDWATER MODELING OF A PERMEABLE REACTIVE BARRIER TO ENHANCE SYSTEM PERFORMANCE
 GROUNDWATER MODELING OF A PERMEABLE REACTIVE BARRIER TO ENHANCE SYSTEM PERFORMANCE K.C. Scott, P.G., and D. J. Folkes, P.E. EnviroGroup Limited, 7208 South Tucson Way, Suite 125, Englewood, CO 80112; Phone:
CONTAMINATED LAND FUNDAMENTALS
 CONTAMINATED LAND FUNDAMENTALS Hydrogeology Martin Robertson Z Energy Ltd HYDROGEOLOGY AND THE CSM. WATER CYCLE Groundwater is often a subdued replica of topography. Flow patterns are controlled by the
ESTIMATING THE POST-CLOSURE MANAGEMENT TIME FOR LANDFILLS CONTAINING TREATED MSW RESIDUES
 ESTIMATING THE POST-CLOSURE MANAGEMENT TIME FOR LANDFILLS CONTAINING TREATED MSW RESIDUES D.H. HALL*, J. GRONOW, R. SMITH and A. ROSEVEAR # *Golder Associates (UK) Ltd, Stanton on the Wolds, Nottingham
Christopher Gaule 1, Kenneth J. Goldstein 2,and Curtis A. Heckelman 3. Abstract
 Dual Reactive Barrier Walls for the Remediation of CHC Contamination, Watervliet Arsenal, New York: Design and Installation of an Innovative Technology Abstract Christopher Gaule 1, Kenneth J. Goldstein
Portsmouth Water Response
 CONSULTATION UNDER THE TOWN AND COUNTRY PLANNING (DEVELOPMENT MANAGEMENT PROCEDURE ENGLAND) ORDER 2010 Applicant: UK Oil and Gas Investments PLC Planning Application Reference: SDNP/16/04679/CM Proposal:
Trans- Ash Landfill Benton County, Tennessee Class II Disposal Facility
 1 Trans- Ash Landfill Benton County, Tennessee Class II Disposal Facility We have reviewed the Environmental Integrity report concerning the Trans Ash Landfill and believe there are several errors and/or