WEEKLY PROGRESS REPORT TRC SOLUTIONS. Gowanus Canal Turning Basin 4 Dredging and Capping Pilot Study Brooklyn, New York. Project number:
|
|
|
- Jesse Johns
- 5 years ago
- Views:
Transcription
1 WEEKLY PROGRESS REPORT TRC SOLUTIONS Gowanus Canal Turning Basin 4 Dredging and Capping Pilot Study Brooklyn, New York Project number: Period: October 8 to 12, 2018 Date of Report: October 17, 2018 Rev: 0 Prepared For: Gowanus Environmental Remediation Trust
2 On-Site Activities Conducted During Week: Sevenson Environmental Services (SES) Water Treatment and Monitoring Discharged 4,914 and 540 gallons of treated water on 10/10 and 10/11/18, respectively. No exceedances of continuous monitoring. Turbidity Monitoring Turbid water not observed migrating from the 4 th Street Turning Basin. Capping Activities Continue placement of articulated concrete block mats in southern half of Turning Basin 4. Total of 91 mats placed via crane and divers during period. Cumulative total of 185 of required 255 placed. Citizens Site Activities Continue decontaminating and demobilizing equipment. Quality Assurance and Control Geosyntec DWTS discharge sampling conducted on 10/11/18. Tabulated analytical data from samples collected in May through August attached. No exceedance of the turbidity trigger or action criteria Measurements for 10/8/18: Daily average for ambient buoy 5.5 NTU Daily average for sentinel buoy 2.0 NTU Greatest difference between ambient and sentinel buoy during 15-minute interval with sentinel buoy exceeding ambient buoy 0.6 NTU at Measurements for 10/9/18: Daily average for ambient buoy 13.1 NTU Daily average for sentinel buoy 1.6 NTU Greatest difference between ambient and sentinel buoy during 15-minute interval with sentinel buoy exceeding ambient buoy no instances when turbidity measurement at the sentinel buoy exceeded the ambient buoy. Measurements for 10/10/18: Daily average for ambient buoy 24.6 NTU Daily average for sentinel buoy 2.3 NTU Greatest difference between ambient and sentinel buoy during 15-minute interval with sentinel buoy exceeding ambient buoy no instances when turbidity measurement at the sentinel buoy exceeded the ambient buoy. Measurements for 10/11/18: Daily average for ambient buoy 19.2 NTU Daily average for sentinel buoy 1.9 NTU Greatest difference between ambient and sentinel buoy during 15-minute interval with sentinel buoy exceeding ambient buoy no instances when turbidity measurement at the sentinel buoy exceeded the ambient buoy.
3 Measurements for 10/12/18: Daily average for ambient buoy 1.3 NTU Daily average for sentinel buoy 0.4 NTU Greatest difference between ambient and sentinel buoy during 15-minute interval with sentinel buoy exceeding ambient buoy 0.9 NTU at Community Air Monitoring Program TRC CAMP Operated and maintained two (2) air monitoring stations at the upland staging area and five (5) monitoring station at the 4 th Street Turning Basin Area. No exceedances of particulate matter of 10 microns in diameter or smaller (PM10) or tota l volatile organic compounds (TVOC) of the action level of 150 micrograms per cubic meter or 1,000 parts per billion, respectively. Maximum weekly measurements of PM10 in µg/m 3 Station 1 49 µg/m 3 recorded on 10/10/18 Station 2 41 µg/m 3 recorded on 10/10/18 Station 3 22 µg/m 3 recorded on 10/12/18 Station 4 31 µg/m 3 recorded on 10/10/18 Station 5 19 µg/m 3 recorded on 10/10/18 Station 6 29 µg/m 3 recorded on 10/10/18 Station 7 <1 µg/m 3 recorded throughout the week Maximum weekly measurements of TVOC in ppb Station 1 15 ppb recorded on 10/10/18 Station 2 <1 ppb recorded throughout the week Station 3 41 ppb recorded on 10/09, 10/10, and 10/11/18 Station ppb recorded on 10/12/18 Station 5 92 ppb recorded on 10/09/18 Station ppb recorded on 10/08/18 Station 7 <1 ppb recorded throughout the week 23-hour samples collected at ST-6 collected on 10/08 through 10/09 and ST-7 collected on 10/10 through 10/11. Laboratory turnaround time is 10 business days. Tabulated laboratory analytical results for 23-hour sample collected at ST-5 on 09/10 through 09/11, ST-6 (collocated) on 09/12 through 09/13, ST-1 on 09/20 through 09/21, ST-7 on 09/18 through 09/19, ST-2 on 09/24 through 09/25, and ST-3 on 09/25 through 09/26 presented in weekly CAMP report. Noise and Vibration Monitoring Wilson Ihrig Operated and maintained two (2) noise monitors: NM-1 (north side of canal on Whole Foods promenade) and NM-2 (south side of canal on southeast corner of 386 3rd Avenue). No exceedances of the hourly Leq noise limit of 80 dba. Greatest hourly Leq noise measurements Northern monitor (NM-1) 71 dba during on 10/10/18 Southern monitor (NM-2) 70.5 dba during on 10/12/18 Cultural Natural Resource Monitoring Archeology and Historic Resource Services (AHRS) Conduct site inspection of segregated materials at Clean Earth Claremont on 10/09/18. Nothing potentially culturally significant identified.
4 Two-Week Look Ahead: Sevenson: Treatment and discharge of water accumulated during decontamination operations. Perform optical monitoring of bulkheads and surrounding structures with autonomous total survey stations. Along with weekly optical surveys conducted by subcontractor. Continue placement of articulated concrete block mats. Mobilize and commence placement of underwater concrete and grout within seams of articulated concrete block mats. Cleaning of rip rap adjacent to Whole Foods pending EPA approval. Geosyntec Perform construction quality assurance responsibilities, including collection of water samples from dredge water treatment system. TRC CAMP Monitoring Perform community air monitoring. Wilson Ihrig Perform noise monitoring, AHRS Finalize inventory and final report for EPA review. Key Milestones No milestones during week. Attachments: 1. Geosyntec In-Canal Water Quality Monitoring Weekly Data Summary 2. TRC Weekly CAMP Report 3. Wilson Ihrig Weekly Noise and Vibration Monitoring Report 4. AHRS Weekly Report 5. Water Treatment System Monitoring Analytical Laboratory Data 6. Cumulative Dredged Material Chart (no activities during week)


5 Client Name: Site Location: Project No.: Gowanus ERT TB-4 Pilot Study Photo No. Date Description Diver ready to enter the water with tape to measure distance. Photo No. Date Description Diver entering the water.


6 Client Name: Site Location: Project No.: Gowanus ERT TB-4 Pilot Study Photo No. Date Description Lifting single mat, ready for placement in the turning basin. Photo No. Date Description Hooking the mats to lifting device.


7 Client Name: Site Location: Project No.: Gowanus ERT TB-4 Pilot Study Photo No. Date Description Staged barge with stacked ACB mats. Photo No. Date Description Mats moving into position and divers readying for entry.


8 Client Name: Site Location: Project No.: Gowanus ERT TB-4 Pilot Study Photo No. Date Description New tugboat Shirley. Photo No. Date Description Lowering mats with divers readying for entry.


9 Client Name: Site Location: Project No.: Gowanus ERT TB-4 Pilot Study Photo No. Date Description Status of decontamination and demobilization of dredge water treatment system. Photo No. Date Description Lowering mat for positioning by divers.
10 GEOSYNTEC IN-CANAL WATER QUALITY MONITORING WEEKLY DATA SUMMARY


11 Prepared for GOWANUS CANAL SUPERFUND SITE DREDGING AND CAPPING PILOT STUDY Water Quality Monitoring Weekly Data Summary Week of October 8 th, 2018 Report Contents Scope of Monitoring Turbidity Buoy Data Handheld Measurements Summary of Visual Observations Report of Exceedances Prepared by 7 Graphics Drive, Suite 106 Ewing, NJ Project Number HPH106A (52)
12 1. SCOPE OF MONITORING The following report summarizes water quality monitoring data collected during the week of October 8 th, Two turbidity buoys were deployed to monitor turbidity during the pilot study. One turbidity buoy was deployed just outside of the 4 th Street Turning Basin and is referred to as the sentinel buoy. A second turbidity buoy was deployed further upstream in RTA1 in order to monitor background turbidity unaffected by on-water construction activities. This turbidity buoy is referred to as the ambient buoy. A map indicating the approximate locations of the turbidity buoys is provided in Figure 1. Each turbidity buoy was equipped with a YSI 600 OMS water quality meter with optical turbidity sensor. The buoys were programmed such that readings were collected every 15 minutes. After each measurement, the turbidity data were transmitted to a FTP site via telemetry. This report provides the turbidity data collected every 15 minutes from both the ambient and sentinel buoys during each day between 7 AM and 5 PM during the week of October 8 th. Average and maximum turbidity are also presented. No handheld measurements were collected during this reporting period. Visual observations of turbidity and sheen are summarized in Section 4. The data provided in this summary report have not yet been validated and should be considered preliminary.

13


14 2. TURBIDITY BUOY DATA The following section provides turbidity data for the sentinel and ambient turbidity buoys from 7 AM to 5 PM from October 8 th to October 12 th, Background data prior to the start of dredging is provided in Appendix A. No exceedances to the numerical rolling average threshold criteria were observed during the reporting period. Negative values were observed during this reporting period. Since the numerical criteria is based on the difference between the ambient and sentinel turbidity buoy measurements, these negative values do not impact monitoring. 2.1 Monday, October 8 th, 2018


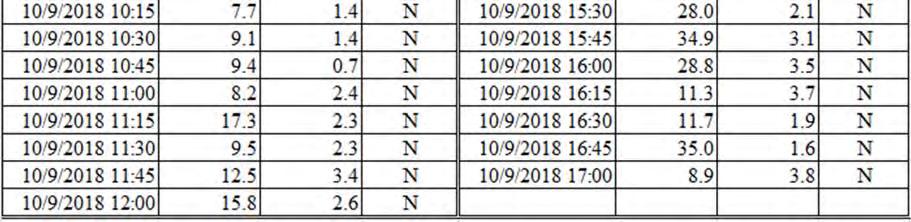
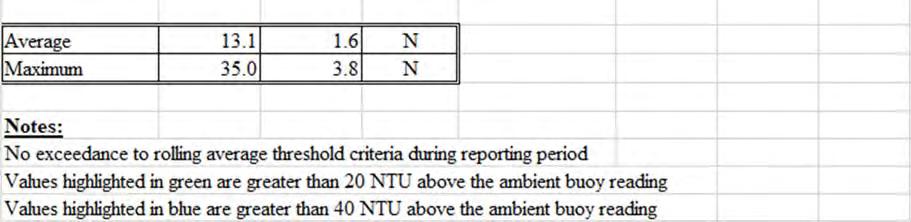
15 2.2 Tuesday, October 9 th, 2018


16 2.3 Wednesday, October 10 th, 2018


17 2.4 Thursday, October 11 th, 2018


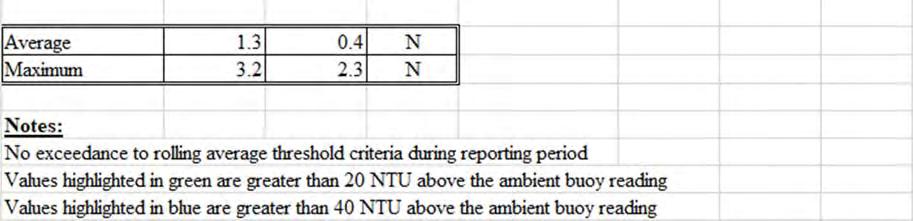
18 2.5 Friday, October 12 th, 2018
19 3. HANDHELD MEASURMENTS No handheld measurements were collected during this reporting period. 4. SUMMARY OF VISUAL OBSERVATIONS Visual observations were consistent with background conditions. 5. REPORT OF EXCEEDANCES No exceedances of the water quality monitoring threshold criteria were met during the reporting period. Refer to the Water Quality Monitoring Plan for In-waterway Construction Activities (Geosyntec 2017) for further information regarding the Trigger and Action Criteria. Threshold criteria are summarized as follows: Trigger criterion Any of the following: o The rolling average of the sentinel buoy turbidity measurements over a one-hour period exceeds the rolling average of the ambient buoy turbidity measurements by 20 NTU excluding any eliminated outlier measurements; or o Either an oil sheen or a turbidity plume is visually observed outside of engineering controls and in-waterway construction activities cannot be immediately excluded as the source. Action criterion Any of the following: o The rolling average of the sentinel buoy turbidity measurements over a one-hour period exceeds the rolling average of the ambient buoy turbidity measurements by 40 NTU excluding any eliminated outlier measurements; or o Either an oil sheen or a turbidity plume is visually observed outside of engineering controls and in-waterway construction activities are readily identified as the source.
20 FIGURES
21 ³ X:\03_GIS\mxd\Canal_Wide\Turbidity Buoy Locations.mxd; acarnes; 10/19/2017 Legend #* Ambient Buoy #* Sentinel Buoy RTA Boundary Gowanus Canal Remedial Design Group Feet Turbidity Buoy Locations Gowanus Canal, Brooklyn, NY Ewing, NJ October 2017 Figure 1
22 APPENDIX A PRE-DREDGE TURBIDITY BUOY DATA
23 PRELIMINARY DATA NOT YET SUBJECT TO QC REVIEW Ambient Turbidity (NTU) Sentinel Turbidity (NTU) Sentinel> Ambient (Y/N) Ambient Turbidity (NTU) Sentinel Turbidity (NTU) Sentinel> Ambient (Y/N) Ambient Turbidity (NTU) Sentinel Turbidity (NTU) Time (Local) Time (Local) Time (Local) 10/3/ : N 10/4/2017 4: Y 10/4/ : N 10/3/ : N 10/4/2017 4: Y 10/4/ : N 10/3/ : N 10/4/2017 5: Y 10/4/ : N 10/3/ : N 10/4/2017 5: Y 10/4/ : N 10/3/ : N 10/4/2017 5: Y 10/4/ : N 10/3/ : N 10/4/2017 5: Y 10/4/ : N 10/3/ : N 10/4/2017 6: Y 10/4/ : N 10/3/ : N 10/4/2017 6: Y 10/4/ : N 10/3/ : N 10/4/2017 6: Y 10/4/ : N 10/3/ : N 10/4/2017 6: Y 10/4/ : N 10/3/ : N 10/4/2017 7: Y 10/4/ : N 10/3/ : N 10/4/2017 7: Y 10/4/ : N 10/3/ : Y 10/4/2017 7: Y 10/4/ : N 10/3/ : Y 10/4/2017 7: N 10/4/ : N 10/3/ : N 10/4/2017 8: Y 10/4/ : N 10/3/ : N 10/4/2017 8: N 10/4/ : N 10/3/ : N 10/4/2017 8: N 10/4/ : N 10/3/ : N 10/4/2017 8: Y 10/4/ : N 10/3/ : N 10/4/2017 9: Y 10/4/ : N 10/3/ : N 10/4/2017 9: N 10/4/ : N 10/3/ : N 10/4/2017 9: N 10/4/ : N 10/3/ : N 10/4/2017 9: N 10/4/ : N 10/3/ : N 10/4/ : N 10/4/ : N 10/3/ : N 10/4/ : N 10/4/ : N 10/3/ : N 10/4/ : N 10/5/2017 0: N 10/3/ : N 10/4/ : N 10/5/2017 0: N 10/3/ : N 10/4/ : Y 10/5/2017 0: N 10/3/ : N 10/4/ : Y 10/5/2017 0: N 10/3/ : N 10/4/ : N 10/5/2017 1: N 10/3/ : N 10/4/ : N 10/5/2017 1: Y 10/3/ : N 10/4/ : N 10/5/2017 1: N 10/3/ : N 10/4/ : N 10/5/2017 1: N 10/3/ : N 10/4/ : N 10/5/2017 2: N 10/3/ : N 10/4/ : N 10/5/2017 2: N 10/3/ : Y 10/4/ : N 10/5/2017 2: N 10/3/ : N 10/4/ : N 10/5/2017 2: N 10/4/2017 0: N 10/4/ : N 10/5/2017 3: N 10/4/2017 0: N 10/4/ : N 10/5/2017 3: N 10/4/2017 0: N 10/4/ : N 10/5/2017 3: N 10/4/2017 0: N 10/4/ : N 10/5/2017 3: N 10/4/2017 1: N 10/4/ : N 10/5/2017 4: N 10/4/2017 1: N 10/4/ : N 10/5/2017 4: N 10/4/2017 1: N 10/4/ : N 10/5/2017 4: N 10/4/2017 1: N 10/4/ : N 10/5/2017 4: N 10/4/2017 2: N 10/4/ : N 10/5/2017 5: N 10/4/2017 2: N 10/4/ : N 10/5/2017 5: N 10/4/2017 2: N 10/4/ : N 10/5/2017 5: Y 10/4/2017 2: N 10/4/ : N 10/5/2017 5: N 10/4/2017 3: N 10/4/ : N 10/5/2017 6: N 10/4/2017 3: N 10/4/ : N 10/5/2017 6: N 10/4/2017 3: N 10/4/ : N 10/5/2017 6: N 10/4/2017 3: N 10/4/ : N 10/5/2017 6: Y 10/4/2017 4: Y 10/4/ : N 10/5/2017 7: Y 10/4/2017 4: Y 10/4/ : N Average N Maximum Y Sentinel> Ambient (Y/N)
24 TRC WEEKLY COMMUNITY AIR MONITORING PROJECT REPORT
 Community Air Monitoring Project 53 rd Weekly Monitoring Period Summary Report: October 8 th, through October 12 th, 2018 Report Contents Executive Summary Daily Data Summary")
25 Gowanus Canal Superfund Site TB-4 Dredging and Capping Pilot Study Brooklyn, New York Weekly Report (TRC Project No ) Community Air Monitoring Project 53 rd Weekly Monitoring Period Summary Report: October 8 th, through October 12 th, 2018 Report Contents Executive Summary Daily Data Summary Report PM10/TVOC Daily Meteorological Summary Report Periodic Monitoring Results Volatile Organic Compounds (USEPA Method TO-15)
26 Gowanus Canal Superfund Site TB-4 Dredging and Capping Pilot Study Brooklyn, New York Executive Summary Week 53 Monitoring Period October 8 th through October 12 th, 2018 The following report summarizes site air monitoring activities for the Week 53 monitoring period from October 8 th through October 12 th, The start and stop times associated with each daily monitoring period are listed on the respective daily reports. TRC continued to operate two (2) air monitoring stations on the Citizen Property or Staging Area, and five (5) air monitoring stations in the 4 th St Turning Basin Area using the equipment specified previously in the Gowanus Canal TB-4 Dredging and Pilot Study Executive Summary Background Monitoring Period Report. During the Week 53 monitoring period there were no PM10 or TVOC exceedances of the action level of 150 ug/m 3 or 1,000 ppb respectively as defined in the Community Air Monitoring Plan for the Gowanus Canal TB-4 Dredging and Pilot Study Project Brooklyn, NY, August Figure 1 depicts Total Volatile Organics (TVOC) daily averages and maximums. Figure 2 depicts particulate monitoring (PM10) daily averages and maximums. Figure 3 depicts the station locations along the Gowanus Canal. Additional monitoring for hydrogen sulfide, ammonia, and formaldehyde took place at all stations throughout the Week 53 monitoring period twice daily. The results of these measurements are shown in Table 1. During the Week 53 monitoring period of October 8 th through October 12 th, 2018 TRC conducted Volatile Organic Compounds (USEPA Method TO-15) sampling at Stations 6 and 7. The ST-6 sample was collected on October 8 th through October 9 th, 2018 and the ST-7 sample was collected on October 10 th through October 11 th, Both samples were collected over a 23-hour period and shipped to Con-Test Analytical Laboratory for analyses. The results of the summa canister sampling are pending lab analyses..
27 Table 2 presents the analytical results for 23-hour samples collected at Station 6 during Week 49. Co-located samples (ST-6A and ST-6B) were collected at Station 6 on September 12 th, through September 13 th, Sampling results were either not detected above the laboratory detection limit or consistent with concentrations detected during background monitoring conducted between August 28th and 31st, Table 3 presents the analytical results for 23-hour samples collected at Stations 1 and 7 during Week 50. The ST-1 sample was collected on September 20 th through 21 st, 2018 and The ST-7 sample was collected on September 18 th through 19 th, Sampling results were either not detected above the laboratory detection limit or consistent with concentrations detected during background monitoring conducted between August 28th and 31st, Table 4 presents the analytical results for 23-hour samples collected at Stations 2 and 3 during Week 51. The ST-2 sample was collected on September 24 th through 25 th, 2018 and The ST-3 sample was collected on September 25 th through 26 th, Sampling results were either not detected above the laboratory detection limit or consistent with concentrations detected during background monitoring conducted between August 28th and 31st, Site activities which were conducted at the Citizen Property during October 8 th through October 12 th, 2018 included the following: Material and equipment deliveries on Citizen Property General vehicular traffic site-wide throughout the monitoring period Maintenance of the barges and equipment Continue decontaminating and demobilizing equipment Site activities which were conducted at the 4 th St Turning Basin Area of the Canal during October 8 th through October 12 th, 2018 included the following: Continued placement of articulated concrete block mats in southeast corner of 4 th St Turning Basin. Total of 91 mats of the required 255 placed via crane and divers during period
28 Gowanus Canal Superfund Site TB-4 Dredging and Capping Pilot Study Brooklyn, New York Daily Station Report TVOC/PM 10 (TRC Project No ) 10/08/ :30 AM - 10/08/ :45 PM Station 1 (Citizen Property near Construction Trailers) TVOC PM 10 Max. 2 ppb Max. 17 ug/m 3 Avg. 1 ppb Avg. 10 ug/m 3 Exc. 0 total Exc. 0 Total Station 2 (Citizen Property near Pad Area) TVOC PM 10 Max. <1 ppb Max. 21 ug/m 3 Avg. <1 ppb Avg. 13 ug/m 3 Exc. 0 total Exc. 0 Total Station 3 (Whole Foods Property NW Riverwalk Location) TVOC PM 10 Max. 35 ppb Max. <1 ug/m 3 Avg. 28 ppb Avg. <1 ug/m 3 Exc. 0 total Exc. 0 Total Station 4 (Whole Foods Property Central Riverwalk Location) TVOC PM 10 Max. <1 ppb Max. 20 ug/m 3 Avg. <1 ppb Avg. 10 ug/m 3 Exc. 0 total Exc. 0 Total Station 5 (Whole Foods Property near 3rd Avenue Bridge) TVOC PM 10 Max. 77 ppb Max. 18 ug/m 3 Avg. 7 ppb Avg. 10 ug/m 3 Exc. 0 total Exc. 0 Total Station 6 (Maritime Estates Property along Canal Fencing) TVOC PM 10 Max. 111 ppb Max. 18 ug/m 3 Avg. 25 ppb Avg. 9 ug/m 3 Exc. 0 total Exc. 0 Total Station 7 (386 3rd Avenue along Canal Fencing) TVOC PM 10 Max. <1 ppb Max. <1 ug/m 3 Avg. <1 ppb Avg. <1 ug/m 3 Exc. 0 total Exc. 0 Total TVOC Total Volatile Organic Compounds PM 10 Particulates as PM 10 Max. Maximum daily average (15 min. avg. TVOC / 15 min. avg. PM 10 ) Avg. Daily average (15 min. avg. TVOC / 15 min. avg. PM 10 ) Exc. Total # of averages which exceed the action level ( 1 ppm - TVOC / 150 ug/m3 - PM 10 )
29 Gowanus Canal Superfund Site TB-4 Dredging and Capping Pilot Study Brooklyn, New York Daily Station Report TVOC/PM 10 (TRC Project No ) 10/09/ :00 AM - 10/09/ :45 PM Station 1 (Citizen Property near Construction Trailers) TVOC PM 10 Max. 7 ppb Max. 18 ug/m 3 Avg. 3 ppb Avg. 9 ug/m 3 Exc. 0 total Exc. 0 Total Station 2 (Citizen Property near Pad Area) TVOC PM 10 Max. <1 ppb Max. 38 ug/m 3 Avg. <1 ppb Avg. 12 ug/m 3 Exc. 0 total Exc. 0 Total Station 3 (Whole Foods Property NW Riverwalk Location) TVOC PM 10 Max. 41 ppb Max. <1 ug/m 3 Avg. 30 ppb Avg. <1 ug/m 3 Exc. 0 total Exc. 0 Total Station 4 (Whole Foods Property Central Riverwalk Location) TVOC PM 10 Max. <1 ppb Max. 15 ug/m 3 Avg. <1 ppb Avg. 11 ug/m 3 Exc. 0 total Exc. 0 Total Station 5 (Whole Foods Property near 3rd Avenue Bridge) TVOC PM 10 Max. 92 ppb Max. 16 ug/m 3 Avg. 18 ppb Avg. 12 ug/m 3 Exc. 0 total Exc. 0 Total Station 6 (Maritime Estates Property along Canal Fencing) TVOC PM 10 Max. 69 ppb Max. 26 ug/m 3 Avg. 33 ppb Avg. 12 ug/m 3 Exc. 0 total Exc. 0 Total Station 7 (386 3rd Avenue along Canal Fencing) TVOC PM 10 Max. <1 ppb Max. <1 ug/m 3 Avg. <1 ppb Avg. <1 ug/m 3 Exc. 0 total Exc. 0 Total TVOC Total Volatile Organic Compounds PM 10 Particulates as PM 10 Max. Maximum daily average (15 min. avg. TVOC / 15 min. avg. PM 10 ) Avg. Daily average (15 min. avg. TVOC / 15 min. avg. PM 10 ) Exc. Total # of averages which exceed the action level ( 1 ppm - TVOC / 150 ug/m3 - PM 10 )
30 Gowanus Canal Superfund Site TB-4 Dredging and Capping Pilot Study Brooklyn, New York Daily Station Report TVOC/PM 10 (TRC Project No ) 10/10/ :00 AM - 10/10/ :45 PM Station 1 (Citizen Property near Construction Trailers) TVOC PM 10 Max. 15 ppb Max. 49 ug/m 3 Avg. 3 ppb Avg. 10 ug/m 3 Exc. 0 total Exc. 0 Total Station 2 (Citizen Property near Pad Area) TVOC PM 10 Max. <1 ppb Max. 41 ug/m 3 Avg. <1 ppb Avg. 12 ug/m 3 Exc. 0 total Exc. 0 Total Station 3 (Whole Foods Property NW Riverwalk Location) TVOC PM 10 Max. 41 ppb Max. <1 ug/m 3 Avg. 32 ppb Avg. <1 ug/m 3 Exc. 0 total Exc. 0 Total Station 4 (Whole Foods Property Central Riverwalk Location) TVOC PM 10 Max. <1 ppb Max. 31 ug/m 3 Avg. <1 ppb Avg. 12 ug/m 3 Exc. 0 total Exc. 0 Total Station 5 (Whole Foods Property near 3rd Avenue Bridge) TVOC PM 10 Max. <1 ppb Max. 19 ug/m 3 Avg. <1 ppb Avg. 7 ug/m 3 Exc. 0 total Exc. 0 Total Station 6 (Maritime Estates Property along Canal Fencing) TVOC PM 10 Max. <1 ppb Max. 29 ug/m 3 Avg. <1 ppb Avg. 8 ug/m 3 Exc. 0 total Exc. 0 Total Station 7 (386 3rd Avenue along Canal Fencing) TVOC PM 10 Max. <1 ppb Max. <1 ug/m 3 Avg. <1 ppb Avg. <1 ug/m 3 Exc. 0 total Exc. 0 Total TVOC Total Volatile Organic Compounds PM 10 Particulates as PM 10 Max. Maximum daily average (15 min. avg. TVOC / 15 min. avg. PM 10 ) Avg. Daily average (15 min. avg. TVOC / 15 min. avg. PM 10 ) Exc. Total # of averages which exceed the action level ( 1 ppm - TVOC / 150 ug/m3 - PM 10 )
31 Gowanus Canal Superfund Site TB-4 Dredging and Capping Pilot Study Brooklyn, New York Daily Station Report TVOC/PM 10 (TRC Project No ) 10/11/ :00 AM - 10/11/ :45 PM Station 1 (Citizen Property near Construction Trailers) TVOC PM 10 Max. 8 ppb Max. 36 ug/m 3 Avg. 3 ppb Avg. 7 ug/m 3 Exc. 0 total Exc. 0 Total Station 2 (Citizen Property near Pad Area) TVOC PM 10 Max. <1 ppb Max. 35 ug/m 3 Avg. <1 ppb Avg. 10 ug/m 3 Exc. 0 total Exc. 0 Total Station 3 (Whole Foods Property NW Riverwalk Location) TVOC PM 10 Max. 41 ppb Max. <1 ug/m 3 Avg. 29 ppb Avg. <1 ug/m 3 Exc. 0 total Exc. 0 Total Station 4 (Whole Foods Property Central Riverwalk Location) TVOC PM 10 Max. <1 ppb Max. 16 ug/m 3 Avg. <1 ppb Avg. 9 ug/m 3 Exc. 0 total Exc. 0 Total Station 5 (Whole Foods Property near 3rd Avenue Bridge) TVOC PM 10 Max. <1 ppb Max. 13 ug/m 3 Avg. <1 ppb Avg. 4 ug/m 3 Exc. 0 total Exc. 0 Total Station 6 (Maritime Estates Property along Canal Fencing) TVOC PM 10 Max. <1 ppb Max. 15 ug/m 3 Avg. <1 ppb Avg. 5 ug/m 3 Exc. 0 total Exc. 0 Total Station 7 (386 3rd Avenue along Canal Fencing) TVOC PM 10 Max. <1 ppb Max. <1 ug/m 3 Avg. <1 ppb Avg. <1 ug/m 3 Exc. 0 total Exc. 0 Total TVOC Total Volatile Organic Compounds PM 10 Particulates as PM 10 Max. Maximum daily average (15 min. avg. TVOC / 15 min. avg. PM 10 ) Avg. Daily average (15 min. avg. TVOC / 15 min. avg. PM 10 ) Exc. Total # of averages which exceed the action level ( 1 ppm - TVOC / 150 ug/m3 - PM 10 )
32 Gowanus Canal Superfund Site TB-4 Dredging and Capping Pilot Study Brooklyn, New York Daily Station Report TVOC/PM 10 (TRC Project No ) 10/12/ :00 AM - 10/12/ :00 PM Station 1 (Citizen Property near Construction Trailers) TVOC PM 10 Max. 3 ppb Max. 7 ug/m 3 Avg. <1 ppb Avg. 3 ug/m 3 Exc. 0 total Exc. 0 Total Station 2 (Citizen Property near Pad Area) TVOC PM 10 Max. <1 ppb Max. 11 ug/m 3 Avg. <1 ppb Avg. 5 ug/m 3 Exc. 0 total Exc. 0 Total Station 3 (Whole Foods Property NW Riverwalk Location) TVOC PM 10 Max. 32 ppb Max. 22 ug/m 3 Avg. 17 ppb Avg. 3 ug/m 3 Exc. 0 total Exc. 0 Total Station 4 (Whole Foods Property Central Riverwalk Location) TVOC PM 10 Max. 154 ppb Max. 5 ug/m 3 Avg. 9 ppb Avg. 1 ug/m 3 Exc. 0 total Exc. 0 Total Station 5 (Whole Foods Property near 3rd Avenue Bridge) TVOC PM 10 Max. 45 ppb Max. 11 ug/m 3 Avg. 14 ppb Avg. 5 ug/m 3 Exc. 0 total Exc. 0 Total Station 6 (Maritime Estates Property along Canal Fencing) TVOC PM 10 Max. 47 ppb Max. 14 ug/m 3 Avg. 15 ppb Avg. 7 ug/m 3 Exc. 0 total Exc. 0 Total Station 7 (386 3rd Avenue along Canal Fencing) TVOC PM 10 Max. <1 ppb Max. <1 ug/m 3 Avg. <1 ppb Avg. <1 ug/m 3 Exc. 0 total Exc. 0 Total TVOC Total Volatile Organic Compounds PM 10 Particulates as PM 10 Max. Maximum daily average (15 min. avg. TVOC / 15 min. avg. PM 10 ) Avg. Daily average (15 min. avg. TVOC / 15 min. avg. PM 10 ) Exc. Total # of averages which exceed the action level ( 1 ppm - TVOC / 150 ug/m3 - PM 10 )
33 Figure 1 Gowanus Canal Superfund Site -TB4 Dredging and Capping Pilot Program TVOC Monitoring Data - Week 53 TVOC MAX Station 10/8/ /9/ /10/ /11/ /12/ TVOC Action Level = 1000 ppb (15 Min Avg) ST ST <1 <1 <1 <1 <1 ST ST <1 <1 <1 <1 154 ST <1 <1 45 ST-6 ppb <1 <1 47 ST-7 (v/v) 650 <1 <1 <1 <1 < * (TVOC) Total Violate Organic Compounds /8/ /9/ /10/ /11/ /12/2018 ST-1 ST-2 ST-3 ST-4 ST-5 ST-6 ST-7 TVOC AVG 1000 TVOC Action Level = 1000 ppb (15 Min Avg) Station /8/ /9/ /10/ /11/ /12/ ST <1 700 ST-2 ppb 650 <1 <1 <1 <1 <1 ST (v/v) ST-4 <1 <1 <1 < ST <1 <1 14 ST <1 <1 15 ST <1 <1 <1 <1 < /8/ /9/ /10/ /11/ /12/2018 ST-1 ST-2 ST-3 ST-4 ST-5 ST-6 ST-7
34 Figure 2 Gowanus Canal Superfund Site - TB4 Dredging and Capping Pilot Program TRC CAMP PM 10 Monitoring Data - Week Action Level = 150 ug/m 3 (15 Min Avg) Station /8/ /9/ /10/ /11/ /12/2018 ST ug/m ST ST-3 <1 <1 <1 < ST ST ST ST-7 30 <1 <1 <1 <1 < PM 10 MAX 10/8/ /9/ /10/ /11/ /12/2018 ST-1 ST-2 ST-3 ST-4 ST-5 ST-6 ST-7 PM 10 Avg. 150 Action Level = 150 ug/m 3 (15 Min Avg) Station /8/ /9/ /10/ /11/ /12/ ST ug/m ST ST-3 <1 <1 <1 < ST ST ST ST-7 20 <1 <1 <1 <1 < /8/ /9/ /10/ /11/ /12/2018 ST-1 ST-2 ST-3 ST-4 ST-5 ST-6 ST-7

35 Station Site Description 3 Whole Foods Property NW Riverwalk Location 4 Whole Foods Property Central Riverwalk Location 5 Whole Foods Property near 3rd Avenue Bridge 6 Maritime Estates Property along Canal Fencing rd Avenue along Canal Fencing FIGURE 3 Gowanus Canal Superfund Site-TB4 Dredging and Capping Pilot Program
36 Units Table 1 Week 53 Summary of Additional Periodic (Daily) Monitoring Data October 8 th, 2018 Station Id Time Formaldehyde (CHO) (ppb)* Hydrogen Sulfide (H2S) (ppb)* Ammonia (NH3) (ppm)** ST-1 8:00 <50 <3 <1.0 15:00 <50 <3 <1.0 ST-2 8:10 <50 <3 <1.0 15:05 <50 <3 <1.0 ST-3 8:30 <50 <3 <1.0 15:20 <50 <3 <1.0 ST-4 8:40 <50 <3 <1.0 15:30 <50 <3 <1.0 ST-5 8:50 <50 <3 <1.0 15:40 <50 <3 <1.0 ST-6 9:10 <50 <3 <1.0 16:00 <50 <3 <1.0 ST-7 9:30 <50 <3 <1.0 16:20 <50 <3 <1.0 October 9 th, 2018 Station Id Time Formaldehyde (CHO) (ppb)* Hydrogen Sulfide (H2S) (ppb)* Ammonia (NH3) (ppm)** ST-1 7:30 <50 <3 <1.0 13:45 <50 <3 <1.0 ST-2 7:50 <50 <3 <1.0 13:50 <50 <3 <1.0 ST-3 8:10 <50 <3 <1.0 14:00 <50 <3 <1.0 ST-4 8:20 <50 <3 <1.0 14:10 <50 <3 <1.0 ST-5 8:40 <50 <3 <1.0 14:20 <50 <3 <1.0 ST-6 9:00 <50 <3 <1.0 14:40 <50 <3 <1.0 ST-7 9:20 <50 <3 <1.0 14:55 <50 <3 <1.0
37 Units Table 1 Week 53 Summary of Additional Periodic (Daily) Monitoring Data October 10th, 2018 Station Id Time Formaldehyde (CHO) (ppb)* Hydrogen Sulfide (H2S) (ppb)* Ammonia (NH3) (ppm)** ST-1 9:00 <50 <3 <1.0 16:00 <50 <3 <1.0 ST-2 9:05 <50 <3 <1.0 16:05 <50 <3 <1.0 ST-3 9:15 <50 <3 <1.0 16:15 <50 <3 <1.0 ST-4 9:20 <50 <3 <1.0 16:20 <50 <3 <1.0 ST-5 9:25 <50 <3 <1.0 16:25 <50 <3 <1.0 ST-6 0:00 <50 <3 <1.0 16:40 <50 <3 <1.0 ST-7 10:00 <50 <3 <1.0 16:55 <50 <3 <1.0 October 11 th, 2018 Station Id Time Formaldehyde (CHO) (ppb)* Hydrogen Sulfide (H2S) (ppb)* Ammonia (NH3) (ppm)** ST-1 8:00 <50 <3 <1.0 17:00 <50 <3 <1.0 ST-2 8:10 <50 <3 <1.0 17:10 <50 <3 <1.0 ST-3 8:25 <50 <3 <1.0 17:30 <50 <3 <1.0 ST-4 8:35 <50 <3 <1.0 17:40 <50 <3 <1.0 ST-5 8:40 <50 <3 <1.0 17:50 <50 <3 <1.0 ST-6 9:00 <50 <3 <1.0 18:10 <50 <3 <1.0 ST-7 9:15 <50 <3 <1.0 18:30 <50 <3 <1.0
38 Units Table 1 Week 53 Summary of Additional Periodic (Daily) Monitoring Data October 12 th, 2018 Station Id Time Formaldehyde (CHO) (ppb)* Hydrogen Sulfide (H2S) (ppb)* Ammonia (NH3) (ppm)** ST-1 7:30 <50 <3 <1.0 17:30 <50 <3 <1.0 ST-2 7:35 <50 <3 <1.0 17:35 <50 <3 <1.0 ST-3 8:00 <50 <3 <1.0 17:50 <50 <3 <1.0 ST-4 8:10 <50 <3 <1.0 18:00 <50 <3 <1.0 ST-5 8:20 <50 <3 <1.0 18:10 <50 <3 <1.0 ST-6 8:40 <50 <3 <1.0 18:25 <50 <3 <1.0 ST-7 9:00 <50 <3 <1.0 18:35 <50 <3 <1.0 *(ppb) Indicates results reported in parts per billion * (ppm) Indicates results reported in parts per million
39 Table 2: Gowanus Canal Superfund Site TB4 Dredging and Capping Pilot Program Week 49 VOCs Results: September 12th through 13th (Co located) Sample ID Laboratory ID Date Sampled Location ST 6A VOC I /12/18 14:00 9/13/18 13:00 Station 6 ST 6B VOC I /12/18 14:00 9/13/18 13:00 Station 6 Duplicate Relative Percent Difference Station 6 Pair VOCs TO 15 ppbv ug/m3 ppbv ug/m3 Acetone J J 87.2% Benzene % Benzyl chloride <0.035 <0.18 <0.035 <0.18 NC Bromodichloromethane <0.035 <0.24 <0.035 <0.24 NC Bromoform <0.035 <0.36 <0.035 <0.36 NC Bromomethane <0.035 <0.27 J <0.035 <0.27 J NC 1,3 Butadiene <0.035 <0.078 <0.035 <0.078 NC 2 Butanone (MEK) <1.4 <4.1 NC Carbon Disulfide <0.35 <1.1 <0.35 <1.1 NC Carbon Tetrachloride % Chlorobenzene <0.035 <0.16 <0.035 <0.16 NC Chloroethane <0.035 <0.093 <0.035 <0.093 NC Chloroform <0.035 <0.17 <0.035 <0.17 NC Chloromethane % Cyclohexane <0.035 <0.24 <0.035 <0.24 NC Dibromochloromethane <0.035 <0.30 <0.035 <0.30 NC 1,2 Dibromoethane (EDB) <0.035 <0.27 <0.035 <0.27 NC 1,2 Dichlorobenzene <0.035 <0.21 <0.035 <0.21 NC 1,3 Dichlorobenzene <0.035 <0.21 <0.035 <0.21 NC 1,4 Dichlorobenzene <0.035 <0.21 <0.035 <0.21 NC Dichlorodifluoromethane (Freon 12) J J 8.0% 1,1 Dichloroethane <0.035 <0.14 <0.035 <0.14 NC 1,2 Dichloroethane <0.035 <0.14 <0.035 <0.14 NC 1,1 Dichloroethylene <0.035 <0.15 <0.035 <0.15 NC cis 1,2 Dichloroethylene <0.035 <0.16 <0.035 <0.16 NC trans 1,2 Dichloroethylene <0.035 <0.17 <0.035 <0.17 NC 1,2 Dichloropropane <0.035 <0.16 <0.035 <0.16 NC cis 1,3 Dichloropropene <0.035 <0.16 <0.035 <0.16 NC trans 1,3 Dichloropropene <0.035 <0.16 <0.035 <0.16 NC 1,2 Dichloro 1,1,2,2 tetrafluoroethane (Freon 114) <0.035 <0.25 J <0.035 <0.25 J NC 1,4 Dioxane <0.35 <1.3 <0.35 <1.3 NC Ethanol J J 17.8% Ethyl Acetate % Ethylbenzene % 4 Ethyltoluene <0.035 <0.17 <0.035 <0.17 NC Heptane J J+ 49.2% Hexachlorobutadiene <0.035 <0.37 <0.035 <0.37 NC Hexane <1.4 <4.9 <1.4 <4.9 NC 2 Hexanone (MBK) <0.035 <0.14 NC Isopropanol <1.4 <3.4 <1.4 <3.4 NC Methyl tert Butyl Ether (MTBE) <0.035 <0.13 <0.035 <0.13 NC Methylene Chloride <0.35 <1.2 <0.35 <1.2 NC 4 Methyl 2 pentanone (MIBK) J+ <0.035 <0.14 NC Naphthalene J J 60.9% Propene <1.4 <2.4 NC Styrene <0.035 <0.15 <0.035 <0.15 NC 1,1,2,2 Tetrachloroethane <0.035 <0.24 <0.035 <0.24 NC Tetrachloroethylene % Tetrahydrofuran <0.035 <0.21 <0.035 <0.21 NC Toluene % 1,2,4 Trichlorobenzene <0.035 <0.26 J <0.035 <0.26 J NC 1,1,1 Trichloroethane <0.035 <0.19 <0.035 <0.19 NC 1,1,2 Trichloroethane <0.035 <0.19 <0.035 <0.19 NC Trichloroethylene <0.035 <0.19 <0.035 <0.19 NC Trichlorofluoromethane (Freon 11) % 1,1,2 Trichloro 1,2,2 trifluoroethane (Freon 113) <0.14 <1.1 <0.14 <1.1 NC 1,2,4 Trimethylbenzene <0.035 <0.17 NC 1,3,5 Trimethylbenzene <0.035 <0.17 <0.035 <0.17 NC Vinyl Acetate <0.70 <2.5 NC Vinyl Chloride <0.035 <0.090 <0.035 <0.090 NC m&p Xylene % o Xylene % Notes: Values in bold indicate detected concentrations J : The results reported for 1,2,4 trichlorobenzene, naphthalene, 1,2 dichloro 1,1,2,2 tetrafluoroethane (Freon 114), bromomethane, dichlorodifluoromethane (Freon 12), and ethanol are estimated values and may be biased low. J+: The results reported for heptane and 4 methyl 2 pentanone (MIBK) are estimated values and may be biased high. J: The results reported for acetone are qualified as estimated values due to the RPD between collocated samples. Results for the following compounds may be influenced by laboratory derived contamination: acetone, ethanol, methylene chloride and isopropanol Relative Percent Difference (RPD) calculated using the following equation: RPD = X1 X2 /[(X1+X2)/2] where: X1 = original sample, X2 = duplicate sample NC: RPD not calcuable due to a non detect result in one or both co located sample
40 Table 3: Gowanus Canal Superfund Site TB4 Dredging and Capping Pilot Program Week 50 VOCs Results: September 18th through 19th and September 20th through 21st Sample ID Laboratory ID Date Sampled Location ST 7 VOC I /18/18 11:00 9/19/18 10:00 Station 7 ST 1 VOC I /20/18 09:00 9/21/18 08:00 Station 1 VOCs TO 15 ppbv ug/m3 ppbv ug/m3 Acetone Benzene Benzyl chloride <0.035 <0.18 <0.035 <0.18 Bromodichloromethane <0.035 <0.24 <0.035 <0.24 Bromoform <0.035 <0.36 <0.035 <0.36 Bromomethane <0.035 <0.14 <0.035 <0.14 1,3 Butadiene <0.035 <0.078 <0.035 < Butanone (MEK) <1.4 <4.1 <1.4 <4.1 Carbon Disulfide <0.35 <1.1 <0.35 <1.1 Carbon Tetrachloride Chlorobenzene <0.035 <0.16 <0.035 <0.16 Chloroethane <0.035 <0.093 <0.035 <0.093 Chloroform <0.035 <0.17 <0.035 <0.17 Chloromethane Cyclohexane <0.035 <0.12 <0.035 <0.12 Dibromochloromethane <0.035 <0.30 <0.035 <0.30 1,2 Dibromoethane (EDB) <0.035 <0.27 <0.035 <0.27 1,2 Dichlorobenzene <0.035 <0.21 <0.035 <0.21 1,3 Dichlorobenzene <0.035 <0.21 <0.035 <0.21 1,4 Dichlorobenzene <0.035 <0.21 <0.035 <0.21 Dichlorodifluoromethane (Freon 12) ,1 Dichloroethane <0.035 <0.14 <0.035 <0.14 1,2 Dichloroethane <0.035 <0.14 <0.035 <0.14 1,1 Dichloroethylene <0.035 <0.14 <0.035 <0.14 cis 1,2 Dichloroethylene <0.035 <0.14 <0.035 <0.14 trans 1,2 Dichloroethylene <0.035 <0.14 <0.035 <0.14 1,2 Dichloropropane <0.035 <0.16 <0.035 <0.16 cis 1,3 Dichloropropene <0.035 <0.16 <0.035 <0.16 trans 1,3 Dichloropropene <0.035 <0.16 <0.035 <0.16 1,2 Dichloro 1,1,2,2 tetrafluoroethane (Freon 114) <0.035 <0.25 <0.035 <0.25 1,4 Dioxane <0.35 <1.3 <0.35 <1.3 Ethanol Ethyl Acetate <0.035 <0.13 <0.035 <0.13 Ethylbenzene <0.035 <0.15 <0.035 < Ethyltoluene <0.035 <0.17 <0.035 <0.17 Heptane Hexachlorobutadiene <0.035 <0.37 <0.035 <0.37 Hexane <1.4 <4.9 <1.4 <4.9 2 Hexanone (MBK) <0.035 <0.14 <0.035 <0.14 Isopropanol <1.4 <3.4 <1.4 <3.4 Methyl tert Butyl Ether (MTBE) <0.035 <0.13 <0.035 <0.13 Methylene Chloride <0.35 <1.2 <0.35 <1.2 4 Methyl 2 pentanone (MIBK) <0.035 <0.14 <0.035 <0.14 Naphthalene <0.035 < Propene <1.4 <2.4 <1.4 <2.4 Styrene <0.035 <0.15 <0.035 <0.15 1,1,2,2 Tetrachloroethane <0.035 <0.24 <0.035 <0.24 Tetrachloroethylene <0.035 < Tetrahydrofuran <0.035 <0.10 <0.035 <0.10 Toluene ,2,4 Trichlorobenzene <0.035 <0.26 <0.035 <0.26 1,1,1 Trichloroethane <0.035 <0.19 <0.035 <0.19 1,1,2 Trichloroethane <0.035 <0.19 <0.035 <0.19 Trichloroethylene <0.035 <0.19 <0.035 <0.19 Trichlorofluoromethane (Freon 11) ,1,2 Trichloro 1,2,2 trifluoroethane (Freon 113) <0.14 <1.1 <0.14 <1.1 1,2,4 Trimethylbenzene ,3,5 Trimethylbenzene <0.035 <0.17 <0.035 <0.17 Vinyl Acetate <0.70 <2.5 <0.70 <2.5 Vinyl Chloride <0.035 <0.090 <0.035 <0.090 m&p Xylene o Xylene Notes: Values in bold indicate detected concentrations Results for the following compounds may be influenced by laboratory derived contamination: acetone, ethanol, methylene chloride and isopropanol
41 Table 4: Gowanus Canal Superfund Site TB4 Dredging and Capping Pilot Program Week 51 VOCs Results: September 24th through 25th and September 25th through 26th Sample ID Laboratory ID Date Sampled Location ST 2 VOC I /24/18 06:00 9/25/18 05:00 Station 2 ST 3 VOC I /25/18 10:00 9/26/18 09:00 Station 3 VOCs TO 15 ppbv ug/m3 ppbv ug/m3 Acetone Benzene Benzyl chloride <0.035 <0.18 <0.035 <0.18 Bromodichloromethane <0.035 <0.24 <0.035 <0.24 Bromoform <0.035 <0.36 <0.035 <0.36 Bromomethane <0.035 <0.14 <0.035 <0.14 1,3 Butadiene <0.035 <0.078 <0.035 < Butanone (MEK) <1.4 <4.1 <1.4 <4.1 Carbon Disulfide <0.35 <1.1 <0.35 <1.1 Carbon Tetrachloride Chlorobenzene <0.035 <0.16 <0.035 <0.16 Chloroethane <0.035 <0.093 <0.035 <0.093 Chloroform <0.035 <0.17 <0.035 <0.17 Chloromethane Cyclohexane <0.035 <0.12 <0.035 <0.12 Dibromochloromethane <0.035 <0.30 <0.035 <0.30 1,2 Dibromoethane (EDB) <0.035 <0.27 <0.035 <0.27 1,2 Dichlorobenzene <0.035 <0.21 <0.035 <0.21 1,3 Dichlorobenzene <0.035 <0.21 <0.035 <0.21 1,4 Dichlorobenzene <0.035 <0.21 <0.035 <0.21 Dichlorodifluoromethane (Freon 12) ,1 Dichloroethane <0.035 <0.14 <0.035 <0.14 1,2 Dichloroethane <0.035 <0.14 <0.035 <0.14 1,1 Dichloroethylene <0.035 <0.14 <0.035 <0.14 cis 1,2 Dichloroethylene <0.035 <0.14 <0.035 <0.14 trans 1,2 Dichloroethylene <0.035 <0.14 <0.035 <0.14 1,2 Dichloropropane <0.035 <0.16 <0.035 <0.16 cis 1,3 Dichloropropene <0.035 <0.16 <0.035 <0.16 trans 1,3 Dichloropropene <0.035 <0.16 <0.035 <0.16 1,2 Dichloro 1,1,2,2 tetrafluoroethane (Freon 114) <0.035 <0.25 <0.035 <0.25 1,4 Dioxane <0.35 <1.3 <0.35 <1.3 Ethanol Ethyl Acetate <0.035 <0.13 Ethylbenzene Ethyltoluene <0.035 <0.17 <0.035 <0.17 Heptane Hexachlorobutadiene <0.035 <0.37 <0.035 <0.37 Hexane <1.4 <4.9 <1.4 <4.9 2 Hexanone (MBK) <0.035 <0.14 <0.035 <0.14 Isopropanol <1.4 <3.4 <1.4 <3.4 Methyl tert Butyl Ether (MTBE) <0.035 <0.13 <0.035 <0.13 Methylene Chloride <0.35 <1.2 <0.35 <1.2 4 Methyl 2 pentanone (MIBK) <0.035 <0.14 <0.035 <0.14 Naphthalene Propene <1.4 <2.4 <1.4 <2.4 Styrene <0.035 <0.15 <0.035 <0.15 1,1,2,2 Tetrachloroethane <0.035 <0.24 <0.035 <0.24 Tetrachloroethylene Tetrahydrofuran <0.035 <0.10 <0.035 <0.10 Toluene ,2,4 Trichlorobenzene <0.035 <0.26 <0.035 <0.26 1,1,1 Trichloroethane <0.035 <0.19 <0.035 <0.19 1,1,2 Trichloroethane <0.035 <0.19 <0.035 <0.19 Trichloroethylene <0.035 <0.19 <0.035 <0.19 Trichlorofluoromethane (Freon 11) ,1,2 Trichloro 1,2,2 trifluoroethane (Freon 113) <0.14 <1.1 <0.14 <1.1 1,2,4 Trimethylbenzene ,3,5 Trimethylbenzene <0.035 <0.17 <0.035 <0.17 Vinyl Acetate <0.70 <2.5 <0.70 <2.5 Vinyl Chloride <0.035 <0.090 <0.035 <0.090 m&p Xylene o Xylene Notes: Values in bold indicate detected concentrations Results for the following compounds may be influenced by laboratory derived contamination: acetone, ethanol, methylene chloride and isopropanol
 Temperature ( o F) S 3.17 69.0 October 9 th, 2018 ** Wind Direction ( o ) Wind Speed (mph) Temperature ( o F) SSE 2.15 71.")
42 Gowanus Canal Superfund Site TB-4 Dredging and Capping Pilot Study Brooklyn, New York Meteorological Summary October 8 th through October 12 th, 2018 October 8 th, 2018 * Wind Direction ( o ) Wind Speed (mph) Temperature ( o F) S October 9 th, 2018 ** Wind Direction ( o ) Wind Speed (mph) Temperature ( o F) SSE October 10 th, 2018 ** Wind Direction ( o ) Wind Speed (mph) Temperature ( o F) SE October 11 th, 2018 ** Wind Direction ( o ) Wind Speed (mph) Temperature ( o F) SE October 12 th, 2018 *** Wind Direction ( o ) Wind Speed (mph) Temperature ( o F) WSW * Monday s meteorological data represents an average for the time period of 06:30 to 23:45. ** Tuesday s, Wednesday s, and Thursday s meteorological data represents averages for the time period of 00:00 to 23:45. *** Friday s meteorological data represents an average for the time period of 00:00 to 19:00.
43 WILSON IHRIG WEEKLY NOISE AND VIBRATION MONITORING REPORT


44 WI # MEMORANDUM October 15, 2018 To: William Lee/ de maximis, inc. Kirsten Meyers / TRC From: Silas Bensing, Ani Toncheva / Wilson Ihrig Subject: Gowanus Canal 4th Street Turning Basin Dredging and Capping Pilot Study, Weekly Noise Monitoring Report, 8 October 12 October, 2018 Noise Monitoring Locations Figure 1 shows the noise monitoring locations. NM-1 is installed at a light pole on the north side of TB4 and is approximately 25 feet from the north edge of the canal. NM-2 is installed at the existing guard rail on the south side of TB4, approximately 4 feet from the south edge of the canal. Photos 1 and 2 show the recent field conditions at the monitors. Noise Monitoring Results Figures 2 through 11 present the hourly Leq noise levels compared with the noise thresholds discussed in the noise monitoring plan 1. Commercial and Industrial land uses are assigned an hourly Leq noise limit of 80 dba for Daytime and Evening time periods. The average baseline noise measured in the project area in 2015 are also shown for reference 2. 1 Wilson Ihrig. Gowanus Canal 4 th Street Turning Basin Dredging and Capping Pilot Study Noise and Vibration Monitoring Plan. California: prepared for Gowanus Canal Remedial Design Group, DRAFT May Wilson Ihrig. Gowanus Canal Remedial Design Project RTA-1 Noise and Vibration Baseline Report. California: prepared for Geosyntec Consultants Inc., October 2015.


45 Gowanus Canal TB4 Pilot Study Phase 2 Weekly Monitoring Report Figure 1: Long-term Noise and Vibration Monitoring Locations for Gowanus TB4 Dredging and Capping Pilot Study Photo 1: Noise Monitoring Location NM-1 (26 September 2017) Photo 2: Noise Monitoring Location NM-2 (25 September 2017) 2

46 Gowanus Canal TB4 Pilot Study Phase 2 Weekly Monitoring Report Figure 2: North Monitor NM-1 on Monday Figure 3: North Monitor NM-1 on Tuesday 3
47 Gowanus Canal TB4 Pilot Study Phase 2 Weekly Monitoring Report Figure 4: North Monitor NM-1 on Wednesday Figure 5: North Monitor NM-1 on Thursday 4
48 Gowanus Canal TB4 Pilot Study Phase 2 Weekly Monitoring Report Figure 6: North Monitor NM-1 on Friday Figure 7: South Monitor NM-2 on Monday 5
49 Gowanus Canal TB4 Pilot Study Phase 2 Weekly Monitoring Report Figure 8: South Monitor NM-2 on Tuesday Figure 9: South Monitor NM-2 on Wednesday 6
50 Gowanus Canal TB4 Pilot Study Phase 2 Weekly Monitoring Report Figure 10: South Monitor NM-2 on Thursday Figure 11: South Monitor NM-2 on Friday Wilson Ihrig Weekly Noise and Vibration Report 8 October - 12 October 2018.docx 7
51 AHRS WEEKLY REPORT
 of debris received from Citizen Site. The debris to be inspected was scattered onto the cement pad.")
52 Gowanus Project Clean Earth October 10, 2018 Arrived at Clean Earth at 9:00 am. Site activity included the inspection of final barge (Ld# 29 Weeks 80 - Oversize Debris) of debris received from Citizen Site. The debris to be inspected was scattered onto the cement pad. Among the debris there mainly tires. Two of the tires were used as bumpers on bulkheads or boats. Nothing was retained. Finish with debris inspection at 11:00 am. Photo 1: Showing many tires and chunks of concrete

53 Photo 2: Showing many tires and chunks of concrete

54 Photo 3: Close up of tire once used as a bulkhead or boat bumper

55 Photo 4: Showing many tires and chunks of concrete

56 Photo 5: Showing many tires and chunks of concrete

57 Cupples Tire Ad "Tough As a Rhino" (1926)
58 WATER TREATMENT SYSTEM MONITORING LABORATORY ANALYTICAL DATA (MAY THROUGH AUGUST 2018 SAMPLING RESULTS)
59 Effluent Monitoring Results 4th Street Turning Basin Pilot Study Dredge Water Treatment System PERMIT EQUIVALENCY DISCHARGE MONITORING RESULTS Analytical Results Analyte 5/24/18 Result Qualifier Discharge Limit Units ph Monitor s.u. Ammonia 14 Monitor mg/l Biological Oxygen Demand 6.4 J 20 mg/l Dissolved oxygen Monitor mg/l Oil and grease 1.4 J 15 mg/l Total suspended solids mg/l Copper ND U 79 ug/l Lead ND U 200 ug/l Benzo(a)pyrene ND U ug/l Aroclor 1016 ND U ug/l Aroclor 1221 ND U ug/l Aroclor 1232 ND U ug/l Aroclor 1242 ND U ug/l Aroclor 1248 ND U ug/l Aroclor 1254 ND U ug/l Aroclor 1260 ND U ug/l Notes: ug/l = micrograms per liter mg/l = milligrams per liter ND = not detected s.u. = standard units J-qualifier indicates the analyte was posively identified; the associated numerical value is the approximate concentration of the analyte in the sample. U-qualifier indicates the analyte was analyzed for, but was not detected above the reported sample quantitation limit. 4th Street Turning Basin Pilot Study Dredge Water Treatment System Gowanus Canal Superfund Site 1 of 1 July 2018
60 Effluent Monitoring Results 4th Street Turning Basin Pilot Study Dredge Water Treatment System PERMIT EQUIVALENCY DISCHARGE MONITORING RESULTS - WEEKLY Analytical Results Analyte 5/31/18 Result Qualifier Discharge Limit Units ph Monitor s.u. Biological Oxygen Demand 14 J 20 mg/l Dissolved oxygen Monitor mg/l Oil and grease ND U 15 mg/l Total suspended solids mg/l Copper ND U 79 ug/l Lead ND U 200 ug/l Benzo(a)pyrene ND U ug/l Aroclor 1016 ND U ug/l Aroclor 1221 ND U ug/l Aroclor 1232 ND U ug/l Aroclor 1242 ND U ug/l Aroclor 1248 ND U ug/l Aroclor 1254 ND U ug/l Aroclor 1260 ND U ug/l Notes: ug/l = micrograms per liter mg/l = milligrams per liter ND = not detected s.u. = standard units J-qualifier indicates the analyte was posively identified; the associated numerical value is the approximate concentration of the analyte in the sample. U-qualifier indicates the analyte was analyzed for, but was not detected above the reported sample quantitation limit. 4th Street Turning Basin Pilot Study Dredge Water Treatment System Gowanus Canal Superfund Site 1 of 1 July 2018
61 Effluent Monitoring Results 4th Street Turning Basin Pilot Study Dredge Water Treatment System PERMIT EQUIVALENCY DISCHARGE MONITORING RESULTS Analytical Results Analyte 6/14/18 Result Qualifier Discharge Limit Units ph Monitor s.u. Ammonia 13 B Monitor mg/l Biological Oxygen Demand mg/l Dissolved oxygen Monitor mg/l Oil and grease ND U 15 mg/l Total suspended solids mg/l Copper ND U 79 ug/l Lead ND U 200 ug/l Benzo(a)pyrene ND U ug/l Aroclor 1016 ND U ug/l Aroclor 1221 ND U ug/l Aroclor 1232 ND U ug/l Aroclor 1242 ND U ug/l Aroclor 1248 ND U ug/l Aroclor 1254 ND U ug/l Aroclor 1260 ND U ug/l Notes: ug/l = micrograms per liter mg/l = milligrams per liter ND = not detected s.u. = standard units U-qualifier indicates the analyte was analyzed for, but was not detected above the reported sample quantitation limit. B-qualifier indicates the analyte was found in the blank and the sample 4th Street Turning Basin Pilot Study Dredge Water Treatment System Gowanus Canal Superfund Site 1 of 1 July 2018
WEEKLY PROGRESS REPORT TRC SOLUTIONS. Gowanus Canal Turning Basin 4 Dredging and Capping Pilot Study Brooklyn, New York. Project number:
 WEEKLY PROGRESS REPORT TRC SOLUTIONS Gowanus Canal Turning Basin 4 Dredging and Capping Pilot Study Brooklyn, New York Project number: 283126 Period: November 13 to 16, 2018 Date of Report: November 26,
WEEKLY PROGRESS REPORT TRC SOLUTIONS. Gowanus Canal Turning Basin 4 Dredging and Capping Pilot Study Brooklyn, New York. Project number:
 WEEKLY PROGRESS REPORT TRC SOLUTIONS Gowanus Canal Turning Basin 4 Dredging and Capping Pilot Study Brooklyn, New York Project number: 283126 Period: November 26 to 30, 2018 Date of Report: December 5,
WEEKLY PROGRESS REPORT TRC SOLUTIONS. Gowanus Canal Turning Basin 4 Dredging and Capping Pilot Study Brooklyn, New York. Project number:
 WEEKLY PROGRESS REPORT TRC SOLUTIONS Gowanus Canal Turning Basin 4 Dredging and Capping Pilot Study Brooklyn, New York Project number: 283126 Period: December 3 to 7, 2018 Date of Report: December 21,
WEEKLY PROGRESS REPORT TRC SOLUTIONS. Gowanus Canal Turning Basin 4 Dredging and Capping Pilot Study Brooklyn, New York. Project number:
 WEEKLY PROGRESS REPORT TRC SOLUTIONS Gowanus Canal Turning Basin 4 Dredging and Capping Pilot Study Brooklyn, New York Project number: 283126 Period: December 10 to 14, 2018 Date of Report: December 21,
OREGON Environmental Laboratory Accreditation Program ORELAP Fields of Accreditation
 MATRIX Reference Code Analyte Code Description STAT Analysis Corporation 40 CFR Part 50 Appendix J Environmental Laboratory Program 3950 Particulates
OREGON Environmental Laboratory Accreditation Program ORELAP Fields of Accreditation RJ Lee Group, Inc./Columbia Basin Analytical Laboratories
 MATRIX Reference Code Analyte Code Description Air EPA TO-11A 10311805 Determination of Formaldehyde in Ambient Air Using Adsorbent Cartridge Followed by High Performance Liquid Chromatography (HPLC) 6110
Collegeville Area Air Monitoring Project Second Report. March 7, Commonwealth of Pennsylvania Department of Environmental Protection
 Second Report Commonwealth of Pennsylvania Department of Environmental Protection Edward G. Rendell, Governor Commonwealth of Pennsylvania Kathleen A. McGinty, Secretary Department of Environmental Protection
SCOPE OF ACCREDITATION TO ISO/IEC 17025:2005
 SCOPE OF ACCREDITATION TO ISO/IEC 17025:2005 ENVIRONMENTAL CONSERVATION LABORATORIES JACKSONVILLE 4810 Executive Park Court, Suite 111 Jacksonville, FL 32216 Lori S. Mangrum Phone: 904 296 3007 Email address:
Pottstown Area Air Monitoring Final Report. January 19, Commonwealth of Pennsylvania Department of Environmental Protection
 Pottstown Area Air Monitoring Final Report Commonwealth of Pennsylvania Department of Environmental Protection Edward G. Rendell, Governor Commonwealth of Pennsylvania Kathleen A. McGinty, Secretary Department
Certificate of Accreditation
 PERRY JOHNSON LABORATORY ACCREDITATION, INC. Certificate of Accreditation Perry Johnson Laboratory Accreditation, Inc. has assessed the Laboratory of: (Hereinafter called the Organization) and hereby declares
CERTIFICATE OF ACCREDITATION
 CERTIFICATE OF ACCREDITATION ANSI-ASQ National Accreditation Board 500 Montgomery Street, Suite 625, Alexandria, VA 22314, 877-344-3044 This is to certify that Environmental Conservation Laboratories -
Collegeville Area Air Monitoring Project Third Report. November 17, Commonwealth of Pennsylvania Department of Environmental Protection
 Third Report Commonwealth of Pennsylvania Department of Environmental Protection Edward G. Rendell, Governor Commonwealth of Pennsylvania John Hanger, Secretary Department of Environmental Protection Prepared
TSB-1 TSB-3 TSB-2. Legend. Approximate Site Limits. Soil Boring Location. Feet. Figure 2 Boring Location Map
 TSB-1 TSB-3 TSB-2 Legend 0 150 300 450 600 Feet East of Calhoun Road & South of Griggs Road Houston, Harris County, Texas TGE Project No.: R10114.01 6120 West by Northwest Blvd. Suite 100 Houston, Texas
DIVISION OF WASTE MANAGEMENT RESIDENTIAL VAPOR INTRUSION SCREENING CONCENTRATIONS (March, 2016)
") Note: The Residential screening level below or site specific screening concentrations (utilizing site specific attenuation and exposure factors) can be used. In either case the site s remedy must include
Note: The Residential screening level below or site specific screening concentrations (utilizing site specific attenuation and exposure factors) can be used. In either case the site s remedy must include
State of Nevada Department of Conservation and Natural Resources Division of Environmental Protection Laboratory Scope of Accreditation
 Matrix: CWA (Non Potable Water) Discipline Chemistry EPA 1664A (SGT-HEM) n-hexane Extractable Material - Silica Gel Treated (HEM-SGT) 8/21/2015 Aluminum 8/21/2015 Arsenic 8/21/2015 Barium 8/21/2015 Beryllium
Clean Harbors (Sarnia) Air Monitoring Plan and Sampling Results
 Air Monitoring Plan and Sampling Results") Clean Harbors (Sarnia) Air Monitoring Plan and Sampling Results Southwestern Region - Technical Support Section Updated October 21, 2011 Executive Summary The ministry is conducting air sampling in the
Clean Harbors (Sarnia) Air Monitoring Plan and Sampling Results Southwestern Region - Technical Support Section Updated October 21, 2011 Executive Summary The ministry is conducting air sampling in the
North Minneapolis Air Monitoring Study: 2015 Data Summary
 North Minneapolis Air Monitoring Study: 2015 Data Summary March 2016 Authors Cassie McMahon The MPCA is reducing printing and mailing costs by using the Internet to distribute reports and information to
Ground Water Screening Level (GWSL) 1,2 ug/l TCR = 1.0E-05/HQ =0.2. Sub-slab and Exterior Soil Gas Screening Level (SGSL) 1,2.
 1,2 ug/l TCR = 1.0E-05/HQ =0.2. Sub-slab and Exterior Soil Gas Screening Level (SGSL) 1,2.") Note: The non-residential screening level below or site specific screening concentrations (utilizing site specific attenuation and exposure factors) can be used. In either case the site s remedy must include
Note: The non-residential screening level below or site specific screening concentrations (utilizing site specific attenuation and exposure factors) can be used. In either case the site s remedy must include
SCOPE OF ACCREDITATION TO ISO/IEC 17025:2005
 SCOPE OF ACCREDITATION TO ISO/IEC 17025:2005 Pace Analytical Services, LLC. 150 N 9 th Street Billings, MT 59101 Emily Agola Phone: (616) 656-2257 Emily.Agola@pacelabs.com ENVIRONMENTAL Valid To: May 31,
Anatek Labs, Inc - Spokane Spokane, WA
 Anatek Labs, Inc - Spokane Spokane, WA has complied with provisions set forth in Chapter 173-50 WAC and is hereby recognized by the Department of Ecology as an ACCREDITED LABORATORY for the analytical
North Minneapolis Air Monitoring Study: 2017 Data Summary
 Air Monitoring January 2019 North Minneapolis Air Monitoring Study: 2017 Data Summary Authors Derek Nagel Cassie McMahon Contributors/acknowledgements Luke Charpentier Kurt Anderson The MPCA is reducing
Texas Commission on Environmental Quality
 These fields of accreditation supercede all previous fields. The urges customers to Matrix: Air & Emissions Method 40 CFR Part 50 Appendix B Total Suspended Particulate TX 3973 10000304 Method 40 CFR Part
Date Issued: July 01, 2017 Expiration Date: June 30, 2018
 State of Florida Department of Health, Bureau of Public Health Laboratories This is to certify that MAXXAM ANALYTICS - MICHIGAN 22345 ROETHEL DRIVE NOVI, MI 48375 has complied with Florida Administrative
Autumnwood Investigation The Community s Perspective
 Autumnwood Investigation The Community s Perspective Concerned Neighbors of Wildomar Center for Community Action and Environmental Justice (CCAEJ) September 19, 2014 Penny J. Newman Floyd Villanueva Xonia
BACKGROUND LEVELS OF VOLATILE ORGANIC CHEMICALS IN HOMES: A REVIEW OF RECENT LITERATURE
 BACKGROUND LEVELS OF VOLATILE ORGANIC CHEMICALS IN HOMES: A REVIEW OF RECENT LITERATURE Introduction For over 20 years, it has been known that many volatile organic chemicals are present in the indoor
North Minneapolis Air Monitoring: 2016 Data Summary
 Air Monitoring November 2017 North Minneapolis Air Monitoring: 2016 Data Summary Author Cassie McMahon The MPCA is reducing printing and mailing costs by using the Internet to distribute reports and information
SCOTT Method TO-14A/15/17
 SCOTT Method TO-14A/15/17 Calibration Standards Benefits and Features SCOTT technical expertise in engineering Method 14A/15/17, HAPS and TIC calibration standards, sulfur mixes and vapor intrusion products
Pottstown Area Air Monitoring. May 12, Commonwealth of Pennsylvania Department of Environmental Protection
 Pottstown Area Air Monitoring Commonwealth of Pennsylvania Department of Environmental Protection Edward G. Rendell, Governor Commonwealth of Pennsylvania Kathleen A. McGinty, Secretary Department of Environmental
INDOOR AIR QUALITY TESTING IN JONES MIDDLE SCHOOL, 2100 ARLINGTON AVENUE, UPPER ARLINGTON, OHIO
 IOOR AIR QUALITY TESTING IN JONES MIDDLE SCHOOL, 200 ARLINGTON AVENUE, UPPER ARLINGTON, OHIO Prepared for Mr. Chris Potts UPPER ARLINGTON SCHOOLS 950 North Mallway Drive Upper Arlington, Ohio 4322 Prepared
Lambton Facility Update
 Lambton Facility Update Friday, October 28, 2011 On-site Control Measure Update Over the past week, company personnel noticed a slight increase in on-site odours and in order to minimize off-site odours
US EPA Method 8260 With the Tekmar Lumin and the Agilent 7890B GC/5977A MS
 Application Note US EPA Method 8260 With the Tekmar Lumin and the Agilent 7890B GC/5977A MS Author Roger Bardsley Applications Chemist, Teledyne Tekmar Abstract US EPA Method 8260 is used primarily by
MEMORANDUM. To: Billy Meyer. Christie Zawtocki, PE Kitty Hiortdahl, EI. Date: March 12, 2015
 MEMORANDUM To: Billy Meyer From: Christie Zawtocki, PE Kitty Hiortdahl, EI Date: March 12, 2015 Project: One Hour Martinizing Site, DSCA ID 32-0013 1103 W Club Blvd, Durham, NC Subject: Project Update
2012 Air Toxics Summary
 2012 Air Toxics Summary New Jersey Department of Environmental Protection INTRODUCTION Air pollutants can be divided into two categories: the criteria pollutants (ozone, sulfur dioxide, carbon monoxide,
Appendix A Analytical Methods for Air Sampling
 Analytical s Air Sampling Acenaphthene TO-13A PUF / XAD 10 0.4 Acenaphthylene TO-13A PUF / XAD 10 0.35 Acetaldehyde Acetone TO-15 Can or Bag 1.9 0.47 Acetonitrile TO-15 Can or Bag 1.7 0.12 Acetophenone
Urban Air Toxics Concentrations In Denver. May 2002 through April 2003
 Urban Air Toxics Concentrations In Denver May 2002 through April 2003 October 2006 Prepared by the Colorado Department of Public Health & Environment Air Pollution Control Division (Technical Services
1.2 Performance Objective 2 Decreasing Concentration Trends in Downgradient Wells
 . DEMONSTRATION OF COMPLIANCE The % Design Report for the Temporary System included a Demonstration of Compliance Plan that listed three Performance Objectives for the Temporary System. These Performance
Date Issued: July 01, 2018 Expiration Date: June 30, 2019
 State of Florida Department of Health, Bureau of Public Health Laboratories This is to certify that EMSL ANALYTICAL, INC - CINNAMINSON 200 ROUTE 130 NORTH CINNAMINSON, NJ 08077 has complied with Florida
FREY ENVIRONMENTAL, INC.
 FREY ENVIRONMENTAL, INC. Environmental Geologists, Engineers, Assessors 2817 A Lafayette Avenue Newport Beach, CA 92663 (949) 723-1645 Fax (949) 723-1854 Email: Freyinc@freyinc.com June 18, 2014 770-01
2010 Air Toxics Summary
 2010 Air Toxics Summary New Jersey Department of Environmental Protection INTRODUCTION Air pollutants can be divided into two categories: the criteria pollutants (ozone, sulfur dioxide, carbon monoxide,
US EPA Method 8260 with the Atomx XYZ and the Thermo Scientific TRACE 1310 GC and ISQ MS
 APPLICATION NOTE: TECHNOLOGY: INDUSTRY: AN1803 P+T VOC ENV US EPA Method 8260 with the Atomx XYZ and the Thermo Scientific TRACE 1310 GC and ISQ MS Amy Nutter, Applications Chemist; Teledyne Tekmar Page
UPDATE TO THE NEW JERSEY DEPARTMENT OF ENVIRONMENTAL PROTECTION (NJDEP) VAPOR INTRUSION SCREENING LEVELS (March 2013)
 VAPOR INTRUSION SCREENING LEVELS (March 2013)") UPDATE TO THE NEW JERSEY DEPARTMENT OF ENVIRONMENTAL PROTECTION (NJDEP) VAPOR INTRUSION SCREENING LEVELS (March 2013) INTRODUCTION The NJDEP has updated the March 2007 Vapor Intrusion Levels (VISL) that
UPDATE TO THE NEW JERSEY DEPARTMENT OF ENVIRONMENTAL PROTECTION (NJDEP) VAPOR INTRUSION SCREENING LEVELS (March 2013) INTRODUCTION The NJDEP has updated the March 2007 Vapor Intrusion Levels (VISL) that
2017 Air Toxics Summary
 2017 Air Toxics Summary New Jersey Department of Environmental Protection INTRODUCTION Air pollutants can be generally divided into two categories: criteria pollutants (ozone, sulfur dioxide, carbon monoxide,
Community Air Monitoring Project Results Summary St. Paul: St. Anthony Park Neighborhood
 Community Air Monitoring Project Results Summary St. Paul: St. Anthony Park Neighborhood Project overview The Community Air Monitoring Project (CAMP) is an air monitoring study, funded by the Minnesota
Sample Number: Type of Water: Collection Date and Time: Received Date and Time: Date Completed: Revised Report
 Informational Water Quality Report Citycheck Standard Client: Ordered By: Pure Effect Filters.com PO Box 50052 Staten Island, NY 10305 ATTN: Igor Milevsky Sample Number: Location: Type of Water: Collection
State Regulations (Part 360) Landfill setting Monitoring activities Results Potential Impacts
 Landfill setting Monitoring activities Results Potential Impacts") State Regulations (Part 360) Landfill setting Monitoring activities Results Potential Impacts Environmental monitoring is just one of many landfill activities regulated by the state, including Permit application
State Regulations (Part 360) Landfill setting Monitoring activities Results Potential Impacts Environmental monitoring is just one of many landfill activities regulated by the state, including Permit application
Submittal Guidelines for Imported Soil. Soil Review & Acceptance Process
 The following guidelines are provided as a prescriptive step process to ensure the contractual and regulatory requirements for Baylands Soil Processing are met and the appropriate quality control documentation
Long-Term Ambient Air Monitoring Project near Permanent Marcellus Shale Gas Facilities Protocol
 Long-Term Ambient Air Monitoring Project near Permanent Marcellus Shale Gas Facilities Protocol July 23, 2012 Commonwealth of Pennsylvania Department of Environmental Protection Tom Corbett, Governor Commonwealth
Amy Nutter, Applications Chemist; Teledyne Tekmar P a g e 1
 Application Note US EPA Method 8260 with the Tekmar Atomx XYZ P&T System and Agilent 7890B GC/5977A MS Amy Nutter, Applications Chemist; Teledyne Tekmar P a g e 1 Abstract US EPA Method 8260 in conjunction
Sample Number: Type of Water: Collection Date and Time: Received Date and Time: Date Completed:
 Informational Water Quality Report Watercheck w/po Client: Ordered By: Aqua Falls Bottled Water 7606 Dayton Road Fairborn, OH 45324-1904 ATTN: Bob Kennedy Sample Number: Location: Type of Water: Collection
McAllister Point Landfill Operation and Maintenance. Naval Station Newport, Rhode Island
 McAllister Point Landfill Operation and Maintenance Naval Station Newport, Rhode Island Environmental Chemical Corporation Full service Environmental Remediation, UXO, and Operation & Maintenance (O&M)
SCOPE OF ACCREDITATION TO ISO/IEC 17025:2005
 SCOPE OF ACCREDITATION TO ISO/IEC 17025:2005 PACE ANALYTICAL SERVICES, LLC MOBILE LAB SERVICES 1 2525 Advance Rd. Madison, WI 53718 Pat Letterer Phone: 608 221 8700 ENVIRONMENTAL Valid To: March 31, 2020
Thermal Desorption Technical Support
 Thermal Desorption Technical Support Note 79: Air monitoring - the respective advantages and applications of canisters and tubes Key Words: Environmental, Air toxics, Canisters, On-line sampling Introduction
Location: The contaminant was not detected above the minimum detection level.
 Informational Water Quality Report Watercheck Client: Ordered By: Crystal Quest 2130 NW Park Way Suite I Marietta, GA 30067 ATTN: Mike Sigari Sample Number: Location: Type of Water: Collection Date and
MEMORANDUM. To: Billy Meyer. Christie Zawtocki, PE Timothy Klotz. Date: April 8, 2014
 MEMORANDUM To: Billy Meyer From: Christie Zawtocki, PE Timothy Klotz Date: April 8, 2014 Project: One Hour Martinizing Site, DSCA ID 32-0013 1103 W Club Blvd, Durham, NC Subject: Monthly Update Hart &
Enclosed please find your Bang for the Buck Essential Indicators Water Test report.
 Dear Drinking Water Specialists Customer, Enclosed please find your Bang for the Buck Essential Indicators Water Test report. We have prepared the report with the consumer in mind, taking special care
SCOPE OF ACCREDITATION TO ISO/IEC 17025:2005
 SCOPE OF ACCREDITATION TO ISO/IEC 17025:2005 MICROBAC LABORATORIES, INC., KTL DIVISION 3323 Gilmore Industrial Blvd. Louisville, KY 40213 Megan Rothgerber Phone: 502 962 6400 CHEMICAL Valid To: December
North Carolina Cleanup Standards for Hydrocarbon Contaminated Groundwater
 North Carolina Cleanup Standards for Hydrocarbon Contaminated Groundwater The North Carolina Department of Environment and Natural Resources has adopted Risk-Based Assessment and Corrective Action procedures
Accredited Laboratory
 Accredited Laboratory A2LA has accredited MICROBAC LABORATORIES, INC., KTL Louisville, KY for technical competence in the field of Chemical Testing This laboratory is accredited in accordance with the
Cadmium B ug/l HRL Chromium B ug/l MCL 100
 Appendix 4, Table A4-1 Inorganics/Metals Arsenic 7440-38-2 6010B ug/l 25 4.41 10 MCL 2 Barium 7440-39-3 6010B ug/l 10 1.04 2000 HRL Use Tier 2 5 (or hardnessspecific value if lower) Cadmium 7440-43-9 6010B
Long-Term Ambient Air Monitoring Project near Permanent Marcellus Shale Gas Facilities Protocol
 Long-Term Ambient Air Monitoring Project near Permanent Marcellus Shale Gas Facilities Protocol July 23, 2012 Commonwealth of Pennsylvania Department of Environmental Protection Tom Corbett, Governor Commonwealth
National Air Toxics Trends Study In Grand Junction, Colorado. January through December 2007
 National Air Toxics Trends Study In Grand Junction, Colorado January through December 2007 January 2011 Prepared by the Colorado Department of Public Health & Environment Air Pollution Control Division
SPECTRUM ANALYTICAL, INC. Featuring HANIBAL TECHNOLOGY. Laboratory Report. Project: PWTF North Road, NY
 Report Date: 4-Jul-09 5:3 ü Final Report Re-Issued Report Revised Report Poughkeepsie Water Treatment Facility 343 North Road Poughkeepsie, NY 260 Attn: Matthew Geho SPECTRUM ANALYTICAL, INC. Featuring
Participating Schedule for 2018/19
 Participating Schedule for /19 Water Chemical Analysis Sample Name Analytes Enrolment Date Sample Dispatch Period Quarter 1 of Sample 3A: Mineral Constituents in potable water ph, Electrical Conductivity,
James Calenda. Sincerely, James Calenda. Project Manager. Enclosure. August 3, 2015
 August 3, 2015 Mr. Andrew Fan, PE US EPA Region III, 3LC20 1650 Arch Street Philadelphia, PA 19103-2029 Ms. Barbara Brown Project Coordinator Maryland Department of the Environment 1800 Washington Blvd.
May 4,2006. Dear Larry:
 Lockheed Martin Corporation 680 1 Rockledge Drive Bethesda, MD 208 17 Telephone 30 1.897.6000 7+ LOCKHEED MARTIN Transmitted by Electronic Mail May 4,2006 Larry A. Rosenmann New York State Department of
PHASE 2 ENVIRONMENTAL INVESTIGATION BAYWOOD APARTMENTS SONOMA COUNTY APN BAYWOOD DRIVE, PETALUMA, CALIFORNIA
 PHASE 2 ENVIRONMENTAL INVESTIGATION BAYWOOD APARTMENTS SONOMA COUNTY APN 005-201-001 BAYWOOD DRIVE, PETALUMA, CALIFORNIA 94952 Prepared For The Reliant Group, Inc. 275 Battery Street, Suite 500 San Francisco,
Pasco County Florida. Water Monitoring Plan West Pasco Class I Landfill PA87-23, WACS # Revised April 2014
 Pasco County Florida Water Monitoring Plan West Pasco Class I Landfill PA87-23, WACS # 45799 Revised April 2014 Table of Contents Section 1 Introduction... 1 Section 2 Groundwater Quality Monitoring Network...
SUBJECT DATE PAGE Item No Mineral EPA 13B. EPA 13A Chlorinated Hydrocarbons EPA TO-14A EPA TO-15 EPA TO-17 EPA TO-14A EPA TO-15
 Approved Methods: Air and Emissions 03/30/2018 1 of 19 Autonomous Detection Systems Biological Critical Agents 99 NYSDOH Approved Method 9900 Chemical Critical Agents 99 NYSDOH Approved Method 9900 Radioactive
MUNICIPAL DRINKING WATER PRODUCED BY DORVAL DRINKING WATER TREATMENT PLANT 2016
 CONCENTRATION MIN. AVE. MAX. Physical Properties ph (units) 6.5-8.5 6.5-8.5 7.10 7.25 7.50 Turbidity (N.T.U.) 1.0 5 / 1 2 0.16 0.27 0.54 Biological Characteristics ANNUAL AVERAGE Total coliforms (PRE-ABS
Charles Sarnoski Delaware Department of Natural Resources & Environmental Control Division of Air Quality
 Charles Sarnoski Delaware Department of Natural Resources & Environmental Control Division of Air Quality Thermal Desorption before TO-17 circa 1982 Why an Interest in Air Toxics? 2003 Delaware Air Toxics
APPENDIX B. Soil Sample Certificate of Analysis
 APPENDIX B Soil Sample Certificate of Analysis 5 SHOREHAM DR DOWNSVIEW, ON M3N1S4 SOIL ANALYSIS REVIEWED BY: Mike Muneswar, BSc (Chem), Senior Inorganic Analyst TRACE ORGANICS REVIEWED BY: Jacky Takeuchi,
Using Alternative Carrier Gas for US EPA Application Note. Abstract. Introduction. Experimental-Instrument Conditions
 Using Alternative Carrier Gas for US EPA 524.3 Application Note Abstract Due to regional shortages and increasing costs of helium, the preferred carrier gas in gas chromatography, alternative carrier gas
November 13, Subject: Air Quality and Noise Monitoring Summary for October 26 to 30, 2015
 CH2M [KWO] 72 Victoria treet uite 300 Kitchener, O 2G 4Y9 1 519 579 3500 www.ch2m.com icole Wilmot, M, MCIP, RPP Manager of Policy Planning, Community ervices The Corporation of the City of Brantford 100
Roger Bardsley, Applications Chemist; Teledyne Tekmar P a g e 1
 Application Note US EPA Method 524.3 with the Tekmar Lumin P & T Concentrator and Agilent 7890B GC and 5977A MSD System Roger Bardsley, Applications Chemist; Teledyne Tekmar P a g e 1 Abstract US EPA Method
Thermal Desorption Technical Support Note 87: A cryogen-free method for monitoring trace greenhouse gases in air. Key Words:
 Thermal Desorption Technical Support Note 87: A cryogen-free method for monitoring trace greenhouse gases in air Key Words: Trace greenhouse gases, Kyoto Protocol, CFCs, HCFCs, UNITY 2, CIA 8, air toxics,
Inorganic Analytes - Metals. Aluminum ND mg/l 0.2 EPA Secondary 0.1. Arsenic ND mg/l EPA Primary Barium ND mg/l 2 EPA Primary 0.
 Inorganic Analytes - Metals Aluminum ND mg/l 0.2 EPA Secondary 0.1 Arsenic ND mg/l 0.010 EPA Primary 0.005 Barium ND mg/l 2 EPA Primary 0.30 Cadmium ND mg/l 0.005 EPA Primary 0.002 Calcium 10.3 mg/l --
Roger Bardsley, Applications Chemist; Teledyne Tekmar Page 1
 Application Note US EPA Method 524.4 with the Tekmar Lumin P & T Concentrator and Agilent 7890B GC and 5977A MSD System Roger Bardsley, Applications Chemist; Teledyne Tekmar Page 1 Abstract US EPA Method
Accelerated Dry Cleaner Remediation Process Manual. Virginia Voluntary Remediation Program
 Accelerated Dry Cleaner Remediation Process Manual Virginia Voluntary Remediation Program March 4, 2010 TABLE OF CONTENTS TABLE OF CONTENTS... II 1.0 INTRODUCTION... 1 1.1 PURPOSE... 1 1.2 LIMITATIONS...
Exact Scientific Services, Inc. Ferndale, WA
 Ferndale, WA has complied with provisions set forth in Chapter 173-50 WAC and is hereby recognized by the Department of Ecology as an ACCREDITED LABORATORY for the analytical parameters listed on the accompanying
AIR SAMPLING LOCATIONS AND RESULTS OF DISPOSAL VOLUME ESTIAMTES
 AIR SAMPLING LOCATIONS AND RESULTS OF 4-25-17 DISPOSAL VOLUME ESTIAMTES Cox Environmental Services and Dahlberg Design conducted real-time monitoring for particulates (PM2.5 and PM10) and volatile organic
Data Usability Summary PCB Rinse Water May/June 2011
 Texas Custodial Trust 2301 West Paisano Drive El Paso, Texas 79922-1622 Data Usability Summary PCB Rinse Water May/June 2011 July 2011 6835001 Report Prepared By: Malcolm Pirnie, Inc. 211 North Florence
IH Scan Packages Novi Laboratory
 IH Scan Packages Novi Laboratory SCANS ACIDS, INORGANIC (5) OSHA ID-165SG / ID-174SG Hydrogen Bromide Sulfuric Acid Silica Gel Tube, washed SKC 226-10-03 or ORBO 53 Hydrogen Chloride Phosphoric Acid Nitric
New Boston Air Quality Study 1999
 New Boston Air Quality Study 1999 Division of Air Pollution Control December 2, 1999 Ohio EPA - New Boston Air Quality Study Page 1 EXECUTIVE SUMMARY In June 1999, at the request of Ohio EPA and the Portsmouth
Fast GC Analyses of Volatiles
 6 Fast GC Analyses of Volatiles Michael D. Buchanan mike.buchanan@sial.com Introduction The primary aim of Fast GC is to maintain (compared to conventional GC) sufficient resolving power in a shorter time.
EnviroMail TM 05 Canada
 EnviroMail TM 05 Canada BRITISH COLUMBIA CONTAMINATED SITES REGULATION (BC CSR) OMNIBUS UPDATE Key Topics Covered in this Enviromail: Searching and Accessing the latest information on Stage 11 BC CSR Omnibus
National Air Toxics Trends Study In Grand Junction, Colorado. January through December 2004
 National Air Toxics Trends Study In Grand Junction, Colorado January through December 2004 January 2006 Prepared by the Colorado Department of Public Health & Environment Air Pollution Control Division
CALIFORNIA STATE ENVIRONMENTAL LABORATORY ACCREDITATION PROGRAM Accredited Fields of Testing
 LIFORNIA STATE EIRONMENTAL LABORATORY ACCREDITATION PROGRAM Accredited Fields of Testing Western Environmental Testing Laboratory 475 East Greg Street Sparks, 89431 Phone: (775) 355-0202 Expiration Date
Environmental Assessment of Soil and Soil Gas
 Environmental Assessment of Soil and Soil Gas Beverly Hills High School 241 South Moreno Drive, Beverly Hills, California 90212 August 22, 2003 Prepared by: A 18581 Teller, Suite 200 Irvine, California
Startup and shakedown of the DGR system commenced the week of June 30, 2014, and full time operation began on July 8, The DGR layout including
 Mr. Timothy Peck ATTN: CENAB-EN-HM U.S. Army Corps of Engineers, Baltimore District 10 South Howard St. Baltimore, MD 21201 Arcadis U.S., Inc. 1114 Benfield Boulevard Suite A Millersville Maryland 21108
MARE BROOK ASSESSMENT. Technical Advisory Meeting # 2 Town of Brunswick, Maine April 27, 2016
 MARE BROOK ASSESSMENT Technical Advisory Meeting # 2 Town of Brunswick, Maine April 27, 2016 MEETING AGENDA 1. Welcome &Introductions 2. Project Update a) Status of Project Tasks b) Review Schedule 3.
FROG LEVEL VOLUNTEER RESCUE SQUAD
 FROG LEVEL VOLUNTEER RESCUE SQUAD ENVIRONMENTAL SITE ASSESSMENT PHASE 2 Ruther Glen, Virginia PREPARED FOR: Caroline County P.O. Box 424 Bowling Green, Virginia 22427 September, 2016 DAA Project Number:
Table B1: Analytical Results for Nutrients in Surface Water
 Table B1: Analytical Results for Nutrients in Surface Water Sample ID 1 2 Physical Tests Colour, True (Colour Units) 15 (4) units absolute, or 5 units above background (30-day average)
KW Cargill, P.A. Geotechnical/Environmental Consultant 6350 Riverside Drive Punta Gorda, Florida Tel:
 KW Cargill, P.A. Geotechnical/Environmental Consultant 6350 Riverside Drive Punta Gorda, Florida 33982 Tel: 941 276 2004 18 June 2018 Mr. Benjamin Hsu Compliance Assurance Program Florida Department of
Annual Drinking Water Quality Report City of Bowie January 1 to December 31, Public Drinking Water System #
 Annual Drinking Water Quality Report City of Bowie January 1 to December 31, 24 Public Drinking Water System #6-0002 We are pleased to present to you another in a series of annual water reports that will
September 9, Mr. Cho:
 September 9, 2015 Attn: Mr. Paul Cho California Regional Water Quality Control Board Los Angeles Region 320 West 4 th Street, Suite 200 Los Angeles, California 90013 RE: Mr. Cho: Report of August, 2015,
2010 POST-CLOSURE LANDFILL MONITORING TOWN OF BRIGHTON
 2010 POST-CLOSURE LANDFILL MONITORING TOWN OF BRIGHTON Submitted To: New York State Department of Environmental Conservation Region 5 Office Submitted By: Town of Brighton Prepared By: F. X. Browne, Inc.
Certificate of Accreditation
 PERRY JOHNSON LABORATORY ACCREDITATION, INC. Certificate of Accreditation Perry Johnson Laboratory Accreditation, Inc. has assessed the Laboratory of: (Hereinafter called the Organization) and hereby declares
TABLE 1. METALS SOIL SAMPLING RESULTS. Metals. Chromium Cobalt. Copper Iron. Lead
 TABLE 1. METALS SOIL SAMPLING RESULTS Screening Criteria (mg/kg unless otherwise noted) Aluminum Antimony Arsenic Barium Beryllium Cadmium Calcium Chromium Cobalt Copper Iron Commercial worker 100,000
Cryogen-free automation for high-performance analysis of canister air and gas
 CIA Advantage Cryogen-free automation for high-performance analysis of canister air and gas CIA Advantage CIA Advantage The next generation of automated canister analyser CIA Advantage is an advanced system