Interstate 80 Integrated Corridor Mobility Project. Concept of Operations Final
|
|
|
- Jeffrey Alexander
- 6 years ago
- Views:
Transcription
 763-2061 October 14, 2010")
1 Interstate 80 Integrated Corridor Mobility Project Final By DKS Associates 1000 Broadway, Suite 450 Oakland, CA (510) October 14, 2010
2 Document Description Client ACTC/ACCMA DKS Project Number Project Name Related Task / WBS Number Document Name File Path I-80 Integrated Corridor Mobility Project 5.1 Final p:\p\07\ i-80 icm project phase 2\05 - functional requirements\01 - concept of operations\active document\wbs concept of operations - final v8-0.docx Date Document Issued October 14, 2010 Version Number Version Control Date Description of Change Author 0-0 Nov-06 Original Draft Kimley-Horn 0-1 6/9/08 Initial Document TJF 0-2 TJF updating Chapter 5 TJF 0-3 Update chapter 9 KXB 0-4 7/30/08 Combined all contributors for first document review. TJF /01/08 Incorporates updates by KJF TJF /04/08 Submitted to HXS for review TJF /06/08 Structural changes to Chapter 8 TJF /22/08 Incorporated comments on ATM from MTC and Caltrans District 4 KJF i October 14, 2010
3 0-9 8/22/08 Comments from HXS TJF 1-0 9/4/08 Released to Stakeholders for Comment TJF 1-1 9/15/08 Received Comments from Stakeholders KXB /4/08 Comments from HXS. Update of the Chapter 8 (System Overview) and Chapter 10, Operational Scenarios TJF /8/08 Further review and updates TJF/KXB/VXK /11/08 Reviewed and Updated by KJF and AXR TJF/KXB/VXK /12/08 Incorporate Comments from HXS TJF/KXB/VXK /12/08 Released to ACTC/ACCMA HXS /22/08 Structural changes to the Report VXK /31/08 Incorporated comments from Habib VXK 2-3 1/05/ /4/ /4/09 Incorporated chapters from Preliminary Draft V2-5 Freeway Operations Report Updating document with information from Freeway Operations report All 2-4 updates combined into 2-5. Addition of Final Arterial and Transit Concept Report information. QA review. VXK TJF/RJS TJF/RJS/KJF 2-6 2/24/09 QA TJF/RJS/KJF 2-7 2/24/09 Draft Print TJF 3-0 2/24/09 Draft Final Released to ACTC/ACCMA TJF 3-1 3/27/09 Updates based on KHA and ACTC/ACCMA comments Includes review from HXS and RNR TJF 3-2 4/10/09 Final Review TJF 4-0 4/10/09 Release Draft Final TJF 4-1 6/25/09 Updates based on received comments TJF 4-2 Version number skipped ii October 14, 2010
4 4-3 9/23/ /04/09 Incorporate New Scenarios and Stakeholder information. Split Document into Sub documents as document sized >30Mb Continued to redraft document based on stakeholder meetings. Received QA review of document TJF TJF, KJF, RJS /13/09 Final Issued TJF 5-1 6/25/10 Updates based on comments received from CHP, ACTC/ACCMA and Caltrans TJF 5-1a No change VXK 5-1b Document update based on direction from ACTC/ACCMA and comments from CHP. TJF 5-1b-rjs Document QA review RJS 5-1b-vxk 5-2 7/29/10 Updated to chapter 4 from Traffic Operations reports Combine changes made in 5-1b rjs and 5-1b vxk Update all figures to address comments received VXK TJF, RJS 6-0 7/30/10 Released to Client TJF 6-1 9/7/2010 Updates from Bijan Yarjani dated TJF /1/2010 Updates from Randy Durrenburger and Bijan Yarjani dated RJS /1/2010 Released to Client TJF /14/2010 Updates based on comments from KHA and ACTC TJF/RJS /14/2010 Released to Client TJF iii October 14, 2010
5 Table of Contents 1 PURPOSE OF DOCUMENT SCOPE OF PROJECT THE PROBLEM I 80 INTEGRATED CORRIDOR MOBILITY (ICM) PROJECT THE EXPECTED BENEFITS PROJECT LIMITS REFERENCED DOCUMENTS BACKGROUND EXISTING CONDITIONS Roadway Perspective User (Traveler) Perspective Technologies Perspective RATIONALE FOR DEVELOPMENT AND IMPROVEMENT GENERAL APPROACH TO IMPROVING THE SYSTEM Planned Capital Improvements along the I 80 Study Corridor I 80 ICM Project Sponsored Deployment Coordination with Other Agencies Incident Management CONCEPT FOR THE PROPOSED SYSTEM POTENTIAL SYSTEM CONCEPTS Active Traffic Management Strategies Passive Strategies SELECTED COMPONENTS PROJECT ELEMENTS NOT INCLUDED ALTERNATIVES FOR ACTIVE TRAFFIC MANAGEMENT IMPLEMENTATION i October 14, 2010
6 5.4.1 Alternative 1A Balanced Approach (Focus on Congestion and Incidents in Both Directions) Alternative 1B Focus on Incidents in Both Directions Alternative 2 Focus on Westbound Direction Alternative 3 Low ATM Investment OPERATIONAL CONCEPT OF SYSTEM USER ORIENTED OPERATIONAL DESCRIPTION STAKEHOLDERS Workers Oversight Agencies Users CURRENT METHOD OF ACCOMPLISHING THE GOALS AND OBJECTIVES Freeway Management Arterial Management Incident Management Traffic Surveillance and Monitoring Transit Management Traveler Information Commercial Vehicle Operation OPERATIONAL NEEDS I 80 ICM VISION GOALS AND OBJECTIVES BUSINESS REQUIREMENTS Vehicle Impact Vehicle Occupancy Vehicle Route ii October 14, 2010
7 7.3.4 System Management Other SYSTEM OVERVIEW SYSTEM SCOPE Freeway Management System Arterial Management System Incident Management System Transit Management System Traveler Information System Traffic Surveillance and Monitoring System Commercial Vehicle Operations SYSTEM USERS SYSTEM INTERFACES SYSTEM MODES AND STATES Modes States SYSTEM CAPABILITIES SYSTEM GOALS AND OBJECTIVES SYSTEM ARCHITECTURE OPERATIONAL ENVIRONMENT FACILITIES Caltrans Traffic Management Center Disaster Recovery / Business Continuity Facility City Traffic Operations Centers Park and Ride iii October 14, 2010
8 system EQUIPMENT Field Devices District 4 TMC City TMCs Communication Network SOFTWARE I 80 ICM Management Application Field Device Applications Applications Controlled by Others PERSONNEL Caltrans TMC Operators Caltrans Operations Division Personnel City Engineers / TMC staff OPERATIONAL PROCEDURES SUPPORT ENVIRONMENT SUPPORT FACILITIES SUPPORT UTILITIES SUPPORT EQUIPMENT COMPUTING HARDWARE COMPUTING SOFTWARE Fault Monitoring Unauthorized Access Monitoring SUPPORT PERSONNEL Caltrans iv October 14, 2010
9 City Software Developers Outsourced Contractors SUPPORT PROCEDURES MAINTENANCE General Maintenance Requirements DISPOSAL OPERATIONAL SCENARIOS NORMAL SYSTEM CONDITIONS Scenario 1 Operation without any freeway management Scenario 2 Recurrent Congestion Scenario 3 Minor Crash on Freeway Scenario 4 Major Crash on Freeway Scenario 5 Debris on Freeway Scenario 6 Scheduled Activities Scenario 7 Transit Vehicle on Arterial Scenario 8 Emergency Vehicle on Arterial Scenario 9 Ramp Queue Extends to Arterial Scenario 10 Construction and Maintenance Scenario 11 Operational Rules and Action Plans Updated Scenario 12 Delay in Operator Input SYSTEM FAILURE EVENTS Scenario 13 Loss of Connectivity to a Field device Scenario 14 District 4 Traffic Management Center Unavailable Scenario 15 City Traffic Management Center Unavailable v October 14, 2010
10 11.3 SYSTEM SECURITY EVENTS Scenario 16 Unauthorized Access MAINTENANCE EVENTS SUMMARY OF IMPACTS STAKEHOLDERS Caltrans District Metropolitan Transportation Commission ACTC/ACCMA Contra Costa Transportation Authority West Contra Costa Transportation Advisory Committee Local Agencies WestCAT AC Transit BART Amtrak Water Emergency Transportation Authority California Highway Patrol Media Private Vehicle Operators Bicycles and Pedestrians Commercial Vehicle Operators SYSTEM CONSTRAINTS REQUIRED AGREEMENTS East Bay SMART Corridors Operations and Maintenance Agreement Video Access and Control vi October 14, 2010
11 Interagency Agreement and Standard Operating and Maintenance Procedures Incident Management Agreements Ramp Metering Agreements Joint Powers Agreement PERFORMANCE MEASURES System Performance Measures Agency Performance Measures List of Appendices Appendix A Acronyms Appendix B TLSP Existing and Proposed Field Device Appendix C Freeway Management System Existing and Proposed Field Devices Appendix D Graphics for System Failure Scenarios List of Figures Figure 2 1 I 80 ICM Project Area... 5 Figure 4 1 Project Corridor (southern section)... 9 Figure 4 2 Project Corridor (northern section) Figure 4 3 Typical AM Peak Congestion Profile Figure 4 4 Typical PM Peak Congestion Profile Figure 4 5 i 80 EB Crash Figure 4 6 I 80 WB Crash (3 Years) (5) Figure 4 7 Existing Bi Directional AADT Figure 4 8 Existing Peak Hour Mainline and Ramp Volumes (WB AM Peak) vii October 14, 2010
12 Figure 4 9 Existing Peak Hour Mainline and Ramp Volumes (EB PM Peak) Figure 4 10 AM Corridor Speed Profile and Delay (WB) (8) Figure 4 11 Westbound 24 Hours Data* Figure 4 12 Maximizing Efficiency I 80 Westbound* Figure 5 1 Black and Yellow Variable Advisory Speed Sign Figure 5 2 Post Mounted Variable Advisory Speed Sign Figure 5 3 Hard Shoulder Running in the UK(13) Figure 5 4 Dynamic Lane Markings (14) Figure 5 5 Dynamic Merge Control, a segment of the right lane of the mainline freeway closed due to excessive demand on on ramp or merging freeway(15) Figure 5 6 Typical detector layout for Local Traffic Responsive Ramp Metering (17) Figure 5 7 Typical detector requirements for adaptive ramp metering (17) Figure 5 8 Smart Park Facility Figure 5 9 Park and Ride Facility Figure 5 10 I 80 ICM ATM Alternative 1A Figure 5 11 I 80 ICM ATM Alternative 1B Figure 5 12 I 80 ICM ATM Alternative Figure 5 13 I 80 ICM ATM Alternative Figure 5 14 I 80 ICM Systems in Scope Figure 8 1 I 80 ICM Systems in Scope Figure 8 2 I 80 Corridor Project Systems Figure 8 3 FMS Implementation of ATMS and CMS Figure 8 4 VASS on Pole Figure 8 5 VASS on Full Span Sign Structure Figure 8 6 I 80 ICM Proposed VASS Locations North Section of Corridor viii October 14, 2010
13 Figure 8 7 I 80 ICM Proposed VASS Locations South Section of Corridor Figure 8 8 Typical Full Span ATM Sign Structure Figure 8 9 I 80 ICM Proposed LUS Locations (South Corridor) Figure 8 10 I 80 ICM Proposed LUS Locations (North Corridor) Figure 8 11 I 80 ICM Standard and Optional LUS Display Messages Figure 8 12 Typical CMS Figure 8 13 Typical Information Display Board Figure 8 14 I 80 ICM Proposed CMS Sign Locations Northern Section of the Corridor (North Corridor) 100 Figure 8 15 I 80 ICM Proposed CMS Sign Locations Southern Section of the Corridor (South Corridor) 101 Figure 8 16 I 80 ICM Locations of Proposed and Existing HAR/EMS Elements (North Corridor) Figure 8 17 I 80 ICM Locations of Proposed and Existing HAR/EMS Elements (South Corridor) Figure 8 18 I 80 ICM Existing and Proposed Signal Interconnects Figure 8 19 Trailblazer Signs Figure 8 20 I 80 ICM Proposed Trailblazer sign locations Figure 8 21 I 80 ICM Existing Vehicle Detection System (North Corridor) Figure 8 22 I 80 ICM Existing Vehicle Detection (South Corridor) Figure 8 23 I 80 ICM CCTV Camera Locations (North Corridor) Figure 8 24 I 80 ICM CCTV Camera Locations (South Corridor) Figure 8 25 I 80 ICM System Users Figure 8 26 Systems that Interface With I 80 System Figure 8 27 System Logical Diagram Figure 8 28 I 80 ICM Physical Architecture Figure 8 29 I 80 Management Application Logical Diagram Figure 9 1 Variable Advisory Speed Sign Figure 9 2 Lane Use Signal ix October 14, 2010
14 Figure 9 3 CMS Mounted on Full Span Sign Structure Figure 9 4 Information Display Board Figure 11 1 Sequence of I 80 ICM Management Application Operation Figure 11 2 Lane Use Sign Configuration for Normal Scenario with HOV Lanes Figure 11 3 Lane Use Sign Configuration for Normal Scenario without HOV Lanes Figure 11 4 Lane Use Sign Configuration for Recurring Congestion Scenario with HOV Lanes Figure 11 5 Lane Use Sign Configuration for Minor Crash Scenario (Option A)..157 Figure 11 6 Lane Use Sign Configuration for Minor Crash Scenario (Option B) Figure 11 7 Lane Use Sign Configuration for Minor Crash Scenario (Option C) Figure 11 8 Lane Use Sign Configuration for Major Crash Scenario (Option A) 162 Figure 11 9 Lane Use Sign Configuration for Major Crash Scenario (Option B) 163 Figure Lane Use Sign Configuration for Debris on Freeway Scenario (Option A) 166 Figure Lane Use Sign Configuration for Debris on Freeway Scenario (Option B) 167 Figure Sequence of ARM Queue Control Operation Figure Sequence for Scheduling Construction and Maintenance Activities Figure Lane Use Sign Configuration for Construction and Maintenance Scenario (Option A)..173 Figure Lane Use Sign Configuration for Construction and Maintenance Scenario (Option B)..174 Figure Sequence of Events for updating the Operational Rules and Action Plans Figure System Response to Delay in Receiving User Input Figure Sequence of Events When the System Looses Connectivity to a Field Device Figure Sequence of Events for Responding to Unauthorized Access Figure 12 1 Caltrans D4 TMC Operator Interaction with the I 80 ICM System Figure 12 2 Caltrans Office of Traffic Figure 12 3 Caltrans Office of Electrical Systems Figure 12 4 City Engineer Interaction with the I 80 ICM System x October 14, 2010
15 Figure 12 5 Private Vehicle Operator Interaction with the I 80 ICM System List of Tables Table 2 1 I 80 ICM project system components... 3 Table Bay Area traffic congestion rankings (3) Table 4 2 Traffic volumes on parallel arterial segments (9) Table 4 3 Existing Transit Coverage Table 4 4 Collision Rate Table 4 5 Planned Capital Improvements Along The I 80 Study Corridor Table 5 1 Bay Area Stations Providing Traveler Information Table 5 2 Evaluation of Traffic Management Strategies Table 5 3 Project Roadways Table 8 1 Project Roadways Table 8 2 Signal Interconnect Extensions Table 8 3 TLSP 2070 Traffic Signal Controller Upgrades Table 9 1 Agencies TMC Locations Table 9 2 Agency TMC Upgrade Requirements Table 9 3 Field Device Applications Table 10 1 Responsible Maintenance Agency for Traffic Signal Systems Table 11 1 Field Device Connectivity Failure Response Table 11 2 Field Device Connectivity Failure Response xi October 14, 2010
16 1 PURPOSE OF DOCUMENT This document provides the foundation for the development of the Interstate 80 (I 80) Integrated Corridor Mobility (ICM) Project. It details what the project is expected to achieve, what systems will be used and under what conditions the systems will operate. All project work will be structured so that the I 80 project corridor will be able to operate in a manner that is described here. This document is intended to be reviewed by the project stakeholders. Based on acceptance of the system described within this document the project development team will be able to design and build the project systems. To assist with the review and acceptance process this document is structured into the following chapters: Chapter 2 Scope of the Project: a brief overview and historical background of the I 80 ICM project. Chapter 3 Referenced Documents: lists documents that were used as references for developing this document. Chapter 4 Background: describes the current system and situation, how it is used currently, and its drawbacks and limitations. The reasons for the proposed development and the general approach to improving the system are described, along with a discussion of the nature of the planned changes and a justification for them. Chapter 5 Potential System Concepts: explores the alternatives and solutions available for use on the I 80 project corridor, including some elements that are not proposed for the initial project but may be useful enhancements for consideration in the future. Chapter 6 User Oriented Operational Description: describes the stakeholders and the users of the I 80 project corridor. Chapter 7 Operational Needs: describes what the stakeholders are expecting this project to achieve. Chapter 8 System Overview: describes the main elements proposed to be installed in the initial project (approved I 80 ICM project), how different sections of the corridor will be treated and how they will operate. Chapter 9 Operational Environment: describes the physical operational environment in terms of facilities, equipment, computing hardware and software, staff and support needed to operate the deployed system. Chapter 10 Support Environment: describes the current and planned physical support environment, including facilities, utilities, equipment, computing hardware, software, personnel, operational procedures, maintenance and disposal. Chapter 11 Operational Scenarios: describes a number of scenarios that will be accommodated by the proposed system. Chapter 12 Summary of Impacts: describes how each stakeholder will be impacted by the implementation of the new system. 1 October 14, 2010

17 2 SCOPE OF PROJECT This chapter gives a brief overview of the system to be built. It includes the project s purpose and a highlevel description. It describes what area will be covered and which agencies will be involved, either directly or through interfaces. 2.1 The Problem The Interstate 80 (I 80) corridor has ranked as the most congested corridor in the entire San Francisco Bay Area during the last six years, with traffic volumes reaching 312,000 vehicles per day and an average of 20,000 hours of delay daily. The freeway is at or near capacity during peak periods with many segments of the corridor operating poorly. The congestion on the roadway network contributes to an increase in crash rates, including rear end crashes on both freeway and local arterials. The combined effect of the crashes and the congestion hinders efficient response times and creates secondary crashes. 2.2 I-80 Integrated Corridor Mobility (ICM) Project The primary goal of the I 80 ICM Project is to enhance the current Transportation Management System along the I 80 corridor. This will be accomplished by building balanced, responsive, equitable and integrated system to monitor and maintain optimum traffic flow along the network thereby improving the safety and mobility for all users, including transit riders. This project uses State ofthe Practice Intelligent Transportation System (ITS) technologies to enhance the effectiveness of the existing transportation network in both freeway and parallel arterials in Alameda and Contra Costa Counties. The project will create a balanced network with an emphasis on system reliability and efficiency through multi modal solutions. Proposed project sub systems include: Freeway Management System (FMS) 2 October 14, 2010
18 Arterial Management System Transit Management System Traveler Information System Traffic Surveillance and Monitoring System Incident Management System Commercial Vehicle Operations (CVO) The project also includes integration with the East Bay SMART Corridors Program (a joint Alameda and Contra Costa County ITS program) and the Caltrans District 4 Transportation Management Center (TMC). The I 80 ICM project consists of multiple systems and strategies, working collectively, to address congestion and mobility: including the challenges of imbalanced traffic flow in the corridor. Since this corridor is constrained on both sides (by water and development), the most feasible congestion management alternative is to improve the efficiency of the total transportation system. The strategies proposed to improve the corridor represent a multi pronged approach to managing the different challenges along the corridor. The system components of the I 80 ICM project are listed in the Table 2 1. Table 2-1 project system components System Component Element Purpose Freeway Management System Transit Management System Arterial Management System Incident Management System Traveler Information System Traffic Surveillance and Monitoring System Adaptive Ramp Metering; Variable Advisory Speed Signs; Changeable Message Signs; Lane Use Signs; Ramp meters with HOV bypass for transit access only; Transit Signal Priority ; Transit/traffic traveler information at BART stations; Coordinated traffic signal systems, TMC for local jurisdictions Vehicle detection system; incident response plan; diversion management 511 enhancement, SMART Corridor ATIS enhancement, Changeable Message Signs, Highway Advisory Radio CCTV cameras, vehicle detection system End of queue warning, optimize flow of traffic, reduce delay, decrease crashes, merge control, decrease arterial spillover, and improve safety Improve travel time reliability, reduce travel time, encourage mode shift Optimize traffic flow on arterials, maximize coordination Decrease number of crashes, decrease incident response time, and decrease incident recovery time Enhanced traveler information for all users Minimize diversion during incident Traffic Monitoring to support other systems 3 October 14, 2010
19 System Component Element Purpose Commercial Vehicle Operations Future preferential treatment of CVO, value pricing Best time use of freeway by commercial vehicle users 2.3 The Expected Benefits Traffic operations analysis performed by DKS Associates as part of this project showed that vehicle hours of delay will be reduced after this project is implemented. As a result of this reduction in delay, the following benefits are expected: improved travel time reliability; stable traffic flow; mode shift to transit and High Occupancy Vehicles (HOV) lanes; better use of existing capacity; reduced incidents (including reduced crashes); and reduced emissions. The I 80 ICM Project is unique from a cost benefit standpoint. Based on the cost benefit ratio, this project ranked as the number one Corridor Mobility Improvement Account (CMIA) project by the California Transportation Commission (CTC). Other benefits include reduction in mobile pollutants, fuel consumption and driver frustration, and a shift of travelers transit alternatives. These benefits have been quantified using the result of extensive research of similar projects and micro simulation models. Important benefits from similar system management projects include safety improvements (reduction in crashes in the range of 15% to 50%) and improvements in mobility (increase in peak hour speeds in the range of 10% to 25%). 2.4 Project Limits The project covers the freeway and important arterials in the I 80 corridor between the Carquinez Bridge (Contra Costa County) and the interchange of I 80/I 580/I 880 (Alameda County). The limits of this project encompass locations in both Contra Costa County and Alameda County as shown in Figure October 14, 2010
20 Figure 2-1 Project Area 5 October 14, 2010
21 3 REFERENCED DOCUMENTS The following documents supported the preparation of the : 1. California Department of Transporation Division of Research and Innovation. Systems Engineering Guidebook for ITS Guidebook. 2. Metropolitan Transporation Commission. Press Release. MTC Corporate Web Site. [Online] January 6, [Cited: August 3, 2008.] Press Releases. Metropolitan Transporation Authority Corporate Web Site. [Online] May 14, [Cited: August 3, 2008.] News. MTC Corporate Web Site. [Online] June 20, [Cited: August 3, 2008.] 5. Chung, Koohong, et al. The Continuous Risk Profile Approach for the Identification of High Collision Concentration Locations on Highways. s.l. : 18th International Symposium of Transporation and Traffic Theory, Metropolitan Transporation Commission. Press Release. Metropolitan Transporation Authority Corporate Web Site. [Online] June 18, [Cited: August 3, 2008.] News. MTC Corporate Web Site. [Online] May 14, [Cited: August 3, 2008.] 8. Metropolitan Transportation Commission. Freeway Congestion Monitoring Report Alameda County Congestion Management Agency. RSTP 2007 and San Pablo Signal Timing Project Synchro Models Institute of Transporation Studies, University of California at Berkeley & DKS Associates. California Freeway Service Patrol Management Information System Local District Report Fiscal Year 2006/07. Sacramento : California Department of Transporation, Management Information System Local District Report. 11. Mirshahi, Mohammad, et al. Active Traffic Management: The Next Step in Congestion Management. Office of International Programs, Federal Highway Administration U. S. Department of Transporation. s.l. : Federal Highway Administration U. S. Department of Transporation, Techicnical Report. 12. Shaheen, Susan A., Rodier, Caroline J. and Cavanagh, Ellen. Automated Speed Enforcement in the U.S.: A Review of the Literature on Benefits and Barriers to Implementation. Institute of Transportation Studies, University of California, Davis. Davis : s.n., p. 2, Research Report. 6 October 14, 2010
22 13. Telegraph.co.uk. [Online] January 25, [Cited: April 8, 2009.] claim plans to drive on hardshoulder are unsafe.html. 14. PB Americas, Inc.; Carter+ Burgess; EarthTech, Inc.; Telvent Farradyne. Active Traffic Management (ATM) Feasibility Study Feasibility Study. 15. U.S. Department of Transporation Federal Highway Administration. Managed Lanes. U.S. Department of Transportation Federal highway Administration Web site. [Online] December 6, [Cited: July 22, 2008.] Pearson, Rebecca, Black, Justin and Wanat, Joe. Ramp Metering. California Center for Innovative Transporation. [Online] May 01, [Cited: July 24, 2008.] U.S. Department of Transporation Federal Highway Administration. Ramp Management and Control Handbook, Chapter 1 Introduction. FHWA Corporate Web site. [Online] [Cited: August 4, 2008.] Smith, Harrlet R. Transit Signal Priority (TSP): A Planning and Implementation Handbook". s.l. : U.S. Department of Transport Federal Highways Administration, Handbook. 19. Norsk Regbnesentral Norwegian Computing Center. Automatic traffic surveillance. Norsk Regnesentral Norwegian Computing Center. [Online] June [Cited: July 24, 2008.] Alameda County Congestion Management Agency. Traffic Light Synchronization Program Funding Application. Oakland : Alameda County Congestion Management Agency, Funding Application. 21. California Department of Transportation. Traffic and Vehicle Data Systems Unit. California Department of Transportation Web Site. [Online] [Cited: August 3, 2008.] Kimley Horn and Associates, Inc. and DKS Associates. Interstate 80 Integrated Corridor Mobility Project Final System Engineering Management Plan. Oakland : s.n., Systems Engineering Management Plan. 23. U.S. Department of Transporation Federal Highway Administration. Template. System Engineering Guidebook of ITS. [Online] January 2, [Cited: June 06, 2008.] California State Transportation Improvement Program (STIP) Regional Transportation Improvement Program (RTIP) County wide transportation plans for Alameda County and Contra Costa County 7 October 14, 2010
23 4 BACKGROUND In accordance with the requirements of the U.S. Department of Transportation Federal Highway Administration (FHWA) Systems Engineering Guidebook for Intelligent Transportation System (ITS) (1), this chapter provides the following: Description of the current system; Rationale for development and improvement; and Description of the selected approach. 4.1 Existing Conditions The Interstate 80 (I 80) Integrated Corridor Mobility (ICM) project is located along 20.5 mile corridor running from the interchange of I 80/I 580/I 80 in Oakland to the Carquinez Bridge in Crockett. The corridor, illustrated in Figure 4 1 and Figure 4 2, is located within Alameda and Contra Costa Counties and includes alternative parallel arterial routes, transit services and crossing arterials that connect these facilities. The commute periods are directional with the peak morning commute in the westbound direction and evening peak in the eastbound direction; there is also considerable congestion in the offpeak direction in some locations. There is also considerable weekend traffic congestion in both directions along the southern portion of the corridor within Alameda County. According to the Metropolitan Transportation Commission (MTC) and Caltrans District 4 Bay Area Freeway Congestion Report (2) and (3), the westbound I 80 corridor has ranked as the most congested corridor in the Bay Area for the last six years. Table 4 1 details the top 10 for the year The westbound section of the corridor from State Route 4 (SR 4) (John Muir Pkwy) to the Bay Bridge ranked as the most congested freeway segment in the area during the morning peak hour conditions in 2005 (4). Figure 4 3 and Figure 4 4 show the typical congestion level experienced in the corridor during the morning and evening commutes. As seen on the figures, congestion is significant and leads to slow speeds along the corridor. 8 October 14, 2010
 9 October 14,")
24 Figure 4-1 Project Corridor (southern section) 9 October 14, 2010
 10 October")
25 Figure 4-2 Project Corridor (northern section) 10 October 14, 2010
26 Table Bay Area traffic congestion rankings (3) 2007 Rank Location 2007 Daily (weekday) vehicle hours of delay 2006 Rank 2005 Rank 2004 Rank 2003 Rank 1 Interstate 80, Westbound, a.m. Alameda/Contra Costa County Route 4 to Bay Bridge metering lights 2 Interstate 580, eastbound, p.m. Alameda County Interstate 680 to Greenville Road 3 U.S. 101, southbound, a.m. Marin County Rowland Boulevard to Interstate Interstate 580, westbound, a.m. Alameda County Interstate 205 to Hacienda Drive 5 U.S. 101, northbound and Interstate 80, eastbound, p.m. San Francisco U.S. 101: Alemany Boulevard to I-80: I-80: U.S. 101 to Sterling Street on-ramp 6 Route 4, westbound a.m. Contra Costa County A Street/Lone Tree Way to Route Route 92, eastbound, p.m. Alameda County Industrial Boulevard to Interstate Interstate 880, southbound, a.m. Alameda County Marina Boulevard to south of Industrial Parkway 9 Interstate 80, eastbound, p.m. San Francisco and Alameda counties Bryant Street/5th Street in San Francisco to east of Powell street in Emeryville 10 U.S. 101, southbound, p.m. Santa Clara County Great America Parkway to North 13th Street/Oakland Road 11, , , , , , , , , , October 14, 2010

27 Figure 4-3 Typical AM Peak Congestion Profile Figure 4-4 Typical PM Peak Congestion Profile 12 October 14, 2010
28 During the afternoon peak period, eastbound I 80 ranked at No. 10 in 2005, No. 8 in 2006, and No. 9 in 2007 on the list of most congested corridors in the Bay Area. In 2005, the peak hour volume was approximately 18,200 between Gilman Avenue in Berkeley and the Bay Bridge toll plaza. The congestion on the freeway causes traffic queues waiting on the on ramps to back up onto the local arterial network. The unstable traffic speed contributes to a high crash rate. Figure 4 5 and Figure 4 6 illustrate the high crash locations for eastbound and westbound, respectively, for 2004 through The combined effect of the crashes and the congestion exacerbates the unreliability of travel times within the system and results in long incident response times. Figure 4-5 I-80 EB Crash (3 Years) *(5) 13 October 14, 2010
29 Figure 4-6 I-80 WB Crash (3 Years) (5) In 2006, I 80 westbound was still the most congested corridor in the Bay Area, with 12,230 vehicle hours of delay (6). In 2007 that figure fell nine percent to 11,100 vehicle hours of delay (7). The FastTrak reconfiguration at the Bay Bridge was an improvement that helped reduce the queuing and delay approaching the Bay Bridge toll plaza. However, other factors, including an increase in transit ridership on Bay Area Rapid Transit (BART), AC Transit and ferries, as well as carpooling, are believed to have also contributed to the decrease in delays. Nevertheless, westbound I 80 during the morning peak continued to be the most congested location in the Bay Area. The significant level of PM congestion is illustrated in Figure 4 4. Figure 4 7 provides a flow diagram of the bi directional annual average daily traffic (AADT) on I 80 for 2008 from Caltrans traffic counts. The single highest traffic count of 288,000 vehicles per day (vpd) occurs between Powell Street and the I 80/I 880/I 580 split. East of the I 80/I 580 (east)/i 880 junction, there are two locations within the corridor where major changes in daily traffic occur: at I 580 (West) where volume changes by 94,000 vpd and at SR 4 where volume changes by 56,000 vpd. Figure 4 8 provides westbound ramp volume and select mainline freeway information in the I 80 corridor for the AM peak hour (2008). The highest on ramp volume of 3,000 vph is added to the corridor from I 580. Other high volume on ramp locations in the AM peak hour include SR 4 (2,000 vph), Pinole Valley Road (1,200 vph), Appian Way (1,220 vph), and San Pablo Dam Road (1,100 vph). The I 580/I 880 offramps experience the highest off ramp volume of 5,700 vph. Other high volume off ramp locations include Richmond Parkway (1,760 vph), Cutting Boulevard (1,300 vph), and Gilman Street (1,490 vph). Similar information for eastbound I 80 in the PM peak hour is provided in Figure 4 9. The highest entering volumes are from northbound I 880 (2,300 vph) and westbound I 580 (3,100 vph). Other high volume on 14 October 14, 2010
, high volume off ramp locations include Powell Street (1,700 vph), Hilltop Drive (1,150 vph), and SR 4 (2,400 vph).")
30 ramp locations in the PM peak hour include Powell Street (950 vph), Barrett Avenue (1,350 vph), and eastbound Richmond parkway (1,400 vph). In addition to I 580 West (3,700 vph), high volume off ramp locations include Powell Street (1,700 vph), Hilltop Drive (1,150 vph), and SR 4 (2,400 vph). Figure 4-7 Existing Bi-Directional AADT Source: Caltrans Data, October 14, 2010
31 Figure 4-8 Existing Peak Hour Mainline and Ramp Volumes (WB AM Peak) 16 October 14, 2010
32 Figure 4-9 Existing Peak Hour Mainline and Ramp Volumes (EB PM Peak) The following sections describe the corridor from several different perspectives: 17 October 14, 2010
33 The roadways; The travelers (system users); The technologies Roadway Perspective Access to the freeway is provided by 44 on ramps along the project corridor. In addition, there are several freeway to freeway access points including SR 4, Interstate 580 (I 580), and Interstate 880 (I 880). Within the I 80 study corridor, San Pablo Avenue is the primary alternative parallel arterial route running between Crockett and Oakland. San Pablo Avenue is a north south roadway with two to three through lanes. There are several other arterials within the corridor and they serve as either secondary alternative arterial routes or as roadway connectors between I 80 and San Pablo Avenue or nearby transit facilities. Freeway I 80 is a major connection between San Francisco and Solano County. The freeway is at or near capacity during peak periods with many segments of the corridor operating poorly. The freeway has three to five mixed flow lanes plus a High Occupancy Vehicle (HOV) lane in each direction between SR 4 and the Bay Bridge Toll Plaza. Many segments have long travel times with low speeds during peak traffic periods, including significant periods of stop and go traffic. This is illustrated in Figure 4 10 for westbound travel during the morning peak period. 18 October 14, 2010
 (8) 19 October 14,")
34 Figure 4-10 AM Corridor Speed Profile and Delay (WB) (8) 19 October 14, 2010

35 According to the Highway Capacity Manual (HCM), the maximum number of vehicles that can pass through an individual lane every hour is approximately 2000 vehicles/hour/lane. This capacity is achieved when traffic on a roadway is traveling at approximately 70% 85% of the posted speed limit. Figure 4 11 shows the hourly volume per lane on I 80 westbound west of Gilman off ramp in May The graph shows the relationship between the speed and volume on each lane. There are significant periods when both speed and flow are sub optimal; also, there is significant variation in speed and maximum throughput of each lane. Note that some of this variation can be explained by the presence of a bottleneck downstream of the detector location. Productivity is defined as the ratio of output per unit of input. In the case of transportation, the output is the amount of vehicles served and the input is the capacity of the roadway. When total throughput is graphed against time of day (see Figure 4 12), it can be seen that there is considerable lost productivity or reduced throughput during the AM peak. This has been consistent during each of the years examined (2005 through 2007). All of the conditions discussed so far show that the freeway experiences unstable traffic flow, consistent stop and go traffic conditions, a constant degradation of the corridor s LOS and a significant level of Crashes. Figure 4-11 Westbound 24 Hours Data* * Data Source: PeMS database. 20 October 14, 2010

36 Figure 4-12 Maximizing Efficiency I-80 Westbound* * Data Source: PeMS database. Arterials The study area has one primary arterial route and several alternate routes that parallel I 80. San Pablo Avenue is the primary arterial. It runs north south from Crockett to Oakland. Traffic signals control the intersections of San Pablo with roads that connect to I 80. The following major arterials are included in the project corridor: Cummings Skyway Carlson Boulevard Willow Avenue Central Avenue Pinole Valley Road Buchanan Street Appian Way Gilman Street Fitzgerald Drive University Avenue El Portal Drive Ashby Avenue San Pablo Dam Road Powel Avenue Cutting Boulevard Lakeshore Avenue Portrero Avenue Grand Avenue West Grand Avenue The monitoring and control devices along the arterials do not cover the entire area. There is relatively little coverage by closed circuit television (CCTV) cameras. While most signalized intersections have detection for local control, additional detection would be required to monitor traffic fully. There is also a 21 October 14, 2010
37 poor level of communication between field equipment and local Traffic Management Center (TMC) s and no center to center communication to allow sharing of information. Table 4 2 summarizes the traffic volumes on some of these arterial segments. The volumes represent mid segment volumes and were extracted from 2007 Alameda County Congestion Management Agency (ACTC/ACCMA) Regional Signal Timing Program San Pablo Avenue Timing Model. Table 4-2 Traffic volumes on parallel arterial segments (9) Parallel Arterial Segment ADT Range (Average Daily Traffic ) San Pablo Avenue Willow Ave to Robert Miller Drive (Rodeo) 13,200 to 21,475 San Pablo Avenue - Rivers Street to Monroe Street (San Pablo) 17,300 to 27,900 San Pablo Avenue South of Monroe Street (San Pablo) 13,200 to 28,700 The arterials experience recurrent congestion, particularly in sections that appear to be used by traffic avoiding recurring congestion and bottlenecks on nearby freeway segments. The arterials also experience considerable non recurrent congestion when there is an incident on a parallel section of freeway. This congestion typically continues long past the segment in which the incident occurs User (Traveler) Perspective This section looks at the corridor from the user s point of view. Extensive transit service is available throughout the study corridor with rail, bus, and ferry. Trucks and heavy trucks are categorized as commercial vehicles that need careful consideration. Private vehicles are the main users of the corridor; they include commuters and non commuting travelers. Transit Transit provides several important modes along the corridor. Table 4 3 summarizes the type of transit service, transit operator and service limits within the corridor. BART runs from Richmond to San Francisco along dedicated right of way. Both AC Transit and WestCAT operate services in the corridor. The bus services are both express bus service and local service. The express bus service includes service from Marin, Solano, Contra Costa and Alameda Counties. These express services connect to BART, the Transbay terminal, park and ride lots, or other bus lines. Currently, the ferry service runs parallel to the corridor; however, there are no ferry stops in the corridor. A Ferry Strategic Plan includes future ferry stops in Hercules, Richmond and Berkeley, which are within the project corridor and this is expected to assist with some mode shift. 22 October 14, 2010
38 Table 4-3 Existing Transit Coverage Transit Service Type Transit Operator Service limits within corridor Rail BART Between Richmond and San Francisco along dedicated right-ofway. El Cerrito del Norte and El Cerrito Plaza BART stations provide convenient access to Interstate 80 and San Pablo Avenue. Express bus connections to BART Express bus connections to BART Express bus connections to BART Express bus connections to BART Fairfield-Suisun Transit Vallejo Transit WestCAT Golden Gate Transit Between Fairfield and El Cerrito del Norte BART station along Interstate 80 Between Vallejo and El Cerrito del Norte BART station along Interstate 80 Between Martinez, Hercules and the El Cerrito del Norte BART station along Interstate 80 Between San Rafael and El Cerrito del Norte BART station along Cutting Boulevard. Ferry Vallejo BayLink Between Vallejo Ferry Building and San Francisco Ferry Building along Interstate 80 Transbay express bus service to San Francisco Transbay express bus service to San Francisco AC Transit WestCAT Lynx Between various east bay locations (neighborhoods and parkand-ride lots) and San Francisco along Interstate 80 Between Hercules Transit Center and San Francisco Transbay Terminal along Interstate 80 Rapid Bus Service AC Transit Along San Pablo Avenue between Richmond and Oakland The transit services are not as reliable as they could be because of irregular travel time, traffic delay, low speed and lack of exclusive lanes which leads to delay in transit operations. Private Vehicles Private vehicles are categorized broadly as commuters or non commuting vehicles. These groups are considered separately because of differences in their traffic behaviors. Commuters typically know the arterial and parallel routes, locations of bottlenecks and sections likely to experience queuing and congestion. Thus, their reaction to an incident is different from travelers who are unfamiliar with any routes other than the freeway Technologies Perspective The corridor consists of ITS field elements, communication infrastructure and Transportation Management Center (TMC). These devices are used to assist in the operation of traffic systems within the corridor. Intelligent Transportation System Field Elements ITS is used typically for traffic management, incident management, and collecting and disseminating traveler information. The corridor does not have a full ITS deployment, but it does include some field elements such as detection, CCTV cameras, highway advisory radio (HAR) and changeable message signs (CMS). The devices are owned and maintained by the jurisdiction in which they are located. 23 October 14, 2010
39 Communication Infrastructure The existing communication between field elements along I 80 and the Caltrans District 4 TMC is achieved using leased line telecommunications services from AT&T. Caltrans CCTV cameras utilize ISDN lines while other freeway ITS field devices employ GPRS modems. Local jurisdiction traffic signals are interconnected along the project corridor via a hardwired twisted pair communication system. Most of the jurisdictions are not equipped with agency owned fiber optic communications networks. Arterial field devices deployed along San Pablo Avenue as part of the East Bay Smart Corridors Program use a combination of leased wire line and wireless services from AT&T to connect to the ACTC/ACCMA Data Center in San Francisco. The majority of field devices located along arterials connecting I 80 and San Pablo Avenue do not currently have any communications infrastructure. Transportation Management Center The project corridor is primarily managed through a Traffic Management Center (TMC). The Caltrans District 4 TMC in Oakland monitors the Caltrans District 4 devices and has access to information shared by other agencies. The California Highway Patrol (CHP) is co located at the Caltrans District 4 TMC to provide maximum incident management capabilities. 511 Traveler Information Center (TIC) is also co located at the Caltrans District 4 TMC. The CHP 911 Dispatch Center is located in Vallejo, north of the project corridor. The City of Oakland and Alameda County are in the process of establishing their own TMCs. There is a virtual TMC that exists for the East Bay SMART Corridors program to provide data and video exchange to all of the participating agencies through a secured leased line communication system. A public agencies website ( is available for public information dissemination. The server for the SMART Corridors is leased and provides full 24 hour operations and maintenance. The SMART Corridors website has some traveler information available to all users and a special log in for agencies to access more detailed information. 4.2 Rationale for Development and Improvement The efficiency of the I 80 corridor, encompassing both the freeway and adjacent arterials, needs to be improved in order to alleviate congestion and meet existing and future demand. The corridor is carrying a high quantity of traffic on a daily basis but its performance is being limited. In many areas of the corridor, road widening or construction of new roadways is simply not an option due to the lack of Right of Way, limited financial resources, environmental impact issues, and institutional and political considerations. As a result the corridor has: A high level of congestion; Poor travel time reliability; and Poor alternate route options in the event of an incident. A high sensitivity to incidents; A high incident rate, shown in Table 4 4; and 24 October 14, 2010
40 A long response and clearance times when incidents occur (10). Table 4-4 Collision Rate Segment Limits Number of Collisions Collisions Rate Statewide Average Accident Rate 1 Bay Bridge Toll Plaza/Powell Powell/Buchanan 580 2, Buchanan/San Pablo Dam Road 1, San Pablo Dam Road/SR 4 1, SR 4/Carquinez Bridge Note: Accident Rate is the number of accidents per million vehicle miles. State wide Average Accident Rate is the average accident rate from similar freeway segments in California. Source: TASAS Database (November 1, 2004 October 31, 2007) 4.3 General approach to improving the system There is no single answer to the set of complex problems of the I 80 corridor. However, ITS technologies are opening up new possibilities that collectively, if implemented in an integrated fashion, can go a long way towards mitigating the congestion without constructing additional physical capacity. ITS technologies have been encapsulated in a collection of interrelated user services for application to the transportation problems. Stakeholders needs can be addressed by a variety of ITS options. Left without adequate guidance, stakeholders could develop solutions to their own needs that would be incompatible with their regional neighbors. Therefore, an integrated approach is required so that system elements are compatible and supportive of each other. To fully maximize the potential of ITS technologies, system design solutions must be compatible at the system interface level in order to share data, provide coordinated, area wide integrated operations, and support interoperable equipment and services where appropriate. Our approach will improve conditions in the I 80 corridor and it will include the following elements: Other Alameda County CIP and TIP projects slated for this corridor have been included in this project; Implementation of new project elements as part of this project; An increase in the level of co ordination between the transportation agencies; and Improvement in the effectiveness of incident management along the corridor. 25 October 14, 2010
41 4.3.1 Planned Capital Improvements along the I-80 Study Corridor To identify planned improvements affecting the I 80 corridor, a search of available planning documents was conducted. Input was also received from a number of jurisdictions along the corridor. The documents reviewed included the Regional Transportation Plan (RTP), the Transportation Improvement Plan (TIP), and several CIPs. Documents from the following agencies were reviewed: Caltrans District 4; Metropolitan Transportation Commission; Contra Costa County; Contra Costa Transportation Authority; Alameda County Transportation Improvement Authority; AC Transit; and ACTC/ACCMA. The relevant projects from CIPs are summarized in Table 4 5. While most of these projects consist of interchange modifications, the extension of the HOV lanes from SR 4 to the Carquinez Bridge is also proposed. For all of these projects, I 80 ICM program stakeholders will work with the applicable project staff to ensure that any ITS elements implemented will fit within the overall corridor management approach. 26 October 14, 2010
42 Table 4-5 Planned Capital Improvements Along The I-80 Study Corridor Project Name Source I-80 Gilman Interchange Reconfiguration MTC '05-'06 5-year TIP I-80/Central Ave Interchange Modification MTC '05-'06 5-year TIP I-80 EB HOV Ln SR 4 to Carquinez Bridge MTC '05-'06 5-year TIP I-80: Construct Eastbound HOV Lanes, Willow Avenue to Crockett I/C Contra Costa County '05 7-year CIP I-80: Westbound HOV Lanes, Crockett I/C to Willow Ave Contra Costa County '05 7-year CIP I-80/SR 4 Interchange: WB 80 to EB 4 Direct Connectors1 Contra Costa County '05 7-year CIP I-80/SR 4 Interchange: Remaining Components 1 Contra Costa County '05 7-year CIP I-80/San Pablo Dam Road Interchange: Reconstruct Contra Costa County '05 7-year CIP I-80: Install Ramp Metering Hardware Bay Bridge to Carquinez Bridge Contra Costa County '05 7-year CIP SR 4 West: Phase 2 (Full Freeway) I-80 to Cummings Skyway 1 Contra Costa County '05 7-year CIP Widen Cummings Skyway Interchange at I-80 1 Contra Costa County '05 7-year CIP It should be noted that a number of capital projects listed in Table 4 5 are uncertain but are included in the TOAR and CSMP for analysis. Additional non roadway projects currently underway within the study corridor that could reduce vehicle trips and improve traffic conditions include ferry service from Hercules and Richmond and the 511 Contra Costa commute incentive programs Project Sponsored Deployment The I 80 corridor is an excellent candidate for an integrated corridor solution because of the extent of the congestion, physical constraints and the multi modal aspects of the corridor. Integrated corridor management use technology to link different components of the network (freeways, ramps, transit, and 1 Per the City of Hercules, alternatives to these projects are currently being studied and may lead to revisions to the CIP and TIP/RTIP lists, Furthermore, a major intermodal facility, integrated into the freeway system, is being proposed for this area. The City has suggested that these alternative improvements and transit oriented development be incorporated into any subsequent analysis of future year conditions at the I 80/SR 4 Interchange. 27 October 14, 2010
43 arterials). The alternatives considered for the I 80 ICM must focus on operational, institutional, and technical coordination of the network and the service providers. The goal for the project is to enhance the current Transportation Management System along the I 80 Corridor by using state of the practice solutions in order to build a balanced, proactive, responsive and integrated system that monitors and maintains optimum traffic flow along the network, thereby improving the safety, efficiency and mobility for all users Coordination with Other Agencies In order to make informed travel decisions, travelers need a comprehensive and consistent traveler information system that combines data from various sources covering the I 80 Corridor. Successful regional traveler information is built on the basis of strengthened inter agency coordination, cooperation and data sharing. Strong and effective working relationships between the major transportation agencies including Caltrans District 4, MTC, ACTC/ACCMA, Contra Costa Transportation Authority (CCTA), West Contra Costa Transportation Advisory Committee (WCCTAC), AC Transit and major cities along the corridor have been established for other projects. These collaborative relationships must be applied to this program and solidified with mutual agreements regarding expectations, roles and responsibilities of each agency. The roles and responsibilities of mutual aid agencies, such as CHP, fire department, law enforcement and Hazardous Materials (HAZMAT) agencies, will need to be further refined as part of the I 80 corridor management plan Incident Management Incident detection may occur in several different ways, which may include: A patrol vehicle may spot an incident; The general public may call 911 with incident information; and The incident may be identified by a stakeholder agency Traffic Management Center staff member using vehicle detection system or CCTV cameras. The Caltrans District 4 TMC is staffed by both Caltrans District 4 and CHP personnel. Caltrans District 4 also has a direct link to the CHP Computer Aided Dispatch (CAD) system to receive incident information. Local media also have access to the CHP CAD system. An agency can use information about the incident to determine what actions need to be taken to respond to and manage an incident, as well as manage the congestion that results from traffic diverting around an incident on the freeway to the arterial system. Currently, CHP verifies an incident and alerts the appropriate responders, including Emergency Medical Service provider, Fire Department, State HAZMAT agencies, or Coroner s Office. The response protocol differs between counties. As part of this project an Incident Response Plan (IRP) will be developed. When an incident occurs, the IRP will alert motorists about anticipated delays using CMS, highway advisory radio (HAR) and/or trailblazer signs. The messages can tell drivers where an incident is located, how long the delays may be, and what routes serve as the best alternates, if available. Drivers can then make informed decisions about how to 28 October 14, 2010
44 react to an incident and, if deciding to divert from the freeway, which route to take. The Incident Response Plan will outline who will implement which strategies. Diversion Management In the event of a major incident that involves freeway or arterial lane closures, diversion management can advise drivers how to detour around the incident. Diversion management, which could be a subset of the incident management plan which will outline roles and responsibilities for detours, preferred detour routes, and when detours should be implemented. The diversion plan will involve the cooperation of affected agencies to implement the detours. A lane management strategy is also required, in which Lane Use Signals (LUS) close down lanes for incident clearance or open the HOV lane to general traffic if necessary for incident congestion relief. Local arterials should be used as effectively as possible for diversions (see Traffic Operations Analysis Report (TOAR)). Trailblazer signs will be used to guide diverted vehicles through arterials and back to the freeway beyond the incident or to transit. Transit usage should be a large component of any diversion plan because it provides a localized spot for travelers to divert to and can transport large numbers of people. Another technique to improve the efficiency of diversion is to modify the signal timing (flush plan) along the corridors and the arterial to freeway connectors to accommodate the traffic flow more efficiently during incidents. The revised signal timing plan should give priority to the alternate traffic route that is most impacted when an incident occurs. Signal progression should be modified along the corridor in an effort to clear the increased volume of vehicles and not allow the arterial service to break down due to increased traffic. For the future deployment, it is necessary to identify and develop appropriate incident management plans along the major crossing arterial connectors between the parallel corridor and the freeway. The trailblazers on the freeway connectors and parallel arterials should provide full direction to the freeway. The connector should accommodate the additional traffic that may be diverted along these roadways to the freeway. Public Education An important component of the incident management plan is public education, informing the public of what they should and should not do in case of an incident and what alternative services are available. Empowering the public to make informed and proactive decisions will decrease the magnitude and duration of incidents because drivers will use more appropriate responses. The public may not be aware that if an individual is involved in a non injury crash, he or she should move the vehicle to the shoulder to exchange information or wait for help. There is a common misconception that the vehicle should not be moved until the damage is assessed. However, California law allows the vehicles to move out of the travel way to process the incident. Moving the vehicles out of the way of traffic will decrease the congestion caused by a minor incident. Increasing awareness of the appropriate response is important, but the response may be hindered in areas where there is not sufficient shoulder width. 29 October 14, 2010
45 The Freeway Service Patrol (FSP) may also be more effective through increased advertising so the general public can contact them directly to respond to mechanical breakdowns. Many people may not be aware this is a free service for the sole purpose of responding to and clearing mechanical breakdowns. If a vehicle is stalled on the side of the road and the individual calls 911 to respond, the response and clearance time will be longer than if the person had alerted the FSP directly. Response Strategies Strategies that will improve the response time to incidents include: reducing the extent to which congestion on the freeway impedes response vehicles; reducing the distance response vehicles must travel to reach an incident; and reducing the delays experienced by response vehicles while traveling on the arterial roads. Expanding CHP s CLEAR program to service the I 80 corridor is one strategy. The CLEAR program assigns officers to specific locations to assist with incident response. Utilizing CMS to close lanes for incident response and removal will help decrease clearance time by giving CHP and Emergency Medical Services direct access to the incident. The CHP has already designated preferential freeway ramps for incident response and clearance. Keeping shoulders clear for incident response will also shorten response time. Incident response could also be improved with an emergency pre emption system. An emergency preemption system includes a transmitter on emergency response vehicles and detection units on traffic signalsthat request and authorize priority treatment for emergency vehicles. Pre emption systems will allow the emergency service providers to respond faster to incidents, saving lives and minimizing congestion. It will be beneficial to expand the existing emergency pre emption system to include crossarterials and detour routes. Real Time Information While the approaches described above will directly improve the effectiveness of responders, incident information should also be provided to motorists so they will understand the cause of unusual congestion, react in a manner that does not inhibit responders and does not unnecessarily increase congestion elsewhere. This dissemination of information can be achieved directly by the use of CMS, ITS devices on overhead structures (gantries), and HAR, in addition to other information services provided through 511, commercial radio reports and other information providers. 30 October 14, 2010

46 5 CONCEPT FOR THE PROPOSED SYSTEM This chapter describes the concept exploration. It starts with a list and description of the alternative concepts examined. The evaluation and assessment of each alternative follows. This leads into the justification for the selected approach. The operational concept for that selected approach is described here. This is not a design, but a high level, conceptual, operational description. It uses only as much detail as needed to be able to develop meaningful scenarios. In particular, if alternative approaches differ in terms of which agency does what, that will need to be resolved and described. 5.1 Potential System Concepts Active Traffic Management Strategies Active traffic management (ATM) is the ability to dynamically manage recurrent and nonrecurrent congestion based on prevailing traffic conditions. Focusing on trip reliability, it maximizes the effectiveness and efficiency of the facility. It increases safety and throughput through the use of integrated systems with new technology, including the automation of dynamic deployment to optimize performance quickly and without the delay that occurs when operators must deploy operational strategies manually.(11) Speed Harmonization Description Speed harmonization is an ATM strategy used to proactively manage vehicle speeds to improve roadway safety and maximize freeway throughput. The primary purpose of speed harmonization is to minimize spatial and temporal variations in speed. This is achieved by reducing the advisory speed upstream of areas of congestion or incidents. Speed harmonization typically results in a reduction in the number of crashes (11) caused by sudden changes in speed (by reducing speeds before vehicles reach the back of a queue) and by abrupt lane changes (by reducing the speed differential between lanes and therefore eliminating the incentive to change lanes). Improved traffic flow gives rise to smooth transitions across time and space which result in improved safety. Figure 5-1 Black and Yellow Variable Advisory Speed Sign In addition to maximizing safety, speed harmonization may improve throughput for a given section of roadway, while the vehicle speeds are lower than the free flow speed of that section. Recent studies on this topic have concluded that higher levels of throughput are obtained using speed harmonization (11), in part because of the reduction in the range of speeds and the variations in speed of vehicles using a section of road. 31 October 14, 2010
47 Maximum vehicle throughput is achieved on the freeway when all vehicles travel at the optimal speed. Therefore, speed harmonization attempts to maintain traffic at an optimal speed that provides maximum throughput. The optimal speed at each location depends on driver behavior and the nature of the road, but typically it is in the range of 35 to 55 mph. At a freeway bottleneck at which vehicle demand is higher than capacity, vehicles must slow down and queue up waiting for their time to pass the bottleneck. When vehicle demand reaches capacity and exhibits unstable flow, vehicle speed might drop to zero (a stop andgo condition). The speed harmonization strategy proactively manages vehicles upstream of the bottleneck to slow down and smoothly move toward the bottleneck downstream at the optimal speed instead of letting vehicle flow naturally become unstable and letting vehicle speed drop to zero. As a result, the strategy delays (or sometimes even eliminates) the onset of unstable flow at the bottleneck. This will allow the congested traffic to flush out as quickly as possible within the bottleneck zone, without losing productivity due to unstable flow at the bottleneck. To harmonize the speed along the corridor motorists must be notified of the desired speed for each section of the corridor. Variable Advisory Speed signs (VASS) are used to notify the motorists of the appropriate speed. These are often complemented by changeable message signs (CMS). An example of a VASS is shown in Figure 5 1. These may be mounted overhead, or at the side of the road as illustrated in Figure 5 2. Figure 5-2 Post Mounted Variable Advisory Speed Sign FHWA recommends agencies throughout the United States implement speed harmonization on freeways to actively manage the network and delay the onset of congestion under normal operating conditions. The system elements that are recommended by FHWA include (11; 11): Sufficient sensor deployment for traffic detection and monitoring to support the strategy; Adequate installation of overhead sign structures to ensure that at least one advisory speed sign is in sight at all times; Placement of advisory speed signs over each travel lane; An expert system that deploys the strategy based on prevailing roadway conditions without requiring operator intervention. It is critical that this expert system be reliable and accurate to gain the trust and acceptance of the public; Connection to a Traffic Management Center (TMC) that serves as the focal point for the system; 32 October 14, 2010
48 Uniform signing related to speed harmonization and its components; Modeling tools to assess the impacts of speed harmonization on overall network operations; Closed circuit television cameras to support the monitoring of the system; Dynamic message signs to provide traveler information and regulatory signs as appropriate; and Automated speed enforcement to deter violations. As typically installed elsewhere, the speed harmonization software uses an algorithm to determine the appropriate speed recommendations. The speed harmonization algorithm determines the optimal speed patterns for the freeway during a variety of freeway conditions. These conditions include normal traffic flow, increased congestion caused by an crash, increased congestion with no incident, increased congestion caused by construction and maintenance activities, increased congestion caused by adverse weather and increased congestion caused by debris. The algorithm is typically developed to address the specific characteristics of each corridor. The speed harmonization software adjusts the VASS to a specified speed, with operator approval if required. Therefore the most efficient and effective operational solution requires the VASS to be operated from a central location that is staffed 24 hours per day. Evaluation and Assessment Speed harmonization proactively manages vehicle speeds to improve roadway safety and possibly freeway throughput. Spatial and temporal vehicle variations are reduced through reducing the advisory speed upstream of areas of congestion or incidents, leading to an improvement in roadway safety and a maximization of the freeway throughput. Conclusion More discussion regarding the benefits of speed harmonization is required prior to deployment. It is therefore not considered further for inclusion in the initial I 80 ICM project. Automated Speed Enforcement Description The effectiveness of speed harmonization is dependent on the level of observance of the advisory speed. Automated speed enforcement is one strategy that can be used to cost effectively increase the level of observance. These programs typically combine radar and image capturing technologies to detect speeding and collect photographic evidence of violations that can used to issue a citation (12). Automated speed enforcement programs have been widely deployed on European freeways for decades. However, programs in this country have largely targeted speeding on surface streets with speeds from 30 to 50 miles per hour, and many, such as those in Portland and Denver, are restricted to residential streets. A long running automated speed enforcement program in San Jose was recently halted over concerns about the legality of the procedures used for issuing tickets and collecting fines. California does not have enabling legislation specifically authorizing automated speed enforcement programs. (12) 33 October 14, 2010
49 Evaluation and Assessment Automated speed enforcement may improve the safety of the freeway by encouraging all vehicles to follow the posted Variable Advisory Speed, thus supporting the speed harmonization concept and reducing the mean and standard deviation of vehicle speeds. Combining speed harmonization with automated speed enforcement will assist the speed harmonization system in achieving the higher level of desired speed harmonization goals. Automated speed enforcement would need the support of the stakeholders including the California Highway Patrol and the Californian legal environment. The I 80 ICM project might benefit from the implementation of automated speed enforcement if speed harmonization is implemented. The improved level of safety associated with increased Variable Advisory Speed compliance is in keeping with the goals and objectives of the project. Conclusion Without appropriate legislation changes and the support of the California Highway Patrol automated speed enforcement implementation will not be part of the I 80 ICM project. Freeway Shoulder Use Freeway shoulder use (referred to in the UK as hard shoulder running) is an ATM strategy to provide additional capacity during times of congestion and is typically deployed in conjunction with speed harmonization and other ATM strategies. The advisory speed on the shoulder, when it is allowed to be used, should be set to be the same as the advisory speed for the other harmonized lanes, but should not exceed 50 mph. The hard shoulder should only be used by vehicles traveling between ramps in the same manner as using an auxiliary lane. Additional facilities to mitigate the safety issues of shoulder use should be considered, including overhead lane signs, emergency refuge areas with automatic vehicle detection, speed reduction, dynamic lane markings, advanced incident detection, CCTV surveillance, incident management, and public lighting. Differences between the shoulder used within an ATM environment and a normal shoulder are: The shoulder on a normal freeway can only be used in case of an emergency or breakdown. During high levels of traffic or an incident, the shoulder in an ATM environment can be used as an extra lane to reduce congestion, and therefore there are typically CMS signs above the shoulder to indicate whether the lane is available for use; The line marking the edge of the shoulder, located between the shoulder and the general purpose lane, in the UK normally includes a rumble strip, which vibrates the vehicle and makes a noise to the driver when crossed. In ATM, the vibration and noise created by this line is reduced so as not to deter drivers from using the hard shoulder when it is available; however, drivers are still alerted by a humming sound when they cross this line; On a normal freeway, a vehicle can stop on the shoulder in case of an emergency or breakdown. As implemented in the UK, separate emergency stopping areas are provided in addition to the hard shoulder, at spacing of approximately 500m; and 34 October 14, 2010

50 In order to allow the shoulder to be used as a running lane, it needs to be maintained in the same condition as other general purpose lanes, such as clearing of debris and maintaining drainage. Using the shoulder in ATM provides three key benefits, which contribute towards preventing the breakdown in the flow of vehicles: Shoulder running allows local traffic, which is coming on at one junction and off at the next junction, to join the shoulder from the on ramp and travel along the shoulder to the off ramp. This means that they do not disrupt the traffic on the mainline; It also allows traffic that wishes to leave the freeway at the next ramp to use the shoulder, which gives them a greater distance to change lanes; and Similarly, it provides traffic joining the freeway a greater distance to merge with the traffic on the mainline. Figure 5-3 Hard Shoulder Running in the UK(13) According to the FHWA, specific elements of the temporary shoulder use strategy should include the following (11): Deployment in conjunction with speed harmonization; Passage of enabling legislation and related laws to allow the shoulder to be used as a travel lane; A policy for uniform application of the strategy through entrance and exit ramps and at interchanges; 35 October 14, 2010
51 Adequate installation of overhead sign structures to provide operational information and to ensure appropriate signs are viewable at all times; Placement of lane control signals or lane use signals over each travel lane; Uniform signing and markings related to temporary shoulder use; CCTV cameras with sufficient coverage to verify the clearance of the shoulder before activation of shoulder use; Provision of pullouts with automatic vehicle detection at regular intervals to provide refuge areas for vehicles involved in minor incidents; Provision of roadside emergency call boxes at emergency pullouts; Special lighting to enhance visibility of the shoulder; Advanced incident detection capabilities; Comprehensive incident management program; Connection to a traffic management center that serves as the focal point for the system; and Dynamic message signs to provide guide sign information and regulatory signs to adapt to the addition of the shoulder as a travel lane. Evaluation and Assessment The conditions on some sections of the freeway are similar to those observed in locations where shoulder use has been successfully employed. It will provide increased capacity for minimal cost outlay without an increase in roadway width. The gains must be weighed against the reduction in safety associated with using the freeway shoulder activities other than an emergency. Conclusion Freeway shoulder use will not be implemented as part of the I 80 ICM project. Dynamic Lane Markings Dynamic lane marking is an ATM strategy to support other ATM strategies, particularly temporary shoulder use (11). Figure 5 4 shows an example of dynamic lane markings at an exit ramp when the right shoulder is in use, providing a two lane exit. It is not clear whether dynamic lane markings would be consistent with California Vehicle Code (CVC). 36 October 14, 2010
52 Figure 5-4 Dynamic Lane Markings (14) Evaluation and Assessment Dynamic Lane Marking s are best used in conjunction with Freeway Shoulder Use. If Freeway Shoulder Use is implemented in future phases of the I 80 ICM project then Dynamic Lane Markings should be considered at those locations. Conclusion Dynamic Lane Markings is not considered for this phase of the I 80 ICM project. Dynamic Merge Control Dynamic merge control is an ATM strategy to dynamically meter or close specific upstream lanes of a merging area, depending on traffic demand (11). This may prevent the formation of congestion in the merging area when there is sufficient and imbalance capacity in the adjacent mainline lanes. This could easily incorporate existing ramp metering systems and could offer the potential of delaying the onset of mainline congestion and balancing demands between the upstream mainline and ramps. Dynamic merge control also can be used as an alternative to freeway to freeway control/metering. An example of dynamic merge control is illustrated in Figure 5 5. Specific elements of the operational strategy (as recommended by FHWA) should include: An expert system that deploys the strategy based on prevailing roadway conditions without requiring operator intervention. It is critical that this expert system be reliable and accurate to gain the trust and acceptance of the public; Closed circuit television cameras to verify and support the monitoring of the system; 37 October 14, 2010

53 Installation of lane control signals over the main lanes and the ramp lanes with a signal over each travel lane; Adequate installation of overhead sign structures upstream of the deployment to ensure sufficient advance warning is provided to roadway users through the use of dynamic message signs; Adequate installation of overhead sign structures with dynamic message signs upstream of the deployment to provide guide sign information and regulatory signs to adapt to the changes in lane use; Uniform signing to indicate merge control is in use; Automated enforcement to deter violations; A bypass lane for emergency vehicles, transit, or other identified exempt users; and Connection to a traffic management center that serves as the focal point for the system operation. Figure 5-5 Dynamic Merge Control, a segment of the right lane of the mainline freeway closed due to excessive demand on on-ramp or merging freeway(15) Dynamic merge control appears to be successful when there is a high volume entering the freeway from an on ramp and localized congestion occurs in the merging area while other through lanes are freeflowing and have sufficient capacity to accommodate the mainline flow. Evaluation and Assessment Dynamic merge control improves the flow of traffic at on ramp locations when the free flowing traffic begins to break down. This strategy helps improved throughput at the on ramp without increasing capacity. The strategy requires lane use signs upstream of the on ramp to indicate the closure of the lane to the freeway vehicles. In addition a significant amount of public outreach may be required to educate freeways users. 38 October 14, 2010
54 Conclusion There are a limited number of locations within the corridor where this strategy may be appropriate. It is therefore not considered further for inclusion in the initial I 80 ICM project. This strategy is worthy of consideration as part of intermediate (5 10 years) projects with evaluation of other projects listed in I 80 CSMP. These include freeway to freeway metering (I 580E to I 80W), junction control, auxiliary lanes and ramp improvements, among others. Queue Warning Queue warning systems provide advanced warning to motorists that a queue has formed ahead of them, which will require them to slow down. Queue warning message displays can be implemented at regular intervals to warn motorists of downstream queues. The system determines when to display the messages using dynamic traffic detection (11). Specific elements of the operational strategy should include the following: Deployment in conjunction with speed harmonization; Sufficient sensor deployment for traffic monitoring to support the strategy; Adequate installation of overhead sign structures in order to ensure that a queue warning sign is visible at all times; An expert system that deploys the strategy based on prevailing roadway conditions without requiring operator intervention. It is critical that this expert system be reliable and accurate to gain the public trust; Uniform signing to indicate congestion ahead; and Connection to a traffic management center that serves as the focal point for the system. Evaluation and Assessment Queue warning system will improve the safety of motorists on roadways where vehicle the transition from free flowing traffic to stop start traffic is sudden and unpredictable. The I 80 freeway exhibits these conditions on a daily basis. There is extensive queuing and stop and go traffic on the freeway in this corridor, and the location of the back of the queue varies significantly on a daily basis. Therefore this corridor is an excellent candidate for the use of a queue warning strategy. Conclusion The queue warning system will be considered for inclusion in the initial I 80 ICM project. Junction Control Junction control is an ATM strategy can be used at entrance ramps or merge points when the number of downstream lanes is fewer than the number of upstream lanes. This would apply at freeway connections, multiple lane on ramps and at lane drops. The objective is to minimize the number of vehicles entering the merge area by preventing vehicles approaching the merge in the lighter traffic stream from using the merged lane. This requires the merging lanes to be dynamically controlled upstream of the merge area. 39 October 14, 2010
55 Evaluation and Assessment Junction control is similar to the concept of dynamic merge control described in section For instance, it uses the same type of lane control that is required for speed harmonization and queue warning. Hence, it is beneficial to consider this strategy for use in the I 80 ICM system as part of intermediate (5 10 years) projects if an appropriate merge falls within the section selected for overhead signs and lane control. Conclusion Junction control will be considered at the I 580 eastbound merge. Construction Site Management Many of the ATM strategies described in this chapter support the management of construction sites. Whenever possible, existing tools or the new tools which we will develop should use in order to assess the impacts of short term construction projects on congestion in order to optimize project timing (11). Evaluation and Assessment Construction zones impact the trip reliability and the safety of the corridor. The use of ATM systems on the freeway during construction offsets many negative impacts of the work zone. If the ATM systems are already installed in the corridor then it would be appropriate to use the systems to improve the conditions at construction sites. Conclusion Construction site management will be included in the I 80 ICM project Ramp Metering The purpose of a ramp metering system is to control the total traffic flow entering the freeway during periods of congestion and break up the platoons of vehicles, thereby creating a balanced traffic flow on the freeway while minimizing the impacts of merging traffic. A balanced ramp metering approach can accomplish this while also minimizing the queuing on the freeway on ramps. The benefits of ramp metering are more dramatically demonstrated on multi lane freeway on ramps. The ramp meter smoothly converts the multi vehicle stream of traffic into a single stream in preparation for the freeway merge. The result is a safer merge into the freeway stream and a reduction in ramp related crashes. When ramp entry is less turbulent, a single vehicle is more readily accepted onto the freeway. There is a perception that ramp metering will provide a faster trip for the long distance commuters, who enter the system at the Carquinez Bridge, at the expense of the users who make shorter trips along the project corridor. However, ramp metering is used in numerous jurisdictions around the country and many jurisdictions, have observed benefits to both the safety, and mobility for all users. For instance, in Denver, after the installation of ramp meters, there was a 50% reduction in rear end and side swipe crashes. In addition, Minneapolis had a 24% reduction in peak period crashes. Seattle had a 52% reduction in average travel time, while Denver had a 57% increase in average peak travel speed. Similar results have been observed at other locations around the country (U.S. Department of Transportation Federal Highway Administration 2008). Therefore, any ramp metering strategy needs to be implemented along with other Integrated Corridor Mobility (ICM) and Freeway Management System (FMS) strategies. 40 October 14, 2010
56 Adaptive Ramp Metering (ARM) has both local control and system wide control. The local control is based on local density, while the system wide control adjusts ramp metering rates by reducing volume from ramps upstream of a bottleneck. The ARM method has the ability to prevent congestion, instead of reacting to existing conditions. This solution needs a comprehensive mainline detection system to be in place. In addition to recurring congestion, system wide adaptive ramp metering can also manage freeway incidents, with more restrictive metering upstream and less restrictive metering downstream of the incident. Authorities can monitor and control the entire system from a traffic operations center, and can remotely override or reprogram controllers. Fixed Time Ramp Metering Fixed time ramp metering is the simplest form of metering and is used to break up platoons of entering vehicles into single vehicle entities. This strategy is typically used where traffic conditions are predictable and the metering rate is programmed by time of day. The advantage is the relative simplicity of the equipment, with no requirement for detection. The disadvantages include, more restrictive metering, higher violations of the meter (16) and additional driver frustration when the freeway flows are low since there is less optimization of the release of queued vehicles. Motorists often perceive this method of operation as non responsive. The communication cost for pre timed meters is the least of any metering type. The only requirement is for the controller to communicate back to the center to confirm that the schedule is correct, or to upload and download controller data. Where there is a concern about a ramp queue spilling into the cross street then queue length detectors could be implemented. The detector would alert the ramp meter when the queue is about to spill into the cross street. The ramp metering could then be changed to another preset meter rate or turned off. Local Traffic Responsive Ramp Metering This strategy uses input from detectors in the vicinity of the ramp to determine the discharge rate on the ramp. With this solution the relationship between freeway flow and ramp demand is pre defined in the controller data. The detectors (shown in Figure 5 6) count the ramp demand, the ramp discharge and the freeway traffic. A response table is stored in the local controller and an appropriate metering rate for the ramp is implemented. This method treats ramps as discrete units rather than as part of a system. Since it accommodates ramp queuing and uses a higher meter rate when freeway flow is lower, it gives the appearance of an intelligent response and usually maintains a reasonable violation rate. This solution uses an algorithm to determine the discharge rate. The main complaint with the original versions of these algorithms was they were reactive and adjusted the metering rates after the freeway congestion occurred. To address this concern, more sophisticated predictive algorithms have been developed to anticipate the operational problems before they occur. The communication requirements for isolated ramps with an adaptive control strategy include the communication from detectors to the controller and from controller to a central management system. 41 October 14, 2010
57 Figure 5-6 Typical detector layout for Local Traffic Responsive Ramp Metering (17) Adaptive Ramp Metering Operation ARM operation seekss to optimize a multiple ramp section of highway, often with the control of a bottleneck as the ultimate goal (16). The operations strategy is similar to the Local Traffic Responsive Ramp Metering; however, multiple response strategies can be deployed based on modeled conditions through the use of a virtual intelligence engine. The effect of diversion can be spread over several ramps instead of relying on a single ramp to provide complete remediation. For example, when three ramps are restricted by 50 vehicles per hour, 150 more vehicles more can enter at a fourth adjacent ramp. ARM can manage recurring congestion and freeway incidents. Freeway incidents can be managed through the use of more restrictive metering upstream and less restrictive metering downstream of the incident. Authorities can monitor and control the entire system from a traffic operations center, and can remotely override or reprogram controllers. The hardware and software requirements for this mode of operation are the most complex of the three, requiring detectors upstream and downstream of the ramp, as well as a communication medium and central computer linked to the ramps. An ARM system: Detects speed and volume of traffic immediately upstream and downstream of the freeway on ramp; and speed of Detects the volume of traffic on the freeway on ramp; Communicates with ramp metering nodes at upstream locations to determine volume freeway traffic approaching the on ramp; Prioritizes the promotion of different lanes of traffic ontoo the freeway; Coordinates the regulation of freeway capacity; traffic volume at on ramps along the freeway to prevent the loss of 42 October 14, 2010
58 Adjusts ramp metering rates based upon: conditions on freeway upstream of on ramp, conditions on freeway at the on ramp, and conditions on freeway on ramp itself; and Is managed remotely at a central control center. The detector technologies required for ARM must measure vehicle volume, occupancy and speed. The accuracy of these detectors must be comparable to the accuracy of loop detectors with the same level of latency. The layout of the detectors at each ramp is determined based upon the: Number of lanes available for ramp storage; Effect on adjacent streets in case of queue spillback into the upstream intersection; Probability of queue spillback; Presence of auxiliary lanes; and Ramp Metering Algorithm. On existing ARM systems, the location of the detectors typically complies with the following guidelines: Upstream mainline detector approximately 500 to 1,000 feet upstream from the on ramp gore, provided it is not beyond the next ramp entry or exit; Downstream mainline detector at the end of the merge area, if there is no auxiliary lane; If there is an auxiliary lane, downstream mainline detector approximately 1,000 feet downstream, but no more than halfway to the next off ramp; Control vehicle detectors in the two right lanes approximately 100 feet upstream of the on ramp gore; Check in detector at the metering stop line; Queue detector approximately 30 feet downstream of potential intersection blockage point (may require more than one detector if ramp entry is channelized); and Depending on the available locations, the mainstream detectors may perform multiple functions. When ramps are relatively close, a downstream detector may also be used as the upstream detector for the next location. The upstream detectors may also be in locations adjacent to those required for the speed harmonization component of the project. Furthermore, they may also provide both functions, provided that the communications and data input processes are compatible. Adaptive ramp metering requires detectors upstream and downstream of each ramp, as well as a communication system and central computer linked to the ramps. The typical ramp layout identified by FHWA is shown in Figure 5 7. This may be different from existing typical ramp layouts installed on other corridors by Caltrans District October 14, 2010
59 Figure 5-7 Typical detector requirements for adaptive ramp metering (17) Following Caltrans ramp meter design guidelines, geometric ramp design for operational improvement projects (including ramp meters) must be based on current (less than two years old) peak hour traffic volume. For this application, peak hour traffic data must be from the annual Traffic Volumes book or studies that are less than two years old. Freeway to Freeway Ramp Metering Freeway to Freeway Ramp Metering is treated as a special case because of its specific challenges when compared to normal freeway ramp metering and merge control. It is used on some occasions to provide control to balance an unbalanced lane configuration. Ramp Closures Ramp Closures can be permanent, temporary or scheduled closures. Closures usually involve deploying automatic gates, manually placing barriers at the ramp entrance, or prohibiting turning movement towards the ramp to prevent access to the ramp. Due to the relatively high impact on existing traffic patterns, ramp closures should be compared with other viable and available options and carefully considered before deployment. Permanent ramp closure is best applied as a last resort for severe safety problems. Temporary or scheduled closures may be applicable for reducing potential vehicle conflicts that may result from construction, major incidents, emergencies or special events. Evaluation and Assessment Fixed time ramp metering is relatively cheap to implement but it is not very responsive to local conditions. Therefore any timing that will be installed will only address an average condition. This timing will lead to 44 October 14, 2010
60 either increased queue length on the freeway or queues at the freeway on ramps whenever conditions deviate from normal. These limitations of fixed time ramp metering are sufficiently great in the view of the local jurisdiction for them not to support this strategy. Local traffic responsive ramp metering is considered the minimum level of sophistication acceptable for this corridor. Local traffic responsive ramp metering addresses some of the potential negative impacts of fixed time ramp metering, but does not necessarily address the primary objection of jurisdictions close to the Bay Bridge (short distance travelers suffer in favor of long distance travelers). This corridor has many of the characteristics that are present in other successful ramp metering systems. ARM has the ability to substantially improve operations on the freeway; at the same time, it also addresses the concerns of local agencies that fear the potential negative impacts of ramp metering. ARM is therefore considered for inclusion in the I 80 ICM system. In further development of this concept there will be a ramp meter controller at each ramp that is also connected to each detector located within each on ramp meter sub system. Each ramp controller will communicate with a central control system or field master controller. The detailed ramp metering plan (to be developed separately from this report) will define the number of field masters. The field masters, if used, will have a communication path to the Caltrans District 4 TMC. Within this corridor there are four conditions that are possible candidates for Freeway to Freeway Ramp Metering. The four sites are where: westbound I 580 merges with eastbound I 80; northbound I 880 merges with eastbound I 80; eastbound I 580 merges with westbound I 80; and westbound SR4 merges with westbound I 80. After consultation with Caltrans District 4 the I 880 and I 580 northbound interchanges are deemed not suitable for Freeway to Freeway ramp metering due to the limited storage area. Ramp closures can also be used for incident management purposes. In the event of an incident on the freeway, on ramps in the area could be closed to prevent further congestion. The off ramps would remain open to allow people to detour around the incident. Moreover, closing the on ramps dynamically could also help the incident response team because it allows them to use the closed ramps to access the incident. However closure of the ramps would have an adverse impact on the traffic flow on the adjacent local arterial. Conclusion Adaptive ramp metering is an appropriate strategy for use in this corridor. Local traffic responsive ramp metering should be considered as an interim step on the path to ARM and is the minimum acceptable level of sophistication for this corridor. Fixed time Ramp Metering is not an appropriate strategy for consideration in the I 80 ICM system. Ramp closures are not an appropriate strategy for consideration in the I 80 ICM system. 45 October 14, 2010
61 Dynamic Rerouting Dynamic rerouting and provision of reliable traveler information are critical components of a successful ATM system. They provide users with viable alternatives and are especially beneficial to reducing the impact of non recurrent congestion (11). Specific elements of the operational strategy include the following: A commitment to providing alternate route information to roadway users in response to nonrecurrent congestion; Adequate installation of overhead sign structures along a facility at critical locations to ensure that sufficient advance notice of alternate routes is provided; Deployment in conjunction with speed harmonization and temporary shoulder use (if used); Connection to a traffic management center that serves as the focal point for the system; Connection to adjoining traffic management centers to coordinate alternate route information based on roadway conditions and special events in adjoining regions; and Coordination with local communities to minimize the impact of alternate route information on the arterial network. Evaluation and Assessment Dynamic rerouting could provide significant benefits in the event of an incident within the corridor. It will reduce the effect of the incident on the travel times of the vehicles traveling through the corridor. However it may also have the effect of increasing the travel time and congestion level for the users that are travelling on the alternate route. The project stakeholders have determined that the negative effect on local vehicles caused by directing freeway vehicles onto the local out ways the benefit that the freeway vehicles will obtain by being diverted to onto the local arterial. The positive effect of directing those vehicles on the arterial back to the freeway downstream of any incident justifies the implementation of a dynamic rerouting system. Conclusion Dynamic rerouting will be included in the I 80 ICM project with careful consideration. Advanced Traveler Information Information can be provided in real time to motorists on the freeway via CMS, highway advisory radio (HAR), Internet and by telephone, thereby assisting motorists managing their journey through the corridor more effectively. Providing traveler information may decrease congestion; it encourages travelers to use transit options and/or travel when congestion is lower. This information can be provided to show the travel time using the freeway compared to the travel time from the closest transit route. If the transit time is consistently lower than the driving time, motorists may change their mode of travel. 46 October 14, 2010
62 Providing traveler information during an incident could assist Caltrans District 4 with controlling the flow of vehicles. The information provided could inform drivers about the severity of any congestion or incident and encourage these motorists to stay on the freeway. Changeable Message Signs CMS s provide advisory information such as incidents, events, construction and maintenance, road closures, and travel time to en route motorists. The primary function of the CMS is to provide real time congestion or incident information to travelers so that they can make informed choices of their travel mode or route. Other signs may be relevant for different applications. Currently Caltrans District 4 uses the CMS to provide travel time information to major destination points. In the future equivalent transit times will be displayed on the CMS in addition to the freeway travel times in order to encourage mode shifts. CMS s are sometimes the cause of congestion as drivers slow down to read the messages on the signs. Therefore, the number and size of the signs (and the individual messages) should be carefully planned and designed. CMS s will be included in the I 80 ICM system. Trailblazer Signs Trailblazer signs can provide route guidance information to drivers along the arterials. The purpose of trailblazer signs is to supplement the CMS to assist in rerouting vehicles during an incident. The process of rerouting traffic should be coordinated with the CMS on the freeway under the following circumstances: Provide information to motorists to guide them along an alternate route if they divert off the freeway during an incident; Provide motorists with information to use alternate routes to avoid the incident when an incident is detected on arterials within the I 80 corridor; and Provide motorists with information to return to the freeway beyond the location of an incident on the freeway. Trailblazer signs should be located along major arterials in advance of major connectors to the freeway. Placement of signs along these routes should be determined on a site by site basis, taking into consideration local conditions such as driveways, available power, communication sources, utilities, and road geometry. Trailblazer signs will be essential for efficient route diversion within the corridor and will be included in the I 80 ICM system. Highway Advisory Radio HAR is a means of providing traffic information via AM radio to travelers. Upstream of the HAR transmitter, travelers are instructed by a sign to tune their vehicle s radio to a specific frequency. Information is typically relayed to the users by a prerecorded message, although live messages can also be broadcast. 47 October 14, 2010
63 HAR can potentially reach all drivers, as most vehicles are equipped with an AM radio. The costs of implementing and maintaining HAR system are low compared to the overall costs of a regional freeway management system. HAR does not require drivers to purchase additional equipment or pay for the information. The limitations of HAR lie mainly in the unidirectional and ubiquitous nature of the radio transmission. Travelers cannot select specific types of information nor can they have two way communication to obtain more detailed information, such as a route choice. Moreover, the amount of information that can be transmitted is limited to a few minutes. Message transmissions at the transmitter can be controlled either on site or from a remote location. Message signs can be dedicated to a specific HAR transmitter and be turned on, or off using commands initiated on site or remotely. The HAR devices and their signs can be controlled by the HAR Management Server. This is how the Caltrans District 4 HAR system operates today. The Bay Area HARs operated by Caltrans District 4 use the 840 KHz AM band. The types of information communicated via HAR can include the following: Warning of roadway incidents or congestion; Warning of adverse conditions (fog, rain, etc); Notification of highway construction or maintenance; Alternate route information; and Advisories within and regarding transportation terminals (airports, special events, and other major traffic generators). The following parameters have been used by agencies across the country to ensure that HAR reaches its full potential as a traveler information tool: HAR information should be clear, accurate, real time, and relevant to the travelers; HAR should be operated on a 24 hour basis; Some kind of programming should always be on the air; HAR should provide a strong, clear, static free signal. Higher frequencies in the AM band have less noise; At least one qualified person per work shift should be responsible for managing the HAR operation to ensure the HAR operation is in optimal working condition and that the messages are relevant; and HAR operators should know the message status at all times. HAR is a low maintenance system in terms of financial and staff resources. In general, anyone who holds an FCC General Radio Telephone Operator license is qualified to maintain an HAR system. HAR transmitters are either analogue or digital. Caltrans District 4s current system is able to support both types; however digital transmitters are recommended for new installations because they have more functionality and better quality sound. Digital transmitters must communicate with the TMC via 48 October 14, 2010
64 Asymmetric Digital Subscriber Line (ADSL) or General Packet Radio Service (GPRS) technologies. In cases where ADSL, GPRS or other Ethernet based communication links are not available, a regular phone lines (POTS) may be used with an analog transmitter. It is important for the location of each proposed HAR antenna to have a ground plane of about 30 meters radius without the presence of underground utilities or other metal objects. According to vendors, fixed HAR systems with current generation digital transmitters are capable of covering a 4 8 mile radius and mobile HAR systems are capable of covering a 2 5 mile radius in flat open terrain. HAR is suitable for application to this corridor and will be included in the I 80 ICM system complimenting the existing HAR devices. Extinguishable Message Signs Extinguishable message signs are generally used in congunction with HAR to indicate that a relevant message is being broadcast. Typically the sign flashes a fixed message such as Tune Radio 840 AM The extinguishable message sign (EMS) has a controller that listens to the HAR messages broadcasted on a specific Radio frequency. In older equipment, the EMS became operational whenever the HAR device was broadcasting a message. In current equipment, it is possible to control signs on the eastbound and westbound separately. This will be included with the HAR component of the project. Public Broadcast Stations Traveler information dissemination through the most popular media such as radio and TV is one of the best means to provide useful information to the public. The radio and television stations in the Bay Area could be contacted to explore options to provide video streams or other data to the stations. It is anticipated that there will be no cost to the program for these types of activities, except the costs of coordination and development of agreements. For example, KGO already has a direct link to the California Highway Patrol (CHP) CAD for incident information. Stations currently broadcasting traveler information are listed in Table 5 1. This will be continued. Connection of the I 80 ICM with SF Bay Area 511 will facilitate the flow of information, as described below. Table 5-1 Bay Area Stations Providing Traveler Information Television Stations KTVU Fox Channel 2 KRON Channel 4 KPIX CBS Channel 5 KGO ABC Channel 7 KNTV NBC Channel 11 Radio Stations KSFO 560 AM KNBR 680 AM KCBS 740 AM KGO 810 AM KPIX 1550 AM KQED 88.5 FM KFRC 99.7 FM or 610 AM 49 October 14, 2010
65 Personalized 511 The Bay Area 511 system provides up to the minute information on traffic conditions, incidents and driving times, schedule, route and fare information for the Bay Area s public transportation services. The 511 system is a free phone and Web service (511.org) that consolidates transportation information from multiple sources into a consistent resource. The information collected from the I 80 corridor system including vehicle detectors and closed circuit television (CCTV) cameras as well as from other sources, such as CHP reports, has been and will continue to be an integral part of the 511 system information sources. Enhancement of information collection due to the addition of surveillance devices will feed more comprehensive, detailed, and accurate traffic data in the I 80 corridor to the 511 system; it will enable the 511 system to provide traveler information with higher quality to the frequent travelers of the I 80 corridor. Meanwhile, the 511 system s reliability can be further improved during the process. Evaluation and Assessment Improving communication with travelers will enhance the ability of the corridor management to manage the demand on the corridor and react appropriately to events within the corridor. There are a variety of communication systems currently available in the corridor and a number of systems that can easily be implemented or expanded upon to assist with the management. The use of these systems is fundamental to the project achieving its goals and objectives. Conclusion Advanced personalized traveler information will be included in the I 80 ICM project. The project will include a combination of CMS s, Trailblazer signs, HAR s, Personalized 511 and the continued use of the public broadcast stations. Traffic Signal Synchronization Traffic signal synchronization is a method of timing groups of traffic signals along an arterial to provide for the smooth movement of traffic with minimal stops. The quality of the resulting progression is a function of the spacing of the signals, prevailing speed, amount of traffic coming in and out of driveways between traffic signals, uniformity of intersection sizes, and cycle length. The traffic volume and the proportion of the green time given to the preferred movements are also important. The use of traffic signal coordination is widespread within the corridor. However, it is generally achieved with fixed cycle length patterns that are implemented based on the time of day (TOD) and the day of the week. This approach does not automatically adjust to changes in traffic patterns. There are three different approaches that can address this inability of the existing system to accommodate changes in traffic volumes during incidents. Manually implement `flush plans previously prepared to accommodate a range of scenarios; Use traffic responsive pattern selection (TRPS) to automatically implement these stored plans when traffic volumes exceed pre set thresholds; and 50 October 14, 2010
66 Use real time adaptive traffic signal operations to develop signal timings in direct response to measured traffic conditions. All three approaches would be suitable for this corridor and are considered for inclusion in the I 80 ICM system. Evaluation and Assessment The coordinated management of the signals in the corridor is required to address all the requirements for traffic throughput and reliability in all traffic conditions. Traffic signal synchronization forms a fundamental component of the I 80 ICM project. Conclusion Traffic signal synchronization will be included in the I 80 ICM project. Centralized Traffic Signal Management Centralized Traffic Signal Management is a strategy whereby the operations of an agency s traffic signals are overseen from a single location, typically a TMC, using a specialized software application loaded onto a server with communications to each field controller. Centralized traffic management systems allows agencies to monitor the operational status of each intersection s controller, detection and communications as well as alter the signal timing plans as necessary using predetermined timing plans or manually in response to an incident. Typically, each local jurisdiction operates a centralized traffic management system to support their traffic signals. Information exchanged between central systems is normally limited to viewing operational status and signal timings. Control of traffic signals by outside agencies is typically allowed on a limited basis, if at all, but could be extremely useful in improving the overall congestion conditions along the I 80 corridor. Evaluation and Assessment A centralized traffic signal management would provide significant benefits for the corridor. During normal operation a centralized traffic signal management system would assist the signal systems on the arterial to remain synchronized, based on the predefined individual timing plans. The centralized traffic signal management system would enable a quicker, more effective and safer response to any incident within the corridor. Conclusion A centralized traffic signal management system will be included in the I 80 ICM project. Transit Signal Priority (TSP) Transit Signal Priority (TSP) is a strategy that facilitates the movement of transit vehicles (usually those in service), either buses or streetcars, through traffic signal controlled intersections. National Transportation Communications for Intelligent Transportation Systems Protocol (NTCIP) standards define Priority as: The preferential treatment of one vehicle class (such as a transit vehicle, emergency vehicle, or a commercial fleet vehicle) over another vehicle class at a signalized intersection without causing the traffic signal controllers to drop from coordinated operations. Priority may be accomplished by a number of methods including changing the beginning and end times of greens on identified 51 October 14, 2010
67 phases, the phase sequence, inclusion of special phases, without interrupting the general timing relationship between specific green indications at adjacent intersections. Objectives of TSP include improved schedule adherence and improved transit travel time while also minimizing impacts to normal traffic operations (18). Expected benefits of TSP vary depending on the application, but include schedule adherence and reliability and reduced travel time for buses, thereby leading to an increased transit quality of service for the riders and an increased ridership. TSP can be implemented in a variety of ways including passive, active and adaptive priority treatments (18). Passive priority operates continuously, based on knowledge of transit route and ridership patterns, and does not require a transit detection/priority request generation system. In general, when transit operations are predictable with a solid understanding of routes, passenger loads, schedule, and/or dwell times, passive priority strategies can then be an efficient form of TSP. However since the signals are coordinated for the flow of transit vehicles and not other traffic, other traffic may experience unnecessary delays, stops and frustration. Active priority strategies provide priority treatment to a specific transit vehicle following detection and subsequent priority request activation. A green extension strategy extends the green time for the TSP movement when a TSP equipped vehicle is approaching. An early green strategy shortens the green time of preceding phases to expedite the return to green for the movement when a TSP equipped vehicle has been detected. Other active priority strategies include actuated transit phases that are only displayed when a transit vehicle is detected at the intersection and modification of coordinated offsets between intersections when a transit vehicle is detected. TSP with adaptive signal control systems provides priority while simultaneously trying to optimize given traffic performance criteria. To take advantage of adaptive signal control systems, TSP would typically require early detection of a transit vehicle in order to provide more time to adjust the signals to provide priority while minimizing traffic impacts. Evaluation and Assessment TSP will improve the reliability of transit within the corridor. This will support the project goals of improving transit trip time reliability and promoting mode shift to transit. The implementation is not complex. The solution would add significant benefits to the corridor without dramatically affecting the project cost or timeline. Conclusion A TSP system will be included in the I 80 ICM project. Emergency Vehicle Pre-emption (EVP) Emergency Vehicle Pre emption (EVP) is a strategy that facilitates the movement of vehicles by interrupting the normal process for special events such as emergency vehicles responding to an incident. Objectives of EVP include reducing response time to emergencies, improving safety and stress levels of emergency vehicle personnel, and reducing crashes involving emergency vehicles at intersections. National Transportation Communications for Intelligent Transportation Systems Protocol (NTCIP) standards define Pre emption as: 52 October 14, 2010
68 Pre emption is the transfer of the normal control (operation) of traffic signals to a special signal control mode for the purpose of servicing railroad crossings, emergency vehicle passage, mass transit vehicle passage, and other special tasks, the control of which requires terminating normal traffic control to provide the service needs of the special task. Evaluation and Assessment EVP will provide benefits to the incident management capabilities within the corridor. It will improve the travel reliability and safety in the corridor when an emergency vehicle is traveling in the corridor while responding to an incident. The technology required to implement the EVP system in the corridor is mature. The implementation is not complex. The solution would add significant benefits to the corridor without dramatically affecting the project cost or timeline. Conclusion An EVP system will be included in the I 80 ICM project. Transportation Transit Information Sharing Separate from the TSP strategies discussed earlier, Transportation Transit Information Sharing involves the exchange of data between those operating the transit system and those operating the roadways upon which the transit vehicles travel. More often than not, the information exchanged between transit dispatch staff and TMC personnel is via phone and fax. By automating the data outputs from their respective systems, transit dispatch and TMC staff can more efficiently alert each other of pertinent issues such as a major incidents that will delay transit service or transit vehicle breakdowns that will cause unexpected congestion, with the overarching goal of improving operations along the corridor. Evaluation and Assessment Improving the flow of Transit communications within the corridor will enhance the operation of Transit vehicles within the corridor. This supports the project goals by improving the reliability of transit solutions and increasing the benefit of using transit as compared to using single passenger vehicles within the corridor. The sharing of information can be accommodated via the center to center data communication system. The addition of this functionality to the center to center data communication will significantly affect the project cost or timeline and will provide significant benefits to the project. Conclusion Transportation Transit Information Sharing will be included in the I 80 ICM system. Improved Incident Response Separate from the EVP strategies discussed earlier, Improved Incident Response for this project involves establishing and/or automating the information exchange between those operating the roadways and those who respond to incidents and emergencies on those roadways. While CHP and Caltrans District 4 staffs are collocated in the District 4 TMC, automated information exchange between local agency transportation and emergency response staff and between Caltrans District 4/CHP and local agencies will aid in shortening the incident response and clearance times and result in an improved traffic flow along the corridor. Information exchange can take the form of providing the transportation staff a feed from the 53 October 14, 2010

69 CAD systems; in addition, the emergency response staff can receive a feed from the local agencies centralized traffic control systems. Evaluation and Assessment Improving incident responsiveness in the corridor is fundamental to the success of the I 80 ICM project. Integrating the existing communication systems and providing additional TMC capabilities at the District 4 TMC will assist with achieving this requirement. Conclusion These improved incident response elements will be included in the I 80 ICM system. Smart Park Smart Park facilities (Figure 5 8) are enhanced parking facilities that offer real time information useful to drivers. It not only includes parking space availability, but it can also provide information about freeway and transit travel times, and next bus arrivals. They can be located on arterials to benefit local users before they approach the freeway. The Smart Park concept includes the ability to provide information to the user at all points within the trip: en route to the P&R facility, within the lot, on the transit vehicle, etc. In order to support these communications requirements ITS infrastructure is required because it is capable of tracking individual transit vehicles, detecting and managing recurring and incident related traffic congestion. Figure 5-8 Smart Park Facility Evaluation and Assessment Smart Parks are compatible with the nature of this corridor and the objectives of the ICM program. They will proactively encourage mode shift in the corridor and increase the volume of people passing into and through the corridor without an associated increase in congestion levels. Conclusion Elements of Smart Parks are worthy of consideration for the I 80 ICM system. 54 October 14, 2010
70 Dynamic Truck Restrictions Truck restrictions implemented on a regional or national basis offer the opportunity to more effectively segregate vehicles when implementing a variety of proactive lane management strategies; these strategies are not compatible with the safe operation of trucks in particular lanes (11). Specific elements of the operational strategy should include the following: Enabling legislation and related laws to allow dynamic truck restrictions; An expert system that deploys the strategy based on prevailing roadway conditions without requiring operator intervention. It is critical that this expert system be reliable and accurate to gain the trust and acceptance of the public; Uniform signing and marking to indicate truck restrictions are in effect; Adequate installation of overhead sign structures to ensure that at least one restriction sign is in sight at all times; Deployment in conjunction with speed harmonization; and Connection to a traffic management center that serves as the focal point for the system. Evaluation and Assessment Implementing dynamic truck restrictions would benefit the flow of traffic in the corridor. It would permit increased throughput during periods of peak demand. However implementing dynamic truck restrictions in this corridor would be difficult in the absence of region wide policies and facilities. This strategy needs to be further evaluated and considered in the future. Conclusion Dynamic truck restrictions will not be included in the initial I 80 ICM system. Reversible Lanes Reversible lanes allow one or more lanes the freeway or arterial to shift direction through the day in response to traffic patterns such as morning and evening peaks. There must be a large directional flow during peak periods to make this a viable solution. By using additional lanes in the direction that demands more capacity, congestion can be reduced and overall capacity can be increased. Lane control, signs, and special pavement markings are used to inform motorists of lane direction and movements. Evaluation and Assessment The optimal conditions for reversible lanes are not exhibited in the corridor. Also, this solution will require significant stakeholder input and review in order to obtain the required level of stakeholder endorsement. Conclusion Reversible lanes are not included in thei 80 ICM project at this time. High Occupancy Vehicle Lanes High Occupancy Vehicle (HOV) lanes, also known as carpool or diamond lanes are reserved for vehicles with multiple occupants. HOV lanes provide an incentive for commuters to take the bus, carpool, or vanpool during congested periods by permitting them to bypass areas of traffic congestion. They are 55 October 14, 2010
71 designed to move more people in fewer vehicles. Caltrans/MTC currently manages highly effective HOV operations throughout the Bay Area. Evaluation and Assessment HOV lanes support the project goal of promoting mode shift and increasing the person throughput. The lanes are already in use and appropriate to the size of the corridor. Further expansion of the HOV system is not an immediate requirement for achieving the project goals. Conclusion HOV lanes will be included, without further expansion, in the I 80 ICM project. High Occupancy Toll Lanes High Occupancy Toll (HOT) lanes allow vehicles that do not meet the HOV lane criteria to use the HOV lane on a fee basis. The HOT lane system allows those road users who are willing to pay a fee to use the excess capacity present in the HOV lane. This has the effect of decreasing the travel time for the HOT user and decreasing the travel time for the users in the general traffic lanes. The fee charged for the use of the HOV lane can be either fixed or variable. The simplest method of implementing a HOT system is to charge a standard rate for the single occupancy vehicles to use of the HOV lane; however this may not be the most efficient way to use the HOV capacity. When the congestion in the general traffic lanes is lower then there would an insufficient number of people who would pay for the use of the HOV lane; however when the congestion is high then too many people would be willing to pay, thus exceeding the HOV lane capacity and penalizing HOV qualified vehicles. The more effective method of matching HOT demand with the available capacity of the HOV lane is to use a variable pricing structure. This pricing structure would dynamically adjust the fee charged based on corridor conditions such as; HOV lane congestion level, general traffic lane congestion level, time of day, day of week, type of vehicle. Evaluation and Assessment A HOT solution will require significant stakeholder input and review in order to obtain the required level of stakeholder endorsement. HOT will provide benefits to the corridor and would support the project goals of increasing the throughput of the corridor while still supporting the goal of encouraging mode shift. However the cost and time required implementing a HOT solution prohibits its inclusion in this phase of the I 80 ICM project. Conclusion HOT is currently being implemented on I 680 and I 580 corridor by ACTC/ACCMA and may to be considered for the I 80 corridor in the future, however it is not feasible to include it in the I 80 ICM project at this time. Vehicle Detection The I 80 ICM project FMS applications require volume, speed, occupancy and classification to achieve the intended goals for the project. Initially, the detection will be used for monitoring and managing the freeway mainline traffic during I 80 project construction as part of Traffic Management Plan (TMP) and 56 October 14, 2010
72 will become part of the detection system after the overall completion of the I 80 ICM project for FMS. These parameters are described as below: Volume a measure of traffic demand. The number of vehicles passing a point during a specific period of time; Occupancy a measure of traffic density. The percentage of time that vehicles are present in the detection zone; Speed a measure of the rate of motion of the vehicles. Speed may be measured on a per vehicle basis, or the average speed of all vehicles passing through the detection zone may be measured on a macroscopic basis; and Classification average vehicle length is a method of classifying the different types of vehicles passing through the detection zone. Another method of classifying vehicles is by the number of axles. Detection of vehicle presence, classification, volume and speed can be achieved via loop detectors. Loop detectors consist of an amplifier located in the controller cabinet and coiled wires in the pavement, which create an electrical field. Loop detectors are the most widely used type of vehicle detection because of the flexibility of design. Evaluation and Assessment Vehicle detection is an integral part of the project requirements. The only question is what type of technology will be used to detect the vehicles. Conclusion Vehicle detection will form part of thei 80 ICM project Passive Strategies Passive strategies do not involve the application of ITS solutions to address the congestion issues on the corridor. Instead, these strategies focus on physical improvements to the roadway facilities or administrative actions. Road Widening Road Widening is a passive strategy used to increase physical capacity of the roadway. This strategy requires the availability of right of way at those locations where the roadway is widened. This right of way requirement would make road widening on the freeway difficult and road widening on the arterial near impossible given the project budget and timeframe. The most feasible roadway widening solution would be to widen the roadway at freeway bottlenecks. This would have the advantage of providing extra capacity at those locations that most require the capacity increase whilst limiting the cost, environmental impacts and lead time of this strategy. Evaluation and Assessment The majority of the stakeholders do not support road widening due to the: High cost associated with right of way acquisition, roadway construction and roadway O&M; 57 October 14, 2010

73 Significant environmental impacts associated with the roadway construction and roadway O&M; and Potential for the increased capacity to lead to an increase in vehicles using the corridor. Conclusion Road widening will not be included in the I 80 ICM project. Park & Ride Facilities Park and Ride facilities, as shown in Figure 5 9 are public transportation stations that allow commuters and other people traveling into city centers to leave their personal vehicles in a parking lot and transfer to a bus, rail system (rapid transit, light rail or commuter rail) or carpool for the rest of their trip. The vehicle is stored during the day and retrieved when the commuter returns. The concentration of riders often allows these terminals to be served by express transit service, with a limited number of stops and often provides a faster route if available, such as a HOV lane. The service may only take passengers in one direction in the morning (typically toward a central business district) and in the opposite direction in the evening, with a limited number of trips available in the middle of the day. These facilities generally prohibit overnight parking in the park and ride facility. Overall, these attributes vary from region to region. Park and ride schemes are often marketed as a way to avoid the difficulties and cost of parking within the city center. Park and ride lots allow commuters to avoid the stress of driving in a congested part of their journey and/or facing scarce, expensive downtown parking. The objective is to reduce both of these problems by making it easier for people to take the bus or train to major activity centers. Figure 5-9 Park and Ride Facility 58 October 14, 2010
74 Evaluation and Assessment Additional park and ride facilities are likely to improve travel on the corridor. However, the I 80 ICM project requires a more interactive way to entice drivers to use the facility. Conclusion Park and ride facilities will be included in the I 80 ICM project. Traffic Signal Construction Traffic signals are typically installed at intersections to improve safety, reduce vehicle delays and accommodate pedestrians. Intersections on arterial roads are typically coordinated if they are sufficiently close there the arrival patterns at one intersection are affected by the operation of an adjacent traffic signal. This usually occurs when the spacing is less that ¼ mile, and often up to ½ mile. Within the I 80 ICM corridor, it would be appropriate to install additional traffic signals to assist corridor operation if there were unsignalized intersections that either: reduce the efficiency of movement through the corridor in normal circumstances; or experience increased congestion during incidents and that congestion would be mitigated by signalization. In addition, transit operation would be improved by signalization at locations where buses currently experience long delays waiting for gaps in the traffic stream at unsignalized intersections. Evaluation and Assessment Within the I 80 ICM corridor, the arterial roads used by emergency vehicles approaching the freeway and by vehicles diverting off the freeway to avoid an incident are adequately signalized. There are no locations identified at which signalization would provide any significant benefit to mobility of private vehicles or accessibility of emergency vehicles within the corridor. However, there are some intersections at which bus delays would be reduced by the installation of a traffic signal. Conclusion Additional traffic signals (except to improve transit access) are not considered further for the initial I 80 ICM project. 5.2 Selected Components Each of the Traffic Management Strategies discussed in section 5.1 and 5.2 are listed in Table 5 2. The table summarizes key benefits of each strategy and identifies if the strategy is included in the initial phase of the I 80 ICM project. 59 October 14, 2010
75 Traffic Management Strategy Increased throughput Increased capacity Decrease in primary crashes Decrease in secondary crashes Decrease in incident sensitivity Table 5 2 Evaluation of Traffic Management Strategies More uniform speeds Decreased headways More uniform driver behavior Increased trip reliability Delay onset of freeway breakdown Reduction in traffic noise Reduction in emissions Reduction in fuel consumption Will the strategy be included in the I 80 ICM Project? Speed harmonization No Automated speed enforcement No Freeway shoulder use No Dynamic lane markings No Dynamic merge control No Queue warning Yes Junction control Yes Construction site management Yes Adaptive ramp metering Yes Dynamic rerouting Yes Advanced traveler information Yes Traffic signal synchronization Yes Centralized traffic signal management Yes Transit signal priority Yes Emergency vehicle pre-emption Yes Transportation transit information sharing Yes Improved incident response Yes Smart park Yes Dynamic truck restrictions No Reversible lanes No High Occupancy Vehicle Lanes Yes High Occupancy Toll Lanes No Road Widening No Traffic Signal Construction No The project team received a number of specific requests for projects and concepts to be included in the I 80 ICM project. Many of these specific requests are in line with the project goals and objects and so will be included in the project. These projects will be discussed in more detail in later chapters. Some projects requested meet the needs of the stakeholders, but were not part of the original grant application or may 60 October 14, 2010
76 not meet all of the conditions of the grant application. These projects are considered enhanced projects and will be considered for grant funding because of their importance to the stakeholders. However, if these enhanced projects experience right of way or environmental issues, they will be removed from the project scope. The enhanced project concepts are: AC Transit Bus Pad at Hilltop Park and Ride lot; Berkeley video detection install four video detector cameras for signals at San Pablo Avenue and Gilman, Ashby, and University, and one pedestrian push button at Gilman and 6 th ; El Cerrito intersection improvements Intersection improvements to increase efficiency and prevent queue back ups. The improvements include adding protected left turn phasing at Carlson Blvd. and Fairmont Ave. at their intersections with San Pablo Avenue, adding protected left turn phasing for Central Ave at Carlson Blvd. and, including pedestrian push button and vehicle detection; El Cerrito Del Norte BART Access The purpose of this project is to improve bus access to the El Cerrito Del Norte bus station. Currently buses must make two turn movements to access the bus bays. These turn movements are difficult because of the amount of congestion on Cutting Blvd and San Pablo Avenue. The project proposes to modify Cutting Blvd. east of San Pablo Ave to become a two way street east of San Pablo with a queue jumper lane and signal modification. A bus only eastbound approach through movement is proposed for the intersection of San Pablo Avenue and Cutting Boulevard to improve bus access to the BART station. This improvement would include restriping the eastern leg of the San Pablo Avenue and Cutting intersection to include two way access with westbound movement for mixed vehicle traffic and eastbound movement for transit vehicle traffic only and an additional pedestrian crosswalk. Signal modification would also include converting the current 6 phase operation to a full 8 phase operation with the eastbound through being a transit vehicle only movement; Additional left turn movement at Powell and I 80 WB A westbound left turn movement for bus traffic is proposed at the intersection of Powell Street and Frontage Road for access to westbound I 80. Intersection, signal, and striping modifications are needed to enable the proposed left turn movement for transit vehicles only. Caltrans District 4 opposes allowing left turn movements for mixed flow traffic due to the limited storage length under the freeway interchange; San Pablo Avenue Incident Management in Oakland install fiber optic communication, five CCTV PTZ cameras, and one CMS to provide monitoring and incident management capabilities; Grand Avenue Incident Management in Oakland install fiber optic communication, four CCTV PTZ cameras, and two CMS to provide monitoring and incident management capabilities; West Grand Avenue Incident Management in Oakland install fiber optic communication, one CCTV PTZ camera, and two CMS to provide monitoring and incident management capabilities; Speed Feedback Signs in Pinole install two speed feedback signs on San Pablo Avenue in Pinole to address speeding in downtown Pinole; 61 October 14, 2010
77 Intersection improvements at Appian Way and San Pablo Avenue in Pinole The purpose of this project is to mitigate congestion caused by the limited left turn storage on Appian Way onto southbound San Pablo Avenue. The limited southbound left turn storage and short left turn green on San Pablo Avenue prevents the current signal operation from accommodating the high left turn volume that typically utilizes Appian Way to enter the I 80 freeway in the event of a major freeway incident. As part of the incident management plan, a special event coordination plan is proposed for this signal to increase and hold the southbound through movement and the southbound left turn green from San Pablo Avenue to Appian Way. This would minimize queuing in the southbound leftturn pocket and facilitate return of diverted traffic on the local street to the I 80 freeway. These improvements include the replacement of the signal at San Pablo Avenue and Appian Way; Restripe El Portal and I 80 ramps to improve access; Install two traffic signals at McBryde and I 80 off ramps to improve ramp access; I 80/Central Avenue Interchange Improvement Project the purpose of this project is to manage weekend congestion on Central Avenue and I 80 by closing down the WB I 80 ramps on the weekends and directing traffic to use Interstate 580 (I 580) to access I 80. The I 580 ramp access has more leftturn pocket storage and the vehicles will not interfere with nearby shopping center traffic. The project proposes installing two new signals at Rydin Road and Central Avenue and Central Avenue and I 580 Ramp, modifying the existing signal at Central Avenue and San Joaquin Street, and installing seven dynamic message signs; and Upgrade signals on San Pablo Avenue and crossing arterials in Pinole with pedestrian push buttons and audible crossings. 5.3 Project Elements Not Included The following projects were requested by stakeholders, but were deemed unfeasible due to construction timing issues: Bus Park and Ride lot on Buchanan Avenue at I 80; Dedicated right turn lane on eastbound Marin Avenue at San Pablo Avenue in Albany; Modification to a traffic signal at Ashby and 9 th ; and Bus stop at I 80 WB on ramp in Emeryville. 5.4 Alternatives for Active Traffic Management Implementation There are four alternate ATM field device layouts that are proposed for the I 80 ICM project. These alternatives range in cost and complexity of the installed ATM field devices. These alternatives only vary in their implementation of overhead sign structures (for Lane Use Signs) and end of queue warning zones. The implementation of the other field devices is independent of which Alternative is implemented in the I 80 ICM project. 62 October 14, 2010
78 5.4.1 Alternative 1A Balanced Approach (Focus on Congestion and Incidents in Both Directions) Alternative 1A, as shown in Figure 5 10, focuses Lane Control on the southern section of the corridor and provides VAS across the entire corridor. The westbound direction will have Lane Control operating from the I 580 junction to west of Powell Street and VAS operating from the Carquinez Bridge to west of Powell Street. The eastbound direction will have VAS from Powell Street to the Carquinez Bridge. This alternative focused on reducing the quantity and effect of congestion and incidents in both directions in the corridor, with more intensive focus on the highest area of congestion and incidents, the westbound section from the I 580 junction to west of Powell Street. Therefore this is the only area where overhead sign structures are installed. This alternative does not provide the same level of investment in the eastbound direction as the westbound direction. This alternative meets the intent of the funding application at a cost of $14 million dollars for the installation of the VAS, Lane Control and the CMS Alternative 1B Focus on Incidents in Both Directions Alternative 1B, as shown in Figure 5 11, focuses the Lane Control and VAS elements on the southern section of the corridor. The westbound direction will have Lane Control and VAS operating from the I 580 junction to west of Powell. The eastbound direction will have Lane Control and VAS from the I 80/I 580/I 880 junction to north of University Avenue. This alternative focused on reducing the quantity and effect of incidents in both directions of the southern section of the corridor. This alternative has a lower level of investment in incident management in Contra Costa County, includes the installation of field devices outside the project limits and has no end of queue warning in the northern section of the corridor. This alternative meets the intent of the funding application at a cost of $20 million dollars for the installation of the VAS, Lane Control and the CMS Alternative 2 Focus on Westbound Direction Alternative 2, as shown in Figure 5 12, focuses the Lane Control and VAS field elements exclusively on the westbound direction of I 80. The westbound direction will have Lane Control operating from the I 580 junction to west of Powell Street and VAS operating from the Carquinez Bridge to west of Powell Street. This alternative focuses on reducing the quantity and effect of congestion and incidents in the westbound direction since the westbound direction accounts for 60% of the corridors congestion and incidents. This alternative does not provide the same level of investment in the eastbound direction as the westbound direction, providing no end of queue warning in the eastbound direction. This alternative meets the intent of the funding application at a cost of $14 million dollars for the installation of the VAS, Lane Control and the CMS. 63 October 14, 2010
79 5.4.4 Alternative 3 Low ATM Investment Alternative 3, as shown in Figure 5 13, is the lowest cost option. This alternative does not install any End of queue warning or Lane Control elements in the corridor. Without these field elements the project risk and complexity is lowered, the cost is lowered and the visual impact on the corridor is lowered. This alternative does not address incidents or congestion effectively in the corridor. Without the installation of these field elements the project funding and timeline may be in jeopardy because the project will no longer meet the intent of the CTC funding application and the local agencies may remove their support for the project. This alternative does not meet the intent of the funding application but only costs $4 million dollars for the CMS. 64 October 14, 2010
80 Figure 5-10 ATM Alternative 1A 65 October 14, 2010
81 Figure 5-11 ATM Alternative 1B 66 October 14, 2010
82 Figure 5-12 ATM Alternative 2 67 October 14, 2010

83 Figure 5-13 ATM Alternative 3 68 October 14, 2010
84 5.5 Operational Concept of System The system will be implemented to manage the freeway, arterials and linking roads between the freeway and arterials in the I 80 ICM corridor. Table 5 3 identifies all the roadways that are included in the project area. Table 5-3 Project Roadways Route Extents Type of Road I-80 Freeway Carquinez Bridge (Contra Costa County) and the San Primary Freeway Francisco Bay Bridge Toll Plaza (Alameda County) San Pablo Avenue 17th Street to Cummings Skwy Primary Arterial West Grand Linking Arterial Wake Ave to Broadway Avenue Grand Avenue Broadway to Lake Park Ave Linking Arterial Lakeshore Avenue El Embarcadero to Lake Park Ave Linking Arterial Powell Street Frontage Rd to San Pablo Ave Linking Arterial Ashby Avenue 7th St to San Pablo Ave Linking Arterial University Avenue 6th St to San Pablo Ave Linking Arterial Gilman Street 6th St to San Pablo Ave Linking Arterial Buchanan Street I-80 (West) to San Pablo Ave Linking Arterial Central Avenue I-80 (West) to San Pablo Ave Linking Arterial Carlson Boulevard Huntington Ave to San Pablo Ave Linking Arterial Potrero Avenue Eastshore Blvd to San Pablo Ave Linking Arterial Cutting Boulevard I-80 (West) to San Pablo Ave Linking Arterial San Pablo Dam Linking Arterial I-80 (East) to San Pablo Ave Road El Portal Drive I-80 (East) to San Pablo Ave Linking Arterial Hilltop Drive I-80 (East) to San Pablo Ave Linking Arterial Richmond Parkway I-80 (East) to San Pablo Ave Linking Arterial Fitzgerald Drive I-80 (East) to Appian Way Linking Arterial Appian Way I-80 (East) to San Pablo Ave Linking Arterial Pinole Valley Road I-80 (East) to San Pablo Ave Linking Arterial Willow Avenue I-80 (East) to San Pablo Ave Linking Arterial Cummings Skyway I-80 (East) to San Pablo Ave Linking Arterial Listed in Figure 5 14 are each of the five I 80 ICM system groups and the systems that are incorporated into each system group. Each of the system groups contains one or more systems that will be used to manage the corridor. Each system group and the associated systems are detailed further in the following sections of the chapter. 69 October 14, 2010
85 Freeway Management Systems ATMS (Variable Advisory Speed and Lane Use Signals) Adaptive Ramp Metering Changeable Message Signs Highway Advisory Radio Travel Time Information Traffic Monitoring (CCTV System) Arterial Management Systems Traffic Signal Synchronizatoin Traffic Signal Interconnectt Emergency Vehicle Preempition Transit Signal Priority Trailblazer Signs Traffic Monitoring (CCTV System) Traffic Monitoring and Surveillance Systems Traffic Detection Traffic Monitoring Traveler Information Systems Chanageable Message Signs Highway Advisory Radio Personalized 511 System Comparitive Travel Times Parking Information System Transit Management Systems Transit Signal Priority Figure 5-14 Systems in Scope These systems will be primarily managed via a purpose built centralized management application. The I 80 Management Application will control each system, based on the current corridor conditions. The system will be located in the Caltrans D4 TMC. Primarily the system will be operating automatically, without the requirement for user intervention. In this way the system will be able to quickly react to the prevailing conditions. The system will not need to wait for an Operator (or other user) to evaluate the existing conditions and determinee the best course of action. This places the onus for managing the 70 October 14, 2010
86 corridor on those users responsible for planning coordinated responses, and away from the Operator who may also have multiple tasks to manage. The system will respond to condition changes as simple as changing congestion levels to as complex as a major incident that requires emergency response and that causes vehicles to seek alternate routes. The I 80 Management Application will also integrate with many other systems. The I 80 Management Application will share information, and where appropriate share control, across jurisdictional boundaries by integrating with the Eastbay SMART Corridor system and each city s traffic signal system. 71 October 14, 2010
87 6 USER-ORIENTED OPERATIONAL DESCRIPTION This chapter focuses on how the goals and objectives are currently accomplished. Specifically, it describes strategies, tactics, policies, and constraints. This is where the stakeholders are described. Specifically, it covers when, and in what order, operations take place, personnel capabilities, organizational structures, personnel & inter agency interactions, and types of activities. This may also include operational process models in terms of sequence and interrelationships. 6.1 Stakeholders There are numerous stakeholders, including institutions and agencies, which play key roles in the operation and management of the Interstate 80 (I 80) corridor. Alameda County Congestion Management Agency (ACTC/ACCMA) has taken the lead to organize the stakeholders along the corridor for the purpose of this project. The roles and responsibilities of the main stakeholders, related to the I 80 Integrated Corridor Mobility (ICM) project, are described below. The project stakeholders can be separated into three separate groups: workers, oversight agencies, and users Workers A worker group describes those stakeholders that participate in the operation or maintenance of the system. Caltrans District 4 The California Department of Transportation (Caltrans) is the owner operator of all state highways, and is comprised of twelve regional districts with their headquarters office in Sacramento. Caltrans District 4 encompasses the nine Bay Area counties, and its headquarters are in downtown Oakland. Caltrans District 4 is responsible for the planning, design, construction, maintenance, and operations of more than 1,425 miles of Bay Area highways and freeways. District 4 has eight separate divisions, each with responsibilities ranging from Program Management, Planning, Design, Construction, Maintenance, and Operations. The Division of Operations is the division that will be primarily involved with ICM activities. The following six offices in the division will play an active role in the ICM demonstration: Office of Traffic Operations Strategies develops and implements a Traffic Operations Strategic (TOPS) Plan for Caltrans District 4. The plan provides guidance and establishes priorities for traffic operations, coordination with adjoining Caltrans Districts, and presenting and promoting the plan to local and regional transportation partners; Office of Truck Services coordinates truck and freight activities to ensure that they are appropriately considered in all transportation decisions; Office of Highway Operations reviews and performs all traffic operational analyses, including corridor studies, interchange and intersection analyses. This office also identifies and develops operational improvement projects; Office of Traffic Management coordinates work on the freeways in the Bay Area to minimize the impact of construction and maintenance activities on the traveling public; 72 October 14, 2010
88 Office of Traffic Systems plans and develops the Traffic Operations Systems (TOS) and Park & Ride Lot operations for the District. TOS includes traffic monitoring stations, ramp metering systems, CCTVs, CMSs and HARs. The Office also develops intelligent transportation strategies with its transportation partners, and operates and maintains over 200 ramp meters in the Bay Area. In addition, the Office operates the District 4 Traffic Management Center (TMC); Office of Traffic is primarily involved in traffic safety issues. It designs and reviews the plan of signing and striping components for Bay Area freeways, maintains sign logs and photo logs, maintains crash records, provides services for Legal and Claims, conducts speed zone studies and administers the District s Traffic Safety Program; and Office of Electrical Systems is responsible for managing all electrical equipment that is installed in the field, plus the network equipment that is connected to those field devices. Caltrans District 4 roles and responsibilities include: Freeway Planning and Management; Operate and maintain the field devices located on the freeway, including; Vehicle detectors; CCTV cameras; Changeable Message Signs (CMS); Variable Advisory Speed (VAS) signs; Ramp meters.; Traffic Signals at the base of freeway on ramps; Caltrans District 4 TMC staffing and operations; Freeway Incident Management; Providing Traveler Information to the SF Bay Area 511 system; and Define and implement this project. City Agencies and Local County The I 80 ICM demonstration corridor is located within Alameda County and Contra Costa County. The corridor is nine cities, including: Oakland, Albany, Pinole, San Pablo, Richmond, El Cerrito, Berkeley, Hercules, and Emeryville. Each local agency has an economic and political interest in the efficient management, maintenance, and operations of the I 80 corridor. The cities and counties maintain the local transportation system and operate fire departments and law enforcement for incident response within their jurisdiction. Local agencies roles and responsibilities include: Operate and maintain central traffic signal control system; 73 October 14, 2010
89 Surface street management; Maintenance of all field devices located within the jurisdiction; Share video and data from all field devices and traffic control systems with other stakeholders; Operate and maintain emergency vehicle preemption equipment at signalized intersections; Operate and maintain transit signal priority timings equipment at signalized intersections; Incident Management; Coordinate with surrounding agencies to activate trailblazer CMS for route diversion; and Participate in defining the scope of the project and with interfacing with the system integrator during the implementation phase of the project. AC Transit AC Transit is a regional bus agency serving 364 square miles of Alameda County and Contra Costa County in the eastern San Francisco Bay Area. In addition, AC Transit runs "Transbay" routes across the San Francisco Bay to the City of San Francisco, and to selected areas in San Mateo County and Santa Clara County. Paratransit services for the elderly and disabled are made available to individuals with conditions that preclude them from using public transit. AC Transit is constituted as a special district under California law. It is governed by seven elected members (five from geographic wards and two at large). AC Transit s roles and responsibilities include: Provide local, express, and regional service in the eastern San Francisco Bay Area; Maintain parking availability detection systems and CMS used at "Smart" Park and Ride facilities; Maintain traveler information systems used on board transit vehicles or at transit facilities; Operate the transit priority request generator and the bus dispatch system, including automatic vehicle location equipment needed for preferential treatment; and Participate in defining the scope of the project and with interfacing with the system integrator during the implementation phase of the project. WestCAT The Western Contra Costa County Transit (WCCTA) was established in August 1977 as a Joint Exercise of Powers Agreement between the County of Contra Costa, and the cities of Hercules and Pinole. The agency was created with the purpose of owning, operating, and administering a public transportation system serving the related area. WCCTA is governed by a 7 member Board of Directors and supported by professional staff. WestCAT is a service of the Western Contra Costa Transit Authority. WestCAT roles and responsibilities include: Provide local, express, and regional service to and from the cities of Pinole, Hercules, Rodeo, Crockett and Martinez; 74 October 14, 2010
90 Maintain traveler information systems used on board transit vehicles or at transit facilities; Operate the transit priority request generator and the bus dispatch system including automatic vehicle location equipment needed for preferential treatment; and Participate in defining the scope of the project and with interfacing with the system integrator during the implementation phase of the project. Water Emergency Transportation Authority The San Francisco Bay Area Water Emergency Transportation Authority (WETA) is a regional agency authorized by the State of California to operate a comprehensive San Francisco Bay Area public water transit system. In 2003, the WETA's plan, "A Strategy to Improve Public Transit with an Environmentally Friendly Ferry System" was approved by statute (Senate Bill 915, Ch. 714, stats of 2003). WETA operates a total of eight ferry routes within the San Francisco Bay Area. Oakland Alameda San Francisco is the most popular route. WETA operates the ferry routes within the San Francisco Bay Area. BART BART is a special governmental agency created by the State of California to operate the Bay Area s rapid rail system. The District consists of Alameda County, Contra Costa County, San Mateo County and the City and County San Francisco. It is governed by an elected Board of Directors; each of the nine directors represents a specific geographic area within the BART district. In addition to its rail transit services, BART has its own police force. BART also manages the Capitol Corridor Joint Powers Authority (CCJPA). BART provides rail transit service for most of the San Francisco Bay Area, with the Richmond line serving the project area. BART operates the conventional passenger rail system in the project corridor. Amtrak The National Railroad Passenger Corporation, doing business as Amtrak, is a government owned corporation that was organized on May 1, 1971, to provide intercity passenger train service in the United States. Amtrak operates the intercity rail system in the project corridor. Contra Costa Transportation Authority Contra Costa Transportation Authority (CCTA) was originally formed to manage the funds generated by the half cent transportation sales tax Contra Costa County voters enacted in 1988 and to oversee the implementation of what is known as the "Measure C Expenditure Plan." As Contra Costa County's transportation sales tax agency, the Authority oversees the design and construction of the transportation projects included in the Expenditure Plan, carries out the programs included in the Expenditure Plan, most notably, the county's Growth Management Program, and provides the financial structure that ensures the optimum use of the sales tax dollars as intended by the voters. In 1990, the Authority took on the role of Contra Costa County's Congestion Management Agency (CMA). In that capacity, the Authority is the primary transportation planning agency for Contra Costa County, responsible for prioritizing the county's share of available federal, state, and regional transportation funds. 75 October 14, 2010
91 CCTA roles and responsibilities include: Transportation planning within Contra Costa County; and Participate in defining the scope of the project and with interfacing with the system integrator during the implementation phase of the project. California Highway Patrol The CHP has law enforcement jurisdiction over all California State Routes, U.S. Highways and Interstate Highways, and also serves as a statewide police force. Its officers enforce the provisions of the California Vehicle Code, pursue fugitives spotted on the highways, and attend to all significant obstructions and incidents within their jurisdiction. CHP requests and coordinates the incident scene response efforts of the fire department, paramedics, tow truck operators and Caltrans District 4 personnel when requested. Incident management and emergency preparedness have been increasingly significant priorities for the CHP in recent years. The CHP s offices in the Bay Area are headquartered in Vallejo, California. CHP roles and responsibilities include: Traffic Enforcement; Incident Management; and Participate in defining the scope of the project and with interfacing with the system integrator during the implementation phase of the project Oversight Agencies An oversight agency grouping describes those stakeholders responsible for ensuring those operating the systems are doing so in a coordinated manner that achieves the overall goals of the system. These agencies are not responsible for the day to day operation or maintenance of the system. Metropolitan Transportation Commission The Metropolitan Transportation Commission (MTC) was created by the state Legislature in 1970 to be the transportation planning coordinating, and financing agency for the nine county San Francisco Bay Area. MTC functions as both the regional transportation planning agency (a state designation) and, for federal purposes, as the region's metropolitan planning organization (MPO). As such, it is responsible for regularly updating the Regional Transportation Plan, a comprehensive blueprint for the development of mass transit, highway, airport, seaport, railroad, bicycle, and pedestrian facilities. MTC also acts as the region s Service Authority for Freeways and Expressways (SAFE), (in partnership with the California Highway Patrol (CHP) and Caltrans District 4), overseeing the maintenance and operation of call boxes along Bay Area freeways; it administers the Freeway Service Patrol (FSP), a roving tow truck service designed to quickly clear incidents from the region's most congested roadways. In recent years, MTC has taken a more active role in expanding transportation system management capabilities in the Bay Area. MTC s 511 Traveler Information System is the premier real time traveler information system in the nation by providing real time traffic conditions via the phone and a companion web site at The Highway & Arterial Operations section of MTC has responsibility for the agency s role in ICM. 76 October 14, 2010
92 MTC roles and responsibilities include: Coordinate and implement the regional transportation plan; Operate and maintain the Bay Area 511 System; and Participate in defining the scope of the project and with interfacing with the system integrator during the implementation phase of the project. Alameda County Congestion Management Agency The ACTC/ACCMA was created in 1991 after the passage of State Proposition 111, which raised the state gasoline tax by 8 cents and required counties to designate agencies to perform specific duties to better integrate transportation, land use, and air quality. The ACTC/ACCMA was established by a joint powers agreement between Alameda County and all of its cities to assist local governments to meet the requirements of federal, state, and local transportation laws by providing technical assistance. The ACTC/ACCMA decides which transportation projects are the best investments for Alameda County. Through traffic studies, the ACTC/ACCMA assesses traffic problems and explores solutions along specific corridors. An example of such a project is the East Bay SMART Corridors Program. The East Bay SMART Corridors Program is an multi modal advanced transportation management system that provides real time traffic conditions to the public. The intent of the East Bay SMART Corridors Program is to give easy access to local real time conditions and empower users of the project website at to make better travel decisions. The program consists of three major arterial corridors San Pablo Avenue (I 80) corridor, Hesperian/International/E. 14 th Boulevard (I 880) corridor, and I 580 in the Tri Valley cities of Dublin, Pleasanton and Livermore. ACTC/ACCMA roles and responsibilities include: Transportation Planning within Alameda County; Operate and maintain of the East Bay SMART Corridors Program; Project lead agency for this project; and Participate in defining the scope of the project and with interfacing with the system integrator during the implementation phase of the project. West Contra Costa Transportation Advisory Committee The West Contra Costa Transportation Advisory Committee (WCCTAC) is governed by a Joint Exercise of Powers Agreement between the following member agencies: the cities of El Cerrito, Hercules, Pinole, Richmond, San Pablo, and Contra Costa County. This agreement is also between the transit providers: AC Transit, Bay Area Rapid Transit (BART), and WestCAT. The Regional Transportation Planning Committees were created to help manage the 1988 Measure C half cent transportation sales tax projects and programs. WCCTAC roles and responsibilities include: Manage Measure C transportation sales tax projects and programs in West Contra Costa County; 77 October 14, 2010
93 Define and implement policies, programs and projects to improve local and regional transportation and air quality; and Participate in defining the scope of the project and with interfacing with the system integrator during the implementation phase of the project Users The user group describes those stakeholders that benefit from the system but do not participate in the oversight, operation or maintenance of the system. Media Media, including local radio, ISPs and TV stations, collect traffic data from a central source and distribute and broadcast the information to the public. Private Vehicle Operators Private vehicle operators are the largest group of users of the corridor. Their use of the corridor is expected to grow in the future. Private vehicle operator role and responsibility is limited to: Operating within the corridor; and Consuming information. Commercial Vehicle Operators Commercial vehicles are an important user group on the I 80 project corridor. Trucks and other heavy vehicles use I 80 to move goods in the Bay Area and to the other parts of northern California. The Port of Oakland and other important factories and stations are located along the corridor or are linked. This group of users needs careful consideration since they should be managed and satisfied in a way that would be acceptable by the commercial vehicle operators and trucking industry and consistent with the Bay Area Good Movements strategies. Commercial Vehicle Operation (CVO) role and responsibility is limited to: Operating within the corridor; and Consuming information. Pedestrians and Bicyclists Pedestrians and bicyclists travel on the arterial corridors in the project area. These groups need to be included when introducing improvements on the arterials, in particular, traffic signal coordination, transit signal priority, and emergency vehicle preemption. Pedestrian and bicyclist role and responsibility are limited to: Operating within the corridor; and Consuming information. 78 October 14, 2010
94 6.2 Current Method of Accomplishing the Goals and Objectives The goals and objectives of this project are only partially met by current practices and facilities Freeway Management The Caltrans District 4 TMC is responsible for coordinating much of the activity that occurs on I 80 in the corridor, as part of its role in managing all freeways located within the district. Events and incidents are detected through the TMC operator monitoring CCTV images or interfacing with CHP or TMC maintenance staff. This is currently a reactive approach to incident detection. In the event of an event or incident, the TMC will coordinate a response with an appropriate group, such as the CHP, maintenance, FSP. Demand onto the freeway is managed through traveler information and by controlling the traffic signals at the base of freeway on ramps. This is provided through fixed and moveable Changeable Message Signs (CMS) and Highway Advisory Radio (HAR) provide information on upcoming events and freeway incidents. Traffic entering the corridor from I 80 and I 580 are not restricted. Traffic entering the freeway via onramps could be restricted only to the degree that arterial traffic signals control the traffic flow. Lane control is managed through static signage, striping, and CHP or maintenance personnel. HOV lane restrictions are communicated to drivers by static signs on the freeway shoulder and via diamond markings on the roadway. Changes in the time or occupancy requirements for the HOV lanes require modification of the static signs and/or the lane markings. Changes to lane use as dictated by incidents or maintenance activities are managed some or all of the following activities: CHP vehicles slowing down traffic; CHP or Maintenance personnel placing flares on the freeway to indicate the closing of a lane; CHP or maintenance personnel placing cones on the freeway to indicate the closing of a lane; and A temporary CMS is set up on the freeway shoulder. Vehicle speed is managed through static signs located on the right shoulder of the freeway. In the event that a advisory speed needs to be temporarily modified, a temporary sign is erected and the permanent sign is covered Arterial Management Time of Day signal coordination is accomplished by local jurisdictions on some arterials. The signal timing on the San Pablo avenue has been coordinated along the length of the arterial, however there is no continual checking mechanism in place that assists with keeping all the signal systems coordinated. This cannot be achieved because many of the signals are not interconnected and a number of the traffic signal systems need to be upgraded. 79 October 14, 2010
95 In the event of an incident along the corridor, each city modifies its own signal timing. There is little interaction between agencies to assist with traffic signal coordination. Improving this coordination between agencies requires upgrades in many cities signal systems. When incidents do happen that increase the vehicle load on the arterial, there is little each city engineer can do to quickly direct vehicles onto the freeway downstream of an incident. There is no signage to identify to the drivers where an incident is and how to get back onto the freeway at the first on ramp downstream of the incident. As a result vehicles may have a tendency to stay on the arterial longer than required, thus unnecessarily increasing the load on the arterials downstream of the incident. There is only limited CCTV camera coverage that the city staff can refer to, so they are not able to verify the conditions quickly. There is no monitoring or detection in place to alert the city staff to the incident. They must rely on information provided by the public, transit operators, or public safety officers. Transit Signal Priority (TSP) and Emergency Vehicle Pre emption (EVP) have been deployed along San Pablo Avenue. These systems have been a success and as a result the TSP and EVP coverage will be increase in the corridor Incident Management Freeway incident management is coordinated through the Caltrans DISTRICT 4 TMC. Incidents are reported to the TMC operator by CHP, Freeway Service Patrol (FSP) or maintenance teams. The CHP and maintenance are collocated with the TMC operator at the Caltrans DISTRICT 4 TMC. The TMC operator will then coordinate a response with the appropriate Caltrans team and/or the CHP. In addition the TMC operator can post information to CMS and to the HAR if necessary. The TMC operator will also use CCTV camera feed, when available, to assist with assessing and managing the incident. Lane control around an incident is controlled by jurisdiction on site. CHP will use flares, hand signals and cones to indicate which lanes are open and closed. Incidents on the arterial are managed by the local city. The incidents are reported to the city police and then onto the city engineer when appropriate. The city police handle all incident management. If required, the city engineer will support the incident management via modifications to signals. Some arterial signals have Emergency Vehicle Pre emption (EVP) installed to assist emergency vehicles traveling to and from an incident location Traffic Surveillance and Monitoring Closed circuit television (CCTV) cameras are installed on the freeway for surveillance. The CCTV cameras provided some coverage but it does not provide a very detailed view of the corridor. There are many gaps in the coverage. However, the images that are available are streamed back to the TMC and used by the operators to view the traffic conditions. In additions, these images are made available to other jurisdictions and the public to allow them to view the images when the cameras are not being used by Caltrans. In the event that Caltrans deems the images seen on the video unsuitable for public consumption, access to the images by other jurisdictions and the public can be interrupted. 80 October 14, 2010
96 Vehicle loop detectors are installed on the freeway for traffic monitoring. The vehicle loop detectors installed on the freeway provide some coverage, but not a very detailed view. Many of the detector points are not fully operational due to inadequate maintenance. As a result the detector station data is not used for much real time traffic responsive operational decisions. The data from the detector stations is available for download from the PeMS system Transit Management Transit Signal Priority is employed on the San Pablo Avenue Smart Corridor Traveler Information Traveler information is provided via CMS, HAR, telephone and the Internet. CMS and HAR systems are used to provide real time information and directions to the driver, plus they are used to advise about upcoming events. These systems are controlled from Caltrans DISTRICT 4 TMC. The Internet is used to provide more detailed information to the public. The primary method of sharing information on the Internet and the telephone is via the Bay Area 511 system. The 511 system receives real time information from detectors, CCTV cameras and from some management applications. This information is then analyzed and used to display meaningful, up to the minute information. This is an automated system Commercial Vehicle Operation Many commercial vehicle trips are completed into and through the corridor. Many of the commercial vehicle trips focus on trips to/from the ports in and around Oakland and Richmond. There is little realtime information provided to the commercial vehicles and there are no restrictions to the commercial vehicle operation. 81 October 14, 2010
97 7 OPERATIONAL NEEDS This chapter provides a description of the vision, goals and objectives, and personnel needs that drive the requirements for the system. In a system engineering context, these are referred to as the business requirements. These requirements define what the stakeholders identify as key components/requirements for the project, and include constraints that may be placed on the system by the stakeholders. Currently, I 80 is congested, San Pablo Avenue is congested, and the arterials that connect San Pablo Avenue to I 80 are congested. When an incident occurs on the freeway, traffic naturally diverts to San Pablo Avenue, which makes the situation even worse. The cities have little control over diverting traffic, and little information on the conditions outside of San Pablo Avenue. The stakeholders have determined that there is a need to improve the existing conditions by proactively reducing the amount of diversion, dealing with natural diversion during an incident, preventing ramps from backing up on the arterials, and improving synchronization on San Pablo Avenue and crossing arterials. The stakeholders have developed needs statements to guide the development of goals and objectives and user requirements for the project. These needs form the basis of the traceability required by the Systems Engineering process that will be used to tie and/or trace the planning, design, and implementation of the I 80 ICM project. 7.1 Vision The I 80 ICM project is guided by an overarching vision statement, which prescribes the end result of the project. The vision is built on stakeholder s needs and the foundation of the goals of the project. The vision statement does not specify technology solutions; it describes the project s impacts on the users and system managers. The Vision statement for the I 80 ICM project is: To enhance the current Transportation Management System by using State of the Practice solutions to build a balanced, responsive and equitable system to monitor and control traffic and improve the safety and mobility of the users. The solution will create a balanced network for all users with an emphasis on system reliability and efficiency. The vision statement implies an expectation that traffic flows on the transportation network will be balanced between freeways and arterials and between public and private transportation modes (private cars, bicycles) in a manner that is equitable to all road users. 7.2 Goals and Objectives The stakeholders for the I 80 ICM project are looking for an integrated solution that does not focus on the freeway alone. Relieving congestion on the arterials is important because it hinders people from entering and exiting the freeway, and disrupts local traffic movements. The integrated solutions that would best meet the needs of the stakeholders will be multi modal and system wide adaptive solutions. Increasing transit ridership will help move more people through the corridor. The project should ease transit movements through the corridor and make transit a more viable alternative than at present, compared to single occupancy vehicles. In addition, the I 80 corridor is within Alameda and Contra Costa Counties, but 82 October 14, 2010
98 it is also used by commuters traveling to and from other counties. Viable transit options for all commuters must exist to encourage transit ridership at the point of trip origination. 7.3 Business Requirements There are several levels of requirements within the system engineering framework that are being used to control the development of the I 80 ICM system. The following subsections identify the requirements of the agencies that, when satisfied, will allow all the agencies to achieve their own objectives. These requirements, referred to as Business Requirements, permit the development of this concept of operation. The requirement hierarchy is: Business Requirements identify the stakeholder s goals and objectives of the system. User Requirements identify the characteristics of the system that need to be in place for the operators to perform their assigned responsibilities. Functional Requirements at a high level, identify many of the elements, subsystems and data inputs and outputs of the system. All requirements must satisfy a higher level requirement and must be satisfied by a lower level requirement. All Business requirements must be satisfied by a User requirement. All User requirements must satisfy a business requirement Vehicle Impact 1. Shall allow safe movement of vehicles in the corridor. 2. Shall allow efficient movement in the corridor. 3. Shall permit reliable movement of vehicles in the corridor. 4. Shall reduce incident rate. 5. Shall decrease impact of incidents. 6. Shall reduce driver frustration. 7. Shall balance the needs of long distance commuters with the needs of people making short trips. 8. Shall reduce the number of bottlenecks. 9. Shall decrease number of vehicle delay hours along the corridor. 10. Shall enhance access to I Shall reduce the instance of traffic queue waiting on the on ramps to back up onto the local arterial networks Vehicle Occupancy 1. Shall increase passenger per vehicle volume on corridor. 2. Shall balance traffic flow between single occupancy vehicles and HOV. 83 October 14, 2010
99 3. Shall maximize passenger volume through the corridor. 4. Shall improve the utilization of transportation resources Vehicle Route 1. Shall balance traffic flow between arterial and freeway travel. 2. Shall make arterial and freeways work together as an integrated system. 3. Shall giving equal priority to travel on each road network. 4. Incident Response and Management. 5. Shall minimize diversion of freeway traffic to San Pablo Ave. 6. Shall improve incident response times. 7. Shall install and operate Trailblazer signs along the arterials for Incident Management. 8. Shall improve Incident Management. 9. Improve User Satisfaction. 10. Shall improve the level of information available to travelers System Management 1. Shall improve information distribution between agencies. 2. Shall improve the operations and maintenance of the I 80 corridor. 3. Shall institute agreements to help with project implementation. 4. Shall integrate with the existing East Bay SMART Corridors Program. 5. Shall coordinate solutions and operations between all agencies operating along corridor. 6. Shall allow each agency to continue to plan, develop implement and operate their own Traffic Management System. 7. Operational procedures shall be developed by I 80 ICM committees to ensure continued uniform operation of the environment. 8. Agencies shall maintain ownership and operation of all components located within their jurisdiction. 9. Project shall be a coordinated approach by all corridor agencies Other 1. Shall adopt ITS standards. 84 October 14, 2010
100 8 SYSTEM OVERVIEW This is an overview of the system to be developed. This describes its scope, the users of the system, what it interfaces with, its states and modes, the planned capabilities, its goals & objectives, and the system architecture. Note that the system architecture is not a design [that will be done later]. It provides a structure for describing the operations, in terms of where the operations will be carried out, and what the lines of communication will be. 8.1 System Scope The system will be implemented to manage the freeway, arterials and linking roads between the freeway and arterials in the Interstate 80 (I 80) Integrated Corridor Mobility (ICM) corridor. Table 8 1 identifies all the roadways that are included in the project area. Table 8-1 Project Roadways Route Extents Type of Road I-80 Freeway Carquinez Bridge (Contra Costa County) and the San Primary Freeway Francisco Bay Bridge Toll Plaza (Alameda County) San Pablo Avenue 17th Street to Cummings Skwy Primary Arterial West Grand Linking Arterial Wake Ave to Broadway Avenue Grand Avenue Broadway to Lake Park Ave Linking Arterial Lakeshore Avenue El Embarcadero to Lake Park Ave Linking Arterial Powell Street Frontage Rd to San Pablo Ave Linking Arterial Ashby Avenue 7th St to San Pablo Ave Linking Arterial University Avenue 6th St to San Pablo Ave Linking Arterial Gilman Street 6th St to San Pablo Ave Linking Arterial Buchanan Street I-80 (West) to San Pablo Ave Linking Arterial Central Avenue I-80 (West) to San Pablo Ave Linking Arterial Carlson Boulevard Huntington Ave to San Pablo Ave Linking Arterial Potrero Avenue Eastshore Blvd to San Pablo Ave Linking Arterial Cutting Boulevard I-80 (West) to San Pablo Ave Linking Arterial San Pablo Dam Linking Arterial I-80 (East) to San Pablo Ave Road El Portal Drive I-80 (East) to San Pablo Ave Linking Arterial Hilltop Drive I-80 (East) to San Pablo Ave Linking Arterial Richmond Parkway I-80 (East) to San Pablo Ave Linking Arterial Fitzgerald Drive I-80 (East) to Appian Way Linking Arterial Appian Way I-80 (East) to San Pablo Ave Linking Arterial Pinole Valley Road I-80 (East) to San Pablo Ave Linking Arterial Willow Avenue I-80 (East) to San Pablo Ave Linking Arterial Cummings Skyway I-80 (East) to San Pablo Ave Linking Arterial 85 October 14, 2010
101 Listed in Figure 8 1 and Figure 8 2 are each of the five I 80 ICM system groups and the systems that are incorporated into each system group. Each of the system groups contains one or more systems that will be used to manage the corridor. These systems will be operated by a centralized application. Each system group and the associated systems are detailed further in the following sections of the chapter. Freeway Management Systems ATMS (Variable Advisory Speed and Lane Use Signals) Adaptive Ramp Metering Changeable Message Signs Highway Advisory Radio Travel Time Information Traffic Monitoring (CCTV System) Arterial Management Systems Traffic Signal Synchronizatoin Traffic Signal Interconnectt Emergency Vehicle Preempition Transit Signal Priority Trailblazer Signs Traffic Monitoring (CCTV System) Traffic Monitoring and Surveillance Systems Traffic Detection Traffic Monitoring Traveler Information Systems Chanageable Message Signs Highway Advisory Radio Personalized 511 System Comparitive Travel Times Parking Information System Transit Management Systems Transit Signal Priority Figure 8-1 Systems in Scope 86 October 14, 2010

102 Figure 8-2 I-80 Corridor Project Systems These systems will be primarily managed via a purpose built centralized management application. The I 80 Management Application will control each system, based on the current corridor conditions. The system will be located in the Caltrans District 4 TMC. Primarily the system will be operating automatically, without the requirement for user intervention. In this way the system will be able to quickly react to the prevailing conditions. The system will not need to wait for an Operator (or other user) to evaluate the existing conditions and determine the best course of action. This places the onus for managing the corridor on those users responsible for planning coordinated responses, and away from the Operator who may also have multiple tasks to manage. The system will respond to condition changes as simple as changing congestion levels to as complex as a major incident that requires emergency response and that causes vehicles to seek alternate routes. The I 80 Management Application will also integrate with many other systems. The I 80 Management Application will share information, and where appropriate share control, across jurisdictional boundaries by integrating with the East Bay SMART Corridor system and each city s traffic signal system. 87 October 14, 2010
103 8.1.1 Freeway Management System The I 80 ICM FMS consists of several sub systems using a variety of supporting devices and system elements. Each of these devices, located along the freeway corridor, plays a role in improving freeway performance. The FMS implementation will be a balanced approach; it focuses on congestion and incidents in both directions. As shown in Figure 8 3: Lane Control is focused on the southern section of the corridor. The westbound direction will have Lane Control operating from the I 580 junction to west of Powell Street; VAS will be implemented across the entire corridor. VAS will be operating in both eastbound and westbound directions from the Carquinez Bridge to west of Powell Street.; CMS will be installed at strategic locations along the corridor; ARM will be installed at each freeway on ramp in the corridor; HAR will be expanded to cover the length of the corridor; Vehicle detection will be expanded to provide significantly more coverage along the freeway; and CCTV camera coverage will be significantly enhanced along the freeway. This implementation is focused on reducing the quantity and effect of congestion and incidents in both directions in the corridor, with more intensive focus on the highest area of congestion and incidents, the westbound section from the I 580 junction to west of Powell Street. Therefore overhead sign structures implementation is limited to this area. Centralized Operation The FMS will be managed through the Caltrans District 4 Traffic Management Center (TMC). The Caltrans District 4 TMC Operator will be responsible for operating the active traffic management (ATM) devices (Lane Use Signs (LUS), Variable Advisory Speed (VAS) signs), adaptive ramp metering (ARM), Traffic Monitoring System devices (Vehicle Detection, closed circuit television (CCTV) cameras), and Traveler Information System devices (changeable message signs (CMS), Highway Advisory Radio(HAR)). The I 80 ICM FMS will consist of hardware and software necessary to monitor and control traffic and thereby improve the safety and quality of traffic flow by preventing or relieving congestion. The following sections describe the various elements and illustrate their proposed locations. The locations are also summarized in Appendix C. 88 October 14, 2010
104 Figure 8-3 FMS Implementation of ATMS and CMS 89 October 14, 2010
105 Active Traffic Management - Variable Advisory Speed Signs The VASS will be used to implement End of Queue Warning within the corridor. The VASS will be installed on I 80, the exact locations determined by the design alternative selected. The preliminary locations of the VASS are shown in Figure 8 6 and 8 7. The VASS will be mounted either on a pole beside the freeway or on the upright portion of the Full Span Sign Structure. An example of each design is shown in Figure 8 4 and Figure 8 5 Figure 8-4 VASS on Pole 90 October 14, 2010

106 Figure 8-5 VASS on Full Span Sign Structure 91 October 14, 2010
107 Figure 8-6 Proposed VASS Locations North Section of Corridor 92 October 14, 2010
108 Figure 8-7 Proposed VASS Locations South Section of Corridor 93 October 14, 2010
109 Active Traffic Management - Lane Use Signals The LUS will be used to advise the travelers which lanes are open for use, under what conditions they are open for use and to reinforce the advisory Variable Advisory Speed. These signs will be placed on full span sign structures directly above each lane, as shown in Figure 8 8. The LUS on the structure will be a full matrix CMS. Figure 8-8 Typical Full Span ATM Sign Structure LUS will be installed on I 80. They will be located at locations on the freeway as per the design alternative selected. The preliminary proposed locations of the sign structures are shown in Figure 8 9 and In addition the LUS can display the advisory speed as illustrated in Figure 8 11, in support of the VASS on the side of the freeway. The information provided by the LUS will reduce the likelihood that travelers will be surprised by events ahead, thereby decreasing the chance of a sudden change in speed or lane change. 94 October 14, 2010
110 Figure 8-9 Proposed LUS Locations (South Corridor) 95 October 14, 2010
111 Figure 8-10 Proposed LUS Locations (North Corridor) 96 October 14, 2010

112 Figure 8-11 Standard and Optional LUS Display Messages 97 October 14, 2010
113 Adaptive Ramp Metering ARM will be implemented at 44 freeway on ramps that are located within the I 80 corridor. The objective is to implement ramp metering to streamline traffic flow on the freeway and minimize the impact of merging traffic. This is achieved by regulating the total traffic flow entering the freeway, preventing congestion and breaking up platoons of vehicles. Traveler Information System Information will be provided in real time to motorists on the freeway via CMS, HAR, Internet, and telephone. This section describes elements of the project which is designed to provide information to motorists using the freeway. This information may decrease congestion since it encourages travelers to use transit options and/or travel when congestion is lower. This information can also provide the travel time using the freeway compared to the travel time from the closest transit route. Transit time is consistently lower than the driving time on a very congested freeway; this may lead to a change in travelers choice of mode. Presenting traveler information during an incident could assist Caltrans District 4 with controlling the flow of vehicles. The information provided could inform drivers about the severity of any congestion or incident, and encourage these motorists to stay on the freeway. Changeable Message Signs CMS will be implemented along the freeway corridor for supporting the Active Traffic Management (ATM) and Adaptive Ramp Metering (ARM) strategies. The CMS messages will be updated as part of the procedure for responding to any event affecting the ATM and ARM devices. In addition, CMS may be used to provide general information in accordance with Caltrans District 4 standard proceedures. The CMS will be controlled through the Caltrans District 4 TMC. Two types of CMS will be installed on the freeway in the corridor. The first type is a large vertically oriented CMS called a Information Display Board. These signs will be located along the corridor as shown in Figure 8 14 and Figure The second type is a smaller horizontally oriented CMS mounted on every two or three overhead sign structures. These signs will be located along the corridor as shown in Figure 8 9. These signs will be full color full graphic matrix signs. All exisiting CMS units along the corridor will be replaced with a new CMS. The alphanumeric messages on these signs will meet all current Caltrans District 4 CMS standards, including those for visibility and legibility distances. Figure 8 12 shows the layout of a CMS and Figure 8 13 shows the layout for a Information Display Board. These signs will be used to display a variaty of information, including: Warnings and alarts; Vehicle Travel Times; Available parking spaces at park and ride facilities; Port information for commercial vehicles; and Comparitive travel times between different modes of transport. 98 October 14, 2010
114 Figure 8-12 Typical CMS Figure 8-13 Typical Information Display Board 99 October 14, 2010
115 Figure 8-14 Proposed CMS Sign Locations Northern Section of the Corridor (North Corridor) 100 October 14, 2010
116 Figure 8-15 Proposed CMS Sign Locations Southern Section of the Corridor (South Corridor) 101 October 14, 2010
117 Highway Advisory Radio HAR will be implemented along the freeway corridor to support the ATM and ARM strategies. Individual HAR sites will be updated as part of the procedure for responding to any event affecting the ATM and ARM devices. In addition, the HAR information/messages may be updated to provide general information and will be controlled through the Caltrans District 4 TMC. Since I 80 corridor is passing through urban areas with objects interfering with the HAR coverage area it is recommended to place HAR transmitters approximately 4.5 miles apart. Seven HAR sites will be implemented along the corridor. The proposed locations and the expected range of each antenna are identified in Figure 8 16 and Figure However the actual locations with be confirmed during the design phase. Extinguishable Message Signs (EMS) are generally used in conjunction with HAR to indicate that a relevant message is being broadcast. Typically, the sign flashes a fixed message like, Tune Radio AM 840. For this project, it is proposed to use CMS rather than the traditional EMS. CMS will increase the operational flexibility for the I 80 ICM TMC operators, at an increase of approximately 10% 15% capital cost. CMS will be implemented along the freeway corridor to complement the HAR. The proposed locations for each of the signs are identified in Figure 8 16 and Figure All existing EMS s will be replaced by CMS s of the same size. 102 October 14, 2010
118 Figure 8-16 Locations of Proposed and Existing HAR/EMS Elements (North Corridor) 103 October 14, 2010
119 Figure 8-17 Locations of Proposed and Existing HAR/EMS Elements (South Corridor) 104 October 14, 2010
120 8.1.2 Arterial Management System The Arterial Management System enhances the monitoring and control of traffic flow along San Pablo Avenue, the major parallel arterial to I 80, and major crossing arterials; additionally, it fills in the gaps of the East Bay SMART Corridors project by installing necessary ITS field elements, including detection and CCTV cameras. The Arterial Management System will include interconnect for traffic signal synchronization, and it will also upgrade local agency traffic control systems. Local agencies will be able to monitor local traffic and adjust signal timing accordingly, using workstations within the agency and from a designated operator that is located at the Caltrans District 4 Transportation Management Center (TMC) or at another centralized facility. This project will also improve the circulation of traffic flow by upgrading intersections with additional bus turning lanes and other operational improvements. Of particular concern to local agencies, is the congestion near freeway on ramps. Local agencies will have the ability to monitor the congestion at the ramps using CCTV cameras, and work with Caltrans District 4 to adjust the ramp metering rate in order to balance the traffic flow. The ICM project will work to improve the traffic flow on the freeway, mitigating the congestion on crossing arterials that approach the freeway. The following are the elements of the Arterial Management System: Signal Synchronization; Traffic Signal System Upgrade; CCTV Cameras; SMART Corridors Equipment Replacement; Detection; Traffic Signal System Controller Upgrade; and Traffic Signal System Interconnect; Workstation. Signal Synchronization The Traffic Light Synchronization Program (TLSP) funding will provide new signal systems and controllers to provide traffic responsive synchronization on San Pablo Avenue and major crossing arterials. Traffic responsive signal systems respond to traffic conditions by changing timing plans and coordinating timing with other signals. They can also be controlled from a central point, such as a local TMC, to allow an operator to change signal timing plans. Synchronized signals will reduce congestion by coordinating signals on the corridor across local agencies boundaries. The agencies will use the same central signal system (to be determined at a later date), and most possibly new Model 2070 controllers to quickly react to real time traffic conditions and implement signal flush plans if necessary. Existing vehicle detection on San Pablo Avenue will be utilized for the traffic responsive signal system and additional detection will be installed to fill in the gaps for a complete traffic responsive system. CCTV Cameras CCTV cameras will be used to fill in the gaps from the East Bay SMART Corridor program and at the base of freeway ramps to monitor traffic conditions. See Appendix B for existing and proposed camera location information. Cameras will also be placed on incident management routes to observe trailblazer detours and signal flush plans. Cameras will also be installed at key intersections on San Pablo Avenue that do not already have video monitoring capability, but have potential for diversion. In addition to the cameras on 105 October 14, 2010
121 the ramps, more cameras will be added at Central and Carlson, Central and Belmont, and San Pablo and Moeser, San Pablo and Cummings Skyway, San Pablo and Hilltop, San Pablo and El Portal, San Pablo and Appian Way, and San Pablo and Parker Avenue, and other intersections. Proposed camera locations are shown in Appendix B. Detection Arterial system detection will be used to monitor arterial performance and to fill in detection gaps for traffic signal coordination. Freeway ramp detection is included in the freeway concept report. For the TLSP project, detection will be implemented on San Pablo Avenue from Contra Costa College to Pomona St. Signal Interconnect Signal interconnect will be placed to fill in the gaps of the East Bay SMART Corridor project to connect traffic signals for signal coordination and signal flush plans. Table 8 2 and Figure 8 18 show the locations of the signal interconnect. Wireless or leased line communication will be used for signals along San Pablo Avenue that are too cost prohibitive to connect with conduit because of the distance between signals and existing conduit. 106 October 14, 2010
122 Table 8-2 Signal Interconnect Extensions Route Total Length (LF) Prop Conduit (LF) Use Ex Conduit (LF) Grand Ave (Lake Park Ave to Mandela Pkwy) 16,235 7,425 8,810 San Pablo Ave 8,765 8,765 Powell 1,205 1, Ashby University existing SIC to remain Gilman 1,890 1,890 0 Buchanan (conduit only) 1,330 1,330 0 Central San Pablo Dam Rd El Portal 3,880 3,880 0 Hilltop 5,680 5,680 0 Richmond Pkwy 2,090 2,090 0 Fitzgerald 4, ,140 Appian Pinole Valley Road Total 47,845 24,545 23, October 14, 2010

123 Figure 8-18 Existing and Proposed Signal Interconnects 108 October 14, 2010
124 Signal System Upgrade The signal systems in each local agency will be upgraded to a central system (to be determined later) that will have traffic responsive capabilities in order to implement signal flush plans and to respond to traffic congestion. This system must have the ability to communicate to existing signal systems in the corridor for interoperability. Ultimately, the signal system upgrade will be based on each stakeholder s decision. East Bay SMART Corridors Equipment Replacement East Bay SMART Corridors equipment will be replaced when necessary to maintain the standard of service for the existing transit signal priority and emergency vehicle preemption along San Pablo Avenue. Signal Controller Upgrade The signals on San Pablo Ave. and major crossing arterials in each local agency could be upgraded to Model 2070 controllers to support traffic responsive capabilities. The decision to upgrade will be based on each city s signal system and stakeholder input. Controllers may be upgraded on the routes shown in Table 8 3. Table 8-3 TLSP 2070 Traffic Signal Controller Upgrades Route Extents San Pablo Avenue West Grand Avenue Grand Avenue Lakeshore Avenue Powell Street Ashby Avenue University Avenue Gilman Street Buchanan Street Central Avenue Carlson Boulevard Potrero Avenue Cutting Boulevard San Pablo Dam Road El Portal Drive Hilltop Drive Richmond Parkway Fitzgerald Drive Appian Way Pinole Valley Road Willow Avenue 17th Street to Cummings Skwy Wake Ave to Broadway Broadway to Lake Park Ave El Embarcadero to Lake Park Ave Frontage Rd to San Pablo Ave 7th St to San Pablo Ave 6th St to San Pablo Ave 6th St to San Pablo Ave I-80 (West) to San Pablo Ave I-80 (West) to San Pablo Ave Huntington Ave to San Pablo Ave Eastshore Blvd to San Pablo Ave I-80 (West) to San Pablo Ave I-80 (East) to San Pablo Ave I-80 (East) to San Pablo Ave I-80 (East) to San Pablo Ave I-80 (East) to San Pablo Ave I-80 (East) to Appian Way I-80 (East) to San Pablo Ave I-80 (East) to San Pablo Ave I-80 (East) to San Pablo Ave 109 October 14, 2010
125 Workstations Each agency will receive two workstations to monitor traffic conditions: one will be used by traffic operations staff to monitor traffic conditions and the second will be used by fire or incident responder staff for incident management. The City of El Cerrito requires only one workstation Incident Management System The purpose of the arterial elements of the incident management component of the I 80 ICM is to manage diversion onto the arterials that occurs during major freeway incidents. This natural diversion causes congestion on arterials and collector streets throughout the corridor. The incident management concept consists of signal flush plans using trailblazer signs to expedite the return of diverting traffic back to the freeway where it is safe. Agencies will support incident response by allowing emergency vehicle preemption for emergency responders. Caltrans District 4 and the impacted local agencies will decide to implement an incident management plan if diversion begins to cause congestion on local routes. The Caltrans District 4 operator from the I 80 ICM TMC will decide to implement a signal flush plan. Based on existing traffic congestion and the location of the incident, Caltrans District 4 and the local agencies will determine the extent of the incident management route. The signal flush plan will be enacted along San Pablo Avenue; it will quickly return traffic that has diverted to the freeway along designated incident response routes back to the freeway. In addition to the flush plan, the operator will turn on trailblazer signs that direct diverted traffic back to the freeway along the appropriate route. The flush plans will give signal priority to the traffic using the appropriate route. CMS on the freeway will display transit travel times and direct people to transit centers and park and ride lots. The goal of the incident management system is to return the traffic that has diverted to San Pablo Avenue back to the freeway as soon as it is practical, thereby minimizing the impacts on local roads. Emergency Vehicle Preemption Emergency vehicle preemption will be provided at signals along San Pablo Avenue and crossing arterials used by incident responders to access I 80. This includes an emergency vehicle pre emption (EVP) connection at the El Cerrito Main Fire Station #71 at Manila Street. Existing and Proposed EVP is shown in Appendix B. Trailblazers Trailblazer signs for incident management will be installed to direct travelers to the appropriate route back to the freeway. The signs are similar to the signs in Figure The proposed locations are shown in Figure October 14, 2010


126 Figure 8-19 Trailblazer Signs 111 October 14, 2010

127 Figure 8-20 Proposed Trailblazer sign locations 112 October 14, 2010
128 8.1.4 Transit Management System The transit management component of the I 80 ICM improves access to transit and performance of the service to encourage modal shift throughout the corridor. The reliability of bus transit systems will increase by using transit signal priority to improve on time performance. The project will also include HOV ramp meter bypass lanes on freeway on ramps for transit buses and other high occupancy vehicles, and the extension of the Rapid Bus to the Richmond Parkway Transit Center to improve access to transit service. CMS on the freeway will display real time transit travel times compared to congested freeway travel times. Additionally, the signs will display direction information to the nearest transit station and transit parking information at stations and park and ride facilities. This information can be used during congestion to promote mode shifts or during severe incidents as a detour method. The Transit Management System elements of this project include: Transit Signal Priority; AC Transit Rapid Bus Extension; Traffic Signals; Transit Information; and Transit Dispatch Center Upgrades. Transit Signal Priority Transit signal priority will be installed at signalized intersections on San Pablo Avenue for the AC Transit Rapid Bus extension and along Shellmound Street at the Ikea entrance and exit and on Bay Street for Emery Go Round Transit Service. WestCAT will be provided with 45 Transit Signal Priority Emitters for use on selected buses. AC Transit 72R Rapid Bus Extension An additional bus stop will be constructed at Richmond Parkway and San Pablo Avenue. Transit signal priority will be extended to the new bus stop. Traffic Signals A new traffic signal will be installed at Blume and AC Transit s Richmond Parkway Transit Center. The installation of the signals will aid the circulation of transit buses. Transit Information A 40 LCD Sign and kiosk will be provided to display transit arrival times and pertinent route information. This equipment will be located within the El Cerrito Del Norte Bay Area Rapid Transit (BART) station and outside the station, thereby providing maximum exposure to transit passengers. Five large and 10 small signs, purchased with MTC funds, will be used to provide WestCAT Transit information. This project will install these signs. The exact installation locations are still to be determined. CMS will be placed on the freeway to provide real time Water Emergency Transportation Authority (WETA) ferry and parking information and directions to ferry parking facilities. The signs will be located 113 October 14, 2010
129 near the University Avenue, Richmond Parkway, and State Route 4 (SR 4) interchanges to direct people to the Berkeley, Hercules, and Richmond ferry terminals. The cost for these signs is included in the freeway concept plan. Transit Dispatch Center Upgrade Funding will be provided to upgrade the AC Transit dispatch center system Traveler Information System The Traveler Information System (TIS), as defined for this project, covers the provision of information to travelers through the SF Bay Area 511, SMART corridors and other information service providers (ISP). The elements providing information directly to motorists on the freeway are covered under the FMS discussion above. TIS will provide information to the public users via the following elements: Trailblazer Signs on the arterial incident routes; LCD Monitors in some BART stations; Static signs; CMS; HAR; Connection to the SF Bay Area 511 Service; and Public Radio Stations. The Traveler Information System will obtain information from: Traffic Surveillance and Monitoring System; Incident Management System; Freeway Management System; Transit Management System; and the Arterial Management System. The system will be managed from the Caltrans District 4 TMC. The automated elements of the Traveler Information System will be monitored by the I 80 ICM TMC operator. These automated elements include the operation of the SF Bay Area 511 Service; travel times displayed on the freeway CMS and bus timetable information displayed on the LCD Monitors in BART stations located in the corridor. Hence, in the event of an incident, the I 80 ICM TMC operator will have a more active role; it will be responsible for coordinating a response with Caltrans District 4 and each affected local agency, as per the incident plan, and modifying the displays located along the corridor to direct the traffic accordingly. The Traveler Information System will be used to improve the communication to public users. Through this communication the system will support the project goals of: Encourage mode shift from private vehicles to the transit system; Reducing the level and effect of congestion; Improve incident management; and Improve construction management. 114 October 14, 2010
130 8.1.6 Traffic Surveillance and Monitoring System The Traffic Surveillance and Monitoring system will be used to provide information to all the other systems. This system will allow the operators of the I 80 corridor to make informed decisions about how to best operate the I 80 corridor to achieve their objectives; it will also allow users to make informed decisions about traveling within the corridor. Vehicle Detection System Vehicle detection will be used to support ARM, end of Queue Warning, Dynamic Rerouting, Advanced Traveler Information, Transit Signal Priority (TSP), Emergency Vehicle Priority (EVP) and the Traffic Signal Systems. In addition, freeway mainline detection will be used initially for monitoring and managing the freeway mainline traffic during I 80 project construction as part of Traffic Management Plan (TMP). Vehicle detection field devices will be located on both the freeway and arterials. On the freeway mainline, the detectors will be placed at regular intervals in support of the existing Freeway Performance Measurement System (PeMS) detection system. Loop detectors will be placed at the on ramps as per the requirements of the adaptive ramp metering. Loop detectors will also be placed at each signalized intersection, as per the requirements for synchronized signals, on the arterials along the incident management routes. Only the vehicle lanes will have detectors, not on the shoulder. Therefore no incidents located on the shoulder will be able to be effectively detected.2 The approximate location of the existing vehicle detectors is shown in Figure 8 21 and Figure The exact location and requirements will be identified during the design phase of this project. 115 October 14, 2010
131 Figure 8-21 Existing Vehicle Detection System (North Corridor) 116 October 14, 2010
132 Figure 8-22 Existing Vehicle Detection (South Corridor) 117 October 14, 2010
133 Traffic Surveillance System Color CCTV cameras, both fixed and Pan/Tilt/Zoom (PTZ) will be located along the freeway. These cameras will be placed at strategic locations to assist Caltrans District 4 and local agencies monitor and manage traffic, incidents and events. The cameras will be mounted either on sign structures or on standalone poles. The corridor has existing CCTV cameras. The specifications of the existing CCTV cameras are sufficient for the surveillance needs of this project; hence, they will not require any replacement. The addition of new CCTV cameras, supplementing the existing CCTV cameras, will provide a wider coverage area, thereby increasing the speed of incident detection. The surveillance system will be managed and operated via the I 80 ICM TMC. The video stream from the cameras will be available to operators in the I 80 ICM TMC, the public via websites and other stakeholders, as required. The preliminary proposed locations of the CCTV cameras are shown in Figure 8 23 and Figure The exact location of the CCTV cameras will be identified during the design phase of the I 80 ICM project. 118 October 14, 2010
134 Figure 8-23 CCTV Camera Locations - (North Corridor) 119 October 14, 2010
135 Figure 8-24 CCTV Camera Locations (South Corridor) 120 October 14, 2010
136 8.1.7 Commercial Vehicle Operations This ICM implementation will not include specific CVO components. CVO concepts will be studied as part of this project but will be implemented in future phases of the I 80 ICM project. The current I 80 ICM Project will be designed to provide the operational flexibility for future implementation and consideration of those strategies without future major infrastructure investment. 8.2 System Users The system will be used by three different groups of users: Operators, Managers and Users. Operators are those users that are involved in the operation of the system. Managers are those users responsible for high level monitoring of the system and involved in specifying the strategic direction of the system. Users are those users that receive the benefit from the system but do not actively operate the system. Each of these user groups are summaries in Figure And responsibilities of each of thesee groups are detailed further in Chapter 12. Operators Caltrans D4 TMC Operators Caltrans D4 Office of Operations City Engineers City TMC Operators Managers ACTC MTC Caltrans Office of Traffic CCTA WCCTA Caltrans TMC Operations Manager Users Emergency Vehicles CHP Transit Vehicles HOV Other Vehicles Pedestrianss Bicycles Construction and Maintences teams Figure 8-25 System Users 8.3 System Interfaces The I 80 ICM system does not operate in isolation. The system leverages the technology already available and extends its capabilities. Therefore the I 80 ICM system must integrate with a number of existing systems to realize all the benefits available. These other systems are managed, and will continue to be, managed by others. Figure 8 26 shows which systems will interface with the I 80 ICM system. 121 October 14, 2010

137 Figure 8-26 Systems that Interface With I-80 System Bay Area 511 system is operated by the MTC. The I 80 ICM system will provide the data from the new vehicle detectors. Construction, maintenance and incident information will continue to be provided to MTC via other means. Parking information will be provided by others to the I 80 ICM system. This information will detail how many vehicle parking spaces are available at the Richmond Park and Ride facility. Travel time information is provided to Caltrans by the MTC. I 80 ICM system will continue to use this information to display travel time information on corridor CMS. Travel time comparison information will be developed and provided by others. The I 80 ICM system will use the travel time information provided to display on corridor CMS Port information will be obtained from others to provide information on corridor CMS for use by commercial vehicle operators. The nature and location of this information is still to be determined. East Bay SMART Corridor will interface with the I 80 ICM system. This will enable the sharing of CCTV images between the systems. City traffic signal systems will be integrated with the I 80 ICM system. This will allow the I 80 ICM system to implement signal flush plans in the event of an incident and restore normal signal timing at the conclusion of an incident. 8.4 System Modes and States Modes The I 80 ICM system can be operated using one of three modes. The modes differ in the amount of user input is required for the system to operate. The three modes are Automatic mode; Semi automatic mode; and Manual mode. 122 October 14, 2010
138 Automatic mode allows the system to operate without any interaction with a user. This is the most difficult mode to configure but the easiest mode to operate. Using this mode the system will operate all devices based on information received from the detection system and operation schedules loaded into the application. The system will then select the activity plan that corresponds to the current conditions. These activity plans are saved into the system by the system users or administrators. The system will then immediately implement the plan. This plan will modify one or more I 80 ICM system, for example the CMS, HAR, LUS and VAS systems. This mode places the greatest responsibility on the users configuring the system correct. Semi automatic mode differs from automatic mode only by requiring an operator to give an approval of the activity plan prior to the system implementing the plan. This adds a level of user oversight of the system but may also increase the potential for the system to stall if no user is available to approve a change. Manual mode requires a user to monitor the corridor and determine an appropriate setting for each system based on the existing system. This mode requires no system intelligence, it passes all the plan development and decision making onto the user. This mode places the greatest responsibility on the user making the correct decision in real time. The system will primarily operate in automatic mode. This will place the decision making responsibility on the groups of people responsible for determining and agreeing the response strategies to each situation. This way the Caltrans District 4 TMC operator is not required to make decisions on system settings during the time of an incident, when the operator already has a number of other tasks to perform States The I 80 ICM system will be responsive to the roadway conditions. Based on these conditions the system will operate in the following states: Normal Operation (non congested periods); Recurrent Congestion (results from forced traffic flow, i.e. when demand exceeds capacity and bottlenecks start forming); Non Recurrent Congestion, Non Planned Events: Typical Crash; Major Crash; Debris on the Freeway; and Adverse Weather. Non Recurrent Congestion, Planned Events: Maintenance; and Construction. 123 October 14, 2010
139 In addition the system will be robust enough to operate in a state of partial failure. The failure can be as minor as a single LUS fault or as major as the Caltrans District 4 becoming unusable due to a catastrophic event. Each state will be analyzed further through the detailing of the various I 80 operational scenarios. 8.5 System Capabilities The I 80 ICM system will provide the following capabilities: Controlling speeds on the freeway as vehicles approach congestion and queuing, to reduce the incidence of crashes; Controlling the use of lanes approaching an incident or other lane closure to improve the safety and efficiency of merging traffic and to increase the throughput in the operational lanes; Controlling entry onto the freeway in an integrated, real time and corridor wide manner to reduce the duration and the extent of congestion; Modifying arterial traffic signal operation to increase speed and improve mobility, this will accommodate diverting traffic during incidents; Providing guidance to motorists who divert from the freeway during incidents to minimize the impact on the arterial roads; Provide information to motorists about the availability of parking and transit service to help mode choice decisions in real time; and Provide uniform operation throughout the corridor and across jurisdictional boundaries. 8.6 System Goals and Objectives The goals and objectives of the I 80 ICM system are to provide safe, efficient and reliable movement of vehicles in the I 80 ICM corridor. This is achieved by providing the capability to: Control the speed of vehicles approaching a queue. This will assist with reducing the number of incidents; Improve the corridor throughput by smoothing the flow of vehicles in the system via VASS and ARM; 124 October 14, 2010
140 Automatically detect traffic incidents 2 that cause slow down and/or blockages, this will improve the response time of the; Emergency services, CHP, Caltrans and other appropriate authorities; Manage traffic flow in response to incidents by means of LUS, VASS, CMS, HAR, Trailblazers and traffic signal flush plans; Remotely control the use of lanes and by shifting traffic between lanes on the freeway by means of LUS and CMS (westbound direction only); Continuously monitor, control and log selected traffic and environmental conditions; Communicate more efficiently with the California Highway Patrol (CHP) and emergency service providers; Monitor traffic through the CCTV systems. CCTV coverage of the corridor will be increase as part of this project; and Improve the communication and information dissemination to the public via improving the level of information available on the personalized 511 system and the CMS system. 8.7 System Architecture From a physical perspective, connectivity between the field elements and their respective TMC s will be accomplished primarily through Ethernet communications protocols and leased communications services. Twenty six cabinets will be deployed along the freeway and serve as communications hubs for all freeway field elements. Agency owned conduit and copper twisted pair cable will be installed to connect each field device to the nearest communications hub. At the communications hub the Elements deployed along the freeway will be transferred to an appropriately sized leased communications circuit. At this point a T 1 line with connectivity into the telecommunications provider s network is anticipated for the vast majority of communications hubs. Those hubs without T 1 service will be provided sufficient wireless modem(s) with connectivity into the same telecommunications provider s network. Caltrans District 4 and each local agency TMC will be provided a leased communications link into the same telecommunications provider s network. 2 Incidents are defined as events that affect the safety or smooth flow of traffic. Examples of incidents are: crashes, debris on the road, maintenance activities, construction, adverse weather, police activity and other events off the freeway that adversely affect traffic on the freeway. 125 October 14, 2010

141 Figure 8-27 System Logical Diagram Field devices located on local agency right of way will communicate with local TMC using agency owned copper twisted pair if available or an appropriately sized leased communications link. All CCTV cameras and MVDS stations located on the arterials will communicate directly with the East Bay Smart Corridors data center in San Francisco via leased communications links. Figure 8 28 shows the network layout for the I 80 ICM system. Figure 8 27 shows the logical layout of the system. 126 October 14, 2010

 Link Leased Point-to-Point T1 Link T1 From CCTV camera locations to Caltrans TMC SIC From cabinets without CCTV to GPRS modem GPRS- From")
142 T1 at CCTV locations. GPRS to all other locations. Some locations in Berkeley will be connected to City Hall via SIC. ACCMA Data Center MPLS T-1 Leased Service Traffic Management Center 111 Grand Ave Oakland CA MPLS T-1 Leased Service City Hall MPLS T-1 Leased Service C Field Devices Field Devices Field Devices PTZ Camera C CCTV Cabinet SIC SIC PTZ Camera CCTV Cabinet Traffic Controller Cabinet Traffic Controller Cabinet Traffic Controller Cabinet SIC SIC Traffic Controller Cabinet Traffic Controller Cabinet Traffic Controller Cabinet Leased Wireless Ethernet (GPRS) Link Leased Point-to-Point T1 Link T1 From CCTV camera locations to Caltrans TMC SIC From cabinets without CCTV to GPRS modem GPRS- From endpoint of SIC link to Caltrans TMC Field Devices Field Devices Field Devices Crossing Arterials Figure 8-28 Physical Architecture The I 80 Management Application will be used to operate the vast majority of the I 80 ICM systems. The logical layout of the application decision and control strategy is described below and in Figure 8 29: I 80 Management Software reacts to traffic conditions and/or the time of day; Caltrans Division of Operations User responsible for modifying and maintaining the algorithms; Caltrans Division of Operations User responsible for modifying and maintaining the rules and schedules that the systems are based on and updating the Action Plan; City Engineer Assists with Traffic Signal System and Trailblazer rules and schedules; Caltrans D4 TMC Operator is responsible for approving the system response to an event; and I 80 Management Software sends instructions to all relevant applications to implement an Action Plan. 127 October 14, 2010
143 Figure I-80 Management Application Logical Diagram 128 October 14, 2010
144 9 OPERATIONAL ENVIRONMENT In accordance with U.S. Department of Transportation Federal Highway Administration (FHWA) Systems Engineering Guidebook for Intelligent Transportation System (ITS), this chapter describes the physical operational environment in terms of facilities, equipment, computing hardware, software, personnel, operational procedures and support necessary to operate the deployed system. 9.1 Facilities The I 80 ICM System will consist of a number of facilities: Traffic Management Center at Caltrans District 4 Traffic Management Centers at each of the cities along the corridor Data Center Park and Ride 511 System Caltrans Traffic Management Center The I 80 ICM system will be centrally managed from the Caltrans District 4 Traffic Management Center. The TMC is located at on the sixth floor of the Caltrans District 4 building at 111 Grand Avenue, Oakland, CA. The facility operates 24 hours a day, seven days a week. Main Room The main room consists of approximately 25 workstations and a large video wall for viewing video images. The workstations are dedicated to a number of Caltrans District 4 divisions and California Highway Patrol (CHP). The open and centralized nature of the room allows for greater coordination during normal operation and in the event of an incident. Data Room The TMC has a dedicated Data Room located in the TMC facility. The data room in the TMC is the location where all communication links terminate and many of the application servers are hosted. This room is operated and maintained by TMC staff Disaster Recovery / Business Continuity Facility In the event a disaster renders the TMC unusable the service provided at the facility would have to be relocated to a new facility. In order to recover from such a disaster: A new facility will need to be identified that can provide adequate space for communications equipment, server equipment and workstations. Servers would need to be procured, applications would need to be installed and the most recent server backup would need to be loaded from backup tapes. 129 October 14, 2010
145 Table 9-1 Agencies TMC Locations Agency Contact Primary TMC Location Secondary TMC Location(s) Caltrans Hector Garcia 111 Grand Avenue, Oakland, CA None AC Transit Wahid Amiri AC Transit Dispatch Center, None Emeryville, CA Contra Costa County Operating signals for the cities of San Pablo, Pinole, and Hercules City of Albany City of Berkeley City of El Cerrito City of Emeryville City of Hercules City of Pinole City of Richmond City of Oakland City of San Pablo Mark D. La O Aleida Chavez Hamid Mostowfi John Harris Yvetteh Ortiz Maurice Kaufman Brent Salmi Yanni Demitri Steven Tam Ade Oluwasogo Adele Ho Public Works Department 255 Glacier Drive Martinez, CA Emergency Operations Center City Hall Complex 1000 San Pablo Ave Albany, CA Corp Yard. City Hall Engineering Manager s Office San Pablo Avenue El Cerrito, CA City of Emeryville Engineering Department Park Avenue Emeryville, California Second Floor, Engineering Department,111 Civic Drive Hercules, CA City Hall, First Floor Engineering Department, 2131 Pear Street, Pinole, CA City Hall, 2nd Floor Engineering Department s Plans & Library Room 450 Civic Center Plaza, Richmond, CA Public Works Department 250 Frank H Ogawa Plaza Office # 4314 Oakland, CA City Hall Building 3 Engineering Division, 2nd floor San Pablo Avenue San Pablo, CA General Services Department 2467 Waterbird Way Martinez, CA None Office of Transportation 1947 Center Street Berkeley, CA Traffic Safety Unit Public Safety Building San Pablo Avenue, None None None City of Richmond Police Department Watch Commander s Office 1701 Regatta Boulevard Richmond, CA City of Richmond Corp Yard 6 13th Street Richmond, CA None City of San Pablo Police Department Watch Commander s Office San Pablo Avenue San Pablo, CA October 14, 2010
146 New communications lines need to be procured at the new facility. The communications network would need to be reconfigured to direct all appropriate traffic to the new facility. New workstations will need to be procured and reimaged. At this stage no such facility exists City Traffic Operations Centers Each of the jurisdictions that operate traffic signals within the corridor operates a TOC. The TOC, located as identified in Table 9 1, will: Control their owned and managed I 80 ICM field devices. View the operational status of other jurisdictions I 80 ICM field devices. Operate other jurisdictions I 80 ICM field devices for which the user has authorization. Perform other traffic management activities Park and Ride The park and ride facility is located at Richmond. The facility is operated and maintained by others. The I 80 ICM project will encourage the traveling public to use this facility as a way of reducing the vehicle demand on the corridor system The Bay Area 511 system ( is operated and maintained by the Metropolitan Transportation Commission. This system will continue to be a major focal point for disseminating information to the public. The I 80 ICM project will provide additional data from the corridor for use by the 511 system. With this increased level of data the public will be able to better manage their travel in the corridor. 9.2 Equipment The I 80 ICM System will consist of a number of devices located in the field, Caltrans D4 TMC, and local agency TMC s Field Devices Variable Advisory Speed Signs Variable Advisory Speed Signs (VASS) will be located along the length of I 80 within the corridor. The signs will be located on the right hand side of the freeway, spaced at approximately one half mile increments. Each sign location consists of: Full color matrix sign mounted to a pole; Hardwire communication connection from the pole to the controller located in a nearby field cabinet; Connection from the controller to the communications network; and Power to the controller and the VASS. A typical VLS sign unit is shown in Figure October 14, 2010

147 Figure 9-1 Variable Advisory Speed Sign Lane Use Signals Lane Use Signals (LUS) will be located in the southern section of the corridor for the I 80 Westbound direction. The LUS will be mounted on a full span sign structure, one above each lane. The 12 full span sign structures will be spaced at approximately 3/4 mile increments. Each LUS location consists of: Full color matrix sign mounted above each lane on the full span sign structure; Hardwire communication connection from each LUS to the controller located in an adjacent field cabinet; Connection from the controller to the communications network; and Power to the LUS controller and each LUS. A typical LUS unit is shown in Figure October 14, 2010
148 Figure 9-2 Lane Use Signal Adaptive Ramp Metering Adaptive Ramp Metering (ARM) will be used to meter traffic entering I 80 from an on ramp located in the project corridor. Forty four I 80 on ramps will be metered via ARM. Each ARM metered on ramp consists of: A set of ramp meter signals. They will be mounted on the side of the ramp or on an full span structure; A set of loop detectors located on the freeway mainline and ramps at locations required by the ARM algorithm; Hardwire communication connection from each ramp meter signal to the controller located in an adjacent field cabinet; Hardwire communication connection from each local loop detector to the controller located in an adjacent field cabinet; Connection from the controller to the communications network; and Power to the ARM controller, detector and signals. Traffic Detection The I 80 freeway has an existing set of loop detectors; however a greater level of corridor detector density is required. The existing mainline detectors will be supplemented with new loop detectors. The new loop detectors will be located on the mainline, on the freeway on ramps and on the freeway off ramps. In addition Traffic Detection will be placed on the arterial. The technology used for arterial detection is still to be determined. All detectors will have the ability to determine speed, volume and occupancy. 133 October 14, 2010
149 Each Traffic Detector station consists of: A Traffic Detector device: a detector loop, a microwave detector unit or other such unit; Hardwire communication connection from detector device to the controller located in an adjacent field cabinet; Connection from the controller to the communications network; and Power to the Traffic Detector unit and Traffic Detector controller. Traffic Monitoring The I 80 freeway has an existing set of closed circuit television cameras (CCTV); however these need to be upgraded and a greater level of corridor monitoring density is required. CCTV stations will be installed along the length of the freeway, at the base of freeway on ramps and at locations along the arterial. Each Traffic Detector station consists of: An analog color pan/tilt/zoom CCTV camera mounted on a pole next to the freeway, on ramp or arterial, as appropriate; A video encoder mounted in an adjacent field cabinet that will convert analog video signals and serial PTZ data to Ethernet data packets; Connection from the encoder to the communications network; and Power to the CCTV camera and encoder. Highway Advisory Radio Caltrans operates three highway advisory radio (HAR) stations along the corridor. To complete the corridor coverage an additional HAR station will be installed. The new system will replicate the existing stations. In addition, all the existing HAR extinguishable message signs will be replace with changeable message signs (CMS). These signs are mounted on the side of the freeway and are used to alert drivers to the presence of a HAR message. Each HAR station consists of: A HAR antenna; A HAR control Unit signs; One or two CMS located on the side of the freeway; Hardwire communications connection between the HAR controller and the CMS; and Communications connection between the HAR control unit and the communications network. Changeable Message Signs There are three types of CMS operating in the corridor; full span sign structure mounted CMS, Information Display Board CMS and HAR CMS. Each of signs perform a different function, therefore ach one has different specifications. The HAR CMS is discussed with the HAR so will not be discussed further here. The full span sign structure CMS is a full color matrix sign mounted horizontally on every second full span sign structure. These signs have full graphics capabilities. They are able to show four lines of text with ten characters per line. The full span sign structure CMS is shown in Figure October 14, 2010
150 Figure 9-3 CMS Mounted on Full Span Sign Structure The Information Display Board is a full color matrix signs mounted vertically on a cantilever sign structure. These signs have full graphics capabilities, including the ability to display maps of the local roadway system. An Information Display Board is shown in Figure 9 4 Each CMS installation consists of: A CMS display unit; A CMS controller located in an adjacent cabinet; Hardwire communications connection between the CMS display unit and the CMS controller; Communications connection between the CMS control unit and the communications network; and Power to the CMS display unit and the CMS controller. 135 October 14, 2010
151 Figure 9-4 Information Display Board Traffic Signal System All intersections along that corridor that require traffic signal control have existing traffic signals. However some of these intersections require an upgrade to the traffic signal controller. Where appropriate this project will upgrade the signalized intersections to required signal controller, a 2070 controller. Each signalized intersection consists of: A set of traffic signals (existing); A traffic signal controller (2070) located in an adjacent cabinet; Hardwire communications connection between the traffic signals and the traffic signal controller; Hardwire communications connection between the traffic signal controller and the adjacent signalized intersections traffic signal controller; Power to the traffic signals and the traffic signal controller; and A battery back system located in the cabinet. Transit Signal Priority Some intersections along the corridor already have Transit Signal Priority (TSP) installed; this project will extend the TSP installation using the same technology. Each TSP installation consists of: A TSP signal receiver located on a traffic signal mast arm; A hardwire communications connection from the TSP signal receiver to the TSP unit attached to the traffic signal controller; and 136 October 14, 2010
152 A transit vehicle mounted TSP transmitter. Emergency Vehicle Pre-emption Some intersections along the corridor already have Emergency Vehicle Pre emption (EVP) installed; this project will extend the EVP installation using the same technology. Each EVP installation consists of: A EVP signal receiver located on a traffic signal mast arm; A hardwire communications connection from the EVP signal receiver to the EVP unit attached to the traffic signal controller; and An emergency vehicle mounted EVP transmitter. Trailblazer Signs Trailblazer signs will be erected along the arterials to direct vehicles back on to the freeway downstream of a freeway incident. Each trailblazer installation consists of: A trailblazer sign mounted on a pole next adjacent to the arterial; A hardwire communications connection from the trailblazer sign to the trailblazer controller located in an adjacent field cabinet; and A communication connection from the controller to the communication network District 4 TMC Workstation Each division/organization operating in the District 4 TMC has dedicated workstations with customized configurations. The workstation consists of four monitors linked to two personal computers. The workstation does not have any more room for additional monitors, therefore no new monitors will be provided as part of this project. The workstation will continue to use the existing equipment. The layout and configuration of the CHP and the Department of Maintenance workstations will not be modified by this project. Data Room The data room in the TMC is the location where all communication links terminate and many of the application servers are hosted. This will most likely be the location of the application server hosting the I 80 Management Application City TMCs Many of the cities TMC s will be upgraded as part of this project. requirements for each city. Table 9 2 details the upgrade 137 October 14, 2010
153 Table 9-2 Agency TMC Upgrade Requirements Agency Primary TMC Upgrades Secondary TMC Upgrades Caltrans New Signal System Upgrade (TBD) None AC Transit None None Contra Costa County QuicNet Upgrade None City of Albany New QuicNet None City of Berkeley Flat panel display QuicNet Upgrade A flat panel display (assuming accessing data through a passwordenabled Internet portal) City of El Cerrito Computer hardware Flat-panel screen for video monitoring New QuicNet Flat-panel screen for video monitoring (assuming accessing data through Internet or server at City Hall is possible) City of Emeryville Data Monitoring System None City of Hercules New QuicNet None City of Pinole New QuicNet None Police Department: One flat panel display which will continuously show the traffic camera views. City of Richmond City of Oakland City of San Pablo QuicNet Upgrade Web Access Only (Existing TMC and Signal System Upgrade TBD by City directly) QuicNet Upgrade Corp Yard: One computer monitor which will continuously show the traffic camera views. (Limited access to Richmond s QuikNet data at this location) None Two computer monitors which will continuously show the traffic cameras Communication Network The communication network will connect all the elements of the I 80 ICM project together. All Caltrans owned and operated field equipment will be connected back to the Caltrans TMC. All city owned and operated equipment will be connected back to the city s TMC or the SMART corridor servers. The detailed communications plan, including the list of equipment, is provided as a separate document. 9.3 Software The I 80 ICM system is dependent on software to operate the system. Each field devices has a software application that controls the devices. A majority of these applications are commercial applications that 138 October 14, 2010
154 will need to be installed but not modified. However a new application will be developed to coordinate the activities of each of these field devices. This will be a centralized application located at the TMC Management Application The I 80 ICM Management Application will provide the intelligence to the I 80 ICM system. This is the location where data is received, analyzed, leading to decisions being made about how the corridor should operate, and then instructions are sent to the appropriate field devices. This application will be developed specifically for this project Field Device Applications Table 9 3 identifies the applications that are used to control each of the field devices in the I 80 ICM system. Table 9-3 Field Device Applications System Name Application Name Application Location Variable Advisory Speed Sign To Be Determined Adaptive Ramp Metering To Be Determined Lane Use Signs To Be Determined Highway Advisory Radio Platinum Caltrans D4 TMC Changeable Message Signs D4 ATMS Caltrans D4 TMC Closed Circuit Television Camera Cameleon Caltrans D4 TMC Traffic Signals TBD Evaluating various TCS system Transit Signal Priority 3 M Opticon Traffic Signals Emergency Vehicle Priority Traffic Signals Trailblazer Sign To Be Determined Applications Controlled by Others There are many applications that the I 80 ICM system will interface to. By interfacing with these other applications the project is able to provide more detailed information to the system users and the people who operate the system. These applications controlled by others include: Bay Area 511 System; Parking Information System at the Richmond Park and Ride; Vehicle Travel Time System; Comparative Travel Time System; Commercial Vehicles Information System; and Eastbay SMART Corridor System. 9.4 Personnel A variety of personnel will be used to operate the I 80 ICM system, including: Caltrans TMC Operators; 139 October 14, 2010
155 Caltrans Operations Division staff; and City Engineers / TMC staff Caltrans TMC Operators The facility operates 24 hours a day by seven days a week. During normal operations the room is staffed by: Two Operators and one shift leader from the Department of Operations; Two Operators and one shift leader from the Department of Maintenance; and Two California Highway Patrol Officers. There will be no change to the experience of skill level required of a TMC operator. The Operators will need some initial training in operating the system. No other training requirement is expected Caltrans Operations Division Personnel There will be no change to the experience or skill level required of the Caltrans Operations Division personnel. The personnel will need some initial training in operating the system. No other training requirement is expected City Engineers / TMC staff There will be no change to the experience of skill level required of a city engineer. The city engineer will need some initial training in operating the system. No other training requirement is expected. 9.5 Operational Procedures Due to the nature of the system, the operating procedures have been detailed as part of the scenarios identified in Chapter October 14, 2010
156 10 SUPPORT ENVIRONMENT In accordance with U.S. Department of Transportation Federal Highway Administration (FHWA) Systems Engineering Guidebook for Intelligent Transportation System (ITS), this chapter describes the planned physical support environment to maintain the deployed system in terms of facilities, utilities, equipment, computing hardware, software, personnel, operational procedures, maintenance and disposal Support Facilities Each element of the I 80 ICM system is supported by the jurisdiction that is operating the device. Each facility is documented in chapter 9. There are no additional facilities (such as TMC s) required to support the system Support Utilities All I 80 ICM System support is facilitated by the use of the existing PG&E infrastructure. There are no additional utilities needed for supporting the proposed system Support Equipment The I 80 ICM System does not require additional equipment for supporting the proposed system Computing Hardware The system may deploy additional hardware to secure the network from unauthorized access. This will be determined as part of the detailed network design Computing Software Computer software is used to support the I 80 ICM System by monitoring for faults and monitoring for unauthorized access Fault Monitoring Computer software fault monitoring for the I 80 ICM system includes the monitoring of the communication network and the field devices. Communication Network The Caltrans division of Electrical Systems is responsible for monitoring and supporting the network. Field Device When a field device experiences an outage, an automated and/or SMS will be sent. The and SMS can be sent only to person that requires notification of a network outage. s and SMSs are generated from the I 80 ICM Management Application. Each field device management application is responsible for the monitoring the status of the element. When faults occur the field device will attempt to mitigate the fault by adjusting the field devices. Regardless of whether the adjustment works, the field device management application will log the event 141 October 14, 2010
157 and alert the TMC operator that an error has occurred. This software is generally provided by the device vendor as part of the device management application Unauthorized Access Monitoring Caltrans Division of Electrical Systems is responsible for installing and operating software that monitors the I 80 ICM system for unauthorized access. This access should disable network access to the user when unauthorized access is detected, and alert the network support team Support Personnel Support for the I 80 ICM project is provided by Caltrans Division of Electrical Systems, each City that operates a field device, and by the I 80 ICM systems integrator till the completion of their contractual obligation. These three groups of people are responsible for resolving all issues including coordination with the third Caltrans All I 80 ICM equipment managed by Caltrans will be supported by the Division of Electrical Systems. Outages will be alerted to the Division of Electrical systems via SMS and or Faults will be logged by a devices management application which will alert the TMC operator(s). The TMC operator will contact the Division of Electrical Systems to advise the existence of the fault. The Division of Electrical Systems will be responsible for resolving the fault. If the I 80 ICM Management Application experiences a fault then the TMC operator will contact the Division of Electrical Systems to advise the existence of the fault. The Division of Electrical Systems will be responsible for resolving the fault City Each city will be responsible for providing support for their TMC environment. This includes support for their traffic signal system and the computers provided to them as part of this project. They may wish to engage the vendor of their traffic signal system to obtain ongoing support for the system Software Developers The software developers responsible for the I 80 ICM Management Application will be required to support the application. When a fault occurs due to a software bug the software developers will be required to resolve the fault. The software developers will also be required to provide software updates, modifications and changes, as per contractual requirements Outsourced Contractors Maintaining numerous field devices deployed along the corridor will present an increased workload on each agency. Many of the field devices deployed in the corridor are in use elsewhere in the Bay Area, however some new product lines will be deployed. The new products lines will require periodic product specific training of maintenance staff. Outsourcing the maintenance of I 80 ICM infrastructure is 142 October 14, 2010
158 recommended if the agency cannot commit adequate resources to the I 80 ICM System. This is in line with ACTC/ACCMA existing practice Support Procedures Each agency is responsible for developing their own support procedures. Where support procedures require coordination between multiple agencies, each agency is responsible for working together to develop and maintain the procedures. MTC and ACTC/ACCMA are responsible for the oversight of these procedures and for assisting with the procedures coordination and management Maintenance General Maintenance Requirements The maintenance of the I 80 ICM system is vital to its success in order to work effectively, the system must be maintained. A maintenance program that includes routine preventive maintenance activities will need to be developed with appropriate staffing and annual budgets. Continual maintenance of system devices will ensure effective, optimal and uninterrupted operation of the equipment. Each agency will be responsible for maintaining its own equipment based on an agreed upon, unified, system wide program with adequate funding. Agencies have expressed the need for a regional funding source or solution to ongoing maintenance costs, which will otherwise be a financial burden to local agencies. Maintenance programs and funding are an on going discussion among the stakeholders. At this time, they have not agreed on any solution. Preventive Maintenance Preventive maintenance activities are some of the most effective ways to reduce the overall life cycle cost of the system while ensuring the devices operate in a reliable and optimum fashion. Common preventive maintenance activities include inspection, record keeping, cleaning, replacement and testing. To be most effective, a well planned maintenance program should be scheduled on a regular basis, taking into account proper resources (including both staff and equipment). Procedures should be clearly defined and understood by all responsible parties, and all maintenance activities should be documented. Maintenance procedures should be stored in a central place to ensure that they can be appropriately used to monitor the performance of the system. This information is necessary to identify trends in maintenance needs and to plan and forecast maintenance requirements and expenses. Response Maintenance The initial response by a City or Caltrans District 4 to any reported malfunction of the system a device is known as response maintenance. Response maintenance includes both field procedures used to restore device operation and shop procedures used to repair and test the malfunctioning equipment. As an integral part of the response maintenance, procedures for reporting and scheduling repairs will need to be established. As part of these procedures, a standard prioritization process will need to be determined which will require defining a hierarchical system of potential device malfunctions and the subsequent appropriate response. This hierarchical approach will serve as the basis for planning maintenance 143 October 14, 2010
159 activities as well as defining the order in which those activities will be conducted. Under conditions when inadequate resources are available to address all necessary maintenance activities, this hierarchical approach will establish which activities will be given priority. Special consideration will need to be given to those potential device and/or system malfunctions that create immediate safety issues to the public and agency staff. Response procedures should be developed for normal operating conditions, and to address unusual circumstances such as malfunctioning of device and/or system which occur during periods when staff is not readily available. Maintenance Policies Each agency should develop policies on the maintenance of each device. Funding for maintenance is not provided from the Traffic Light Synchronization Program (TLSP) grant; therefore, each agency must provide funding for maintenance in accordance with the basic policies outlined below: Indentify which preventive maintenance tasks should be conducted for each device. This includes a needs assessment/cost effectiveness analysis. This will also require a review of those activities prescribed by the device manufacturers; Determine whether systematic replacement or replace as it malfunctions better realizes the goals of the system considering resource constraints; Determine a vendor provided support agreements are required to maintain the required uptime for each system; Develop specific guidelines for reporting non scheduled maintenance needs and activities; Develop specific performance criteria for monitoring the performance of the maintenance management program; Develop clear procedures for each regularly conducted maintenance activity, including descriptions for both staff and equipment requirements; Establish a methodology for recording maintenance activities and identifying system maintenance needs; and Develop criteria for prioritizing maintenance activities. 144 October 14, 2010
160 Table 10 1 identifies the agencies responsible for maintaining the traffic signal systems in the corridor. Table 10-1 Responsible Maintenance Agency for Traffic Signal Systems Traffic Signal Owners Signal Maintenance Contra Costa County Contra Costa County Hercules Contra Costa County Pinole Contra Costa County San Pablo Contra Costa County Richmond Richmond El Cerrito Private Maintenance Contract Albany Caltrans District 4 Berkeley Berkeley Emeryville Caltrans District 4 Oakland Oakland 10.9 Disposal There are no special requirements for the disposal of equipment included in the I 80 ICM project. 145 October 14, 2010
161 11 OPERATIONAL SCENARIOS This chapter describes a number of scenarios that will be accommodated by the proposed system. Each scenario describes a sequence of events and activities carried out by the user, the system and the environment 3. It specifies what triggers the sequence, who or what performs each step, when communications occur and to whom or what [e.g., a log file], and what information is being communicated. The scenarios cover all normal conditions, stress conditions, failure events, maintenance, anomalies and exceptions. The objective in presenting these scenarios is to allow all stakeholders to clearly identify their expected role Normal System Conditions Scenario 1 Operation without any freeway management Scenario Objective The objective of this scenario is to manage traffic on the project corridor under Normal Operation conditions. Scenario Definition Normal Operation on the freeway is defined as periods when: No freeway congestion exists; No crashes have occurred on the freeway; No construction or maintenance activities are being carried out on the freeway; No debris is present on the freeway; and No other event has occurred that reduces the freeway level of service. Sequence of Events Vehicle detectors send data to the I 80 ICM Management Application; I 80 ICM Management Application determines that there is no need to implement any freeway or arterial management strategies; If an operation scenario was active then the I 80 ICM Management Application will recommend removing the active strategy; 3 Refer to FHWA Guidelines 146 October 14, 2010
162 (Optional) The I 80 Management Application presents the recommended options to the Caltrans D4 TMC Operator and requests approval for the Action Plan; (Optional) Caltrans D4 TMC Operator views the CCTV camera feed from the vicinity of the detected queue to determine the cause of the queue; (Optional) Caltrans D4 TMC Operator approves the Action Plan or modifies the Action Plan; and I 80 Management Application transmits instructions to each sub system, as per the Action Plan. Figure 11 1 shows the typical sequence of events for the I 80 ICM Management Application. 147 October 14, 2010
 elements will operate as follows: All VASS, both in the eastbound and westbound directions, will be blank; 148 October 14,")
163 Figure 11-1 Sequence of Management Application Operation End Result Under normal traffic operations the freeway active traffic management systems (ATM) elements will operate as follows: All VASS, both in the eastbound and westbound directions, will be blank; 148 October 14, 2010
164 The Lane Use Signs (LUS) will show either all lanes with downward pointing green arrows (indicating all lanes open to all vehicles) or a diamond above the left lane and the rest of the lanes with downward pointing green arrows (indicating the left lane is a High Occupancy Vehicle (HOV) lane and the rest of the lanes are open to all vehicles); Adaptive ramp metering (ARM) may or may not be operating during periods of no congestion.; All Changeable Message Signs (CMS) on the freeway will be blank or displaying a standard message (for example travel times) as per current Caltrans District 4 practice; HAR will be turned off as per current Caltrans District 4 practice; and Closed circuit television (CCTV) cameras will be operating with each camera directed towards its default preset position, or if an authorized user is accessing the CCTV camera then focused as directed by the authorized user. Under normal operations the Arterial and Transit system will operate as follows: Traffic Signals will be operating using normal timing plans, as per each agencies normal operating procedures; CCTV cameras will be operating with each camera directed towards its default preset position, or if an authorized user is accessing the CCTV camera then focused as directed by the authorized user; and Transit Priority will be operating on selected buses along San Pablo Avenue. An example lane use configuration for normal scenario with HOV lanes is shown in Figure 11 2 and without HOV lanes in Figure October 14, 2010
165 Figure 11-2 Lane Use Sign Configuration for Normal Scenario with HOV Lanes 4 4 This figure shows an example of what the CMS, LUS and VASS signs may display under this operational scenario. The actual display based on operational requirements will be determined by Caltrans District 4 division of Operations. 150 October 14, 2010
166 Figure 11-3 Lane Use Sign Configuration for Normal Scenario without HOV Lanes 5 5 This figure shows an example of what the CMS, LUS and VASS signs may display under this operational scenario. The actual display based on operational requirements will be determined by Caltrans District 4 division of Operations. 151 October 14, 2010
167 Scenario 2 Recurrent Congestion Scenario Objective The objective of this scenario is to manage traffic on the project corridor under Recurrent Congestion conditions. Scenario Definition Recurrent Congestion is defined as congestion that occurs routinely and is not caused by crashes, events, weather or construction. Under recurrent congestion, the volume of traffic entering the freeway will gradually increase until speeds are affected and the volume approaches the level that produces unstable flow at bottleneck locations. This congestion usually occurs during the AM and PM peaks on weekdays and at other times of the day on weekends. Sequence of Events During Recurrent Congestion, the I 80 ICM system will respond as follows: ARM will be operational during period of scheduled ARM operation; Vehicle detectors send data to the I 80 ICM Management Application; I 80 ICM Management Application determines that a queue has formed on the freeway; (Optional) Caltrans D4 TMC Operator views the CCTV camera feed from the vicinity of the detected queue to determine the cause of the queue; The I 80 Management Application selects an Action Plan. The Action Plan may: Reduce the posted speed on the VASS in the mile upstream of the end of queue; Adjust the ARM rates at certain locations; Display the VASS posted speed on certain LUS; and Display an end of queue warning message on specific CMS; (Optional) The I 80 Management Application presents the recommended options to the Caltrans D4 TMC Operator and requests approval for the Action Plan; (Optional) Caltrans D4 TMC Operator approves the Action Plan or modifies the Action Plan; and I 80 Management Application transmits instructions to each sub system, as per the Action Plan. End Result Under recurrent congestion: The VASS upstream of the congestion will progressively reduce the advisory speed to 35 mph as vehicles approach the congestion. At the location of the congestion, the VASS will be blank; 152 October 14, 2010
168 LUS will show either all lanes with downward pointing green arrows (indicating all lanes open to all vehicles) or a diamond above the left lane and the rest of the lanes with downward pointing green arrows (indicating the left lane is a HOV lane and the rest of the lanes are open to all vehicles); ARM will be turned on. When appropriate, metering rates may be adjusted to prevent queue backups onto the arterials; All CMS on the freeway will show standard advisory messages or predefined messages for recurrent congestion, as per current Caltrans District 4 practice. An example message would be Congestion Ahead, or Reduce Speed ; HAR will be either turned on with a general statement, as per current Caltrans District 4 practice, or turned off; CCTV cameras will be turned on with each camera directed towards its default preset position, or if an authorized user is accessing the CCTV camera then it will be focused as directed by the authorized user. Under recurrent congestion operations the Arterial and Transit system will operate as follows: Traffic Signals will be operating using normal timing plans, as per each agencies normal operating procedures; CCTV cameras will be operating with each camera directed towards its default preset position, or if an authorized user is accessing the CCTV camera then it will be focused as directed by the authorized user; and Transit Priority will be operating on selected buses along San Pablo Avenue. An example of lane use configuration for recurrent congestion scenario with HOV lanes is shown in Figure October 14, 2010
169 Figure 11-4 Lane Use Sign Configuration for Recurring Congestion Scenario with HOV Lanes 6 6 This figure shows an example of what the CMS, LUS and VASS signs may display under this operational scenario. The actual display based on operational requirements will be determined by Caltrans District 4 division of Operations. 154 October 14, 2010
170 Scenario 3 Minor Crash on Freeway Scenario Objective The objective of this scenario is to manage traffic on the project corridor when there is a minor crash on the freeway. Scenario Definition A minor crash is defined as a crash that does not block 50% or more of the lanes for 30 minutes or more. This is a non recurring, non planned event. Sequence of Events During a minor crash on the freeway, the I 80 ICM system will respond as follows: ARM will be operational if event occurs during period of scheduled ARM operation; Vehicle detectors send data to the I 80 ICM Management Application; I 80 ICM Management Application determines that a queue has formed on the freeway; (Optional) Caltrans D4 TMC Operator receives information from an external source that debris is present on the freeway; (Optional) Caltrans D4 TMC Operator views the CCTV camera feed from the vicinity of the detected queue to determine the cause of the queue; (Optional) Caltrans D4 TMC Operator inputs details of crash into the I 80 ICM Management Application; The I 80 ICM Management Application selects an Action Plan. The Action Plan may: Reduce the posted speed on the VASS in the mile upstream of the end of queue; Adjust the ARM rates at certain locations or turn on the ARM if it is not already active; Display the VASS posted speed at certain LUS locations; Use the LUS to close the affected lane(s) via displaying a yellow arrow, yellow x or red x; Display an end of queue warning message on appropriate CMS; (Optional) The I 80 Management Application presents the recommended options to the Caltrans D4 TMC Operator and requests approval for the Action Plan; (Optional) Caltrans D4 TMC Operator approves the Action Plan or modifies the Action Plan; I 80 Management Application transmits instructions to each sub system, as per the Action Plan; and D4 TMC Operator will liaise with emergency services personnel as required. End Result In reaction to the minor crash: 155 October 14, 2010
171 The VASS upstream of the congestion will progressively reduce the advisory speed to 35 mph as vehicles approach the congestion. At the location of the congestion, the VASS will be blank; ARM may be turned on if the crash results in a level of congestion that meets Caltrans District 4 congestion criteria for turning on the ARM; LUS will show green arrows (indicating all lanes open to all vehicles) or a diamond above the left lane and the rest of the lanes with green arrows (indicating the left lane is a HOV lane and the rest of the lanes are open to all vehicles); The CMS s upstream of the crash on the freeway may display a message identifying the location of the crash and/or advising the motorists to expect delays. If they do not display a specific message they will display a standard advisory message, as per current Caltrans District 4 practice. An example message would be Congestion Ahead, or Reduce Speed ; HAR may broadcast a message identifying the location of the crash and/or advising the motorists to expect delays. If it is not broadcasting a specific message it will be either turned on with a general statement or turned off, as per current Caltrans District 4 practice; and The system may automatically detect that a crash has occurred and automatically focus the CCTV cameras in the vicinity onto the crash. The CCTV monitors will automatically display the video stream from these CCTV cameras. All other CCTV cameras will either be directed to their default preset position, or if an authorized user is accessing the CCTV camera then it will be focused as directed by the authorized user. Under minor crash congestion operations the arterial and transit systems will operate as follows: Traffic signals will be operating using normal timing plans, as per each agency s normal operating procedures; CCTV cameras will be operating with each camera directed towards its default preset position, or if an authorized user is accessing the CCTV camera then it will be focused as directed by the authorized user; Transit signal priority will be operating on selected buses operating along San Pablo Avenue; and Emergency vehicle preemption will permit emergency vehicles to travel along San Pablo Avenue to the site of the crash. An example lane use configuration for recurrent congestion scenarios are shown in Figure 11 5, Figure 11 6 and Figure October 14, 2010
172 Figure 11-5 Lane Use Sign Configuration for Minor Crash Scenario (Option A) 7 7 This figure shows an example of what the CMS, LUS and VASS signs may display under this operational scenario. The actual display based on operational requirements will be determined by Caltrans District 4 division of Operations. 157 October 14, 2010
173 Figure 11-6 Lane Use Sign Configuration for Minor Crash Scenario (Option B) 8 8 This figure shows an example of what the CMS, LUS and VASS signs may display under this operational scenario. The actual display based on operational requirements will be determined by Caltrans District 4 division of Operations. 158 October 14, 2010

174 Figure 11-7 Lane Use Sign Configuration for Minor Crash Scenario (Option C) 9 9 This figure shows an example of what the CMS, LUS and VASS signs may display under this operational scenario. The actual display based on operational requirements will be determined by Caltrans District 4 division of Operations. 159 October 14, 2010
175 Scenario 4 Major Crash on Freeway Scenario Objective The objective of this scenario is to manage traffic on the project corridor when there is a major crash on the freeway. Scenario Definition A major crash is defined as one that blocks more than 50% of the lanes for at least 30 minutes. This is a non recurring, non planned event. Sequence of Events During a major crash on the Freeway, the I 80 ICM system will respond as follows: ARM will be operational if event occurs during period of scheduled ARM operation; Vehicle detectors send data to the I 80 ICM Management Application; I 80 ICM Management Application determines that a queue has formed on the freeway; (Optional) Caltrans D4 TMC Operator receives information from an external source that crash is present on the freeway; (Optional) Caltrans D4 TMC Operator views the CCTV camera feed from the vicinity of the detected queue to determine the cause of the queue; (Optional) Caltrans D4 TMC Operator inputs details of crash into the I 80 ICM Management Application; The I 80 Management Application selects an Action Plan. The Action Plan may: Reduce the posted speed on the VASS in the mile upstream of the end of queue; Adjust the ARM rates at certain locations or turn on the ARM if it is not already active; Display the VASS posted speed at certain LUS locations; Use the LUS to close the affected lane(s) via displaying a yellow arrow, yellow x or red x; Display an end of queue warning message on appropriate CMS; Broadcast a message on the HAR; Activate the Trailblazer Signs along the incident route; and Activate an incident flush plan on the arterials along the incident route. (Optional) The I 80 ICM Management Application presents the recommended options to the Caltrans D4 TMC Operator and requests approval for the Action Plan; (Optional) Caltrans D4 TMC Operator approves the Action Plan or modifies the Action Plan; I 80 ICM Management Application transmits instructions to each sub system, as per the Action Plan; and 160 October 14, 2010
176 D4 TMC Operator will liaise with emergency services personnel as required. End Result In reaction to the major crash: The VASS upstream of the congestion will progressively reduce the advisory speed to 35 mph as vehicles approach the congestion. At the location of the congestion, the VASS will be blank; ARM may be turned on if the crash results in a level of congestion that meets Caltrans District 4 congestion criteria for turning on the ARM; LUS will show green arrows (indicating all lanes open to all vehicles) or a diamond above the left lane and the rest of the lanes with green arrows (indicating the left lane is a HOV lane and the rest of the lanes are open to all vehicles); The CMS s upstream of the crash on the freeway may display a message identifying the location of the crash and/or advising the motorists to expect delays. If they do not display a specific message they will display a standard advisory message, as per current Caltrans District 4 practice. An example message would be Congestion Ahead, or Reduce Speed ; HAR may broadcast a message identifying the location of the crash and/or advising the motorists to expect delays. If it is not broadcasting a specific message it will be either turned on with a general statement or turned off, as per current Caltrans District 4 practice; and The system may automatically detect that a crash has occurred and focus the CCTV cameras in the vicinity of the crash onto the crash. All other CCTV cameras will either be directed to their default preset position, or if an authorized user is accessing the CCTV camera then it will be focused as directed by the authorized user. Under major crash conditions the Arterial and Transit system will operate as follows: Traffic Signals will operate a signal flush plan along the incident management route. The flush plan will be activated by the I 80 ICM TMC operator; Trailblazer signs will be in operation along the incident management route; CCTV cameras will be operating with each camera directed towards its default preset position, or if an authorized user is accessing the CCTV camera then it will be focused as directed by the authorized user; Transit signal priority will be operating on selected buses serving San Pablo Avenue; and Emergency vehicle preemption will permit emergency vehicles to travel along San Pablo Avenue to the site of the crash. An example lane use configuration for major crash scenarios are shown in Figure 11 8 and Figure October 14, 2010
177 Figure 11-8Lane Use Sign Configuration for Major Crash Scenario (Option A) This figure shows an example of what the CMS, LUS and VASS signs may display under this operational scenario. The actual display based on operational requirements will be determined by Caltrans District 4 division of Operations. 162 October 14, 2010
178 Figure 11-9 Lane Use Sign Configuration for Major Crash Scenario (Option B) This figure shows an example of what the CMS, LUS and VASS signs may display under this operational scenario. The actual display based on operational requirements will be determined by Caltrans District 4 division of Operations. 163 October 14, 2010
179 Scenario 5 Debris on Freeway Scenario Objective The objective of this scenario is to manage traffic on the project corridor when there is debris on the freeway. Scenario Definition Debris on the freeway is defined as any foreign object that is located in a freeway lane and has the potential to damage a vehicle or for a driver to believe that the object could damage a vehicle. This is a non recurring, non planned event. Sequence of Events When debris is on the freeway, the I 80 ICM system will respond as follows: ARM will be operational if event occurs during period of scheduled ARM operation; Vehicle detectors send data to the I 80 ICM Management Application; I 80 ICM Management Application may determine that a queue has formed on the freeway; (Optional) Caltrans D4 TMC Operator receives information from an external source that debris is present on the freeway; (Optional) Caltrans D4 TMC Operator views the CCTV camera feed from the vicinity of the detected queue to determine the cause of the queue; (Optional) Caltrans D4 TMC Operator inputs details of debris into the I 80 ICM Management Application; The I 80 ICM Management Application selects an Action Plan. The Action Plan may: Reduce the posted speed on the VASS in the mile upstream of the end of queue; Adjust the ARM rates at certain locations or turn on the ARM if it is not already active; Display the VASS posted speed at certain LUS locations; Use the LUS to close the affected lane(s) via displaying a yellow arrow, yellow x or red x; Display an end of queue warning message on appropriate CMS; (Optional) The I 80 Management Application presents the recommended options to the Caltrans D4 TMC Operator and requests approval for the Action Plan; (Optional) Caltrans D4 TMC Operator approves the Action Plan or modifies the Action Plan; I 80 Management Application transmits instructions to each sub system, as per the Action Plan; and D4 TMC Operator will liaise with emergency services personnel as required. 164 October 14, 2010
180 End Result In reaction to the debris on the road, the ATM devices may adjust as follows: Unless the debris causes congestion, the VASS will remain blank; ARM may be turned on if the debris results in a level of congestion that meets Caltrans District 4 congestion criteria for turning on the ARM; LUS will close the lane(s) that are obstructed by the debris, as per Caltrans District 4 policy. The lane(s) will be progressively closed upstream of the debris to ensure that the vehicles safely merge into the open lanes; The CMS s upstream of the debris on the freeway will display a message identifying the location of the debris and/or advising the motorists to expect delays. An example message would be Debris Ahead, or Reduce Speed. If CMS s are not displaying a specific message they will be displaying a standard advisory message, as per current Caltrans District 4 practice; HAR may broadcast a message identifying the location of the debris and/or advising the motorists to expect delays. If it is not broadcasting a specific message it will be either turned on with a general statement or turned off, as per current Caltrans District 4 practice; and The system may automatically detect a speed differential that indicates an obstruction in a lane and will automatically focus the CCTV cameras in the vicinity of the debris. The CCTV monitors in the I 80 ICM TMP will automatically display the video stream from these CCTV cameras. All other CCTV cameras will be directed to their default preset position, or if an authorized user is accessing the CCTV camera then it will be focused as directed by the authorized user. All other devices will operate as per normal operations. An example lane use configuration for debris on freeway scenarios is shown in Figure and Figure October 14, 2010
181 Figure Lane Use Sign Configuration for Debris on Freeway Scenario (Option A) This figure shows an example of what the CMS, LUS and VASS signs may display under this operational scenario. The actual display based on operational requirements will be determined by Caltrans District 4 division of Operations. 166 October 14, 2010

182 Figure Lane Use Sign Configuration for Debris on Freeway Scenario (Option B) This figure shows an example of what the CMS, LUS and VASS signs may display under this operational scenario. The actual display based on operational requirements will be determined by Caltrans District 4 division of Operations. 167 October 14, 2010
183 Scenario 6 Scheduled Activities Scenario Objective The objective of this scenario is to manage traffic on the project corridor during scheduled activities. Scenario Sequence The I 80 ICM system operation will be dependent on the time of day and day of week. Activities can be scheduled on a one off or recurring basis that will modify the operation of one or more of the I 80 ICM elements. Based on the stored schedule the application will modify each applicable device as per the following sequence of events. Review period is set by the Caltrans Department of Operations; The I 80 ICM Management Application reviews the data and checks the rules and schedules for each sub system. For example the Application could determine that it should: Begin (or end) the HOV lane period; Close a lane for scheduled construction/maintenance; Change the display on a CMS; and/or Change the advisory speed at the construction/maintenance zone; The I 80 Management Application presents the recommended options to the Caltrans D4 TMC Operator and requests approval for the Action Plan. The Action Plan may be: Change appropriate LUS to display the HOV symbol; Change the LUS display pattern to close the left lane at the site of the scheduled construction/maintenance; Change the LUS display pattern to show a reduced advisory speed at the site of the scheduled construction/maintenance; Change the CMS display to warn of construction scheduled; Change the CMS display to warn of construction ahead; Change the CMS to display travel times; and/or Change the CMS display to Advise HOV lane operational. (Optional) Caltrans D4 TMC Operator either: Approves the plan; and Submits a new Action Plan for approval to the I 80 Management Application. I 80 Management Application sends out instructions to each sub system, as per the Action Plan. 168 October 14, 2010
184 Scenario 7 Transit Vehicle on Arterial Scenario Objective The objective of the scenario is to keep transit vehicles operating along the corridor on schedule. Scenario Sequence of Events Transit vehicles operating along arterials in the corridor may be granted priority at signalized intersections. This process will be independent of the rest of the I 80 ICM system Scenario 8 Emergency Vehicle on Arterial Scenario Objective The objective of the scenario is to improve the response time and safety of emergency vehicles responding to an emergency in the corridor. Scenario Sequence of Events Emergency vehicles operating along arterials in the corridor will be granted priority at signalized intersections. This process will be independent of the rest of the I 80 ICM system Scenario 9 Ramp Queue Extends to Arterial Scenario Objective The objective of the scenario is to reduce the chance that freeway on ramp queues spill back to the arterial streets. Scenario Sequence of Events In the event that a freeway on ramp queue extends into the arterial intersection, the ARM will turn green to reduce the onramp queue until it is no longer obstructing the cross street. The sequence of events are shown in Figure and described below: Detector at the end of the Freeway on ramp detects queued vehicles; sends alert to ARM controller; ARM controller increases the ARM metering rate or turns the ramps metering signal all green: If the ramp metering signal has been turned all green then the I 80 Management Application: Alerts the D4 TMC Operator; Recalculates ARM global rate; and Schedules for the ramp signal to be turned back on, according to the Operating rules. 169 October 14, 2010

185 Figure Sequence of ARM Queue Control Operation Scenario 10 Construction and Maintenance Scenario Objective The objective of the scenario is to improve the safety and efficiency of construction and maintenance personal controlling traffic around a work zone. Scenario Sequence of Events Construction and maintenance activities are activities that occur along the freeway to create and maintain a high quality freeway. These activities may be stationary, as in repair of a section of road, or moving at slow speed, as in freeway sweeping. Construction and maintenance activities are typically non recurring, planned events. Construction and maintenance activities typically involve lane closures and reduced advisory speeds. The capacity of the lanes will be below normal capacity, because of the turbulence caused by the presence of activity in the closed lanes and/or on the shoulders. Scheduling Construction and Maintenance Activities The sequence of events for scheduling construction and maintenance activities are shown in Figure and described below: Work on the freeway is scheduled through the Operations Operator located at the D4 TMC; 170 October 14, 2010
186 The D4 Operations Operator informs the D4 TMC Operator that the Construction or Maintenance work is scheduled; D4 TMC Operator inputs the details of the scheduled Construction or Maintenance Work into the system. Operator to include details about which sub systems to be modified, for example: CMS; LUS; VASS; and HAR. I 80 Management Application updates the schedules in each affected sub system; and Each sub system database of scheduled events updated. Figure Sequence for Scheduling Construction and Maintenance Activities Activating Construction and Maintenance ATMS response The ATMS response will activate by I 80 ICM Management Application notifying an operator that an event is scheduled and requesting that the Action Plan be implemented. The Caltrans TMC operator will seek confirmation of the construction or maintenance activity being carried out, and then approve the implementation of the Action Plan. 171 October 14, 2010
187 End Result In reaction to construction and maintenance the ATM devices may adjust as follows: VASS may display an advisory speed less than the normal posted speed limit of 65mph at the location of the construction or maintenance activities. If the posted advisory speed is decreased, the posted speed on the VASS upstream of the construction or maintenance activities will be progressively decreased. For moving maintenance, such as shoulder sweeping and lane striping, advisory speed reduction can be moved dynamically in keeping with the position of maintenance vehicles. Advisory speed reduction can be implemented at the construction site and, should congestion occur because of demand approaching the remaining capacity, advisory speed reduction and lane change advice can be adjusted to reflect the length of queuing and the optimal location for the lane and speed management; ARM may be turned off since construction and maintenance will be occurring outside of peak hours; LUS will close the lanes that are obstructed by the construction or maintenance activities and an adjacent lane, as per Caltrans District 4 policy. The lane(s) will be progressively closed upstream of the construction or maintenance activities to ensure that the vehicles safely merge into the open lanes. For moving maintenance, such as shoulder sweeping and lane striping, lane closures can be moved dynamically in keeping with the position of maintenance vehicles; The CMS s upstream of the construction or maintenance on the freeway will display a message identifying the location of the activity and providing appropriate advance warning of lane closures ahead and/or advising the motorists to expect delays; HAR will broadcast a message identifying the location of the Crash and/or advising the motorists to expect delays. If it is not broadcasting a specific message it will be either turned on with a general statement or turned off, as per current Caltrans District 4 practice; and All CCTV cameras will be directed to their default preset position, or if an authorized user is accessing the CCTV camera then they can be focused as directed by the authorized user. All other devices will operate as per normal operations. An example lane use configuration for construction and maintenance scenarios are shown in Figure and Figure October 14, 2010
188 Figure Lane Use Sign Configuration for Construction and Maintenance Scenario (Option A) This figure shows an example of what the CMS, LUS and VASS signs may display under this operational scenario. The actual display based on operational requirements will be determined by Caltrans District 4 division of Operations. 173 October 14, 2010

189 Figure Lane Use Sign Configuration for Construction and Maintenance Scenario (Option B) This figure shows an example of what the CMS, LUS and VASS signs may display under this operational scenario. The actual display based on operational requirements will be determined by Caltrans District 4 Division of Operations. 174 October 14, 2010
190 Scenario 11 - Operational Rules and Action Plans Updated Scenario Objective The objective of the scenario is to update the Operational Rules and Action Plans in the I 80 ICM Management Application. Scenario Sequence of Events The operational rules and the Action Plan for the I 80 ICM system must be configured and routinely updated. This task is carried out by the Division of Operations in conjunction with the CHP and appropriate jurisdictions. The sequence of events is shown in Figure and described below: Caltrans Division of Operations user updates the Operational Rules and/or the Action Plan for one or all of the sub systems, for example: Incident Detection; Variable Advisory Speed Signs; Adaptive Ramp Metering; Lane Use Signals; Changeable Message Signs; Highway Advisory Radio; Traffic Signal System; and Trailblazer. I 80 Management Application updates the operational rules of each affected sub system and/or updates the Action Plan; and Each sub system database of operational rules updated and/or Action Plan updated. 175 October 14, 2010
191 Figure Sequence of Events for updating the Operational Rules and Action Plans 176 October 14, 2010
192 Scenario 12 Delay in Operator Input Scenario Objective The objective of the scenario is to identify how the system will operate in the event that a user is not available to respond to an event. Scenario Sequence of Events The sequence of events that occur when the system does not receive the required input from a user is shown in Figure 11 17Error! Reference source not found. and described below: I 80 Management Application requests input from Operator; Time elapses without any operator input; I 80 Management Application sends an alert to the Operator to advise that the Application is waiting for input. Alert sent by: SMS, , pager; TMC Operator responds to system request and system returns to normal. OR time elapses without any operator input; I 80 Management Application sends an alert to the second level escalation (TMC Manager) to advise that the Application is waiting for input. Alert sent by: SMS, , pager; and TMC Operator responds to system request and system returns to normal OR System waits until an input is received. 177 October 14, 2010
193 Figure System Response to Delay in Receiving User Input 178 October 14, 2010
194 11.2 System Failure Events In the event that a device or process fails in the system, the system must be configured so that it fails in a graceful and controlled manner. The following scenarios detail how the system will react to given failure events Scenario 13 Loss of Connectivity to a Field device Scenario Objective The objective of the scenario is to identify how the system will operate in the event that the application loses connectivity to a field device. Scenario Sequence of Events The sequence of events that occur when the system loses connectivity to a field device is shown in Figure and described below: I 80 Management Application detects the loss of connectivity during its scheduled process of checking for connectivity to each devices; I 80 Management Application initiates the event Action Plan by: Logging the event in the system log file; and Sending an alert to the selected distribution list. This list might include the D4 TMC Operator and the D4 Electrical Systems staff. Alert could be by , SMS or pager. If required, the I 80 Management Application adjusts the operation of all other devices to account for the loss of device connectivity; D4 TMC Operator coordinates with other people, like a City Engineer, D4 Maintenance or D4 Electrical Systems staff to restore field devices back to normal operations; I 80 Management Application continues to monitor the field devices to detect when connectivity is restored; The appropriate Caltrans and/or City staff work to resolve the system issue; Connectivity is restored either through: Caltrans and/or City staff resolving a fault; Third party power or communications provider resolving a fault; and The system self recovers. System returns to normal operation Operator checks functionality of all devices; and System logs the event resolution. 179 October 14, 2010
195 Figure Sequence of Events When the System Looses Connectivity to a Field Device 180 October 14, 2010
196 Scenario 14 District 4 Traffic Management Center Unavailable Scenario Objective The objective of the scenario is to identify how the system will operate in the event that the Caltrans District 4 TMC is unavailable. Scenario Sequence of Events In the event that the Caltrans D4 TMC becomes unavailable or unusable, all field devices operating through the TMC will operate in their local failed state. This will be the powering down of some devices and the operation in a local responsive nature for other devices. The diagrams showing the failure mode of each device is located Appendix D. These failure responses are summarized in Table Table 11-1 Field Device Connectivity Failure Response Field Device Immediate Response 16 Delayed Response 17 Lane Use Signals Go Dark Not Applicable Variable Advisory Speed Sign Go Dark Not Applicable Adaptive Ramp Metering Act Locally Responsive Not Applicable Changeable Message Signs Follow last received command Go Dark Highway Advisory Radio Follow last received command Stop transmitting Vehicle Detection Continue counting and store data Not Applicable CCTV Camera Follow last received command Not Applicable Trailblazers Follow last received command Go Dark 16 Immediate Response refers to the action the field device takes as soon as it determines that it is no longer in communication with the I 80 ICM Management Application. 17 Delayed Response refers to the action the field device takes after a predetermined period of time of no connectivity to the I 80 ICM Management Application. 181 October 14, 2010
197 Scenario 15 City Traffic Management Center Unavailable Scenario Objective The objective of the scenario is to identify how the system will react if one or more of the city s TMC s are unavailable. Scenario Sequence of Events In the event that a city TMC becomes unavailable or unusable, all field devices operating through the TMC will operate in their local failed state. This will be the powering down of some devices and the operation in a local responsive nature for other devices. The diagrams showing the failure mode of each device is located Appendix D. These failure responses are summarized in Table Table 11-2 Field Device Connectivity Failure Response Field Device Immediate Response 18 Delayed Response 19 Traffic Signal System No Change No Change Transit Signal Priority Not Applicable Not Applicable Emergency Vehicle Preemption Not Applicable Not Applicable Changeable Message Signs Follow last received command Go Dark CCTV Camera Follow last received command Not Applicable Trailblazers Follow last received command Go Dark 18 Immediate Response refers to the action the field device takes as soon as it determines that it is no longer in communication with the local TMC control application. 19 Delayed Response refers to the action the field device takes after a predetermined period of time of no connectivity to the local TMC control application. 182 October 14, 2010
198 11.3 System Security Events Scenario 16 Unauthorized Access Scenario Objective The objective of the scenario is to identify how the system will react to an unauthorized attempt to access the system. Scenario Sequence of Events The sequence of events that occur when unauthorized access to the system is attempted or obtained is shown in Figure and described below: Unauthorized I 80 ICM System access is attempted by: Obtaining physical access to a Field Cabinet; Accessing the system through the Management Application; and Accessing the system through the I 80 ICM Network. System will log the event, and if required to do so the system will send alerts to a distribution list via: ; SMS; and/or Pager. If an alert is sent to a user, the user will act as per operating procedures. 183 October 14, 2010
199 Figure Sequence of Events for Responding to Unauthorized Access 11.4 Maintenance Events During maintenance, the system will respond to the event in the same way that it responds to a failure event. The system will operate as if there is a loss in connectivity until such time as the device is brought back on line. All failure event operation is shown in Appendix D. 184 October 14, 2010
200 12 SUMMARY OF IMPACTS This chapter provides an analysis of the proposed system and the impacts on each of the stakeholders. It is presented from the viewpoint of each, so that they can readily understand and validate how the proposed system will impact their operations. Any major constraints on system development are documented. Metrics for assessing system performance are also included Stakeholders The stakeholders of the Interstate 80 (I 80) Integrated Corridor Mobility (ICM) project must fully commit to active operation of the project concept elements. The technologies that will be deployed will not achieve the goals of the project unless they are actively used by all agencies to manage traffic. In order to have the system operate efficiently, stakeholders must collectively commit staff and budget to operate the system Caltrans District 4 This project will provide California Department of Transportation (Caltrans) District 4 with new equipment to operate and maintain. Equipment included on this project that will be under Caltrans District 4 control includes: additional closed circuit television (CCTV) cameras; adaptive ramp metering (ARM); trailblazer signs; additional vehicle detection; additional highway advisory radio (HAR) towers; additional changeable message signs (CMS); overhead sign structures; lane use signals (LUS); Variable Advisory Speed (VAS) signs; and I 80 ICM Management Application. During the construction phase Caltrans District 4 will need to approve and permit the construction activities to occur at a rate that will meet the project timetable. The construction activities will require lane closures at various times to permit the installation of some of the equipment. Caltrans District 4 will need to assist in the coordination of the lane closures. Caltrans District 4 must contribute to the I 80 ICM Operation and Maintenance (O&M) cost. Without the appropriate O&M funding the I 80 ICM system will not be able to operate efficiently. Caltrans D4 TMC Operator The I 80 ICM system will operate 24 hours a day. The system will require operator oversight, input and control in the event of a change of conditions in the corridor. The TMC operator will be responsible for implementing the freeway management strategies. The operator will be responsible for operating the VASS, CMS, LUS, ARM, trailblazer, traffic signal system (during incidents), and HAR devices. The operator will also use the CCTV cameras to monitor the status of the freeway and to confirm any detected incidents. Incidents will either be automatically detected by the I October 14, 2010
201 ICM system or reported to the Caltrans District 4 TMC. Once the incident is confirmed by the operator, the operator will work with all relevant agencies to implement an appropriate incident management plan. Caltrans District 4 staff will need to be trained in how to operate and maintain the equipment. Some of the equipment will be new and much of the software will be new. The Caltrans D4 TMC operator interaction with the I 80 ICM system is represented in Figure October 14, 2010
202 Figure 12-1 Caltrans D4 TMC Operator Interaction with the System 187 October 14, 2010
203 Caltrans D4 Office of Traffic The Caltrans D4 Office of Traffic will be responsible for developing the operation plans, incident management plans and defining any other criteria required for the operation of the I 80 ICM system. These plans include the strategies and configuration of: End of Queue warning via the VASS system; LUS system; ARM; Incident management plans; CMS and HAR messages associated with each corridor event; Automated CCTV camera settings for a given event; Vehicle detection sampling rates; and Trailblazer sign operation (in conjunction with each city). Flush plan implementation on the arterial (in conjunction with each city); 188 October 14, 2010
204 Figure 12-2 Caltrans Office of Traffic 189 October 14, 2010
205 Caltrans D4 Office of Electrical Systems The Caltrans D4 Office of Electrical Systems will be responsible for the management of new field devices and computer systems implemented as part of the I 80 ICM. This team is responsible for: Monitoring the operational status of each device, computer system and network connection that forms part of the I 80 ICM system; Addressing system or equipment faults within an agreed period of time. Response time agreed with other stakeholders and dependent on the criticality of the fault; and Securing, monitoring and responding to unauthorized system access. The maintenance staff will need to be trained in how to operate and maintain the equipment. Caltrans District 4 information technology staff will be required to maintain the computer equipment in the TMC. 190 October 14, 2010
206 Figure 12-3 Caltrans Office of Electrical Systems 191 October 14, 2010
207 Caltrans construction and maintenance Caltrans District 4 maintenance will now have the active traffic management (ATM) devices to help control the traffic around maintenance activities. With the use of the LUS, CMS and VASS, the conditions at and around construction and maintenance sites will be safer with smoother traffic flow. Freeway Service Patrol The Freeway Service Patrol (FSP) will continue to work with the TMC operator and other Caltrans staff to respond to events on the freeway. The FSP will be a source of information for the TMC operator Metropolitan Transportation Commission The Metropolitan Transportation Commission (MTC) will help promote the project to all the stakeholders to ensure the continued success of the system. MTC will achieve this through assisting ACTC/ACCMA: Assessing performance measures; and Implementing and coordinating the update of institutional agreements ACTC/ACCMA Alameda County Transportation Commission (ACTC)/Alameda County Congestion Management Agency (ACCMA) is the project lead agency on the I 80 ICM project. They will oversee the implementation of the project and work with all agencies to ensure the implementation of the project in a manner that meets the project objectives. Once the project is in the Operation and Maintenance (O&M) phase ACTC/ACCMA will continue to promote the project to all the stakeholders. The project will need an ongoing commitment from all stakeholders to ensure its continued success. ACTC/ACCMA will achieve this through: Assessing performance measures; and Implementing and coordinating the update of institutional agreements Contra Costa Transportation Authority The Contra Costa Transportation Authority (CCTA) will be responsible for coordinating the commitment of its member agencies to this project. They will help ensure that the project implemented is a viable project and that all its member agencies continue to support the project through the O&M phase. CCTA will achieve this through: Assessing performance measures; and Implementing and coordinating the update of institutional agreements West Contra Costa Transportation Advisory Committee The West Contra Costa Transportation Advisory Committee (WCCTAC) will be responsible for coordinating the commitment of its member agencies to this project. They will help ensure that the project implemented is a viable project and that all its member agencies continue to support the project through the O&M phase. WCCTAC will achieve this through: 192 October 14, 2010
208 Assessing performance measures; and Implementing and coordinating the update of institutional agreements Local Agencies During construction there will be upgrades to the traffic signal system, installation of communication lines, installation of CCTV cameras and installation of trailblazer signs. Each of the local agencies will have to coordinate with the project team to ensure that the installation is completed with minimal impact and in a timely manner. As part of the project each city will receive new computer equipment at their traffic operations center (TOC). This equipment will be used to operate and/or monitor the I 80 ICM systems. This will assist the TOC staff to coordinate normal traffic operations and coordinate responses to incidents that affect the traffic flow within their jurisdiction. Emergency vehicle preemption (EVP) and transit signal priority (TSP) will be added to the traffic signal systems for the arterial roads. EVP will be installed on selected intersections to ensure that emergency response vehicles can get to an incident in a timely manner. TSP will be installed on selected buses and intersections, thereby assisting those buses operating in the corridor to adhere to their timetable. In the event of an incident, the local agencies will need to coordinate their response with the Caltrans District 4 TMC operator and the other affected agencies. With this coordinated approach traffic will flow more smoothly and conditions will return back to normal in a timely manner. New systems require a new level of skills for using the systems effectively. Local agency staff will need to undergo training in each of the systems that they will use. The local agencies will need to commit to staffing the TOC with people who are skilled in using the systems. ARM will be operating at the freeway on ramps in the corridor. The local agency traffic operations staff will be able to view the conditions at each of these on ramps via CCTV cameras. Each local agency will participate in managing incidents in the corridor. All agencies need to participate in the development and implementation of these incident management strategies. Local agencies contribute to the I 80 ICM Operation and Maintenance (O&M) cost. appropriate O&M funding the I 80 ICM system will not be able to operate efficiently. Without the In summary Local agencies will be responsible for: Participating in coordination and approval of institutional strategies; Working with Caltrans D4 to develop all relevant Action Plans related to the operation of the I 80 ICM System; Coordinating with Caltrans District 4 and CHP on incident response implementation and removal; Coordinating with Caltrans District 4 on ramp meter operations; Operating and maintaining the city TMC equipment; and 193 October 14, 2010
209 Maintaining in an appropriate operational state all devices that are owned and operated by the city but required elements of the I 80 ICM TMC. Figure 12-4 City Engineer Interaction with the System WestCAT WestCAT will continue to operate buses in the corridor. TSP devices will be installed on selected buses to provide priority to the buses at selected intersections along the bus route. WestCAT will contribute in the development of the corridor incident management strategies. The role that they will undertake in the event of an incident will be clarified during the course of this project. 194 October 14, 2010
210 AC Transit AC Transit will continue to operate buses in the corridor. TSP devices will be installed on selected buses to provide priority to the buses at selected intersections along the bus route. AC Transit will contribute to the development of the corridor incident management strategies. The role that they will undertake in the event of an incident will be clarified during the course of this project BART Bay Area Rapid Transit (BART) will provide timetable information to the Traveler Information System to allow comparative travel times to be displayed Amtrak Amtrak will provide timetable information to the Traveler Information System to allow comparative travel times to be displayed Water Emergency Transportation Authority Water Emergency Transportation Authority (WETA) will provide timetable information to the Traveler Information System to allow comparative travel times to be displayed California Highway Patrol The CHP is responsible for the enforcement of the California Vehicle Code (CVC) and has the legal authority and responsibility for incident management on I 80. CHP will now have the ability to open and close lanes using the Lane Use Signs located on the overhead sign structures. With the assistance of the I 80 ICM TMC operator the CHP could close lanes without the need for squad cars to travel out to the beginning of the lane closure. This would allow quicker response for the CHP and help to reduce the chance of secondary crashes after an incident on the freeway. These lane closures could also assist the CHP in clearing a path for emergency vehicles responding to a crash. CHP will have the ability to view the status of the corridor through the traffic surveillance and monitoring systems. Through this system the dispatch center will be able to view the CCTV cameras along the length of the corridor. This will allow the CHP to confirm the presence of a crash; hence, they will be able to quickly coordinate an appropriate response. In addition, crashes will be identified quicker via the incident detection system alerting the operator to a potential crash location. CHP will be a lead in the development of the corridor incident management strategies Media Media will continue to report on current corridor traffic conditions. They will now have access to better information due to the increased level of detection and monitoring and the improved level of traveler information systems Private Vehicle Operators Private vehicle operators will experience an improved level of service for their travels through the I 80 ICM corridor. 195 October 14, 2010
211 In the event of a crash in the corridor, the people involved in the crash will receive assistance faster and those who are not involved in the crash will experience a reduced impact on their travel time through the corridor. If the crash occurs on the freeway, lanes may be closed and the advisory speed may be lowered. If a vehicle exits the freeway in order to avoid the crash, the vehicle will be directed along the arterial road and back to the freeway at the earliest convenient site downstream of the crash. Drivers should follow these directions. Travel information will be improved for traveling in the corridor. The traveler will be able to access this information as they currently do through the SF Bay Area 511 website and phone services. Additional information will be provided on the many new CMS s and overhead sign structures that will be installed in the corridor. A variety of new equipment will be installed in the corridor. Some of the devices installed will be new to the Bay Area, such as the LUS and VASS. Private vehicle operators will have to adapt to these new devices. Signals are already coordinated, but local drivers may be more impacted when there is a flush plan in operation. Improvements made in the corridor will make transit travel more accessible. Additional signs providing information about parking and transit will provide private vehicle operators the opportunity to switch to transit travel for their journey into or through the corridor. These signs, coupled with CMS displayed corridor travel times, will allow private vehicle operators to make an informed decision about the travel advantage of using transit options for completing their journey. With the implementation of VASS, ARM and LUS, travel along the freeway will be safer with more consistent travel times. With the implementation of the Traveler Information System, the travel times and conditions will be more easily determined by the private vehicle operator. All of this combined will lead to more satisfied private vehicle operators. 196 October 14, 2010
212 Figure 12-5 Private Vehicle Operator Interaction with the System Bicycles and Pedestrians Pedestrians and bicycles will continue to operate in the corridor unaffected by the changes. 197 October 14, 2010
213 Commercial Vehicle Operators Commercial vehicles will continue to operate in the traffic stream along with private vehicles. The conditions and benefits described above for private vehicles operators will also apply to commercial vehicle operators System Constraints System must be developed within the time and budget dictated by the terms and conditions of the project funds. System should use existing infrastructure as much as feasible Required Agreements The I 80 ICM system crosses multiple jurisdictional boundaries and will require inter agency coordination to effectively manage the system and to coordinate response to incidents or traffic congestion. The foundation of this cooperation is the Memorandum of Understanding for the SMART Corridors program that addressed the transportation management of the SMART Corridor. In addition to updating the MOU to address the ICM components, the following agreements should be developed or modified: East Bay SMART Corridors Operations and Maintenance Agreement; Video Access and Control; Interagency Agreement and Standard Operating and Maintenance Procedures; Incident Management Agreements; and Joint Powers Agreement. Ramp Metering Agreement East Bay SMART Corridors Operations and Maintenance Agreement This is an existing agreement that can be continued or expanded to include Traffic Light Synchronization Program (TLSP) concepts. Existing agreement covers transit signal priority and CCTV camera systems maintenance and responsibility along San Pablo Ave, International Blvd, East 14th Street, and Telegraph Avenue Video Access and Control The purpose of this agreement is to define the terms of sharing video images and controlling camera operation. This agreement will be between local agencies and Caltrans District 4 with the intent to provide video image access to all agencies. This functionality will include individual agency definable security on a per camera, per agency and per person basis to allow an agency to define which cameras are available to which users, pre set views (if any) and to allow for an agency to maintain priority control of the cameras in their ownership. An interagency operating agreement would include the parameters of allowable use by each agency that owns CCTV cameras, including Caltrans District 4. This agreement will include special terms for cameras at freeway ramps that may be on Caltrans District 4 property, but will be controlled by local agencies. 198 October 14, 2010
214 Interagency Agreement and Standard Operating and Maintenance Procedures This agreement will outline procedures for normal operations of the project. This will include operation of CCTV cameras, maintenance of equipment, and signal coordination Incident Management Agreements This agreement will outline incident management procedures including operations of trailblazers and incident response routes and initiation and termination of signal flush plans. The agreement will stipulate that the local agencies delegate operation of the trailblazers to provide a unified response to an incident. These agreements will also specify the implementation and operations of the signal flush plans Ramp Metering Agreements This agreement is a memorandum of understanding between local agencies and Caltrans District 4 to determine the operations of ramp meters including when the ramp metering rates should be adjusted, thresholds for congestion, and operations of field equipment Joint Powers Agreement This agreement is between Caltrans District 4 and local agencies to provide for operations of field equipment and information sharing from a central point. Local agencies and Caltrans District 4 will determine the location of an I 80 ICM Transportation Management Center (TMC), which will be located within the Caltrans District 4 TMC Performance Measures Performance measures are important for determining the extent to which the system achieves the project s goals and objectives. The performance measures can be either quantitative or qualitative. Each business requirement should be associated with a measurable metric that allows the stakeholders to assess whether or not the requirement has been met, or continues to be met, by the system. In addition to system performance measures, it will be appropriate to measure the efficiency and effectiveness of the stakeholders through measures of agency performance. These metrics will quantify the extent to which each organization performs the tasks for which it is responsible. As the system is developed, metrics will be defined that quantify the performance of the transportation system. As far as possible, these metrics should rely on data that will be automatically collected by the system. However, if they need to be supplemented by separate surveys, these will be identified and explicit test or evaluation plans developed. As operation and maintenance plans are developed, each stakeholder will agree on their roles and responsibilities for both day to day operation and routine and preventative maintenance. Specific metrics will be prepared and incorporated into agreements, as appropriate. 199 October 14, 2010
215 System Performance Measures The exact metrics that will be used as performance measures will be dependent upon the availability of data. The metrics that may be used include: Incidents Time to respond to incident after detection; Time to clear incident; Extent of congestion on freeway as a result of incident; Extent of diversion of traffic from freeway as a result of incident; Changes in traffic conditions on arterials as a result of incident; Crash patterns and causes; Frequency, type, and severity of primary and secondary incidents; Changes in transit patronage during incidents; and Changes in emergency vehicle travel times while responding to incident. Recurrent Congestion Throughput at bottlenecks; Average travel time or speed; Variability in travel time or speed; Time of onset of flow breakdown at bottlenecks; Extent and duration of queuing at bottlenecks; Traffic volumes on arterial roads; and Delays at on ramps. Transit Transit on time performance; Average travel times; Variability of travel times; and Transit patronage. Traveler information Reliability of traveler information; and Effect of traveler information on travel choices (mode, route and time of travel). 200 October 14, 2010
216 Agency Performance Measures Agency performance measures will be prepared to measure the extent to which each stakeholder achieves the efficiency and effectiveness agreed to for their respective responsibilities. These will include such items as: Operation Time to take requested action when requested by another agency or by the incident management software; Time to respond to requests for changes to operational plans (such as incident management plans; traffic signal flush plans); and Tracking operators response to detection or notification of incidents. Maintenance Time to respond to equipment faults of various types; Time to repair equipment faults; and Time to respond to requests for changes to system configuration. 201 October 14, 2010
217 Appendix A Acronyms
218 Acronym Description ACCMA Alameda County Congestion Management Agency ACTC Alameda County Transportation Commission ACTA Alameda County Transportation Authority ACTIA Alameda County Transportation Improvement Authority ADSL Asymmetric Digital Subscriber Line ARM Adaptive Ramp Metering ATM Active Traffic Management BART Bay Area Rapid Transit CAD Computer Aided Dispatch Caltrans California Department of Transportation CCTA Contra Costa Transportation Authority CCTV Closed Circuit Television CHP California Highway Patrol CIP Capital Improvement Projects CLEAR CHP CLEAR program CMA Congestion Management Agency CMIA Corridor Mobility Improvement Account CMS Changeable Message Sign CTC California Transportation Commission CTCDC California Traffic Control Devices Committee CVO Commercial Vehicle Operation EMS Extinguishable Message Sign EVP Emergency Vehicle Pre-emption FHWA U.S. Department of Transportation Federal Highway Administration FMS Freeway Management System FSP Freeway Service Patrol GPRS General Packet Radio Service HAR Highway Advisory Radio HAZMAT Hazards Materials HCM Highway Capacity Manual HOV High Occupancy Vehicle I-80 Interstate 80 ICM Integrated Corridor Mobility IRP Incident Response Plan ITS Intelligent Transportation System LCD Liquid Crystal Display LUS Lane Use Signs MPO Metropolitan Planning Organization MTC Metropolitan Transportation Commission MUTCD Manual on Uniform Traffic Control Devices National Transportation Communications for Intelligent NTCIP Transportation Systems Protocol
219 Acronym O&M PeMS POTS PTZ RTP SAFE SEMP SR CWARM TAC TIC TIP TIS TLSP TMC TMP TOAR TOC TOD TOPS TOS TSP TSP VASS WCCTAC WETA Description Operation and Maintenance Freeway Performance Measurement System Plain Old Telephone Line Pan/Tilt/Zoom Regional Transportation Plan Service Authority for Freeways and Expressways System Engineering Management Plan State Road Corridor Wide Adaptive Ramp Metering Technical Advisory Committee Traveler Information Center Transportation Improvement Plan Traveler Information System Traffic Light Synchronization Program Traffic Management Center Traffic Management Plan Traffic Operations Analysis Report Traffic Operations Center Time of Day Traffic Operation Strategic Traffic Operations System Transit Signal Priority Transit Signal Priority Variable Advisory Speed Sign West Contra Costa Transportation Advisory Committee Water Emergency Transportation Authority
220 Appendix B TLSP Existing and Proposed Field Device
221 Existing CCTV camera location Main Street Cross Street City 1 San Pablo Ave West Grand Oakland 2 West Grand Mandela Pkwy Oakland 3 West Grand Telegraph Oakland 4 Telegraph 20th Oakland 5 Telegraph W Macarthur Oakland 6 San Pablo Ave 40th Emeryville 7 San Pablo Ave Stanford Oakland 8 Powell Christie Emeryville 9 San Pablo Ave Ashby Berkeley 10 Ashby 7th Berkeley 11 Ashby I80 Berkeley 12 San Pablo Ave University Berkeley 13 University 6th Berkeley 14 San Pablo Ave Gilman Berkeley 15 Gilman I80 Berkeley 16 San Pablo Ave Buchanan Berkeley 17 Buchanan I80 Berkeley 18 San Pablo Ave Central Albany 19 Central I80 Albany 20 San Pablo Ave Potrero Albany 21 San Pablo Ave Cutting Albany 22 San Pablo Ave MacDonald Albany 23 San Pablo Ave San Pablo Dam Road Albany 24 San Pablo Dam Road I80 Albany 25 San Pablo Ave Church Lane Albany 26 San Pablo Ave Richmond Pkwy Richmond 27 San Pablo Ave Hwy 4 Hercules Proposed CCTV PTZ Camera Location Main Street Cross Street 1 Pomona St I-80 (WB on-ramp) 2 Pomona St I-80 (EB on-ramp) 3 Cummings Skwy I-80 (WB on-ramp) 4 Cummings Skwy I-80 (EB on-ramp) 5 Willow Ave I-80 (WB on-ramp) 6 Willow Ave I-80 (EB on-ramp) 7 John Muir Pkwy I-80 (WB and EB on-ramp) 8 Pinole Valley Rd I-80 (WB on-ramp)
222 Proposed CCTV PTZ Camera Location Main Street Cross Street 9 Pinole Valley Rd I-80 (EB on-ramp) 10 Appian Way I-80 (WB on-ramp) 11 Appian Way I-80 (EB on-ramp) 12 Richmond Pkwy I-80 (WB on-ramp) 13 Richmond Pkwy I-80 (EB on-ramp) 14 Hilltop Dr I-80 (WB on-ramp) 15 Hilltop Dr I-80 (EB on-ramp) 16 El Portal Dr I-80 (WB on-ramp) 17 El Portal Dr I-80 (EB on-ramp) 18 San Pablo Dam Rd I-80 (WB on-ramp) 19 San Pablo Dam Rd I-80 (EB on-ramp) 20 Solano Ave I-80 (WB on-ramp) 21 San Pablo Ave I-80 (EB on-ramp) 22 Barrett Ave I-80 (WB on-ramp) 23 Cutting Blvd I-80 (EB on-ramp) 24 Potrero Ave I-80 (WB on-ramp) 25 Carlson Blvd I-80 (WB on-ramp) 26 Carlson Blvd I-80 (EB on-ramp) 27 Central Ave I-80 (WB on-ramp) 28 Central Ave I-80 (EB on-ramp) 29 Buchanan St I-80 (WB on-ramp) 30 Buchanan St I-80 (EB on-ramp) 31 Gilman St I-80 (WB on-ramp) 32 Gilman St I-80 (EB on-ramp) 33 University Ave I-80 (WB on-ramp) 34 University Ave I-80 (EB on-ramp) 35 Potter St I-80 (EB on-ramp) 36 Ashby Ave I-80 (WB on-ramp) 37 Ashby Ave I-80 (EB on-ramp) 38 Frontage Rd I-80 (WB on-ramp) 39 Powell Rd I-80 (WB on-ramp) 40 Powell Rd I-80 (EB on-ramp) 41 Central Ave Carlson Blvd 42 Central Ave Belmont Ave 43 San Pablo Ave Cedar St. 44 San Pablo Ave Dwight Wy 45 San Pablo Ave Moeser Ln 46 San Pablo Ave El Portal Dr 47 San Pablo Ave Hilltop Dr 48 San Pablo Ave Pinole Valley Road 49 San Pablo Ave Appian Way
223 Proposed CCTV PTZ Camera Location Main Street Cross Street 50 San Pablo Ave Parker Ave 51 San Pablo Ave Cummings Skyway Note: CCTV PTZ Cameras included in the enhanced project list are not included. Intersection Existing EVP Detectors Proposed EVP Detectors Oakland W. Grand Ave/San Pablo Ave W. Grand Ave/Market St none W. Grand Ave/Adeline St none W. Grand Ave/Poplar none W. Grand Ave/Mandela Pkwy none W. Grand Ave/Frontage Rd none W. Grand Ave/Wake Ave/Maritime St none Stanford Ave/San Pablo Ave Emeryville Powell St/Beaudry Powell St/Hollis St Powell St/Christie Ave Powell St/I Powell St/Frontage Berkeley Ashby Ave/San Pablo Ave Ashby Ave/9th St Ashby Ave/7th St none University Ave/San Pablo Ave University Ave/9th St none University Ave/6th St none Gilman St/San Pablo Ave Gilman St/8th St none Gilman St/6th St none Albany Buchanan St/San Pablo Ave Marin Ave/San Pablo Ave Buchanan St/Jackson St Buchanan St/I-80 (East) none Buchanan St/I-80 (West) none Solano Ave/San Pablo Ave El Cerrito
224 Intersection Existing EVP Detectors Proposed EVP Detectors Central Ave/San Pablo Ave Central Ave/San Luis St/Pierce St none Carlson Blvd/San Pablo Ave Carlson Blvd/Central Ave none Potrero Ave/San Pablo Ave Potrero Ave/Eastshore Blvd none Cutting Blvd/San Pablo Ave Cutting Blvd/I-80 (median) none Richmond MacDonald Ave/San Pablo Ave McBryde Ave/San Pablo Ave Central Ave/I-80 (East) none Central Ave/I-80 (West) none Carlson Blvd/Huntington Ave Cutting Blvd/I-80 (West) none San Pablo San Pablo Dam Rd/San Pablo Ave San Pablo Dam Rd/Contra Costa Ave none San Pablo Dam Rd/Ventura Ave none San Pablo Dam Rd/I-80 (West) none San Pablo Dam Rd/I-80 (East) none El Portal Dr/San Pablo Ave El Portal Dr/Road 20 none El Portal Dr/Rollingwood Dr none El Portal Dr/Fordham St 1-721, El Portal Dr/Glenlock St El Portal Dr/I-80 (West) none El Portal Dr/I-80 (East) none Hilltop Dr/San Pablo Ave Hilltop Dr/Research Dr none Hilltop Dr/Hillview Dr none Hilltop Dr/Robert Miller Dr none Hilltop Dr/Shane Dr none Hilltop Dr/Blume Dr none Hilltop Dr/I-80 (West) none Hilltop Dr/I-80 (East) none Richmond Pkwy/San Pablo Ave Richmond Pkwy/Lakeside Dr
225 Intersection Existing EVP Detectors Proposed EVP Detectors Richmond Pkwy/Bella Vista (entrance) Richmond Pkwy/I-80 (West) Pinole Richmond Pkwy/I-80 (median) none Richmond Pkwy/I-80 (East) none Fitzgerald Dr/Pinole Vista Crossings Fitzgerald Dr/Best Buy (entrance) Fitzgerald Dr/K-Mart Entrance Fitzgerald Dr/Appian Way Appian Way/San Pablo Ave Appian Way/Mann Dr Appian Way/Tara Hills Dr/Canyon Dr none Appian Way/I-80 (West) none Appian Way/I-80 (East) none Pinole Valley Rd/San Pablo Ave none Pinole Valley Rd/Tennent Ave Tennent Ave/San Pablo Ave Pinole Valley Rd/Henry Ave Pinole Valley Rd/I-80 (West) Pinole Valley Rd/I-80 (East) Hercules John Muir Pkwy/San Pablo Ave Willow Ave/Hawthorne Dr Willow Ave/I-80 (West) none Willow Ave/I-80 (East) Contra Costa County Willow Ave/San Pablo Ave Cummings Skyway/San Pablo Ave (Primary Route/Cross-Street) Total Note: Existing and Proposed EVP for Primary Route only.
226 Appendix C Freeway Management System Existing and Proposed Field Devices
227
228
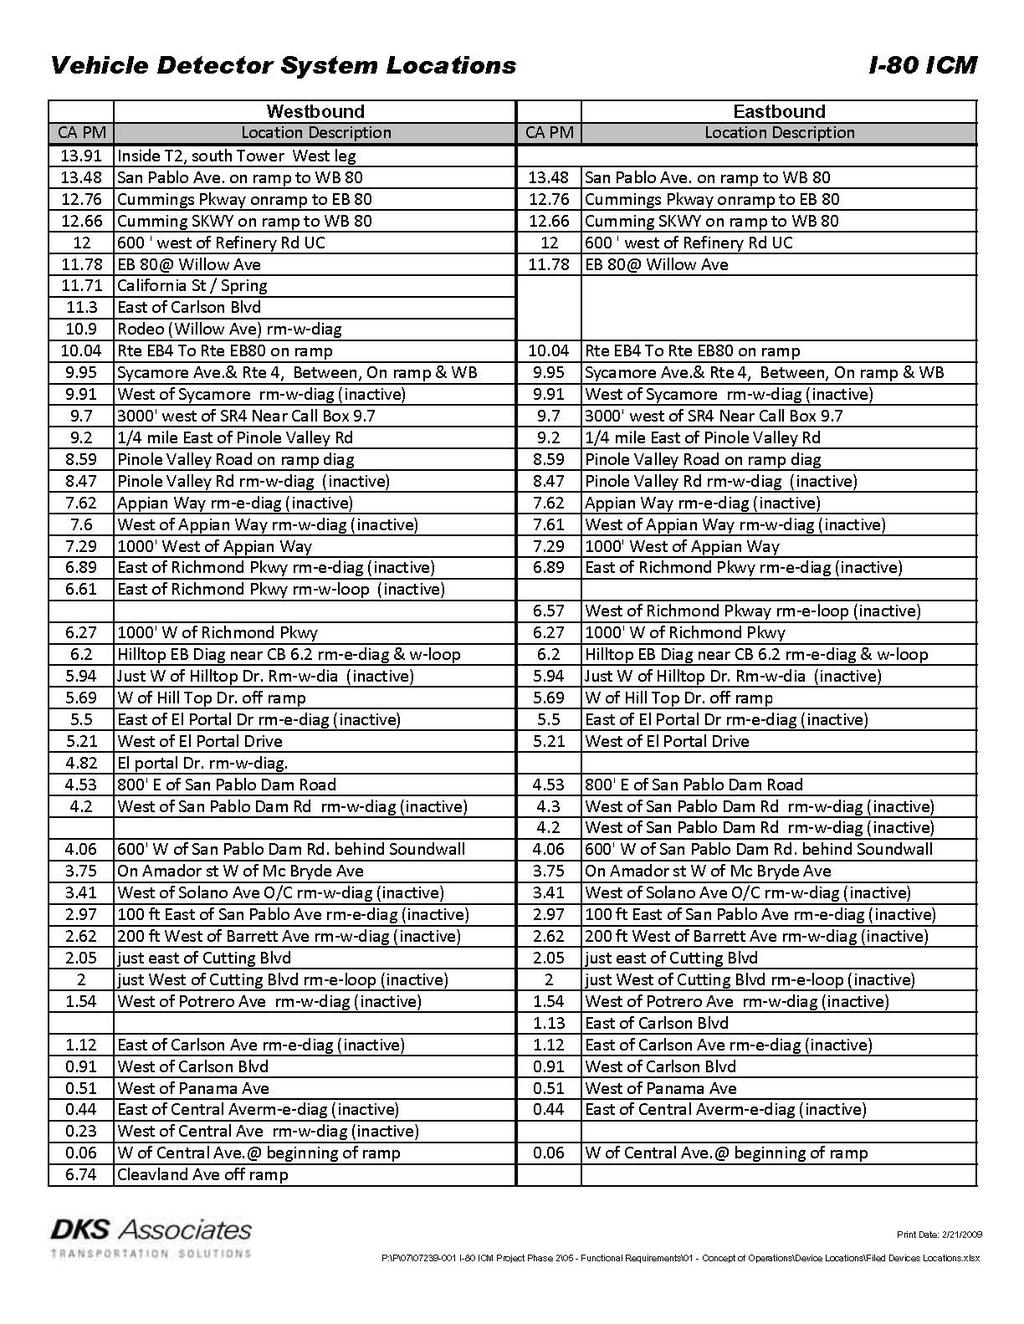
229
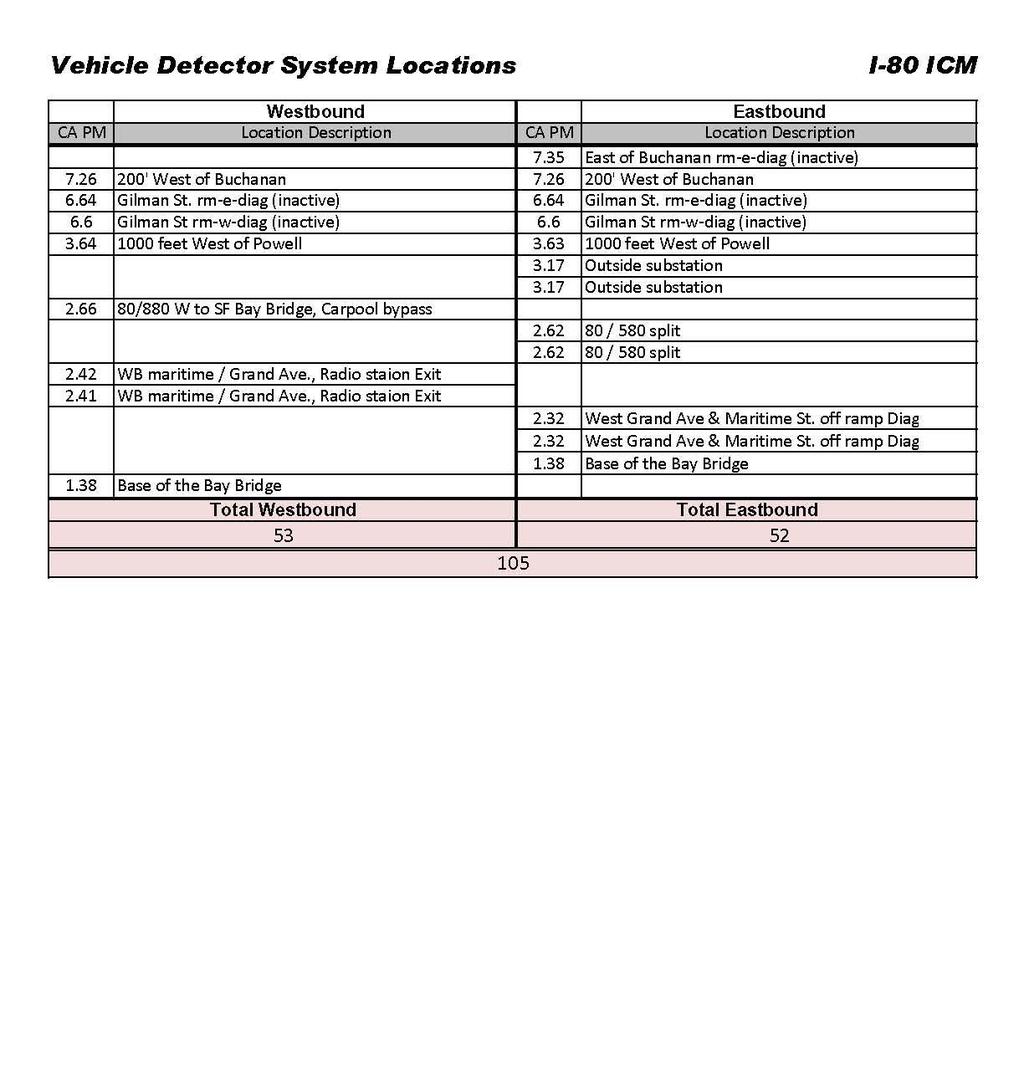
230

231 Note: Existing and Proposed EVP for Primary Route only.
I-80 Integrated Corridor Mobility (ICM) Project Corridor System Management Plan (CSMP)
 Project Corridor System Management Plan (CSMP)") I-80 Integrated Corridor Mobility (ICM) Project Corridor System Management Plan (CSMP) WCCTAC TAC Presentation June 10, 2010 DRAFT 1 Study Corridor Existing Conditions I-80 Corridor CSMP Near-Term Conditions
I-80 Integrated Corridor Mobility (ICM) Project Corridor System Management Plan (CSMP) WCCTAC TAC Presentation June 10, 2010 DRAFT 1 Study Corridor Existing Conditions I-80 Corridor CSMP Near-Term Conditions
The I-80 Integrated Corridor Mobility (ICM) Project
 Project") The I-80 Integrated Corridor Mobility (ICM) Project ITE San Francisco Bay Area Section Presented by Randy Durrenberger February 21, 2013 Presentation Outline Introduction / Background Project Element Strategy
The I-80 Integrated Corridor Mobility (ICM) Project ITE San Francisco Bay Area Section Presented by Randy Durrenberger February 21, 2013 Presentation Outline Introduction / Background Project Element Strategy
U.S. 101 / San Mateo County Smart Corridor Project
 Department of Transportation District 4 - Traffic Operations October 1, 2013 U.S. 101 / San Mateo County Smart Corridor Project www.dot.ca.gov California Department of Transportation (Caltrans) Overview
Interstate 80 Integrated Corridor Mobility Project. Ramp Metering Plan
 Interstate 80 Integrated Corridor Mobility Project Revised Final By DKS Associates 1000 Broadway, Suite 450 Oakland, CA 94607 (510) 763 2061 July 23, 2010 Client DKS Project / Proposal Number Project /
INTELLIGENT TRANSPORTATION SYSTEMS APPENDIX
 INTELLIGENT TRANSPORTATION SYSTEMS APPENDIX Southern California Association of Governments ADOPTED APRIL 2012 INTELLIGENT TRANSPORTATION SYSTEMS Introduction 1 Existing System Description 1 Existing System
Contra Costa Transportation Authority STAFF REPORT February 15, 2017 Page 2 of 3 Background MTC is expected to seek authorization from the State Legis
 Contra Costa Transportation Authority STAFF REPORT Meeting Date: February 15, 2017 Subject Summary of Issues Regional Measure 3 (RM3) Candidate Projects for Submittal to the Metropolitan Transportation
San Francisco Freeway Corridor Management Study (FCMS) Phase 1 Report
 Phase 1 Report") San Francisco Freeway Corridor Management Study (FCMS) Phase 1 Report This Report summarizes the study s purpose and institutional setting; proposes a framework of Goals and Objectives for freeway corridor
San Francisco Freeway Corridor Management Study (FCMS) Phase 1 Report This Report summarizes the study s purpose and institutional setting; proposes a framework of Goals and Objectives for freeway corridor
Goleta Ramp Metering Study
 DRAFT Technical Memorandum Goleta Ramp Metering Study Subtasks 2.1 and 2.2: Data Collection and Existing Baseline Analysis June 5, 2017 DRAFT Technical Memorandum Goleta Ramp Metering Study Subtasks 2.1
Database and Travel Demand Model
 Database and Travel Demand Model 7 The CMP legislation requires every CMA, in consultation with the regional transportation planning agency (the Metropolitan Transportation Commission (MTC) in the Bay
SMART Cor r idor s Pr ogr am. Pr oject Requir ements Dr aft Technical Memor andum # 1
 SMART Cor r idor s Pr ogr am Pr oject Requir ements Dr aft Technical Memor andum # 1 Prepared for Alameda County Congestion Management Agency Kimley-Horn and Associates, Inc. SMART Corridors Program Project
SANTA CLARA COUNTY I-280 CORRIDOR STUDY
 SANTA CLARA COUNTY I-280 CORRIDOR STUDY Appendix C Active Traffic Management Strategies SANTA CLARA VALLEY TRANSPORTATION AUTHORITY (VTA) 1-1 MEMORANDUM From: To: Kimley-Horn and Associates Shanthi Chatradhi,
I-880 Integrated Corridor Management: Building on Existing Planning Efforts
 Integrated Corridor Management (ICM) I-880 Integrated Corridor Management: Building on Existing Planning Efforts Presentation to Arterial Operations Committee July 13, 2010 1 Integrated Corridor Management
Should we Expect ITS Programs to Generate Revenue?
 Should we Expect ITS Programs to Generate Revenue? ITS California Annual Meeting Carol Kuester Director, Electronic Payments September 23, 2015 Transportation Funding Needs are Tremendous 2 Neglected Improvements
THE PROJECT. Executive Summary. City of Industry. City of Diamond Bar. 57/60 Confluence.
 THE PROJECT A freeway segment ranked 6th worst in the Nation, with levels of congestion, pollution and accidents that are simply unacceptable and which have Statewide and National implications. Executive
Chapter 10. Intelligent Transportation Systems. Ohio Kentucky Indiana Regional Council of Governments Regional Transportation Plan
 Chapter 10 Intelligent Transportation Systems Ohio Kentucky Indiana Regional Council of Governments 2030 Regional Transportation Plan Chapter 10 Intelligent Transportation Systems INTRODUCTION Intelligent
10.0 Congestion Management Process
 Livability 2040 Regional Transportation Plan 10-1 10.0 Congestion Management Process 10.1 CMP Summary The identification and evaluation of projects for the Livability 2040 Regional Transportation Plan
Active Traffic Management in Michigan. Patrick Johnson, P.E. HNTB Michigan Inc.
 Active Traffic Management in Michigan Patrick Johnson, P.E. HNTB Michigan Inc. Active Traffic Management (ATM) Active Traffic Management Strategies: Dynamic Lane Use Dynamic Shoulder Use Queue Warning
Nashville Area. Regional ITS Architecture. Regional ITS Deployment Plan. June Prepared by:
 Regional ITS Architecture Regional ITS Deployment Plan Prepared by: 069223006 Copyright 2010 by Kimley-Horn and Associates, Inc. All rights reserved. TABLE OF CONTENTS REGIONAL ITS DEPLOYMENT PLAN 1. INTRODUCTION...
I 95 EXPRESS LANES SOUTHERN TERMINUS EXTENSION TRAFFIC OPERATIONS AND SAFETY ANALYSIS REPORT
 I 95 EXPRESS LANES SOUTHERN TERMINUS EXTENSION TRAFFIC OPERATIONS AND SAFETY ANALYSIS REPORT February 2016 INTERSTATE 95 EXPRESS LANES SOUTHERN TERMINUS EXTENSION PROJECT Commonwealth of Virginia Virginia
Future Build Alternative Traffic Forecasts and Level of Service Analysis
 4.2.10 Future Build Alternative Traffic Forecasts and Level of Service Analysis For the five Build Alternatives, study intersections within one mile of potential station locations were analyzed, as it
US 75 Integrated Corridor Management
 US 75 Integrated Corridor Management Koorosh Olyai,, P.E. Assistant Vice President Dallas Area Rapid Transit ITS Texas September 5, 2008 Why ICM is needed in the US 75 Corridor DFW 5 th most congested
San Francisco Freeway Corridor Management Study (SF FCMS)
") Item 6 Enclosure B Plans and Programs Committee March 17, 2015 San Francisco Freeway Corridor Management Study (SF FCMS) Phase 1 Findings and Recommendations Agenda Item 6 SAN FRANCISCO COUNTY TRANSPORTATION
Item 6 Enclosure B Plans and Programs Committee March 17, 2015 San Francisco Freeway Corridor Management Study (SF FCMS) Phase 1 Findings and Recommendations Agenda Item 6 SAN FRANCISCO COUNTY TRANSPORTATION
Comparison of I-210 and I-710 as Potential ICM Corridors
 Comparison of I-210 and I-710 as Potential ICM Corridors Positive Aspects Traffic sensors Very good PeMS coverage of freeway mainline, HOV lanes, and ramps Many intersections within Pasadena already equipped
6.0 CONGESTION HOT SPOT PROBLEM AND IMPROVEMENT TRAVEL DEMAND MODEL ANALYSIS
 6.0 CONGESTION HOT SPOT PROBLEM AND IMPROVEMENT TRAVEL DEMAND MODEL ANALYSIS 6.1 MODEL RUN SUMMARY NOTEBOOK The Model Run Summary Notebook (under separate cover) provides documentation of the multiple
NDOT Active Traffic Management System Las Vegas, Nevada
 CONCEPT OF OPERATIONS NDOT Active Traffic Management System Las Vegas, Nevada Prepared for: Prepared by: Prepared In Accordance With: TABLE OF CONTENTS NDOT Active Traffic Management (ATM) 1 Overview...
GOOD ONYA, AUSTRALIA!
 International Experiences Driving Managed Mobility GOOD ONYA, AUSTRALIA! Darren Henderson, WSP USA M1, Melbourne, VIC MANAGED FREEWAYS The most important transportation strategy you ve probably never
Project Deliverable 4.1.3a Individual City Report - City of Claremont
 Pomona Valley ITS Project Project Deliverable 4.1.3a Individual City Report - City of Claremont Prepared by: May 1, 2002 099017000.1 Copyright 2002, Kimley-Horn and Associates, Inc TABLE OF CONTENTS INDIVIDUAL
Policy Research CENTER
 TRANSPORTATION Policy Research CENTER New Approaches to Transportation Management (Task 1) Congestion continues to be a challenge in Texas and throughout the United States, and it is increasing, leading
Route 7 Connector Ramp MODIF IE D I N T ER C H A N G E M OD IFICATIO N R E PO RT TRA N S F O R M I : I N S ID E THE BE LTWAY
 STATE PROJECT NUMBER: 0066-96A-493,P101, C501, B686; UPC: 110629 FEDERAL PROJECT NUMBER: NHPP-066-1(356) FAIRFAX COUNTY, VIRGINIA TRA N S F O R M I - 6 6 : I N S ID E THE BE LTWAY Route 7 Connector Ramp
Operations in the 21st Century DOT Meeting Customers Needs and Expectations
 Operations in the 21st Century DOT Meeting Customers Needs and Expectations 1 Purpose of this Meeting: Share Thoughts & Discuss Challenges brought about by the changing transportation environment and public
Chapter 5. Congestion Management Program. Chapter 5
 Chapter 5 Congestion Management Program Chapter 5 67 Chapter 5 Congestion Management Program Enacted in the early 1990s, California s Congestion Management Program (CMP) statutes encourage local jurisdictions
3.6 GROUND TRANSPORTATION
 3.6.1 Environmental Setting 3.6.1.1 Area of Influence The area of influence for ground transportation consists of the streets and intersections that could be affected by automobile or truck traffic to
TECHNICAL ADVISORY COMMITTEE MEETING NOTICE & AGENDA
 El Cerrito Hercules TECHNICAL ADVISORY COMMITTEE MEETING NOTICE & AGENDA Pinole DATE & TIME: Thursday, January 11, 2018 9:00 AM 11:30 AM LOCATION: WCCTAC Office 6333 Potrero Ave. at San Pablo Avenue, El
Vicinity Map. Interstate 605 (I-605) and State Route 91 (SR-91) in Los Angeles County
 and State Route 91 (SR-91) in Los Angeles County") 07 - LA - 605 - PM 2.87/PM 6.36 07 - LA - 91 - PM 14.10/PM 19.81 Vicinity Map N On Routes Interstate 605 (I-605) and State Route 91 (SR-91) in Los Angeles County I-605 between Excelsior Dr UC (PM 6.36)
07 - LA - 605 - PM 2.87/PM 6.36 07 - LA - 91 - PM 14.10/PM 19.81 Vicinity Map N On Routes Interstate 605 (I-605) and State Route 91 (SR-91) in Los Angeles County I-605 between Excelsior Dr UC (PM 6.36)
Corpus Christi Metropolitan Transportation Plan Fiscal Year Introduction:
 Introduction: Traffic congestion in the Corpus Christi Metropolitan area is not as much a function of population growth as the function of the increase in single occupant trips. Using census data, the
Appendix A: Equipment Packages for St. Louis Regional ITS Architecture
 Appendix A: Equipment Packages for St. Louis Regional ITS Architecture Appendix A: Equipment Packages for St. Louis Regional ITS Architecture... 1 1.1 ATMS01: Network Surveillance - Supporting Equipment
MEMORANDUM: INITIAL CONCEPTS SUMMARY
 MEMORANDUM: INITIAL CONCEPTS SUMMARY INTRODUCTION This memo presents a summary of initial concepts that have been identified as development of the project study has progressed, along with a recommendations
04 ALA /6.7. Vicinity Map
 04 ALA 80 6.5/6.7 04 ALA 80 6.5/6.7 Vicinity Map Note: I-80 is designated as an east-west freeway. Gilman Street is referred to as a northsouth urban arterial for the remainder of the report. 04 ALA 80
Woodburn Interchange Project Transportation Technical Report
 Final Report Woodburn Interchange Project Transportation Technical Report Prepared for Oregon Department of Transportation April 212 Prepared by DKS Associates Contents Methodologies... 4 Volume Development...
ITS NEWS. Building Southern California s Goods Movement System for the Next Century. Gateway Cities. I-710 Zero Emissions Freight Corridor
 Building Southern California s Goods Movement System for the Next Century Gateway Cities ITS NEWS Summer 2013 I-710 Zero Emissions Freight Corridor PAGE 4 FRATIS Demonstration Advances PAGE 10 ALSO IN
report final Decennial Model Update Executive Summary Contra Costa Transportation Authority Cambridge Systematics, Inc.
 final report prepared for Contra Costa Transportation Authority prepared by with Dowling Associates Caliper Corporation June 2003 Table of Contents 1.0 Introduction... ES-1 2.0 Data Development... ES-5
Chapter 3 FREEWAY CORRIDOR TRAFFIC MANAGEMENT
 Chapter 3 FREEWAY CORRIDOR TRAFFIC MANAGEMENT TABLE OF CONTENTS PAGE 3-1.00 INTRODUCTION...................................................3-3 1.01 Purpose 1.02 Chapter Organization 3-2.00 GLOSSARY.......................................................3-3
INTERCHANGE MODIFICATION REPORT
 INTERSTATE 75 AND STATE ROAD 884 (COLONIAL BOULEVARD) INTERCHANGE LEE COUNTY, FLORIDA INTERCHANGE MODIFICATION REPORT Prepared for: Florida Department of Transportation District One May 2017 Interchange
Puget Sound Regional ITS Architecture Update. Why does the region need an ITS Architecture?
 IBI GROUP 801 Second Avenue Suite 1400 Seattle WA 98104 USA tel 206 521 9091 fax 206 521 9095 ibigroup.com Memorandum To/Attention Puget Sound Regional Council Date May 26, 2015 (PSRC) From IBI Group Project
FREEWAY PERFORMANCE MEASUREMENT SYSTEM (PeMS): AN OPERATIONAL ANALYSIS TOOL
: AN OPERATIONAL ANALYSIS TOOL") FREEWAY PERFORMANCE MEASUREMENT SYSTEM (PeMS): AN OPERATIONAL ANALYSIS TOOL Tom Choe Office of Freeway Operations California Department of Transportation District 7 120 S Spring Street Los Angeles, CA
FREEWAY PERFORMANCE MEASUREMENT SYSTEM (PeMS): AN OPERATIONAL ANALYSIS TOOL Tom Choe Office of Freeway Operations California Department of Transportation District 7 120 S Spring Street Los Angeles, CA
Chapter 3 - Goals, Objectives, & Strategies
 Chapter 3 - This chapter presents goals, objectives, and strategies that have been developed as part of the Richmond Area MPO 2026 Long-Range Transportation Plan (LRTP) update. Strategies have been developed
PROPOSED AMENDMENT OF THE I 76 INTEGRATED CORRIDOR MANAGEMENT PROJECT TO THE CONNECTIONS 2040 PLAN FOR GREATER PHILADELPHIA
 PROPOSED AMENDMENT OF THE I 76 INTEGRATED CORRIDOR MANAGEMENT PROJECT TO THE CONNECTIONS 2040 PLAN FOR GREATER PHILADELPHIA Background and Project Description In July 2013, the Delaware Valley Regional
Integrated Corridor Management. Integrated Corridor Management Concept Development and Foundational Research
 Integrated Corridor Management Integrated Corridor Management Concept Development and Foundational Research Technical Memorandum Task 2.3 ICMS Concept of Operations for a Generic Corridor April 18, 2006
Executive Summary. Overview
 Executive Summary Overview The Genesee-Finger Lakes Diversion Route Initiative identifies the most suitable diversion routes for Principal Arterial roads in the nine-county Genesee-Finger Lakes Region.
Advanced Transportation Management System (ATMS)
") Advanced Transportation Management System (ATMS) Presentation to the ITS Technology Workshop for Municipalities February 15, 2017 ATMS Project Background Increasing traffic volumes Roadway network is near
Advanced Transportation Management System (ATMS) Presentation to the ITS Technology Workshop for Municipalities February 15, 2017 ATMS Project Background Increasing traffic volumes Roadway network is near
Final Congestion Management Process
 Final Congestion Management Process 2015 Prepared by Tulare County Association of Governments 210 N. Church St., Suite B Visalia, California 93291 1. Introduction: What Is Congestion? Congestion can generally
VIII. LAND USE ISSUES
 VIII. LAND USE ISSUES The & Route 57 Land Use and Circulation Study (Land Use Study, Figure 6) was completed for the Town of Clay in November 1999 (Clough, Harbour & Associates). This study investigated
Connected Corridors. I-210 Pilot Project. Advancing Traffic Control through Big Data & Connectivity. IPAM Program UCLA.
 Connected Corridors I-210 Pilot Project Advancing Traffic Control through Big Data & Connectivity IPAM Program UCLA October 7, 2015 Samson Teshome, P.E., PMP Pilot TMS Corridor Manager California DOT,
APPENDIX A: SHORT-TERM PROJECT DEPLOYMENTS
 APPENDIX A: SHORT-TERM PROJECT DEPLOYMENTS Page 1 of 15 ST-01: I-95 ITS DEPLOYMENT (DE STATE LINE TO AIRPORT) PROJECT DESCRIPTION AND SCOPE: Project will address gaps in ITS device coverage on I-95 from
CHAPTER 3 - FREEWAY CORRIDOR TRAFFIC MANAGEMENT
 CHAPTER 3 - FREEWAY CORRIDOR TRAFFIC MANAGEMENT Table of Contents 3-1.00 INTRODUCTION...3-2 3-1.01 Purpose...3-2 3-1.02 Chapter Organization...3-2 3-2.00 GLOSSARY...3-2 3-3.00 REGIONAL TRANSPORTATION MANAGEMENT
ADOT ITS URBAN FMS. Operate a system that builds and maintains credibility with the motoring public.
 ADOT ITS Introduction Widespread residential and industrial expansions have become as much a symbol of Arizona as the state s famous Saguaro cactus. People from across the country are flocking to Arizona
Proposed Comprehensive Update to the State of Rhode Island s Congestion Management Process
 Proposed Comprehensive Update to the State of Rhode Island s Statewide Planning Program January 2018 Summary Outline of of Action Steps 1. Develop Objectives for Congestion Management What is the desired
MOBILITY AND ALTERNATIVES ANALYSIS
 6 MOBILITY AND ALTERNATIVES ANALYSIS BACK OF SECTION DIVIDER 6.0 Mobility and Alternatives Analysis Travel demand analysis provides a framework for the identification of transportation facilities and services
ITS Projects. Page 1 of 5. Project Name Project Status Timeframe Project Description
 NYSDOT-X80599-NYC TIP ID: Traffic Management NYSDOT R11 Advanced Traffic and Demand Management NYSDOT - Island Expy and Brooklyn Queens Expy Travel Time Systems MTA Bridges and Tunnels - VN-03 NYCDOT-X80674-NYC
DRAFT. SR-60 7 th Avenue Intersection Control Evaluation (ICE) I-605 Corridor Improvement Project (CIP) I-605/SR-60 EA# 3101U0
 I-605 Corridor Improvement Project (CIP) I-605/SR-60 EA# 3101U0") SR-60 7 th Avenue Intersection Control Evaluation (ICE) I-605/SR-60 EA# 3101U0 October 9, 2017 Contents 1 Purpose of ICE Memo... 1 2 Background... 1 3 Existing Interchange Deficiencies... 1 4 Context Sensitive
SR-60 7 th Avenue Intersection Control Evaluation (ICE) I-605/SR-60 EA# 3101U0 October 9, 2017 Contents 1 Purpose of ICE Memo... 1 2 Background... 1 3 Existing Interchange Deficiencies... 1 4 Context Sensitive
Estimating Work Zone Performance Measures on Signalized Arterial Arterials
 Estimating Work Zone Performance Measures on Signalized Arterial Arterials Minneapolis, MN Prepared By: Alliant Engineering, Inc. 233 Park Avenue South, Suite 300 Minneapolis, MN 55415 Prepared For: Minnesota
Project Prioritization for Urban and Rural Projects TEAM CONFERENCE March 7, 2018
 Project Prioritization for Urban and Rural Projects 2018 TEAM CONFERENCE March 7, 2018 Challenge Limited funding for transportation improvements requires strategic selection of projects to ensure resource
ITS Architecture Workshop
 Austin Regional ITS Architecture and Deployment Plan Update ITS Architecture Workshop July 22, 2014 Workshop Overview Welcome and Introductions Presentation and Discussion on the Regional ITS Architecture
King County Intelligent Transportation Systems
 King County Intelligent Transportation Systems Signal Synchronization and Beyond Presentation to the Transportation Leadership Forum Department of Transportation February 24, 2005 System Control & Evaluation
PORT OF FERNANDINA TRUCK CIRCULATION STUDY
 OCTOBER 2015 PREPARED FOR: I. Introduction... 1 II. Study Area... 1 III. Field Data Collection... 3 IV. Existing Traffic... 5 V. Truck Circulation Analysis... 8 VI. Peak Hour Intersection Analysis... 10
Countywide Comprehensive Transportation Plan
 2009 Countywide Comprehensive Transportation Plan Final Environmental Impact Report SCH# 2008052073 Proposal for Adoption June 17, 2009 This page intentionally left blank. Final Environmental Impact Report
Alternatives Evaluation Report. Appendix C. Alternatives Evaluation Report
 s Evaluation Report Appendix C s Evaluation Report I-35W North Corridor Project EA Minnesota Department of Transportation Final Project s Report I-35W North Corridor Preliminary Design Project Report Version
Section 11: Transportation Strategies Toolbox
 Section 11: Transportation Strategies Toolbox A transportation strategies toolbox was developed to provide a systematic approach to identify potential strategies that address corridor transportation needs.
Intelligent Transportation Systems
 Intelligent Transportation Systems TABLE OF CONTENTS Introduction... 3 Background... 3 Existing Conditions... 4 Traffic Signals... 4 Transit... 6 Parking... 6 Staffing... 7 Best Practices... 8 Recommendations...
Active Direction to Managing Transportation ATDM: Ohio s Perspective
 Active Direction to Managing Transportation ATDM: Ohio s Perspective John Gray, Associate Vice President AECOM Brenton, Bogard, P.E. Studies Engineer Ohio Department of Transportation Ohio Transportation
Draft Regional ITS Deployment Plan
 Regional ITS Architecture and Deployment Plan -Douglas County Region Draft Regional ITS Deployment Plan Prepared by: December 19, 2007 069214001 Copyright 2007 by Kimley-Horn and Associates, Inc. All rights
Summary of Recent Integrated Corridor Management (ICM) Development Efforts in the United States
 Development Efforts in the United States") Summary of Recent Integrated Corridor Management (ICM) Development Efforts in the United States June 7, 2013 François Dion, PhD fdion@path.berkeley.edu Summary of ICM Efforts 2 Corridor Corridor Type Lead
Summary of Recent Integrated Corridor Management (ICM) Development Efforts in the United States June 7, 2013 François Dion, PhD fdion@path.berkeley.edu Summary of ICM Efforts 2 Corridor Corridor Type Lead
Los Angeles County Congestion Reduction Demonstration Project
 Los Angeles County Congestion Reduction Demonstration Project frequently asked questions update #1 /august 2008 Los Angeles County Metropolitan Transportation Authority (Metro), California Department of
Community Advisory Committee Meeting No. 2. June 22, 2006
 Community Advisory Committee Meeting No. 2 June 22, 2006 Introductions The Study Team KDOT Wichita Partners Consultants CAC members Overview Today s Agenda Opinion Survey Study Status Starting Concept
The Folded Interchange: An Unconventional Design for the Reconstruction of Cloverleaf Interchanges
 The Folded Interchange: An Unconventional Design for the Reconstruction of Cloverleaf Interchanges I. ABSTRACT Keith A. Riniker, PE, PTOE This paper presents the Folded Interchange design and compares
Concept of Operations: Mitchell Hammock Road. Adaptive Traffic Signal Control System. Prepared by: City of Oviedo. Draft 1: June 2015
 Concept of Operations: Mitchell Hammock Road Adaptive Traffic Signal Control System Red Bug Lake Road from Slavia Road to SR 426 Mitchell Hammock Road from SR 426 to Lockwood Boulevard Lockwood Boulevard
City of Dubuque: Smart Traffic Routing with Efficient & Effective Traffic System (STREETS) Final Report version 1.1
 Final Report version 1.1") City of Dubuque: Smart Traffic Routing with Efficient Final Report version 1.1 June 22, 2018 Submitted to: 17J18 0640 Prepared by Iteris, Inc. Iteris, Inc. i DOCUMENT VERSION CONTROL DOCUMENT NAME SUBMITTAL
City of Dubuque: Smart Traffic Routing with Efficient Final Report version 1.1 June 22, 2018 Submitted to: 17J18 0640 Prepared by Iteris, Inc. Iteris, Inc. i DOCUMENT VERSION CONTROL DOCUMENT NAME SUBMITTAL
Congestion Management Plan Update. Public Works and Infrastructure Committee. General Manager, Transportation Services
 PW1.4 STAFF REPORT ACTION REQUIRED Congestion Management Plan 2014-2018 Update Date: December 9, 2014 To: From: Wards: Reference Number: Public Works and Infrastructure Committee General Manager, Transportation
NAPA-SOLANO TRAVEL DEMAND MODEL PURPOSE AND USE STATEMENT
 NAPA-SOLANO TRAVEL DEMAND MODEL PURPOSE AND USE STATEMENT NAPA-SOLANO TRAVEL DEMAND MODEL PURPOSE AND USE STATEMENT 1. The Napa-Solano Travel Demand Model is a regional travel forecasting tool. 2. Because
MANAGING EXISTING SYSTEMS EFFICIENTLY
 6 USING ITS TO REDUCE CAPITAL COSTS RTC implemented an ITS project to improve traffic operations on Plumb Lane, which eliminated the need for a $5 million intersection widening. The ITS project provides
I-90 Smart Road: Operational Features. October 18th, 2017 Scott Lee, P.E., TIMS Project Manager, Parsons Amarpal Matharu, P.E.
 I-90 Smart Road: Operational Features October 18th, 2017 Scott Lee, P.E., TIMS Project Manager, Parsons Amarpal Matharu, P.E., Illinois Tollway Tollway ITS History Up To 2016 Over 1050 CCTV Cameras 45
APPENDIX B. Public Works and Development Engineering Services Division Guidelines for Traffic Impact Studies
 APPENDIX B Public Works and Development Engineering Services Division Guidelines for Traffic Impact Studies Revised December 7, 2010 via Resolution # 100991 Reformatted March 18, 2011 TABLE OF CONTENTS
Vehicle Detector Concept of Operations
 Vehicle Detector Concept of Operations Virginia Department of Transportation Northern Region Operations FINAL Prepared by: May 14, 2008 Table of Contents 1 Scope...1 1.1 Identification... 1 1.2 Role of
Market Package Descriptions
 s Market Package AD1 ITS Data Mart This market package provides a focused archive that houses data collected and owned by a single agency, district, private sector provider, research institution, or other
7.0 TRANSPORTATION MANAGEMENT
 7.0 TRANSPORTATION MANAGEMENT I. Introduction/Current State of Transportation Management in KC Region The Kansas City region has invested considerable effort and resources in the design and implementation
DDI s Can Move More Than Cars. Alex Ariniello. Presentation for the ITE Western District Annual Meeting. July, 2016 in Albuquerque, New Mexico
 DDI s Can Move More Than Cars Alex Ariniello Presentation for the ITE Western District Annual Meeting July, 2016 in Albuquerque, New Mexico In January, 2016, a Diverging Diamond Interchange (DDI) opened
Travel Time Reliability in the SLOCOG Region. October 27, 2014 San Luis Obispo Council of Governments Transportation Education Series
 Travel Time Reliability in the SLOCOG Region October 27, 2014 San Luis Obispo Council of Governments Transportation Education Series 1 Transportation Education Series - Agenda Grab Some Free Lunch!! Introductions
Summary. Preliminary Alternative Development and Screening. DEIS July 23, 2018
 What is the Carolina Crossroads Project? The South Carolina Department of Transportation (SCDOT), in cooperation with the Federal Highway Administration (FHWA), is proposing to upgrade and redesign a key
Appendix A: Project Planning and Development A-1 White Paper on Transit and the Tappan Zee Hudson River Crossing Project
 Appendix A: Project Planning and Development A-1 White Paper on Transit and the Tappan Zee Hudson River Crossing Project Purpose of White Paper White Paper on Transit and the Tappan Zee Hudson River Crossing
South Bay Corridor Study and Evaluation for Dynamic Corridor Congestion Management (DCCM) Metro Streets and Freeways Subcommittee Meeting
 Metro Streets and Freeways Subcommittee Meeting") South Bay Corridor Study and Evaluation for Dynamic Corridor Congestion Management (DCCM) Metro Streets and Freeways Subcommittee Meeting October 17, 2013 Agenda 1. DCCM Background 2. Project Overview
South Bay Corridor Study and Evaluation for Dynamic Corridor Congestion Management (DCCM) Metro Streets and Freeways Subcommittee Meeting October 17, 2013 Agenda 1. DCCM Background 2. Project Overview
I-35/80 Operations Study: Douglas Avenue to NW 86 th Street FOR
 : Douglas Avenue to NW 86 th Street FOR Iowa Department of Transportation City of Urbandale City of Grimes February 7, 2013 FINAL Prepared by: HR Green, Inc. HR Green Project Number: 40110031 TABLE OF
Truck Parking Information Management System (TPIMS) Glossary
 Glossary") Truck Parking Information Management System (TPIMS) Glossary AASHTO American Association of State Highway and Transportation Officials is the organization that provides recommendations for a variety of
Truck Parking Information Management System (TPIMS) Glossary AASHTO American Association of State Highway and Transportation Officials is the organization that provides recommendations for a variety of
NORTHWEST CORRIDOR PROJECT. NOISE TECHNICAL REPORT 2015 Addendum Phase IV
 Noise Technical Report 2015 Addendum NOISE TECHNICAL REPORT 2015 Addendum PREPARED FOR: Federal Highway Administration and Georgia Department of Transportation PREPARED BY: Parsons Brinckerhoff Project
Scope of Services Traffic Signal Retiming Contract FM NO Florida Department of Transportation District Four
 Scope of Services Traffic Signal Retiming Contract FM NO. 230017-8-32-01 Florida Department of Transportation District Four A-1 Contents 1. Background... 3 2. Summary of Services... 3 3. Consultant Requirements...
Performance Measures for Transportation Planning Part 1
 Performance Measures for Transportation Planning Part 1 Flint, MI July 12, 2011 Brian Betlyon FHWA Resource Center Overview Performance Measurement in Transportation Planning Module Outcomes Describe performance
ITEM 8 Action May 17, 2017
 ITEM 8 Action May 17, 2017 Approval of Maryland Department of Transportation (MDOT) Additional Project Submission for the Out-Of-Cycle Air Quality Conformity Analysis for the Amendment to the 2016 CLRP
Chapter 3 Transportation System Management & Operations and Travel Demand Management
 Chapter 3: Transportation System Management & Operations and Travel Demand Management As roadways in Washington County grow more congested, it becomes increasingly important to focus on costeffective strategies
FEDERAL HIGHWAY ADMINISTRATION RECORD OF DECISION FOR THE LYNNWOOD LINK EXTENSION
 FEDERAL HIGHWAY ADMINISTRATION RECORD OF DECISION FOR THE LYNNWOOD LINK EXTENSION AUGUST 2015 Table of Contents 1 Decision... 1 1.1 Project Description... 2 1.2 Basis for the FHWA Decision... 7 1.2.1
North Central Region Wausau Area ITS Benefit/Cost Analysis Final Report
 North Central Region Wausau Area ITS Benefit/Cost Analysis Final Report prepared for Wisconsin Department of Transportation prepared by SRF Consulting Group, Inc. in conjunction with Cambridge Systematics,
INTEGRATED CORRIDOR MANAGEMENT Enhancing personal mobility for all travelers
 INTEGRATED CORRIDOR MANAGEMENT Enhancing personal mobility for all travelers presented by Christopher Francis, Systems Planning Office, FDOT March 26, 2014 VA I-95 Corridor Vision VDOT Secretary/Commissioner