ADVANCED COMPUTER TECHNOLOGY Excel 2013 Unit Practice Production Test
|
|
|
- Lewis McDowell
- 6 years ago
- Views:
Transcription
1 ADVANCED COMPUTER TECHNOLOGY Excel 2013 Unit Practice Production Test You will create a spreadsheet and two charts that summarize a stock club s current stock holdings. You will also use absolute cell reference and an IF statement to calculate the membership dues for the stock club. See the key on the last page of this assignment and the formulas and column chart key in the book at the back of the room. Part 1: Creating the Spreadsheet 1. Open the Stock Start File.xlsx from the shared drive in the Practice Prod folder. Save on your H:\ drive as Lastname Firstname P# Stock Practice. Resave often. 2. Make Column A wide and best fit (Autofit) all of the other columns. You may need to best fit some of the columns again after entering formulas. If a series of ######## appear in the cells, then best fit again to adjust the column width. 3. Enter the following formulas in row 4 and then copy them down through row 12: a. Enter Formula A in cell F4: Initial Cost = Shares X Initial Price per Share b. Enter Formula B in cell H4: Current Value = Shares X Current Price per Share c. Enter Formula C in cell I4: Gain/Loss = Current Value Initial Cost d. Enter Formula D in cell J4: Percent Gain/Loss = Gain/Loss / Initial Cost 4. Compute the totals for Initial Cost, Current Value, Gain/Loss. For the Percent Gain/Loss in cell J13, copy cell J12 to J13 using the fill handle. 5. In cells D14, D15, and D16, enter Functions using the AVERAGE, MAX, and MIN. Do not include the Totals row. Copy the three functions across through the range J14:J16. Delete the invalid formula in cell J14. If an =Div/0 error message displays, ignore until all formulas have been copied. 6. Format the worksheet as follows: a. Apply the Celestial theme to the worksheet. Apply the color scheme Aspect. b. Format the worksheet title with Title cell style. Apply the Franklin Gothic Book font, 18 point font size, Black, Text 1 theme font color. Merge and center across columns A through J. c. Format the worksheet subtitle with Franklin Gothic Book font, 16 point font size, Black, Text 1 theme font color. Merge and Center across columns A through J. d. Format the worksheet title and subtitle background with Orange, Accent 1, Lighter 60% fill color and a Thick Box Border. e. Format row 3 with the Heading 3 cell style and center. Use Alt+Enter to wrap the row 3 column headings. Autofit the columns as needed. f. Format row 13 with the Total cell style. g. Format data as follows: Rows 4 through 12 center data in column B Dates in column C to the mm/dd/yy date format Range E4:I4 Accounting number format style with fixed dollar sign Range E5:I12 Comma style Range J4:J13 Percent style with two decimal places Cells F13, H13, and I13 Accounting Number format with fixed dollar sign
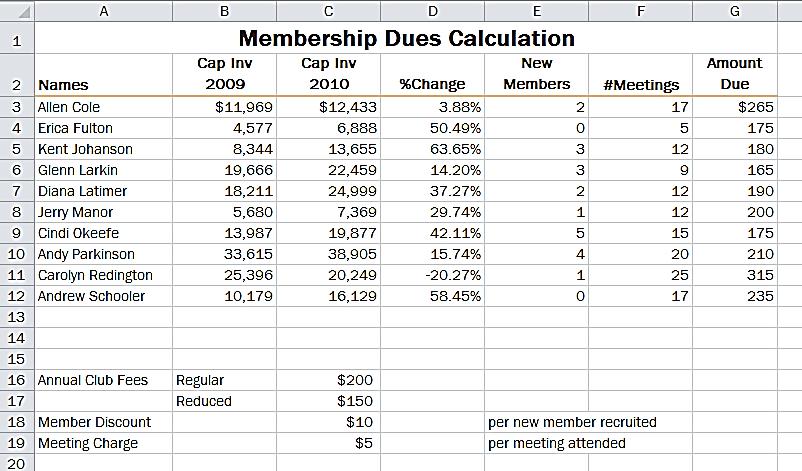
2 Format E14:I16 Currency format with floating decimal places Cells J15:J16 Percent style with two decimal places 7. Apply conditional formatting to range J4:J12 so that if a cell in the cell range is less than 0, then cell appears with an orange fill from the fill colors. Use a light orange so that the black text can be read clearly. 8. Enter a static date and time by following these steps: Merge cells I18 and J18 (use the Merge Cells option in the Merge and Center button menu). Press CTRL and ; (semicolon) which inserts the date. Then press the Spacebar. Press CTRL and SHIFT and ; (semicolon) which inserts the time. Press Enter. Right click on the date and time and select Format Cells from the popup menu. From the Format Cells dialog box choose Date from the Number tab and 3/14/01 1:30 PM from Type list. 9. Set up an IF statement in cell K4 that inserts the word Keep in the cell if the percent gain/loss is More than zero. The word Sell is to be inserted in the cell if the percent gain/loss is Less than zero. Copy the formula down to the other stocks in rows 5 to Add the following document properties: Author Your First and Last name Title Excel Practice Production Test Subject Mrs. Rosier NTM 1700 Keywords Stock Summary 11. Go to sheet named Dues and make cell D3 active. Calculate the percent change in capital investment by subtracting the 2009 capital investment from the 2010 capital investment and then dividing the difference by the 2009 capital investment amount. Copy the formula down the column for rows 4 to Make cell G3 active. You are to calculate the total amount due from each member at the end of the year using an IF statement. Set up the IF statement for the first club member in Row 3 and then copy the formula down for each of the other members. Remember to use absolute cell reference where necessary so that the formula copies correctly. The total amount due for each member includes a club fee minus a discount for recruiting new members plus a fee for each meeting attended. Information for the three parts of the IF statement follows. Logical Test: The annual club fee a member pays is either $150 or $200. If a member s capital investment increased by 5% or greater over last year, then the annual club fee is $150. Otherwise, members have to pay the full $200 club fee. Value if True: The total amount due is calculated by taking the annual club fee minus the number of new members multiplied by the new member discount rate (C18) and then adding to that result the number of meetings attended multiplied by the charge per meeting (C19). Note: Use cell addresses for the rates given in cells C18 and C19 so that if the rates change in the future the IF formula will not need to be corrected. Value if False: The calculation of the total amount due is the same as entered in the Value if True box except you start with the full $200 club fee. You can copy the Value if True statement to this box and change the starting annual fee. Copy the formula down the column for rows 4 to 12. Format Cell G3 with Currency floating $; no decimal places.
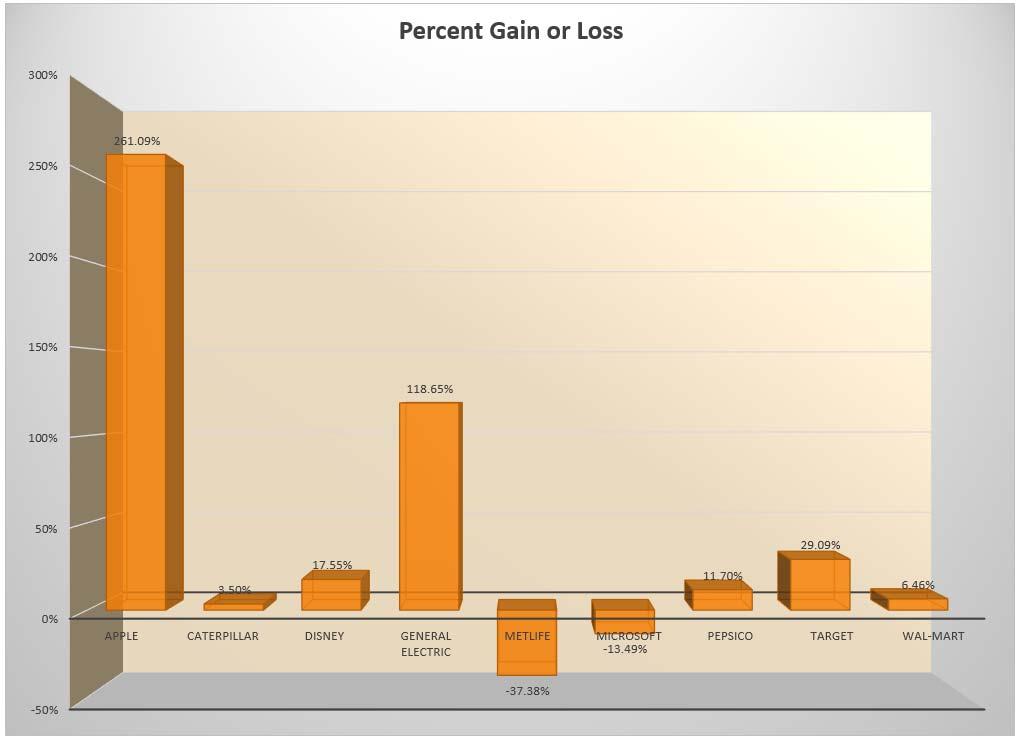
3 13. Return to the Summary of Investments worksheet. Construct a 3D pie chart that shows the company of each stock purchased and the shares purchased by the club. Take the following steps to format the pie chart: a. Move the chart to fill the range A18:G36 b. Assign Chart Style 5 to the chart. c. Type the title: Sock It Away Stock Club Shares d. Delete the legend and display data labels with the names of the stock and the percent s. Position the labels outside the chart. e. Explode the Microsoft slice 12% and change the fill color to yellow in the Standard colors. f. Increase the size of the labels to 12 pts. and change the font color to Orange, Accent 1, Darker 50%. g. Set no fill for the chart area and add a 2 ¼ pt. Tan, Accent 6, Darker 50% border. (HINT: Right click chart area, Fill, No Fill. Right click chart are, Outline, change weight and color). Change the border style to rounded corners. (HINT: Right click in chart area, Outline, Weight, More Lines, click on Rounded corners at the bottom of the pane) 14. Construct a 3D clustered column chart that shows the percent gain or loss for each stock. Take the following steps to format the column chart: a. Move the chart to a new sheet named Column Chart. The chart should fill the entire sheet. b. Assign Chart Style 3 to the chart. c. Delete the legend if necessary and display data labels with the Value of percent gain or loss. d. Format the axis numbers so they include no decimal points. (HINT: click on axis numbers, right click, Format Axis, Number, change Decimal places to 0) e. Change the color of the back wall to Tan, Accent 6, Lighter 60% and the side wall to Tan, Accent 6, Lighter 40%. f. Insert the chart title Percent Gain or Loss above the chart. Final Steps: 1. Spell check the worksheet. 2. Change the name of the sheet tab to Summary of Investments and apply the Orange, Accent 1, Darker 25% theme color to the sheet tab. 3. Compare your two spreadsheets and charts with the key. 4. Change the orientation to landscape for both worksheets. Scale to Fit the Width and Height to 1 page. 5. Create a custom header and footer for both worksheets. Header: Your First and Last Name (Left), Stock Practice (Center), Date & Time (Right Use tools) Footer: Insert File Path (Left), press enter and Insert Sheet Name (Left Use the tools), Period # (Right) Use the tools in the Page Setup dialog box for the date, time, and sheet tab name. 6. Copy both worksheets (Right click sheet tab name). Choose Move or Copy, Check the Copy box. 7. Rename the copied worksheets to be Summary Formulas and Dues Formulas. 8. Turn on the formulas CTRL+` (accent mark) for both worksheets. Resize the columns so that all the formulas are displayed. Scale to fit width and height 1 page. Show gridlines. Print preview and resave.

4 9. Arrange the sheets as follows: Summary of Investments, Summary Formulas, Dues, Dues Formulas, Column chart. 10. Close the file and copy it to the student dropbox. Turn the grading sheet into the basket.
5
BEGINNING EXCEL PRACTICE ACTIVITIES WEEK 3. Week 3 Inventory
 BEGINNING EXCEL PRACTICE ACTIVITIES WEEK 3 Week 3 Inventory Situation: Your manager at i-phone-u-phone has asked you to create an inventory report. He wants you to calculate the total value of the products
MED SUPPLY ONLINE WAREHOUSE SIX-YEAR FINANCIAL PROJECTION
 EXCEL 2010 CHAPTER 3: LAB 1 MED SUPPLY ONLINE WAREHOUSE SIX-YEAR FINANCIAL PROJECTION SKILLS Save a workbook with a new name Apply a theme to a worksheet Select all cells in a worksheet Apply bold Enter
Excel Chapter 3 What-If Analysis, Charting and Large Worksheets
 Excel Chapter 3 What-If Analysis, Charting and Large Worksheets 1. What is a fill series? 2. There are two ways to make a fill series. What are they? 3. What does the ######## error mean? 4. What does
Lab 20: Excel 3 Advanced
 Lab 20: Excel 3 Advanced () CONTENTS 1 Lab Topic... Error! Bookmark not defined. 1.1 In-Lab... 27 1.1.1 In-Lab Materials... 27 1.1.2 In-Lab Instructions... 27 1.2 Out-Lab... 33 1.2.1 Out-Lab Materials...
If you want to flag a question for later review, select the "Mark for review" button.
 Exam Number: 584002RR Lesson Name: Microsoft Excel 2016 Exam Guidelines: This exam is now available only in the online assessment system. If your study guide still contains an exam, that exam is no longer
In this assignment, students will analyze Morgantown PRT usage and reliability statistics to find patterns in usage and system failures.
 Background Information HOMEWORK INSTRUCTIONS For over thirty years, the Morgantown Personal Rapid Transit system has provided an efficient means of traveling between s three campuses. Over the course of
Spreadsheets for Accounting
 Osborne Books Tutor Zone Spreadsheets for Accounting Practice material 1 Osborne Books Limited, 2016 2 s p r e a d s h e e t s f o r a c c o u n t i n g t u t o r z o n e S P R E A D S H E E T S F O R
In this project, students will analyze Morgantown PRT usage and reliability statistics to find patterns in usage and system failures.
 Background Information For over thirty years, the Morgantown Personal Rapid Transit system has provided an efficient means of traveling between s three campuses. Over the course of a year, PRT vehicles
Overview Grading Career Project Career Research (100 points) may not whallhs gcis348
 may not whallhs gcis348") Overview Eventually, you will all enter the workforce and start a career. You may already know what you want to be or have no clue. This activity is to help you get a better understanding of what career
Overview Eventually, you will all enter the workforce and start a career. You may already know what you want to be or have no clue. This activity is to help you get a better understanding of what career
BIS202 Exercises Year 2017/2018 Semester 2 EXERCISE 1
 EXERCISE 1 TAX CALCULATION 1. PROBLEM STATEMENT A startup cosmetic enterprise TopCosmetic promotes and sells 8 types of high-quality cosmetic items which are internally referenced by 100, 101,, respectively.
IF Function Contin.. Question 1
 Lesson 07- Practical IF Function Contin.. Question 1 A. Write an AND formula to determine if A>A and AA or A
DIGITAL VERSION. Microsoft EXCEL Level 2 TRAINER APPROVED
 DIGITAL VERSION Microsoft EXCEL 2013 Level 2 TRAINER APPROVED Module 4 Displaying Data Graphically Module Objectives Creating Charts and Graphs Modifying and Formatting Charts Advanced Charting Features
1. A/an is a mathematical statement that calculates a value. 2. Create a cell reference in a formula by typing in the cell name or
 Question 1 of 20 : Select the best answer for the question. 1. A/an is a mathematical statement that calculates a value. A. argument B. function C. order of operations D. formula Question 2 of 20 : Select
GUIDED PRACTICE: SPREADSHEET FORMATTING
 Guided Practice: Spreadsheet Formatting Student Activity Student Name: Period: GUIDED PRACTICE: SPREADSHEET FORMATTING Directions: In this exercise, you will follow along with your teacher to enter and
Background Information. Instructions. Problem Statement. HOMEWORK HELP PROJECT INSTRUCTIONS Homework #3 Help Charleston Federal Grant Problem
 Background Information As one might expect, it is generally in a city s best financial interest to have more residents. A larger population generally yields a larger tax base and more income. There is
NATIONAL CERTIFICATE (VOCATIONAL) LIFE ORIENTATION (ICT COMPONENT) (Second Paper) NQF LEVEL 4 NOVEMBER 2009
 LIFE ORIENTATION (ICT COMPONENT) (Second Paper) NQF LEVEL 4 NOVEMBER 2009") (7601034) -1- NC1400(E)(O21)V NATIONAL CERTIFICATE (VOCATIONAL) LIFE ORIENTATION (ICT COMPONENT) (Second Paper) NQF LEVEL 4 NOVEMBER 2009 (7601034) 21 October (X-Paper) 09:00 12:00 This question paper
(7601034) -1- NC1400(E)(O21)V NATIONAL CERTIFICATE (VOCATIONAL) LIFE ORIENTATION (ICT COMPONENT) (Second Paper) NQF LEVEL 4 NOVEMBER 2009 (7601034) 21 October (X-Paper) 09:00 12:00 This question paper
1 BASIC CHARTING. 1.1 Introduction
 1 BASIC CHARTING 1.1 Introduction This section covers the basic principles of how to create and modify a chart in Excel. With Excel 2016, the charting process is user-friendly and offers many ways to amplify
Practice Assessment Material 1
 Practice Assessment Material 1 Spreadsheet Software Note: this practice material is intended to familiarise students with the type of task they can expect in an AAT assessment. For a complete practice
Radio buttons. Tick Boxes. Drop down list. Spreadsheets Revision Booklet. Entering Data. Each cell can contain one of the following things
 Spreadsheets Revision Booklet Entering Data Each cell can contain one of the following things Spreadsheets can be used to: Record data Sort data (in ascending A-Z, 1-10 or descending (Z-A,10-1) order Search
Creating Simple Report from Excel
 Creating Simple Report from Excel 1.1 Connect to Excel workbook 1. Select Connect Microsoft Excel. In the Open File dialog box, select the 2015 Sales.xlsx file. 2. The file will be loaded to Tableau, and
Excel 2011 Charts - Introduction Excel 2011 Series The University of Akron. Table of Contents COURSE OVERVIEW... 2
 Table of Contents COURSE OVERVIEW... 2 DISCUSSION... 2 OBJECTIVES... 2 COURSE TOPICS... 2 LESSON 1: CREATE A CHART QUICK AND EASY... 3 DISCUSSION... 3 CREATE THE CHART... 4 Task A Create the Chart... 4
Exploring Microsoft Office Excel 2007
 Exploring Microsoft Office Excel 2007 Chapter 3: Charts: Delivering a Message Robert Grauer, Keith Mulbery, Judy Scheeren Committed to Shaping the Next Generation of IT Experts. Copyright 2008 Prentice-Hall.
Excel 2016: Charts - Full Page
 Excel 2016: Charts - Full Page gcflearnfree.org/excel2016/charts/1/ Introduction It can be difficult to interpret Excel workbooks that contain a lot of data. Charts allow you to illustrate your workbook
Computer Proficiency Exam
 Computer Proficiency Exam Exam Information University of Southern Maine Office of Academic Assessment Portland Campus COMPUTER PROFICIENCY PRACTICE EXAM Page 2 of 6 REQUIREMENTS FOR THE SCHOOL OF BUSINESS
LEMONADE STAND GAME INTRO TO EXCEL
 NAME: Date: The Urban Assembly School for Global Commerce, Mrs. Familiare, Career and Technical Education LEMONADE STAND GAME INTRO TO EXCEL Learning Target: I can create an inventory and sales spreadsheet
LEARNING RESOURCE CENTRE AYRSHIRE COLLEGE MICROSOFT WORD USEFUL ESSAY FEATURES
 LEARNING RESOURCE CENTRE AYRSHIRE COLLEGE MICROSOFT WORD USEFUL ESSAY FEATURES LEARNING RESOURCE CENTRE July 2015 Table of Contents -----------------------------------------------------------------------------------------------------------------------------------
New Perspectives on Microsoft Excel Module 4: Analyzing and Charting Financial Data
 New Perspectives on Microsoft Excel 2016 Module 4: Analyzing and Charting Financial Data Objectives, Part 1 Use the PMT function to calculate a loan payment Create an embedded pie chart Apply styles to
Oracle Hyperion Planning for the Power User
 Oracle Hyperion Financial Planning for the Power User Oracle Hyperion Financial Planning for the Power User Course Description Course Name: Course Number: Duration: Oracle Hyperion Planning for the Power
Before you begin. Topic 1 Select and prepare resources 1
 Contents Before you begin vii Topic 1 Select and prepare resources 1 1A Use safe and efficient work practices 2 1B Identify and clarify spreadsheet task requirements 16 Summary 26 Learning checkpoint 1:
ADVANCED MS EXCEL COURSE
 INVENTORY MANAGEMENT East London, EC 10-14 September 2018 @ Premier Hotel Regent Course 1 Johannesburg, GP 17-21 September 2018 @ Birchwood Hotel ADVANCED MS EXCEL COURSE Course 2 COURSE APPROACH As this
MSITA: Excel Test #1
 MSITA: Excel Test #1 Part I: Identify the following as either a label (L), value (V), or formula (F) 1. Tom Smith 6. 236-87-2768 2. Add A1 and C1 7. 65 3. 704-555-5555 8. Hourly Rate times Hours Worked
Computer Proficiency Exam
 Computer Proficiency Exam Exam Information University of Southern Maine Office of Academic Assessment Portland Campus COMPUTER PROFICIENCY PRACTICE EXAM Page 2 of 7 If you are not yet a USM student, information
MSITA: Excel Test 2 Part I: Matching Part II: label (L) value (V) formula (F)
 value (V) formula (F)") MSITA: Excel Test 2 Part I: Matching a. Absolute Cell Reference h. Label b. Cell i. Order of Operations c. Fill Series j. Relative Cell Reference d. Formula k. Worksheet e. Freeze panes l. Sort f. Function
MSITA: Excel Test 2 Part I: Matching a. Absolute Cell Reference h. Label b. Cell i. Order of Operations c. Fill Series j. Relative Cell Reference d. Formula k. Worksheet e. Freeze panes l. Sort f. Function
1. After you change the format of a worksheet, if some cells display only asterisks (#####). What can you do to fix the problem?
. What can you do to fix the problem?") HEEP YUNN SCHOOL Mid-year Examination (01-013) Computer Literacy F. A, B, C, D, E December, 01 Total Marks: 30 Time allowed: 30 min Put your answers on the answer sheets provided. Section A: Multiple choice
HEEP YUNN SCHOOL Mid-year Examination (01-013) Computer Literacy F. A, B, C, D, E December, 01 Total Marks: 30 Time allowed: 30 min Put your answers on the answer sheets provided. Section A: Multiple choice
Use the interactive below to view examples of some of the types of charts that are available in Excel.
 Excel 2010 Working with Charts Introduction Page 1 A chart is a tool you can use in Excel to communicate your data graphically. Charts allow your audience to see the meaning behind the numbers, and they
Microsoft Office: Excel 2013
 Microsoft Office: Excel 2013 Intro to Charts University Information Technology Services Training, Outreach and Learning Technologies Copyright 2014 KSU Department of University Information Technology Services
% % % % ORD % % % %
 PRACTICE EXERCISES Blue Skies Airlines You are an analyst for Blue Skies Airlines, a regional airline headquartered in Kansas City. Blue Skies has up to 10 departures a day from the Kansas City Airport.
ECDL / ICDL Spreadsheets Sample Part-Tests
 The following are sample part-tests for. This sample part-test contains 16 questions giving a total of 16 marks. The actual certification test contains 32 questions giving a total of 32 marks. The candidate
Join the Allyn & Bacon First Editions Club!
 CHAPTER 5 Join the Allyn & Bacon First Editions Club! To start your membership in our First Editions Club, simply read the following chapter and complete a brief questionnaire at: www.ablongman.com/swsurvey.
This project includes information on coal mining in West Virginia from 1994 to 2014.
 Topics Create and format a column chart Create and format a pie chart Create and format a line chart Use a trendline Insert a sparkline Background Information This project includes information on coal
Computer Applications
 Unit 3 Computer Applications Spreadsheet Projects Database Projects Presentation Projects Web Projects 227 Spreadsheet Projects Project 1 Working with Budgets (240 minutes).............................
The Basics and Sorting in Excel
 The Basics and Sorting in Excel Work through this exercise to review formulas and sorting in Excel. Every journalist will deal with a budget at some point. For a budget story, typically we write about
Infor LN Financials User Guide for Financial Statements
 Infor LN Financials User Guide for Financial Statements Copyright 2018 Infor Important Notices The material contained in this publication (including any supplementary information) constitutes and contains
INFO2130 Sample Final / Credit-By-Exam Instructions. 1) External Data and Excel Basics (15 points)
 External Data and Excel Basics (15 points)") 1) External Data and Excel Basics (15 points) a) Import the data from the file Acme Car Corporation.csv into Worksheet 1 of the Excel Workbook. b) Change the name of Worksheet 1 to Acme Sales Data. c)
1) External Data and Excel Basics (15 points) a) Import the data from the file Acme Car Corporation.csv into Worksheet 1 of the Excel Workbook. b) Change the name of Worksheet 1 to Acme Sales Data. c)
Table Of Contents. - Microsoft Office - WORD 2007 BASIC...2 EXCEL 2007 BASIC...8
 Table Of Contents - - WORD 2007 BASIC...2 WORD 2007 INTERMEDIATE...4 WORD 2007 ADVANCED...6 EXCEL 2007 BASIC...8 EXCEL 2007 - INTERMEDIATE...10 EXCEL 2007 ADVANCED...12 POWER POINT 2007 BASIC...14 POWER
Task 4 A Predator Prey Model
 ELEMENTARY MATHEMATICS FOR BIOLOGISTS 2013 Task 4 A Predator Prey Model This session presents a slightly-simplified model of a predator prey system. An outline explanation of the underlying mathematics
ACCOUNTING SOFTWARE Certification Program
 FINAL CERTIFICATION AWARDED BY IMRTC - USA ACCOUNTING SOFTWARE Certification Program This training program is highly specialized with the duration of 72 Credit hours, where the program covers all the major
Physi ViewCalc. Operator Instructions
 Operator Instructions May 2009 Microsoft Excel is a registered trademark of Microsoft Corporation. Copyright Micromeritics Instrument Corporation 2009. Product Description Product Description The tool
Excel #2: No magic numbers
 Excel #2: No magic numbers This lesson comes from programmers who long ago learned that everything entered into code must be defined and documented. Placing numbers into an equation is dangerous because
Or, from the View and Manage RFx(s) page, click the Create RFx button. Create New RFx - Use this button to create an RFQ from scratch.
 page, click the Create RFx button. Create New RFx - Use this button to create an RFQ from scratch.") Request for Quote How to Create Create an RFQ To create any RFx (RFI, RFQ, RFP, Auction or Buyer Survey), from the View and Manage RFx(s) page, click on the Create RFx button. Follow the steps below to
Request for Quote How to Create Create an RFQ To create any RFx (RFI, RFQ, RFP, Auction or Buyer Survey), from the View and Manage RFx(s) page, click on the Create RFx button. Follow the steps below to
1. Manipulating Charts
 1. Manipulating Charts Charting or graphing of data makes it easier to understand a trend about presentation of data. Many of us need to create such graphs, charts or visual chars like pi-chart etc at
1. Open Excel and ensure F9 is attached - there should be a F9 pull-down menu between Window and Help in the Excel menu list like this:
 This is a short tutorial designed to familiarize you with the basic concepts of creating a financial report with F9. Every F9 financial report starts as a spreadsheet and uses the features of Microsoft
EXCEL/WORD INTEGRATED SUMMATIVE - Vacation Time
 EXCEL/WORD INTEGRATED SUMMATIVE - Vacation Time Description: This summative project enables students to use their research skills to solve a problem. It also demonstrates the use of integrated software
1. Manipulating Charts
 1. Manipulating Charts Charting or graphing of data makes it easier to understand a trend about presentation of data. Many of us need to create such graphs, charts or visual chars like pi-chart etc at
Guidelines for Collecting Data via Excel Templates
 Guidelines for Collecting Data via Excel Templates We aim to make your studies significant Table of Contents 1.0 Introduction --------------------------------------------------------------------------------------------------------------------------
Reporting and Dashboards
 Reporting and Dashboards Page i Copyrights 2002-2011 Propertyware, Inc. All rights reserved. No part of this publication may be reproduced, transmitted or stored in any archives without the expressed
Notice: Falsification of timesheets, whether submitting or approving, can be grounds for immediate termination.
 Employee Functions Time & Attendance Experience the Workforce system from the employee perspective. Learn Workforce navigation fundamentals and functions related to reporting time, activities, and absences
Chapter 8. Using Standard & Poor s Research Insight with Excel
 Chapter 8 Using Standard & Poor s Research Insight with Excel One of the most powerful features of Standard & Poor s Research Insight is its ability to communicate with other active software packages.
Advanced Excel 2013 Tips
 Advanced Excel 2013 Tips Once you complete a formula for a cell, press Enter. You can click and drag down on the lower right corner of the cell to compute the result for any remaining cells. Turn Roman
National 5 Administration and IT
 National 5 Administration and IT IT Solutions for Administrators Use spreadsheet applications or emerging equivalent technologies Spreadsheet Task Booklet Skills, knowledge and understanding from this
Customizing the Gantt chart View
 In this lab, you will learn how to: Customize a Gantt chart view. LAB # 9 Formatting and Sharing Your Plan Customizing the Gantt chart View The Gantt chart became a standard way of visualizing project
Activities supporting the assessment of this award [3]
![Activities supporting the assessment of this award [3]](/thumbs/96/128485615.jpg "Activities supporting the assessment of this award [3]") Relevant LINKS BACK TO ITQ UNITS [1] Handbook home page [2] Overview This is the ability to use a software application designed to record data in rows and columns, perform calculations with numerical data
Relevant LINKS BACK TO ITQ UNITS [1] Handbook home page [2] Overview This is the ability to use a software application designed to record data in rows and columns, perform calculations with numerical data
Welcome to the Eastwood Harris Pty Ltd PRINCE2 TM Revised 2009 and Microsoft Project 2010 training course
 Welcome to the Eastwood Harris Pty Ltd PRINCE2 TM Revised 2009 and Microsoft Project 2010 training course Administration Evacuation Timings, meals and facilities Mobile phones and emails Introductions
Microsoft Project study guide
 Microsoft Project study guide Chap 1 An estimated duration appears with a(n) after the duration. a. pound sign c. question mark b. exclamation point d. red bullet Which of the following tasks in a LAN
Unit4 PSA Suite Business Performance Edition
 for Microsoft Dynamics CRM Unit4 PSA Suite Business Performance Edition Release Notes Unit4 PSA Suite Business Performance Edition July 2017 v.31.07.2017 - MvB (C) Copyright 2017 Unit4 Table of Contents...
Golspie High School. National 5 Administration & IT. Course Guide 2016/17
 Golspie High School National 5 Administration & IT Course Guide 2016/17 Administrative Practices Administrative Practices Tasks, skills and qualities of an administrative assistant tasks, skills, qualities
DIS 300. Quantitative Analysis in Operations Management. Instructions for DIS 300-Transportation
 Instructions for -Transportation 1. Set up the column and row headings for the transportation table: Before we can use Excel Solver to find a solution to C&A s location decision problem, we need to set
QUICKBOOKS ONLINE PLUS: A COMPLETE COURSE Chapter 6 Sales and Receivables: Product and Service Items
 QUICKBOOKS ONLINE PLUS: A COMPLETE COURSE 2016 Chapter 6 Sales and Receivables: Product and Service Items Lecture Focus 2 Add Company Logo Customize Business Forms Create Locations and Classes Set up Sales
Lightning Experience Reports & Dashboards
 Lightning Experience Reports & Dashboards Visualize key business metrics in real-time using Lightning Experience. UNIT I - Getting Started with Reports and Dashboards in Lightning Experience Introduction
KASSU JOINT EXAMINATION
 1 NAME INDEX NO SCHOOL ANDIDATES SIGNATURE. DATE. 451/2 COMPUTER STUDIES PAPER 2 (PRACTICAL) JUNE 2016 TIME: 2½ HOURS KASSU JOINT EXAMINATION - 2016 COMPUTER PAPER 2 (PRACTICAL) TIME: 2½ HOURS Instructions
Housing Authority of the City of Raleigh 900 Haynes Street, Raleigh, NC GENERAL APPLICATION FOR EMPLOYMENT (Administrative) o Part-time
 o Part-time") An Equal Opportunity Employer Housing Authority of the City of Raleigh 900 Haynes Street, Raleigh, NC 27604 GENERAL APPLICATION FOR EMPLOYMENT (Administrative) To be considered for employment, applicants
An Equal Opportunity Employer Housing Authority of the City of Raleigh 900 Haynes Street, Raleigh, NC 27604 GENERAL APPLICATION FOR EMPLOYMENT (Administrative) To be considered for employment, applicants
Add a Language or a Classification to a group of people at once.
 Companion Future Releases This document contains information regarding Future Developm ent for HomeTrak Companion software. Document creation date: Nov. 30, 2011. FUTURE DEVELOPMENT Mass Update Module:
Oracle Hyperion Financial Management Administration
 Oracle Hyperion Financial Management Administration Course Description Course Name: Course Number: Duration: Oracle Hyperion Financial Management Administration 11.1.2.4.x O-HFM-A 5 Days The Administration
Oracle Hyperion Planning Administration
 Oracle Hyperion Planning Administration Course Description Course Name: Oracle Hyperion Planning Administration Course Number: O-PLN-A Duration: 5 Days Release: 11.1.2.4 The Administrator Training for
INSTRUCTIONS FOR VALIDATION OF COMMUNICATIONS WORKER CHARGES. To drill down and validate the charges, follow the simple instructions below;
 UCR COMPUTING AND COMMUNICATIONS INSTRUCTIONS FOR VALIDATION OF COMMUNICATIONS WORKER CHARGES Communication Worker charges were approved for implementation July 1, 2002, by the Executive Vice Chancellor
Sorting Concept. Sorting of data. Skill
 6. Advanced Excel Aim: In this lesson, you will learn: Organize the given data. Calculate percentage, sum, average using functions option in a spreadsheet. To represent data in multiple ways. Tejas: Our
THE SOCIETY OF BUSINESS PRACTITIONERS
 THE SOCIETY OF BUSINESS PRACTITIONERS A number of overseas Colleges have approached the Society for specialised and specific qualifications for their own country s requirements. TECHNICAL DIPLOMA IN SECRETARIAL
Oracle Planning & Budgeting Cloud Service Fundmentals
 Course Description Course Name: Course Number: Duration: Oracle Planning & Budgeting Cloud Service Fundmentals O-PBCS-FUN 5 Days The Oracle Planning and Budgeting Cloud Service (PBCS) course is designed
Invoices 3.3 User Guide
 ! Invoices 3.3 User Guide We Make Software - Ecleti.com Invoices 2007-2018 Ecleti - Roberto Panetta all rights reserved Every effort has been made to ensure that the information in this manual is accurate.
Myridas Extended Pricing Integration User Guide
 Myridas Extended Pricing Integration User Guide Version 12 for Dynamics GP 2013 Document version: 1.0 Date: 31 st March 2013 CONTENTS Contents CONTENTS... 2 EXTENDED PRICING INTEGRATION... 3 PRICING DATA
APPENDIX C: LAB SOLUTIONS
 Appendix C: Lab s APPENDIX C: LAB SOLUTIONS Lab 2.1 Handling Sales Scenario: Cronus' customer 20000 orders 1200 units of item 70003. The customer requests that the order be delivered with 300 units every
Excel Solver Tutorial: Wilmington Wood Products (Originally developed by Barry Wray)
") Gebauer/Matthews: MIS 213 Hands-on Tutorials and Cases, Spring 2015 111 Excel Solver Tutorial: Wilmington Wood Products (Originally developed by Barry Wray) Purpose: Using Excel Solver as a Decision Support
Gebauer/Matthews: MIS 213 Hands-on Tutorials and Cases, Spring 2015 111 Excel Solver Tutorial: Wilmington Wood Products (Originally developed by Barry Wray) Purpose: Using Excel Solver as a Decision Support
DCC Kronos Supervisor Handbook
 Logging in You can log into Kronos through MYDCC. Select the Working @ DCC tab and then click on the Kronos link located in the upper left hand corner of the screen. If you use the MYDCC portal, you will
This Course Covers: How to insert pictures and work with graphics
 Microsoft Working with Graphs and Organizational Charts in PowerPoint 2000 The Richard Stockton College of New Jersey This Course Covers: How to insert pictures and work with graphics The Richard Stockton
ClubSelect Accounts Receivable Special Charges Overview
 Webinar Topics Special Charges Billing... 2 Special Charges... 4 Special Credits... 8 Surcharges... 13 Calculate Automatic Billing Plans... 18 Special Charges Billing ClubSelect AR allows you to easily
CHAPTER 10: ANALYSIS AND REPORTING
 Chapter 10: Analysis and Reporting CHAPTER 10: ANALYSIS AND REPORTING Objectives The objectives are: Define Analysis and Reporting Create Analysis Reports Customize Analysis Reports Create Analysis by
Roadway ExpressWORKS to WorldShip Commodity Transfer
 Roadway ExpressWORKS to WorldShip Commodity Transfer WorldShip 2000-2014 United Parcel Service of America, Inc. UPS, the UPS brandmark and the color brown are trademarks of United Parcel Service of America,
Morningstar Direct SM Presentation Studio
 Presentation Studio is Morningstar Direct s platform for creating custom presentations. With access to Morningstar Direct s databases and flexible charting and reporting capabilities, Presentation Studio
Module #1 Engr 124 Excel, F18
 Module #1 Engr 124 Excel, F18 Name: Objective: To create and use spreadsheets in Microsoft Excel, including: basic mathematical operations (adding/subtracting/multiplying, etc.); plotting graphs (scatter
IPECC C ONSULTANTS Course Title: Primavera Enterprise 6.0. Primavera Enterprise. Project Management, Training & Contract Workforce
 Primavera Enterprise 6.0 IPECC C ONSULTANTS Project Management, Training & Contract Workforce Course Title: Primavera Enterprise 6.0 VIRTUAL WORKSHOP PRIMAVERA ENTERPRISE 6.0 IPECC Consultants has found
How to setup and import "Catalog Pricing" for garments
 Page 1 This how to guide will outline the steps to setup and import "catalog pricing" for your garments in shopvox. This is how you setup cost and price information for materials like Garments. "Catalog
ESTIMATES. Create an Estimate
 ESTIMATES Create estimates for rental equipment, or for the sale of new equipment or sale for rental equipment. Reservations or Shipments can easily be created from Estimates. Note: Estimates do not affect
What's New - Task Planning
 What's New - Task Planning by Dale Howard and Gary Chefetz With this chapter, teach yourself how to use Microsoft Project 2010 s new manual scheduling feature. This self-paced study guide includes hands-on
Sorting Concept. Sorting of data. Skill
 6. Advanced Excel Aim: In this lesson, you will learn: To Organize the given data in a spreadsheet. To Calculate percentage, sum, average using functions option in a spreadsheet. To represent data in multiple
Importing Part Information in Sage BusinessWorks 2013
 Importing Part Information in Sage BusinessWorks 2013 Sage BusinessWorks Accounting import format requirements: 1. The import file must be in a comma delimited variable (.CSV) text format. Each field can
Release Notes Assistance PSA Suite 2016 Spring Release
 Release Notes Assistance PSA Suite 2016 Spring Release (June 2016) New License Structure The Assistance PSA Suite License structure has changed In the new license model 3 licenses are available: - Essentials:
REPORTING ON HISTORICAL CHANGES IN YOUR DATA
 REPORTING ON HISTORICAL CHANGES IN YOUR DATA Summary Get deeper insight and make data-driven decisions by analyzing your organization's activity over over the last three months. Report on Historical Changes
INTERNATIONAL POINT PRODUCT ORDERING & INVENTORY NET TOOL USER MANUAL
 INTERNATIONAL POINT PRODUCT ORDERING & INVENTORY NET TOOL Release 3.4 September 13, 2004 Page 2 of 49 Table of Contents Table of Contents Objectives... 4 Overview... 5 Background... 6 CoorsNet Overview...
Level 2 ICT. Developing, Presenting and Communicating Information
 Level 2 ICT Developing, Presenting and Communicating Information Spreadsheets L2.7a, c Based on Microsoft Office 2010 At this Level 2 learners should be able to: Use appropriate software to meet the requirements
MS Project 2007 Overview Table of Contents
 Table of Contents Microsoft Project Overview... 1 Terminology... 1 Starting Microsoft Project... 2 Projects on the Web... 2 Toolbars... 2 View Bar... 2 Views... 3 Setting Up the Project... 3 Identifying