Thermodynamics of C60 Solutes in Three Non-Aqueous Solvents
|
|
|
- Jordan Shields
- 6 years ago
- Views:
Transcription
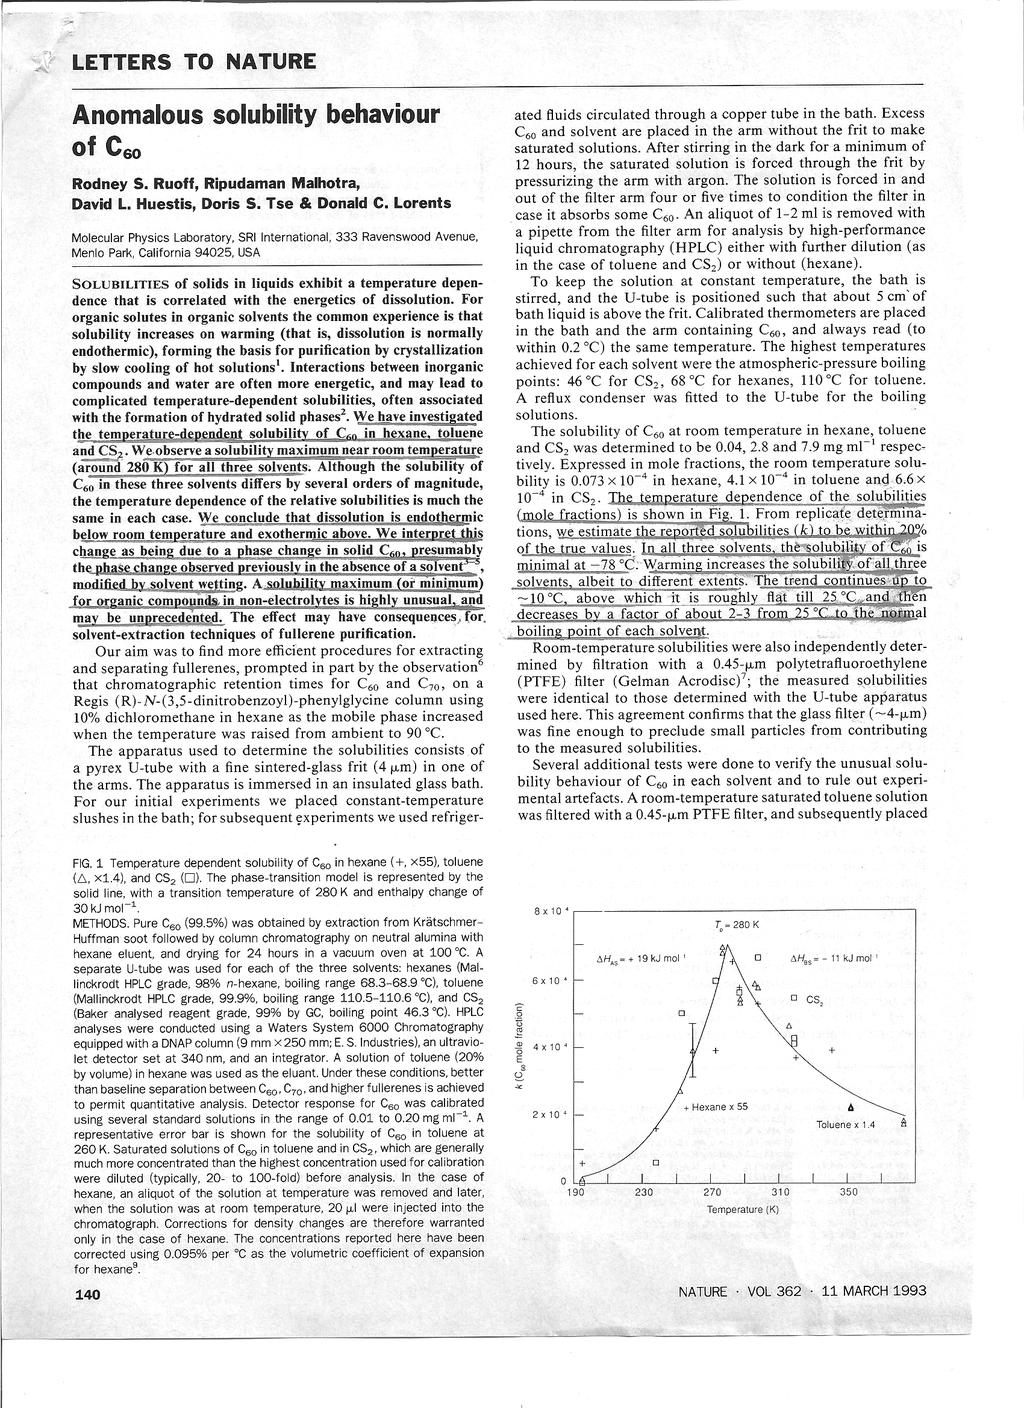
1 Thermodynamics of C60 Solutes in Three Non-Aqueous Solvents William Steinsmith, MD Buckyball molecules (C60) forming solutes in any of three organic solvents have a eutectic-cusp triple-point at atmospheric pressure and near room temperature as shown in the phase diagram (below) abstracted from a 1993 NATURE paper (attachment 1): At this singular cusp point there coexist three binary phases a bi-saturated liquid solution phase and two crystalline solid phases, say, phase A and phase B. At any point along the left-branch of the cusp, there coexist two binary phases a saturated liquid phase and crystalline phase A. At any point along the rightbranch of the cusp, there coexist two binary phases a liquid solution phase and
2 crystalline phase B. When an experimentalist adds more C60 molecules to the saturated solution existing at any point along the left or right cusp branch, all the added C60 molecules aggregate to form, respectively, crystalline phase A or B. When C60 molecules are added at the cusp-triple- point, enlargement of both crystalline phases is conjectured, with the enlarging system remaining at the triple point. The dissolution of added C60 is apparently endothermic along the left branch and exothermic along the right branch, indicating that dissolution at the triple-point is adiabatic. If an experimentalist conducts the system up the left branch from 190K by integration of dk/dt he will come to a para-triple-point at which the liquid solution becomes saturated with both phase A and phase B, but, as yet, coexists with only phase A. From this state forward, experimental attempts to move the system down the right-branch curve via integration of dk/dt will be frustrated by a eutectic halt during which crystalline phase A is transformed into crystalline phase B, while all intensity variables hold constant and the system remains at the triple point (attachment 2). Only after the system reaches another para-triplepoint, at which the bi-saturated liquid coexists with only crystalline phase B, will it become experimentally feasible to move down the right-branch curve. ws ~ We have investigated the temperature-dependent solubility of C60 in hexane, toluene and CS2. We observe a solubility maximum near room temperature (around 280 K) for all three solvents We conclude that dissolution is endothermic below room temperature and exothermic above. We interpret this change as being due to a phase change in solid C60, presumably the phase change observed previously in the absence of a solvent A solubility maximum (or minimum) for organic compounds in non-electrolytes is highly unusual, and may be unprecedented The unusual temperature dependence is likely to be caused by the changes in the solid phase. We arrived at this hypothesis as a result of recognizing the nearly identical temperature dependence of k [ the mole-
3 fractionality of dissolved C60 in a saturated solution] in three different solvents The parameters derived are sensitive to the fact that the model requires a sharp maximum in contrast to the observed broad maximum This simple model explains only the salient features and does not fit the data perfectly. To understand the temperature dependence fully, we need, for example, to characterize the solid phases A and B, and to measure the heat of solution as a function of temperature. Anomalous Solubility Behavior of C60 (attachment 1) C60 In 1985, Professor Harry Kroto (UK) whilst working on the possible structures of interstellar carbon molecules approached Professors Curl and Smallery (US) to use their laser beam equipment so do lab simulations of carbon chain formation in star systems. The experiment carried out in September 1985 not only proved that carbon stars could produce the chains but revealed an amazing, serendipitous result - the totally unexpected existence of the C60 species Buckyball is a member of a class of carbon structures called fullerenes. Fullerenes are an allotrope (solid structure) of the element carbon - the best known being diamond and graphite. Fullerenes can be hollow spheres like buckyball, ellipsoid, or tubes (buckytubes)... (below)
 C60 Buckyball is a member of a class of carbon structures called fullerenes.")
.")
4 click on the picture above to interact with the 3D model of the C60 structure (this will open a new browser window) C60 Buckyball is a member of a class of carbon structures called fullerenes. Fullerenes are an allotrope (solid structure) of the element carbon - the best known being diamond and graphite. Fullerenes can be hollow spheres like buckyball, ellipsoid, or tubes (buckytubes). Fullerenes are
5 similar in structure to graphite, which is composed of a sheet of linked hexagonal rings, but they contain pentagonal (or sometimes heptagonal) rings that prevent the sheet from being planar. The structure of C60 - buckminsterfullerene - is that of a truncated icosahedron, which resembles a round soccer ball of the type made of hexagons and pentagons, with a carbon atom at the corners of each hexagon and a bond along each edge. The molecule was named for Richard Buckminster Fuller, a noted architect who popularized the geodesic dome. In 1985, Professor Harry Kroto (UK) whilst working on the possible structures of interstellar carbon molecules approached Professors Curl and Smallery (US) to use their laser beam equipment so do lab simulations of carbon chain formation in star systems. The experiment carried out in September 1985 not only proved that carbon stars could produce the chains but revealed an amazing, serendipitous result - the totally unexpected existence of the C60 species. Kroto, Curl, and Smalley were awarded the 1996 Nobel Prize in Chemistry for their roles in the discovery of this new class of carbon compounds. Formal Chemical Name (IUPAC) References Update by Karl Harrison (Molecule of the Month for December 2005 )
6
7
8 Phase Diagrams of Two-Phase Condensed Systems 1. Theory 1.1 Phase Rule and Equilibrium The phase rule, also known as the Gibbs phase rule, relates the number of components and the number of degrees of freedom in a system at equilibrium by the formula v = k f + 2 where v equals the number of degrees of freedom or the number of independent variables, k equals the number of components in a system in equilibrium and f equals the number of phases. The digit 2 stands for temperature and pressure. The number of degrees of freedom of a system is the number of variables that may be changed independently without causing the appearance of a new phase or disappearance of an existing phase. The number of chemical constituents that must be specified in order to describe the composition of each phase present. 1.2 Cooling Curves Phase diagrams for binary systems may be constructed by measuring cooling curves for different fixed compositions. This is accomplished by heating a sample of fixed composition above its melting point and measuring the temperature as a function of time while the mixture cools. Several cooling curves are shown in Fig. 1. for the phase diagram in Fig. 2. The first cooling curve is for the composition specified by the dashed line in Fig. 2. starting at b5 (f=1 v=2). As solid A begins to freeze out of the solution at b4, the rate of cooling decreases causing the slope of the cooling curve to change (f=2 v=1). When the point b2 is reached, the temperature remains constant until the complete mixture has solidified (f=3 v=0). The duration of solidification is called the eutectic halt. After solidification has occurred, the temperature resumes its steady decrease without further interruption. The second cooling curve in Fig. 1. is for a composition halfway between that for b5 and the eutectic composition. The third cooling curve is for the eutectic composition. Notice how the duration of the eutectic halt, which is maximum for the eutectic composition, increases as the eutectic composition is approached. 1
9 Fig. 1. Cooling curves for the phase diagram in Fig 2. Fig. 2. Temperature-composition diagram for a nearly immiscible binary mixture of solids and their completely miscible liquids 2. Measurement Temperature is measured using the iron-constantan (alloy of nickel and copper) thermocouple and plotted on the computer. The second end of the thermocouple is kept in ice water in a Dewards container. The sample is covered by carbon, whish protect it against oxidation. The melting furnace is with the crucible and the thermocouple turned on (switch 1 ). When the temperature in the melting furnace reach about 450 C, take out the crucible and put the 2
10 thermocouple into the melt. The thermocouple don t may contact the wall of the crucible. The melt is getting cold. The measurement is finished after the eutectic halt. The device is calibrated using pure tin. After third calibration, at least three measurements on tin-lead are performed. 2.1 Outline of Work 1. Insert ice into a Dewards container. 2. Turn on the computer. 3. Insert the thermocouple and the crucible with tin in the melting furnace. 4. Turn on the melting furnace (switch 1 ). 5. Melt the tin. 6. Take out the crucible and put the thermocouple into the Melt. 7. Measure the cooling curve. 8. Repeat three times. 9. Compute the correction (difference between freezing point of tin (231.8 C) and measured value). 10. Measure the cooling curve of tin-lead at least three times. The melt should be good mixed. 11. Turn off all devices. 2.2 Common Sources of Errors The melt is not mixed well. The thermocouple is contacting the wall of the crucible. The metal part of the crucible is standing out from the melt. 3
PHASE EQUILIBRIUM P + F = C + 2
 PHASE EQUILIBRIUM Component: is either pure metal and/or compound of which an alloy is composed. They refer to the independent chemical species that comprise the system. Solid Solution: It consists of
Example A Graphite has the unusual property for a non-metal of being a very good conductor of electricity; diamond does not conduct electricity.
 Unit 12.4 arbon ompounds Topic 1: Properties and uses of carbon Topic 1 covers the properties and uses of carbon: State and appearance at room temperature. Allotropes of carbon structure, physical properties
Chapter 8: Molecules and Materials
 Chapter 8: Molecules and Materials Condensed Phases - Solids Bonding in Solids Metals Insulators Semiconductors Intermolecular Forces Condensed Phases - Liquids Carbon There are three forms of the element
PHASE EQUILIBRIA AND THE PHASE RULE
 PHASE EQUILIBRIA AND THE PHASE RULE Introduction The three primary phases of matter are often defined individually under different conditions. In practice we encounter states of matter in coexistence.
Materials and Minerals Science Course C: Microstructure. Eutectic Systems. A single-component melt solidifies directly to a single-component solid:
 Eutectic Systems 1.1 Eutectic Reactions A single-component melt solidifies directly to a single-component solid: Pure Liquid Pure Solid In the last practical we saw that a liquid solution solidifies into
CHEM 254 EXPERIMENT 8. Phase Diagrams, Solid - Liquid Phase Equilibrium for Two Component System and Missibility Gap
 Temperature, T Temperature, T CHEM 254 EXPERIMENT 8 Phase Diagrams, Solid - Liquid Phase Equilibrium for Two Component System and Missibility Gap Solid and liquid phases may both be present in a system
Equilibrium phase diagram of metallic alloy
 Equilibrium phase diagram of metallic alloy Motivation New structure, concentration (mixing level) (at what temperature? for how long? ) Phase Diagrams - Introduction. Many materials systems can exist
MME292 Metallic Materials Sessional
 Department of Materials and Metallurgical Engineering angladesh University of Engineering and Technology, Dhaka MME292 Metallic Materials Sessional July 2016 Term Experiment 2 Construction and Interpretation
ENGINEERING COUNCIL CERTIFICATE LEVEL ENGINEERING MATERIALS C102 TUTORIAL 3 THERMAL EQUILIBRIUM (PHASE) DIAGRAMS
 DIAGRAMS") ENGINEERING COUNCIL CERTIFICATE LEVEL ENGINEERING MATERIALS C102 TUTORIAL 3 THERMAL EQUILIBRIUM (PHASE) DIAGRAMS UNIT OUTCOMES On successful completion of the unit the candidate will be able to: 1. Recognise
ENGINEERING COUNCIL CERTIFICATE LEVEL ENGINEERING MATERIALS C102 TUTORIAL 3 THERMAL EQUILIBRIUM (PHASE) DIAGRAMS UNIT OUTCOMES On successful completion of the unit the candidate will be able to: 1. Recognise
Engineering materials
 1 Engineering materials Lecture 6 Metal and Alloys Phase Diagrams 2 Metals and alloys Some metals may have more than one crystal structure, a phenomenon known as polymorphism ( 同質異性 ), when found in elemental
[CLICK] [CLICK] [CLICK] [CLICK] [CLICK] [CLICK] [CLICK] [CLICK] [CLICK] [CLICK] [CLICK]
![[CLICK] [CLICK] [CLICK] [CLICK] [CLICK] [CLICK] [CLICK] [CLICK] [CLICK] [CLICK] [CLICK]](/thumbs/79/79522651.jpg "[CLICK] [CLICK] [CLICK] [CLICK] [CLICK] [CLICK] [CLICK] [CLICK] [CLICK] [CLICK] [CLICK]") A major principle of materials science is that PROPERTIES are related to STRUCTURE. A material s structure is only partly described by reporting the composition. You must also report the phases, composition
A major principle of materials science is that PROPERTIES are related to STRUCTURE. A material s structure is only partly described by reporting the composition. You must also report the phases, composition
Phase Diagrams of Pure Substances Predicts the stable phase as a function of P total and T. Example: water can exist in solid, liquid and vapor
 PHASE DIAGRAMS Phase a chemically and structurally homogenous region of a material. Region of uniform physical and chemical characteristics. Phase boundaries separate two distinct phases. A single phase
The Stabilities of phase
 The Stabilities of phase What is a phase? A phase is a form of matter that is uniform throughout in chemical composition and physical state Example Fig 1. White phosphorus Fig 2.Black phosphorus Fig 3.
CHEM J-2 June 2014
 CHEM1102 2014-J-2 June 2014 The diagram below shows the structure of an alloy of copper and gold with a gold atom at each of the corners and a copper atom in the centre of each of the faces. 2 What is
PROPERTIES OF PURE SUBSTANCES
 PROPERTIES OF PURE SUBSTANCES Pure Substance A pure substance is one that has a homogeneous and invariable chemical composition. It may exist in more than one phase, but the chemical composition is the
Chapter 9 Phase Diagrams. Dr. Feras Fraige
 Chapter 9 Phase Diagrams Dr. Feras Fraige Chapter Outline Definitions and basic concepts Phases and microstructure Binary isomorphous systems (complete solid solubility) Binary eutectic systems (limited
TALAT Lecture Phase Diagrams. 14 pages, 13 Figures. Basic Level
 TALAT Lecture 1203 Phase Diagrams 14 pages, 13 Figures Basic Level prepared by M H Jacobs * Interdisciplinary Research Centre in Materials The University of Birmingham, UK (Based on approach adopted by
The Science and Engineering of Materials, 4 th ed Donald R. Askeland Pradeep P. Phulé. Chapter 8 Solid Solutions and Phase Equilibrium
 The Science and Engineering of Materials, 4 th ed Donald R. Askeland Pradeep P. Phulé Chapter 8 Solid Solutions and Phase Equilibrium Objectives of Chapter 8 The goal of this chapter is to describe the
LN Introduction to Solid State Chemistry. Lecture Notes No. 10 PHASE EQUILIBRIA AND PHASE DIAGRAMS
 3.091 Introduction to Solid State Chemistry Lecture Notes No. 10 PHASE EQUILIBRIA AND PHASE DIAGRAMS * * * * * * * * * * * * * * * * * * * * * * * * * * * * * * * * * * * * * * * * * * * * * * * * * Sources
Part I : Preliminaries (Thermodynamics and Kinetics) Module 3. G versus x B curves and phase diagrams. 4.1 Motivation
 Module 3. G versus x B curves and phase diagrams. 4.1 Motivation") Part I : Preliminaries (Thermodynamics and Kinetics) Module 3. G versus x B curves and phase diagrams 4.1 Motivation It is fairly well known that higher the temperature of water, higher is the salt that
Part I : Preliminaries (Thermodynamics and Kinetics) Module 3. G versus x B curves and phase diagrams 4.1 Motivation It is fairly well known that higher the temperature of water, higher is the salt that
Introduction to the phase diagram Uses and limitations of phase diagrams Classification of phase diagrams Construction of phase diagrams
 Prof. A.K.M.B. Rashid Department of MME BUET, Dhaka Concept of alloying Classification of alloys Introduction to the phase diagram Uses and limitations of phase diagrams Classification of phase diagrams
solvent: component of a solution present in the greatest amount in alloy.
 Phase Equilibrium Diagrams:- Phase equilibrium diagram is a graphic relationship between temperature and weight ratios of elements and alloys contribute to the built of the diagram. Phase diagrams provide
G16 - THERMAL ANALYSIS
 001-1012PDG.pdf 1 1 G16 - THERMAL ANALYSIS 2 3 4 5 6 7 8 9 Thermal analysis is a group of techniques in which the variation of a physical property of a substance is measured as a function of temperature.
EXPERIMENT 1 SOLID LIQUID PHASE DIAGRAM
 EXPERIMENT 1 SOLID LIQUID PHASE DIAGRAM Important: bring a formatted 3.5 floppy diskette/usb flash drive for this laboratory you will need it to save your data files! Introduction The relation of cooling
CHAPTER 10 PHASE DIAGRAMS PROBLEM SOLUTIONS
 CHAPTER 10 PHASE DIAGRAMS PROBLEM SOLUTIONS Solubility Limit 10.1 Consider the sugar water phase diagram of Figure 10.1. (a) How much sugar will dissolve in 1000 g of water at 80 C (176 F)? (b) If the
Phase diagrams are diagrammatic representations of the phases present in a
 Chapter 4 What is a binary phase diagram? Phase diagrams are diagrammatic representations of the phases present in a system under specified equilibrium conditions, most often composition, temperature and
Copyright The McGraw-Hill Companies, Inc. Permission required for reproduction or display. Phase Diagram
 SE104 Structural Materials Phase Diagram Dr. Yu Qiao Department of Structural Engineering, UCSD Introduction Phase: A region in a material that differs in structure and function from other regions. Phase
Physical pharmacy. dr basam al zayady
 Physical pharmacy Lec 5 dr basam al zayady Liquefaction of Gases: When a gas is cooled, it loses some of its kinetic energy in the form of heat, and the velocity of the molecules decreases. If pressure
There are many types of alloying systems which they are:
 Phase Equilibrium Diagrams:- Phase equilibrium diagram is a graphic relationship between temperature and weight ratios of elements and alloys contribute to the built of the diagram. Where Phase is a uniform
Two Components System
 Two Components System Three independent variables: T, P, compositions In general, constant pressure (fixed parameter). P+F=C+1 Simple Eutectic System The binary eutectic phase diagram explains the chemical
Materials Engineering. Phase transformation Phase diagrams
 Materials Engineering Phase transformation Phase diagrams Phase Transformation Why is it important for us? o Temperature, chemical composition and pressure can change the properties of materials o Understanding
Pre-Course Reading for ESI s Solidification Course
 Pre-Course Reading for ESI s Solidification Course A. B. Phillion, J. Dantzig The primary goal of ESI s Solidification Course is to relate material properties and solidification processing conditions to
Phase change processes for material property manipulation BY PROF.A.CHANDRASHEKHAR
 Phase change processes for material property manipulation BY PROF.A.CHANDRASHEKHAR Introduction The phase of a material is defined as a chemically and structurally homogeneous state of material. Any material
12/3/ :12 PM. Chapter 9. Phase Diagrams. Dr. Mohammad Abuhaiba, PE
 Chapter 9 Phase Diagrams 1 2 Learning Objectives 1. Isomorphous and eutectic phase diagrams: a. label various phase regions b. Label liquidus, solidus, and solvus lines 2. Given a binary phase diagram
CH241 Experiment #1 (Weeks of September 11, 18, and 25, 2017)
") CH241 Experiment #1 (Weeks of September 11, 18, and 25, 2017) SEPARATION AND RECOVERY OF ORGANIC COMPOUNDS, THIN LAYER CHROMATOGRAPHY, COLUMN CHROMATOGRAPHY, CRYSTALLIZATION, AND MELTING POINTS Overview
CH241 Experiment #1 (Weeks of September 11, 18, and 25, 2017) SEPARATION AND RECOVERY OF ORGANIC COMPOUNDS, THIN LAYER CHROMATOGRAPHY, COLUMN CHROMATOGRAPHY, CRYSTALLIZATION, AND MELTING POINTS Overview
From sand to silicon wafer
 From sand to silicon wafer 25% of Earth surface is silicon Metallurgical grade silicon (MGS) Electronic grade silicon (EGS) Polycrystalline silicon (polysilicon) Single crystal Czochralski drawing Single
Introduction of Materials Materials Science SScience
 材料科學導論 Introduction of Materials Science 許正興國立聯合大學電機工程學系 1. Introduction of Materials Science and Engineering 2. Atomic Structure and Bonding 3. Crystal Structures and Crystal Geometry 4. Solidification,
Phase diagrams wt% of carbon in Fe microstructure of a lead tin alloy of eutectic composition
 Phase diagrams 0.44 wt% of carbon in Fe microstructure of a lead tin alloy of eutectic composition Primer Materials For Science Teaching Spring 2018 28.6.2018 What is a phase? A phase may be defined as
Binary Phase Diagrams - II
 Binary Phase Diagrams - II Note the alternating one phase / two phase pattern at any given temperature Binary Phase Diagrams - Cu-Al Can you spot the eutectoids? The peritectic points? How many eutectic
Phase diagram of carbon. Lecture 10. Simple eutectic systems. Greek, Eutektos easily melting Eu good, well + tekein to melt
 Phase diagram of carbon Lecture 10 Simple eutectic systems Greek, Eutektos easily melting Eu good, well + tekein to melt Motivation: A two component system is the simplest of multicomponent systems. A
Chapter 6. Multiphase Systems. Dr. M. A. A. Shoukat Choudhury Website:
 Chapter 6 Multiphase Systems Dr. M. A. A. Shoukat Choudhury Email: shoukat@buet.ac.bd Website: http://teacher.buet.ac.bd/shoukat/ Multiphase Systems Why Study? - Phase change operations such as freezing,
the Phase Diagrams Today s Topics
 MME 291: Lecture 03 Introduction to the Phase Diagrams Prof. A.K.M.B. Rashid Department of MME BUET, Dhaka Today s Topics Concept of alloying Classification of alloys Introduction to the phase diagram
Components The elements or compounds which are mixed initially. (e.g. Al & Cu)
") Why Study Phase Diagrams? The purpose of this lecture is to develop an understanding of the phase transformations which occur under conditions of slow cooling; Under such conditions equilibrium is approached,
Why Study Phase Diagrams? The purpose of this lecture is to develop an understanding of the phase transformations which occur under conditions of slow cooling; Under such conditions equilibrium is approached,
Determination of the Molar Mass of a Compound by Freezing Point Depression
 Determination of the Molar Mass of a Compound by Freezing Point Depression Objective: The objective of this experiment is to determine the molar mass of an unknown solute by measuring the freezing point
MSE 513 Homework #1 Due Jan. 21, 2013
 Reading: My class notes, pgs. 22-27. http://www1.asminternational.org/asmenterprise/apd/help/help.aspx Introduction to Phase diagrams, particularly: o Common terms o Binary diagrams o Features of phase
Metallic Materials-Phase Diagrams
 Engineering Alloys Metals and alloys have many useful engineering properties and so have wide spread application in engineering designs. Iron and its alloys (principally steel) account for about 90 percent
but T m (Sn0.62Pb0.38) = 183 C, so this is a common soldering alloy.
 = 183 C, so this is a common soldering alloy.") T m (Sn) = 232 C, T m (Pb) = 327 C but T m (Sn0.62Pb0.38) = 183 C, so this is a common soldering alloy. T m (Au) = 1064 C, T m (Si) = 2550 C but T m (Au0.97Si0.03) = 363 C, so thin layer of gold is used
T m (Sn) = 232 C, T m (Pb) = 327 C but T m (Sn0.62Pb0.38) = 183 C, so this is a common soldering alloy. T m (Au) = 1064 C, T m (Si) = 2550 C but T m (Au0.97Si0.03) = 363 C, so thin layer of gold is used
www-materials.eng.cam.ac.uk/typd
 Part IB Paper 3: MATERIALS Examples Paper 3/1: TEACH YOURSELF PHASE DIAGRAMS This examples paper forms part of an interactive online resource Teach Yourself Phase Diagrams which is available at: www-materials.eng.cam.ac.uk/typd
The internal structure of a material plays an important part on its mechanical properties.!
 Phase Diagrams The internal structure of a material plays an important part on its mechanical properties.! There is a strong correlation between micro structure and mechanical properties. Definitions Component!
6. In this temperature time graph for the heating of H 2O at a constant rate, the segment DE represents the
 1. Which of the following contains particles with the least freedom of motion? A) CO 2( ) B) HCl(aq) C) F 2(g) D) MgBr 2(s) E) C 6H 12O 6(aq) 2. During boiling, the temperature of a pure liquid substance
Metals are used by industry for either one or combination of the following properties
 Basic Metallurgy Metals are the backbone of the engineering industry being the most important Engineering Materials. In comparison to other engineering materials such as wood, ceramics, fabric and plastics,
MAE 212: Spring 2001 Lecture 14 PHASE DIAGRAMS AND EQUILIBRIUM MICROSTRUCTURES N. Zabaras
 ME 212: Spring 2001 Lecture 14 PHSE DIGRMS ND EQUILIRIUM MICROSTRUCTURES N. Zabaras For more details on the topic read Chapter 9 of the Materials Science for Engineers by J. Shackelford, pp. 304 353. lso
Lecture 7: Solid State Reactions Phase Diagrams and Mixing
 Lecture 7: Solid State Reactions Phase Diagrams and Mixing Prof Ken Durose, Univ of Liverpool Text book for this lecture: Callister Materials Science and Engineering Learning objectives 1.Solid state reactions
Chemical reactions and electrolysis
 Chemical reactions and electrolysis Higher Revision Questions Name: Class: Date: Time: 95 minutes Marks: 95 marks Comments: Page of 29 (a) Magnesium metal is shaped to make magnesium ribbon. Explain why
The Many Faces of Carbon
 The Many Faces of Carbon Symbol: C Atomic number: 6 Atomic weight: 12 CARBON -The basic component of all organic matter. -Found in abundance in the universe, in the sun, in the stars, comets and in the
Appendix 4: Melting Points
 Appendix 4: Melting Points Melting points of Pure Substances The melting point of a substance is the temperature at which the solid phase of the substance is at equilibrium with the liquid phase. Consider
ENGR 151: Materials of Engineering LECTURE #14: PHASE DIAGRAMS
 ENGR 151: Materials of Engineering LECTURE #14: PHASE DIAGRAMS ANNOUNCEMENTS Midterm #2 Monday, May 1. Review on Wednesday, April 26. Chapters 4, 6, 7, 8 TERMINOLOGY Phase: Homogeneous portion of a system
Chapter 25 Separating Mixtures
 Chapter 25 Separating Mixtures A solution is formed when a solid dissolves in a liquid The solid is referred to as the solute. The liquid is referred to as the solvent. A dilute solution is one where there
Cu-Ag phase diagram Brazil s map
 Phase Diagrams [9] Cu-Ag phase diagram Brazil s map 1> Some important definitions Component - chemically recognizable species (Fe and C in carbon steel, H2O and NaCl in salted water). A binary alloy contains
Effects in Ductile Iron
 Summary of Element Effects in Ductile Iron Rick Gundlach Element Materials Technology Wixom Insert Company Logo Here DIS Annual Meeting, June 7, 2012 Muskegon, Michigan Types of Alloying Elements Substitutional
Schematic representation of the development of microstructure. during the equilibrium solidification of a 35 wt% Ni-65 wt% Cu alloy
 Schematic representation of the development of microstructure during the equilibrium solidification of a 35 wt% Ni-65 wt% Cu alloy At 1300 ºC (point a) the alloy is in the liquid condition This continues
Lecture - 10 Free Energy of Binary Isomorphous Phase Diagrams
 Phase Diagrams in Material Science Engineering Prof. Krishanu Biswas Department of Metallurgy and Material Science Indian Institute of Technology Kanpur Lecture - 10 Free Energy of Binary Isomorphous Phase
SCIENCE STD. VII CARBON AND ITS ALLOTROPES
 SCIENCE STD. VII CARBON AND ITS ALLOTROPES OCCURENCE OF CARBON: Carbon is the fourth most abundant element in the universe. It exists in the free as well as in the combined state in nature. Carbon is found
Engineering Materials and Processes Lecture 9 Equilibrium diagrams
 Lecture 9 Equilibrium diagrams Equilibrium diagrams Reference Text Higgins RA & Bolton, 2010. Materials for Engineers and Technicians, 5th ed, Butterworth Heinemann Section Ch 9 Additional Readings Callister,
Fundamentals of freeze lining behaviour in ilmenite smelting
 Fundamentals of freeze lining behaviour in ilmenite smelting by P.C. Pistorius* Synopsis Changes in reductant and energy inputs which are required to adjust the slag composition in an ilmenite smelter
Grain Refinement for Improved Lead-Free Solder Joint Reliability
 Grain Refinement for Improved Lead-Free Solder Joint Reliability K. Sweatman 1, S. D. McDonald 2, M. Whitewick 2, T. Nishimura 1, and K. Nogita 2 1. Nihon Superior Co., Ltd, Osaka, Japan 2. University
ENGR 151: Materials of Engineering LECTURE #15: PHASE DIAGRAMS
 ENGR 151: Materials of Engineering LECTURE #15: PHASE DIAGRAMS TENSILE TESTING VIDEO https://www.youtube.com/watch?v=-qukvzo2jse PROPERTIES OF ISOMORPHOUS ALLOYS Solid solution strengthening For Ni-Cu
Thermodynamics and Phase Diagram of the Ni-Sb-Sn System
 Thermodynamics and Phase Diagram of the Ni-Sb-Sn System Ratikanta Mishra & Herbert Ipser Department of Inorganic Chemistry / Materials Chemistry, University of Vienna, Austria Traditional Solder Materials
Zn(s) Zn 2+ (aq) + 2 e - Oxidation Anode Cu 2+ (aq) + 2 e - Cu (s) Reduction Cathode
 Zn 2+ (aq) + 2 e - Oxidation Anode Cu 2+ (aq) + 2 e - Cu (s) Reduction Cathode") Zn(s) Zn 2+ (aq) + 2 e - Oxidation Anode Cu 2+ (aq) + 2 e - Cu (s) Reduction Cathode Anode: H 2 (g) 2 H + (aq) + 2 e - Cathode: ½ O 2 (g) + 2 H + (aq) + 2 e - H 2 O (l) Net: ½ O 2 (g) + H 2 (g) H 2 O (l)
Zn(s) Zn 2+ (aq) + 2 e - Oxidation Anode Cu 2+ (aq) + 2 e - Cu (s) Reduction Cathode Anode: H 2 (g) 2 H + (aq) + 2 e - Cathode: ½ O 2 (g) + 2 H + (aq) + 2 e - H 2 O (l) Net: ½ O 2 (g) + H 2 (g) H 2 O (l)
Thermal Analysis of heating and cooling curves for phase diagram determination Practical 1P6 - v
 Thermal Analysis of heating and cooling curves for phase diagram determination Practical 1P6 - v20180214 Safety Hazards High temperature molten metal Control measures Safety glasses and lab coat must be
Chapter 5. Thermal Analysis of Binary TAG Mixtures
 Chapter 5: Thermal Analysis of Binary TAG Mixtures 95 Chapter 5 Thermal Analysis of Binary TAG Mixtures 5.1 Introduction Fats, multi-component mixtures of TAGs, are main components in many food products.
Lecture 42 Phase Diagram of Ceramic
 Phase Diagrams in Material Science Engineering Prof. Krishanu Biswas Department of Materials Science and Engineering Indian Institute of Technology, Kanpur Lecture 42 Phase Diagram of Ceramic So, students
Experiment 13: Determination of Molecular Weight by Freezing Point Depression
 1 Experiment 13: Determination of Molecular Weight by Freezing Point Depression Objective: In this experiment, you will determine the molecular weight of a compound by measuring the freezing point of a
Kinetic vs. Thermodynamic Control
 Experiment: Kinetic vs. Thermodynamic Control of rganic Reactions Kinetic vs. Thermodynamic Control During your study of reactions this year you have examined many mechanisms. You have used these mechanisms
Introduction to phase diagrams
 ASM Phase Diagram Database Diagram No. 901229 Department of Physics and Astronomy Introduction to phase diagrams William Meier Physics 590B Fall 2018 Outline Part 1 Introduction and basics Part 2 Fundamental
Objective To study the time and temperature variations in the hardness of Al-4% Cu alloy on isothermal aging.
 EXPERIMENT 8 PRECIPITATION HARDENING IN 2024 ALUMINUM Objective To study the time and temperature variations in the hardness of Al-4% Cu alloy on isothermal aging. Introduction Materials can be hardened
Effect of Atmosphere in a Foundry Mould on Casting Surface Quality
 ARCHIVES of FOUNDRY ENGINEERING DOI: 10.2478/v10266-012-0003-3 Published quarterly as the organ of the Foundry Commission of the Polish Academy of Sciences ISSN (1897-3310) Volume 12 Issue 1/2012 13 18
MSE 230 Fall 2003 Exam II
 Purdue University School of Materials Engineering MSE 230 Fall 2003 Exam II November 13, 2003 Show All Work and Put Units on Answers Name: Key Recitation Day and Time: Recitation Instructor s Name: 1 2
Fundamentals of the Heat Treating of Steel
 CHAPTER 2 Fundamentals of the Heat Treating of Steel BEFORE CONSIDERATION can be given to the heat treatment of steel or other iron-base alloys, it is helpful to explain what steel is. The common dictionary
CHM-202 General Chemistry and Laboratory II Laboratory 2 Molar Mass by Freezing Point Depression
 Purpose CHM-202 General Chemistry and Laboratory II Laboratory 2 Molar Mass by Freezing Point Depression In this experiment, you will determine the molar mass of a nonelectrolytic solvent by measuring
MS524 Phase Equilibria and Phase Diagrams DMSE, KAIST December 19, Problem 1 (35 Points) Problem 2 (40 Points)
 Problem 2 (40 Points)") MS524 Phase Equilibria and Phase Diagrams DMSE, KAIST December 19, 2005 Final Exam 19:00~midnight Prof. Hyuck Mo Lee Problem 1 (35 Points) Problem 2 (40 Points) Problem 3 (25 Points) 3 Fig. 1 Fig. 2 Fig.
MS524 Phase Equilibria and Phase Diagrams DMSE, KAIST December 19, 2005 Final Exam 19:00~midnight Prof. Hyuck Mo Lee Problem 1 (35 Points) Problem 2 (40 Points) Problem 3 (25 Points) 3 Fig. 1 Fig. 2 Fig.
EFFECT OF NON-VOLATILE SOLUTE ON THE FREEZING POINT OF MALONIC ACID
 Bajopas Vol. 1 Number 1 December, 8 Bayero Journal of Pure and Applied Sciences, 1(1):53 57 Received: September, 8 Accepted: November, 8 EFFECT OF NON-VOLATILE SOLUTE ON THE FREEZING POINT OF MALONIC ACID
NABTEB Past Questions and Answers - Uploaded online QUESTION AND ANSWER
 QUESTION AND ANSWER CHEMISTRY, MAY/JUNE 2009 Section B (Essay 100 marks) Time: 1 hour 40 mins 1. Starting from bauxite, explain how to obtain pure aluminium metal i. Dissolve the impure bauxite in hot
Metallurgy - Lecture (2) Solidification
 Solidification") Metallurgy - Lecture (2) Solidification When molten metal enters a mold cavity, its heat is transferred through the mold wall. In the case of pure metals and eutectics, the solidification proceeds layer-bylayer
Metallurgy - Lecture (2) Solidification When molten metal enters a mold cavity, its heat is transferred through the mold wall. In the case of pure metals and eutectics, the solidification proceeds layer-bylayer
Phase Diagrams. Phases
 Phase Diagrams Reading: Callister Ch. 10 What is a phase? What is the equilibrium i state t when different elements are mixed? What phase diagrams tell us. How phases evolve with temperature and composition
Chapter Outline. How do atoms arrange themselves to form solids?
 Chapter Outline How do atoms arrange themselves to form solids? Fundamental concepts and language Unit cells Crystal structures! Face-centered cubic! Body-centered cubic! Hexagonal close-packed Close packed
Experimental Procedure. Lab 402
 Experimental Procedure Lab 402 Procedure Overview Cyclohexane is the solvent selected for this experiment although other solvents may be just as effective for the determination of the molar mass of a solute.
Phase Transformations
 Phase Transformations Sections 8.4-8.6, 8th Ed.; Sections 6.1-6.3, 7th Ed. Temperature-Composition Diagrams Distillation of Mixtures Azeotropes Immiscible Liquids Liquid-Liquid Phase Diagrams Phase Separations
SOLUTIONS ENGINEERING 45. UNIVERSITY OF CALIFORNIA College of Engineering Department of Materials Science and Engineering
 UNIVERSITY OF AIFORNIA ollege of Engineering Department of Materials Science and Engineering Professor R. Gronsky Fall Semester 20 ENGINEERING 45 Question 1 The silver-mercury system forms the basis of
PHASE SEPARATION BY INTERNAL OXIDATION AND REDUCTION IN A Cu-5at%Ni-ALLOY
 Pergamon PII S1359-6462(98)00128-6 Scripta Materialia, Vol. 39, No. 1, pp. 73 77, 1998 Elsevier Science Ltd Copyright 1998 Acta Metallurgica Inc. Printed in the USA. All rights reserved. 1359-6462/98 $19.00.00
5 a l l o y i n g b e h av i o r
 has dissolved in A to form a substitutional solid solution (igure 5.1b). It can be said also that this is a single-phase alloy. The word phase simply implies that the crystal structure and the alloy composition
Phase diagrams. R.D.Makwana,IT,NU. R.D.Makwana,IT,NU
 Phase diagrams Phase?? Phase is region throughout which all properties of material are essentially uniform Uniform region of a system which has uniform physical and chemical characteristics Phase diagram?
PHASE DIAGRAMS UNDERSTANDING BASICS THE. Edited. F.C. Campbell. Materials Park, Ohio The Materials Information Society.
 PHASE DIAGRAMS UNDERSTANDING THE BASICS Edited by F.C. Campbell The Materials Information Society ASM International Materials Park, Ohio 44073-0002 www.asm i nternational.org Phase Diagrams Understanding
EXPERIMENT 3 THE SYNTHESIS OF COPPER SULFIDE
 EXPERIMENT 3 THE SYNTHESIS OF COPPER SULFIDE When heated together, copper and sulfur combine to form a sulfide of copper. In this assignment, you will heat a known mass of copper with excess sulfur in
Chapter Outline How do atoms arrange themselves to form solids?
 Chapter Outline How do atoms arrange themselves to form solids? Fundamental concepts and language Unit cells Crystal structures Face-centered cubic Body-centered cubic Hexagonal close-packed Close packed
The hand soldering process can therefore be defined by the following steps ;
 Hand Soldering with Lead Free Alloys Introduction As companies start to implement lead free soldering processes, hand soldering and associated techniques have been identified as key functions in the manufacturing
FUNDAMENTALS OF METAL ALLOYS, EQUILIBRIUM DIAGRAMS
 FUNDAMENTALS OF METAL ALLOYS, EQUILIBRIUM DIAGRAMS Chapter 5 5.2 What is a Phase? Phase is a form of material having characteristic structure and properties. More precisely: form of material with identifiable
Suggest one reason why spoons are electroplated. ... Why is hydrogen produced at the negative electrode and not sodium?
 Q1.This question is about electrolysis. (a) Metal spoons can be coated with silver. This is called electroplating. Suggest one reason why spoons are electroplated. (b) When sodium chloride solution is
Atmosphere Effect on Soldering of Flip Chip Assemblies. C. C. Dong Air Products and Chemicals, Inc. U.S.A.
 Atmosphere Effect on Soldering of Flip Chip Assemblies C. C. Dong Air Products and Chemicals, Inc. U.S.A. Atmosphere Effect on Soldering of Flip Chip Assemblies Abstract An experimental study was conducted
Draw a ring around the correct word in the box to complete the sentence.
 Q. Iron is the main structural metal used in the world. (a) The diagram represents the particles in iron, Fe. Draw a ring around the correct word in the box to complete the sentence. Iron is described