Status, Issues and Perspectives of the Global Shrimp Farming Industry:
|
|
|
- Lawrence Neal
- 6 years ago
- Views:
Transcription


1 Status, Issues and Perspectives of the Global Shrimp Farming Industry: Opportunities for U.S. Shrimp Producers Darryl Jory Indiana Indoor Shrimp Production Brainstorming Session Indiana Soybean Alliance, Indianapolis, IN April 23, 2014 COMMERCIAL AQUACULTURE
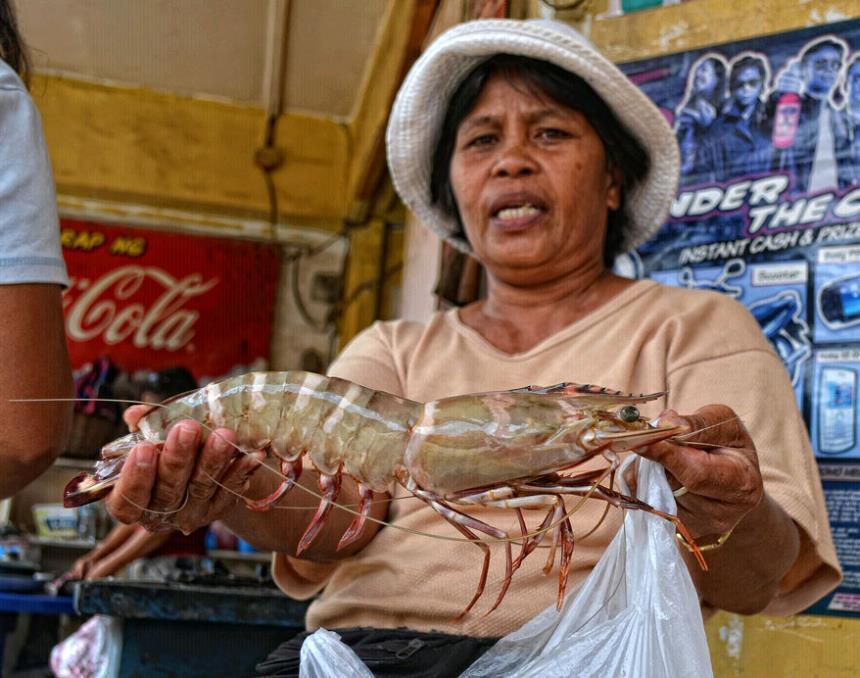
2 SHRIMP FARMING Research started in Japan in 1930 s. Modern shrimp farming started in the early 1970s. Became significant in early 1990s. Cultured in over 60 countries today. > 50% of global shrimp supplies from aquaculture. Employment for millions of people. Development of poor areas. Generates US$ billion in global commerce. Low-fat; high-protein; highly unsaturated fatty acids can help in formation of high-density lipids, or good cholesterol. We import most of what we consume!
3 Topics: Production Technology Global Production & Trends Products & Markets Issues Perspectives Opportunity for U.S. Producers
4 Shrimp Farming: Production Technology

5

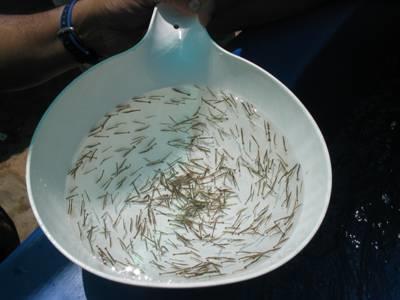

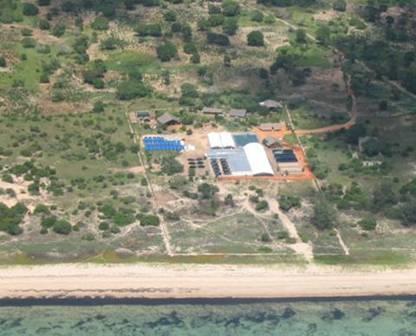
6 Hatchery Indian Ocean
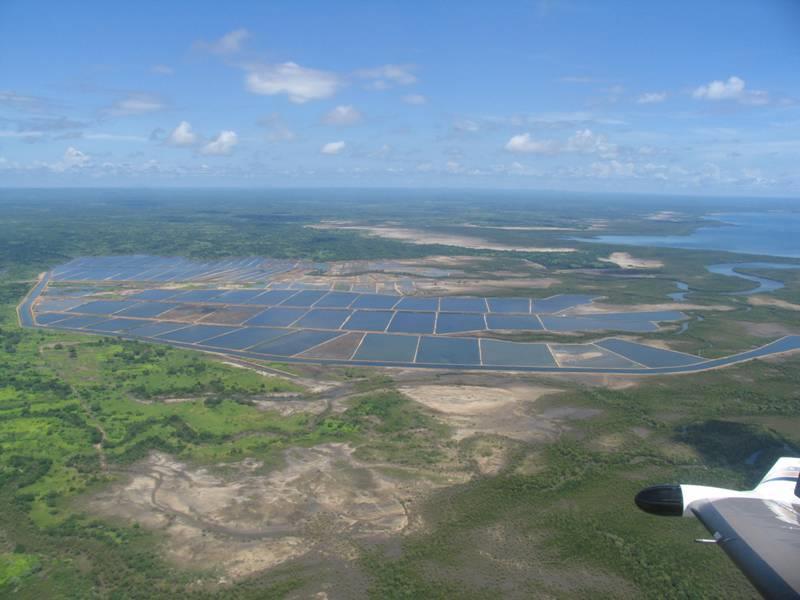
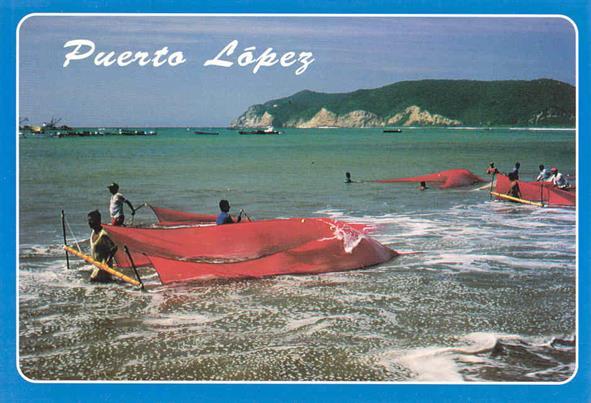
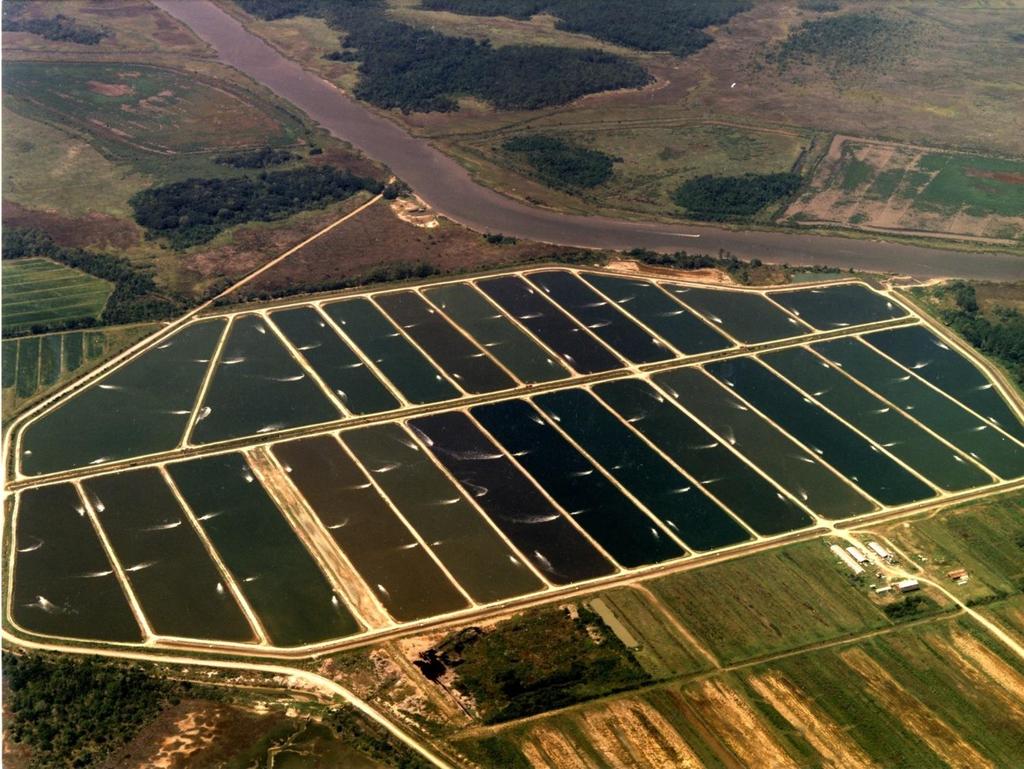
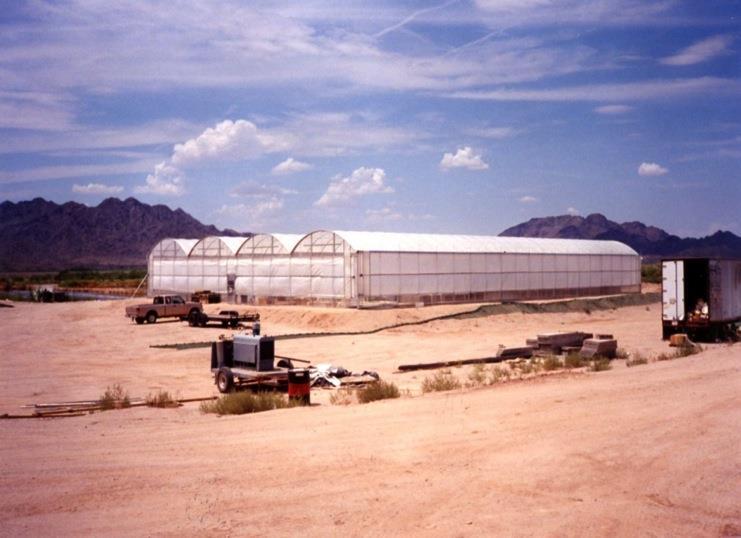
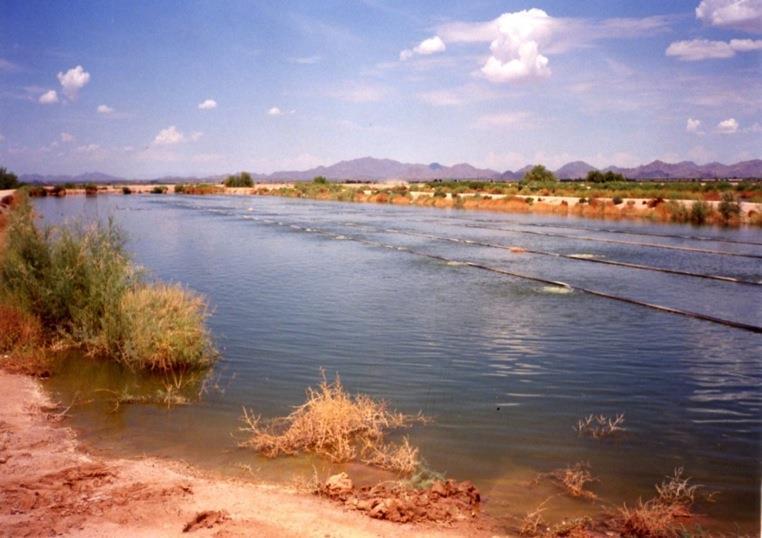
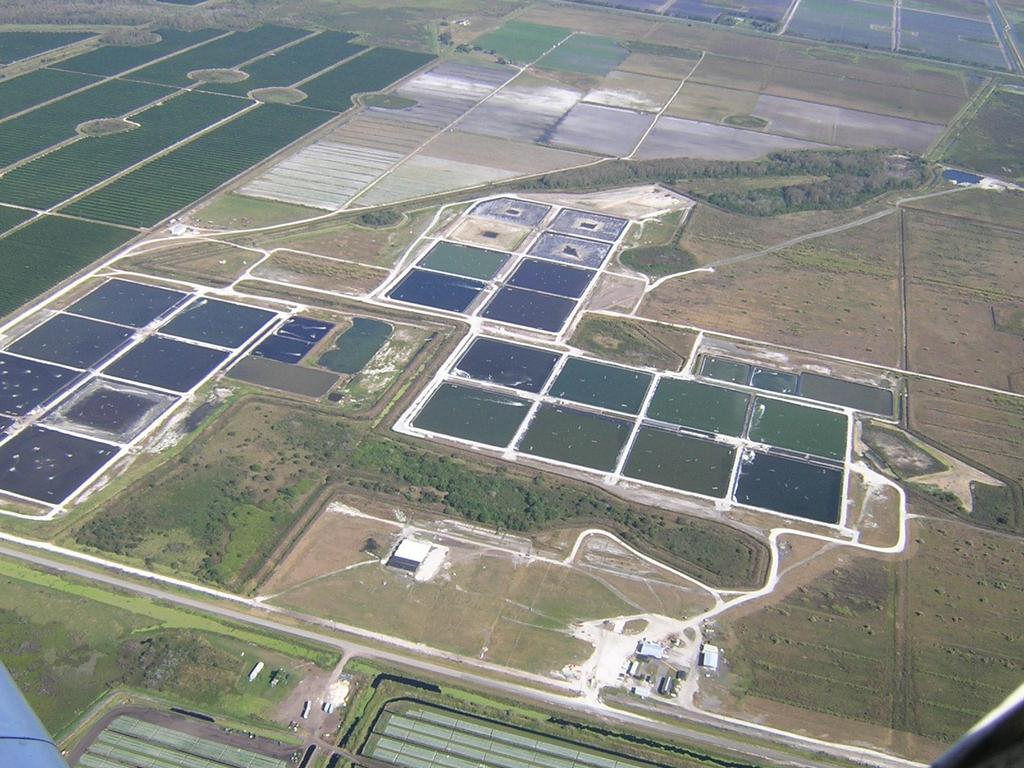
7 Farm

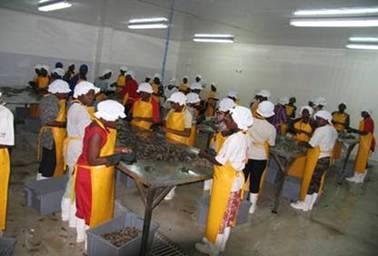


8 Processing and Value-Adding Plant
9 FARMED SHRIMP BUSINESS MODEL Broodstock Integrated Production Chain Larviculture Manufactured aquafeeds Technology Management Cost Risk Yields Economic return Nursery? Growout Processing
10 SEEDSTOCK PRODUCTION Broodstock Management Larviculture
11


12 Seedstock P. monodon PL 18 INVE
13

14
15

16
17


18 Larval Feeds
19 FARMED SHRIMP BUSINESS MODEL Broodstock Integrated Production Chain Larviculture Manufactured aquafeeds Technology Management Cost Risk Yields Economic return Nursery? Growout Processing
20 Nursery Systems

21 PreCría Intensiva


22

23 Precria Brasil
 Precria")
24 Shrimp PL growing in concrete nursery tanks before transfer to earthen, growout ponds (NE Brazil) Precria Brasil

25 STOCK LARGEST ANIMALS POSSIBLE!
26 FARMED SHRIMP BUSINESS MODEL Broodstock Integrated Production Chain Larviculture Manufactured aquafeeds Technology Management Cost Risk Yields Economic return Nursery? Growout Processing
27 Growout Production Technology
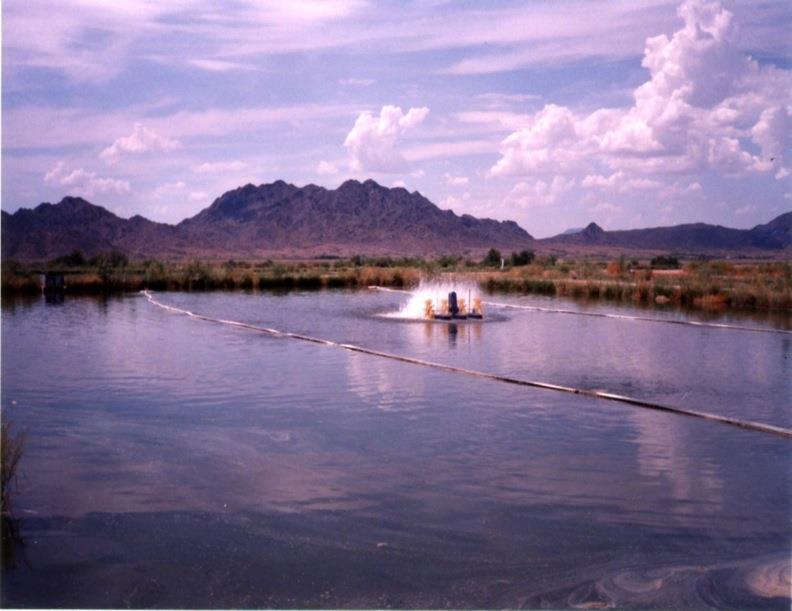
28 Shrimp Growout Technology Extensive Semi-Intensive Intensive Super-Intensive Seedstock source Stocking density Water exchange Water fertilization Supplemental feeding Aeration Pond liners Probiotics Technology Management

29 Shrimp Culture Systems: Extensive

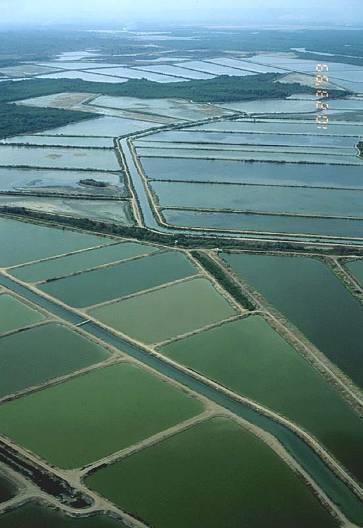
30 Shrimp Culture Systems: Semi-Intensive


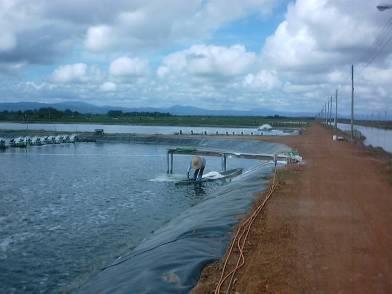

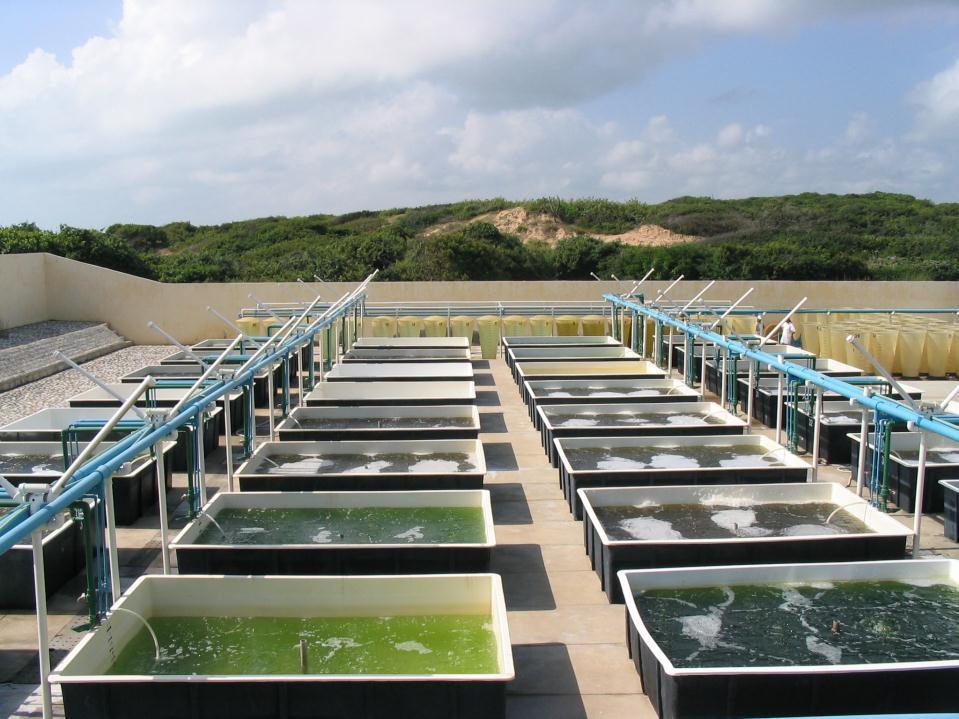
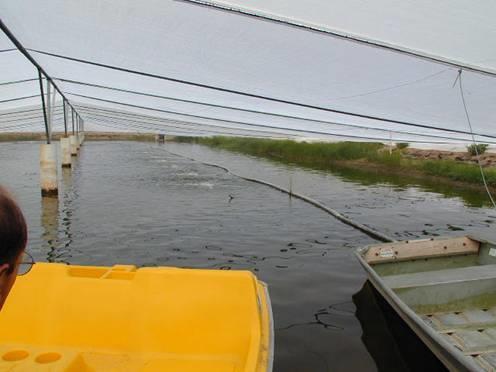
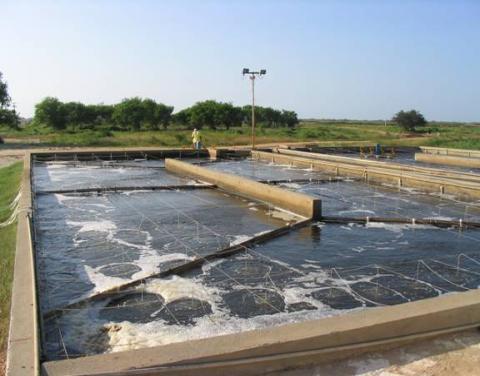
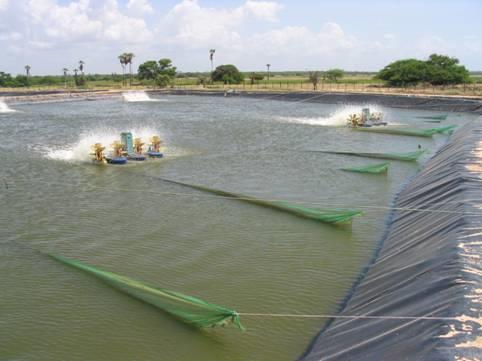
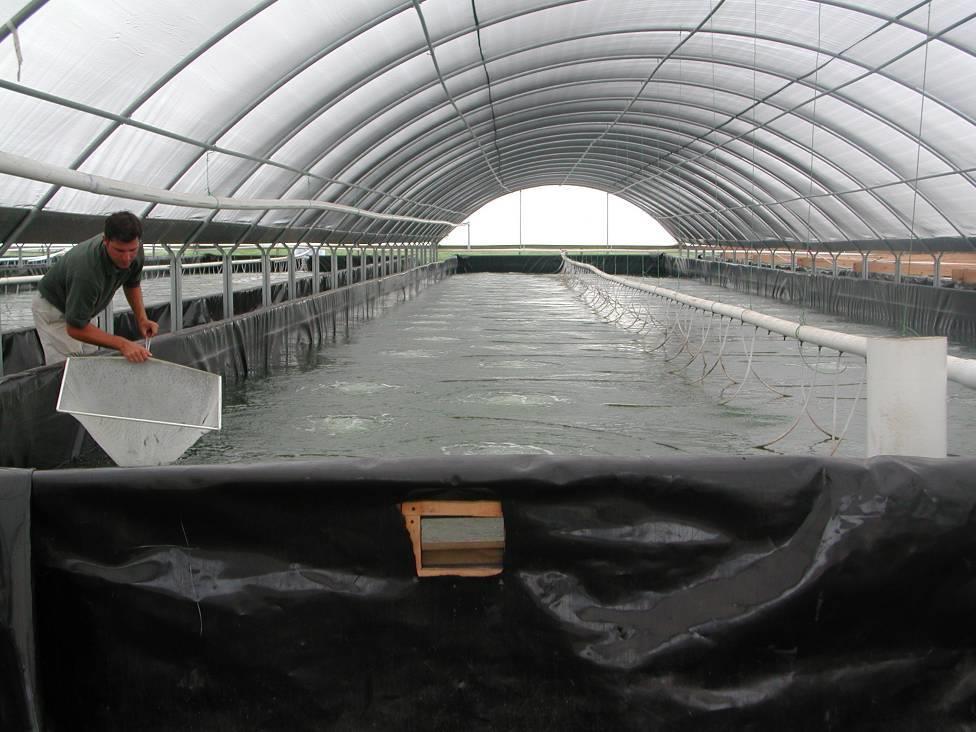
31 Shrimp Culture Systems: Intensive and Super Intensive
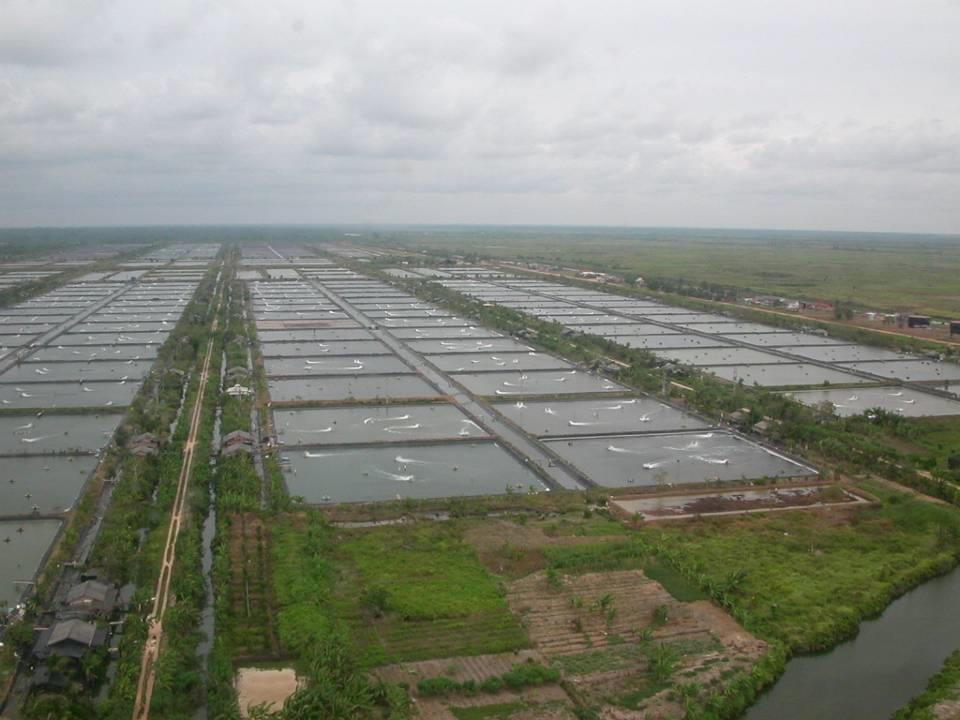
32 CP farm

33 PRODUCTION INTENSITY vs. MANAGEMENT NEEDS
34 Shrimp Farming: Global Production & Trends
35 Million MT World Production of Shrimp Capture Fisheries & Aquaculture Aquaculture accounted for 54% of world shrimp supplies in % % 28% Capture Fisheries Source: FAO (2013). Notes: M. rosenbergii is not included. China includes freshwater production of P. vannamei. Aquaculture
36 Million MT GOAL 2013 Survey Shrimp Aquaculture Production by World Region: Other Middle East / Northern Africa Americas India China Southeast Asia Annual growth rate: 4.8% -5.7%: %: Projected annual growth rate: 6.9% EMS/AHPNS initially surfaced in China in 2009 and then spread to Vietnam and Thailand. Global production is expected to be about 15% below the 2011 levels Sources: FAO (2013) for ; GOAL (2013) for Southeast Asia includes Thailand, Vietnam, Indonesia, Bangladesh, Malaysia, Philippines, Myanmar and Taiwan. M. rosenbergii is not included.


37 Asia Production ~2.8 mmt 82% of total China Thailand Vietnam Indonesia Malaysia India Bangladesh > 85% P. vannamei BRIGGS

38 Latin America Ecuador Mexico Honduras Nicaragua Guatemala Brazil Venezuela Production: 534,000 MT 16% of total 100% P. vannamei BRIGGS

39 Rest of World Saudi Arabia Madagascar Australia Iran Production: ~50,000 MT 1% of total 15% P. vannamei BRIGGS
40 Shrimp Aquaculture by Major Producing Regions: Million MT Impact of AHPNS: China, Thailand and Mexico report the largest declines in production in Southeast Asia China India Americas Middle East / North Africa Sources: FAO (2013) for ; GOAL (2013) for Southeast Asia includes Thailand, Vietnam, Indonesia, Bangladesh, Malaysia, Philippines, Myanmar and Taiwan. M. rosenbergii is not included.
41 Shrimp Aquaculture by Major Producing Regions: vs Average Annual Growth Rate 36% 30% 24% 18% % 12% 6% 0% -6% -12% 3.2% -0.4% 7.0% -6.3% 6.6% 4.3% 1.4% 10.0% Southeast Asia China India Americas Middle East / North Africa 5.0% Sources: FAO (2013) for ; GOAL (2013) for Southeast Asia includes Thailand, Vietnam, Indonesia, Bangladesh, Malaysia, Philippines, Myanmar and Taiwan. M. rosenbergii is not included.
42 Million MT Shrimp Aquaculture in Asia: Major Producers EMS related declines are expected for China (-26%), Thailand (-47%) and Vietnam (-43%). India and Indonesia expect substantial increases in production : +42 and +136%, respectively), assuming no major impact from EMS/AHPNS China Thailand Vietnam Indonesia India Sources: FAO (2013) for ; GOAL (2013) for M. rosenbergii is not included.
43 Shrimp Aquaculture in Asia: vs Average Annual Growth Rate 35% 30% 25% 20% % 15% 10% 5% 0% -5% -10% -15% 10.7% 9.2% 7.0% 6.6% 8.1% 2.9% 0.5% -0.7% -6.3% -5.8% -11.7% China Thailand Vietnam Indonesia India Bangladesh Sources: FAO (2013) for ; GOAL (2013) for M. rosenbergii is not included.
44 Shrimp Aquaculture in Latin America: Major Producers Thousand MT Mexico heavily impacted by AHPNS in 2013: production down by 60%, with partial recovery afterwards. Brazil expects to reach 100,000 tons by Ecuador Mexico Brazil Sources: FAO (2013) for ; GOAL (2013) for M. rosenbergii is not included.
45 Shrimp Aquaculture in Latin America: Thousand MT Most countries in Latin America expect to increase production by 2015 with the exception of Colombia, where the industry is expected to contract Honduras Peru Guatemala Nicaragua Venezuela Colombia Belize Sources: FAO (2013) for ; GOAL (2013) for M. rosenbergii is not included.
46 Shrimp Aquaculture in Other Reporting Countries: Thousand MT Fenneropenaeus indicus; P. japonicus; P. semisulcatus. P. monodon P. monodon and merguiensis P. stylirostris 0 Egypt Madagascar Australia New Caledonia Sources: FAO (2013) for ; GOAL (2013) for M. rosenbergii is not included.
47 World Production of Shrimp by Species Capture Fisheries & Aquaculture Combined Million MT P. vannamei is the most important species in the world, with virtually all production coming from aquaculture. Percentages indicate the share of P. vannamei. 4 % 28 % 40 % Others/NS P. merguiensis P. chinensis Trachypenaeus curvirostris Pandalus borealis 3.0 Acetes japonicus 2.0 P. monodon 1.0 P. vannamei Source: FAO (2013). Notes: M. rosenbergii is not included. Freshwater production of P. vannamei in China is included.
")
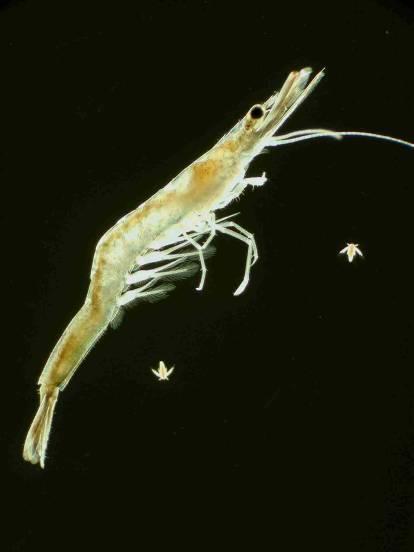
48 Penaeus (Litopenaeus) vannamei
49 Shrimp Farming: Products & Markets
 Shell on (SO or \"green")
 Peeled and")
.")
,")
50 Main product presentations are: Head on shell on (HOSO) Shell on (SO or "green headless shrimp") Peeled tail on (PTO) Peeled undeveined (PUD) Peeled and deveined (P&D) Butterfly tail on (BTTY-TO). European and Asian markets prefer the HOSO presentation (a whole shrimp), while the American shrimp market prefers the others.
51 Composition of Shrimp Aquaculture Production by Product Form Comparison of Survey Data for Asia 100% 80% 60% 40% 20% 0% 15% 6% 8% 3% 11% 12% 8% 12% 13% 9% 25% 22% 20% 19% 18% 15% 23% 28% 18% 28% 35% 30% 10% 18% 22% 19% 22% 19% 33% 24% 17% 11% 6% 9% GOAL 2007 GOAL 2008 GOAL 2009 GOAL 2010 GOAL 2011 GOAL 2012 Other Forms Breaded Cooked Peeled Green / Head-off Green / Head-on


52 Composition of Shrimp Aquaculture Production by Product Form Comparison of Survey Data for the Americas 100% 80% 60% 6% 7% 7% 8% 41% 53% 46% 45% 4% 12% 31% 3% 6% 34% Other Forms Breaded Cooked Peeled 40% 20% 45% 40% 44% 46% 50% 57% Green / Head-off Green / Head-on 0% GOAL 2007 GOAL 2008 GOAL 2009 GOAL 2010 GOAL 2011 GOAL 2012
53 Trends in Trade: US, EU (France, Spain) 53


54 U.S. Shrimp Imports Down over 15% since 2011 After peaking in 2010 at 203,000 tons, imports from Thailand declined in 2011 and 2012 and are expected to fall even further in 2013 to around 90,000 tons. Ecuador, Indonesia, and India are picking up some of the slack. Imports from Mexico have also fallen. Source: USDC/NMFS (2013) * Estimate
55 Thousand MT Spanish Shrimp Imports Down 22% since * Others India Honduras Morocco Senegal Thailand Nicaragua China Ecuador Argentina Reflecting the difficult economic conditions in the country, the Spanish market contracted substantially in 2012 and is expected to contract even further in 2013 (-20% relative to 2011). Argentina and Ecuador currently supply around 50% of the market. Source: Eurostat (2013) * Estimate
56 Thousand MT French Shrimp Imports Down 3% since Others Vietnam Thailand Venezuela Madagascar Spain Netherlands Belgium India Ecuador * Ecuador s exports to France have increased dramatically since 2001, currently accounting for approximately 30% of the import market. Ecuador is also increasing shipments to Asian markets (China, Vietnam). Source: Eurostat (2013) * Estimate
57 Million MT Shrimp Aquaculture Production & Shrimp Exports from China Shrimp Production (Freshwater) Shrimp Production (Marine) Shrimp Exports (Product Weight) Sources: FAO (2011); GOAL (2001). Export figures for 2009 and 2010 are estimates.
58 Production Conclusion 2013 production is 15% less than % less than the expected for trajectory for 2013 based on the past decade Disease Biggest Risk, undermines market development, Under-investment in disease management 58
59 Shrimp Farming: Issues
60 Industry Faces Many Issues Costs (fuels, ingredients - FM/FO - biofuels) Competition Protectionism & Antidumping Seafood safety Traceability Sustainability Environmental issues Biosecurity Inland expansion Diseases Species introductions Resource limitations (water, land, labor, etc.) Domestication Price volatility / uncertainty Ingredients (GMO, others) Social aspects Commerce regulations (bioterrorism, COOL) Animal welfare Production inefficiencies New technologies Technology packages Novel financing / professional investors Official support Integration, diversification and consolidation of industry
61 Major Challenges to Aquaculture Growth 1. Disease & health management 2. Feed ingredient availability 3. Environmental limits 4. Investment capital 5. Market support
62 Challenge 1: Disease & Health Management 62
63 Shrimp Farming History Characterized by Diseases Year Countries Disease Impact 1982 Ecuador BP Mortality in hatchery 1988 Taiwan YHV 80,000 to 25,000 mt 1992 China WSSV 220,000 to 50,000 mt 1994 Ecuador, Mexico 2002 Thailand, Indonesia Brazil, Indonesia TSV MSGV IMNV TSV resistant stylirostris sent to Brunei (2000) Reduced profitability Reduced profitability 2006 Belize, Mexico, PvNv Reduced profitability LIGHTNER

64 The Wall Street Journal Reports on EMS/APHNS - July 11, 2013
65 ESTIMATED ECONOMIC LOSSES DUE TO VIRAL DISEASES VIRUS SINCE PRODUCTION LOSSES USD MILLION IHHNV- Americas (1) 1981 $ 500-1,000 YHV Asia (1) 1991 $ 500 TSV-Americas (1) 1991/92 $ 1,500 TSV-Asia (1) 1999 $ 1,000 WSSV Asia (1) 1992/93 $ > 6,000 WSSV Americas (1) 1999 $ > 2,000 IMNV Brasil e Indonesia (1) 2002 $ 1,200 EMS Asia (2) 2009 $3,500!!! Sources: (1) Dr. Donald Lightner (2) Dr. Matt Briggs (3) Others CHING

66 The average U.S. consumer ate 14.4 pounds of seafood in 2012, the last year for which figures are available, down from 15 pounds in 2011 and a record high 16.6 pounds consumed in That's far less than the average 82 pounds of chicken, 57 pounds of beef and 46 pounds of pork. Americans consume in a year.

67 Challenge 2: Availability of Feed Ingredients 67


68 FEED SUPPLY - Global compound aquafeed production has been growing at an average compound rate of over 10.7% per year since 1995, - Production increased from 7.61 million tons in 1995 to over 35 million tons in 2010, - Is expected to grow to 50 million tons by 2015, and over 70 million tons by Tacon
69 Direction of global production of major nutrient sources NUTRIENT SOURCES FROM FISHING ACTIVITIES OILSEED MEALS, PULSES & OILS AQUATIC ANIMAL PROTEIN MEALS & LIPIDS 40 essential nutrients LAND ANIMAL PROTEIN MEALS & FATS CEREALS INCLUDING BY-PRODUCT MEALS & OILS MICROBIAL FEED INGREDIENTS NUTRIENT SOURCES FROM AGRICULTURAL FARMING ACTIVITIES Tacon
70 Shrimp Farming: Perspectives
71 MORE EFFICIENT PRODUCTION
72 Many New Technologies Developed To Improve Production Efficiency & Sustainability Health Management: Improved detection of viruses Biosecurity Development of SPF Lines Immunostimulants and Probiotics Selective Breeding: Domestication Specific Pathogen Resistance Breeding for performance Use of genetic markers
73 Many Technologies Developed To Improve Production Efficiency & Sustainability Growout Technology: Reduced water exchange Bacterial floc Nurseries Inland culture Polyculture Nutrition: Improved feed manufacturing Nutritional requirements & new ingredients
74 NEWER TECHNOLOGIES
75
76 Selective Breeding & Genetic Improvement

77 BIOFLOC SYSTEMS
")
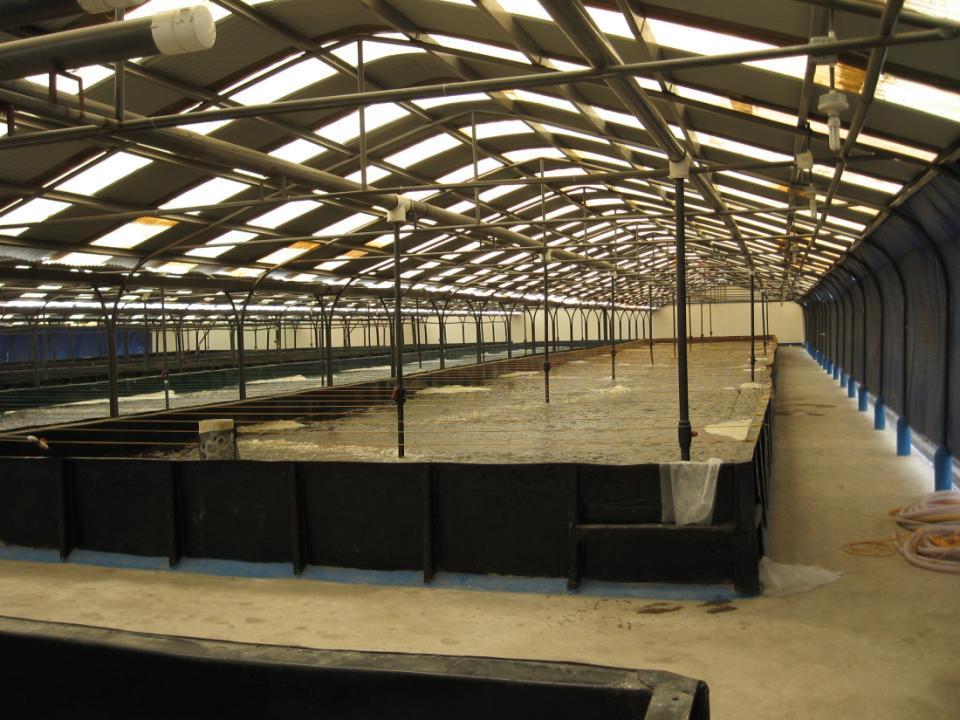
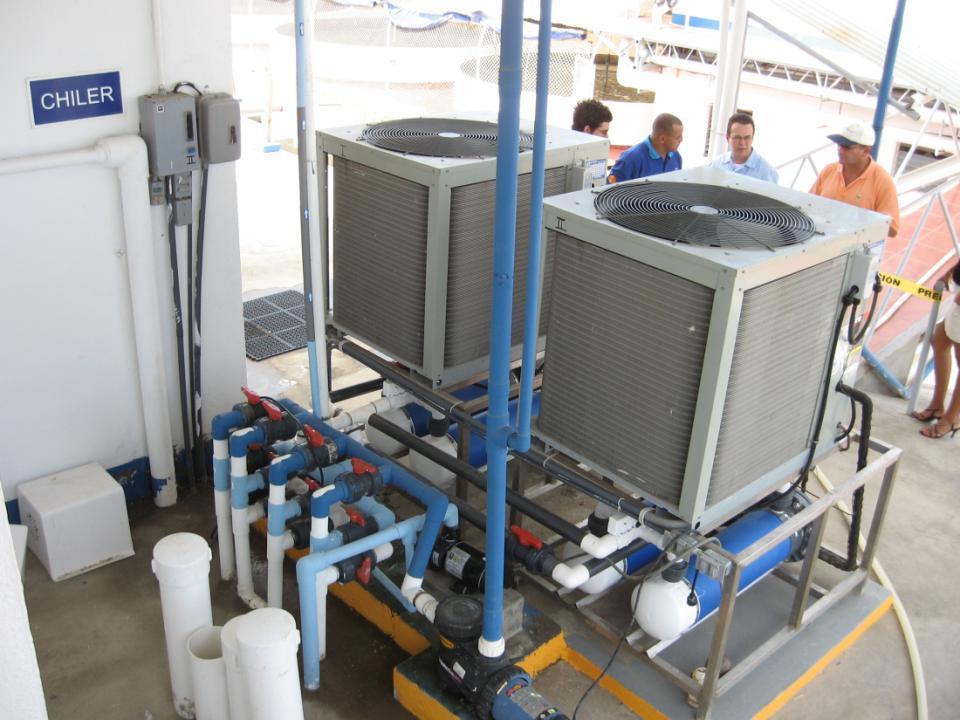
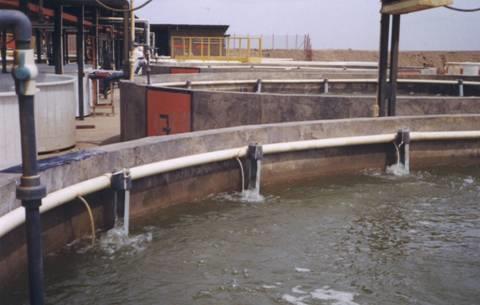
78 RECIRCULATION TECHNOLOGY (RAS) 78
79 WHAT ABOUT THE U.S. SHRIMP MARKET?
80 U.S. - Top Seafoods Consumed

81 Seafood lbs

82 U.S. SHRIMP SUPPLY Dependence on Imports URNER BARRY


83 URNER BARRY SHRIMP IMPORT CYCLES BY MAIN SUPPLIERS

84 Main Suppliers Thailand and Vietnam having serious shrimp disease problems Ecuador Increasing production, but. URNER BARRY

85 Main Suppliers URNER BARRY
86 URNER BARRY
87 OPPORTUNITY FOR U.S. PRODUCERS
88

89
90

91 New Shrimp Production Paradigm
92 New Shrimp Production Paradigm: The Opportunity Established, large global markets that can be expanded further. Early Mortality Syndrome (EMS / APHNS) disease is a game-changer over US$ 3.5 billions in global losses since Supply not meeting demand (EMS) + demand can expand (established and new markets). New, biosecure, indoor = controlled production technologies available several competitive advantages.
93

94 New Shrimp Production Paradigm: The Technology Year-Round Production of Fresh/Chilled/Frozen Shrimp Near Major U.S. Markets
95 Shrimp-in-U.S. SWOT Analysis Strengths Large, established market. 25% of seafood consumed. Large technological base. Best aquafeed technology & ingredients. Many competitive advantages. Opportunities Promote wholesome, healthy, nutritious, no water, no ABXs US grown, US product. Increase demand (2x meals/year) = 300 million lbs more needed! Automate many procedures. Weaknesess Very limited PL supply. Limited niche markets. High cost of processing. Regulatory/fiscal environment. Threats Overseas industry recovers quickly. Cannot compete with int l commodity prices. Diseases.
96 STRATEGIES Moving Forward New paradigm needed. Production: Adopt and improve indoor/ras/biofloc technology. Improve selective breeding programs. Improve feeds and nutrition. Market: Promote home-grown shrimp consumption. US can be a shrimp exporter! Industry: Consolidate. Organize: need a voice. Strategic alliances wholesalers, retailers.

97 Aquaculture, not the internet, represents the most promising investment opportunity of the 21st century. Peter Drucker Nobel Laureate and Economist
98
99 COMMERCIAL AQUACULTURE THANK YOU!

100 URNER BARRY
101 Conclusions Shrimp industry has developed tremendously. It faces old and new challenges (production, market, financial). The main production trends are emphasis for more efficiency at every level of the production and marketing chain, and industry consolidation. The main market trends are creation of new markets, internal and external, and increased traceability and certification. Need to transition to industrial perspective to improve profitability and sustainability, primarily in areas of: Domestication and selective breeding Nutrition and feeds Disease management Controlled production systems Increasing market demand for safe and healthy products generated in a responsible and sustainable manner will require increased traceability and certification.

102 SECTION BREAK PENTAIR PRESENTATION TITLE

103 PENTAIR BELIZE
104 Selective Breeding & Genetic Improvement PENTAIR
World Bank University of Rhode Island United States
 James Anderson World Bank University of Rhode Island United States Dr. James Anderson leads the World Bank s Global Program on Fisheries and Aquaculture. He previously chaired the Department of Environmental
Shrimp Production Review
 Shrimp Production Review James L. Anderson, Director, Institute for Sustainable Food Systems University of Florida Diego Valderrama, University of los Andes, Colombia Darryl Jory, Global Aquaculture Alliance
THE ECONOMIC IMPACTS OF EMERGING DISEASES IN SHRIMP AQUACULTURE
 THE ECONOMIC IMPACTS OF EMERGING DISEASES IN SHRIMP AQUACULTURE INSIGHTS FROM A MULTI-YEAR, GLOBAL SURVEY OF THE INDUSTRY Diego Valderrama University of los Andes, Colombia James L. Anderson Institute
Global Shrimp Aquaculture Industry Dynamics
 Global Shrimp Aquaculture Industry Dynamics Rabobank F&A insights Lian Heinhuis, Food and Agribusiness Research November 2015 1 Table of contents Sections I General outlook: times of supply volatility
12/16/2010. David Kawahigashi
 Overview of P. vannamei Culture and Broodstock Domestication in Asia David Kawahigashi Origin of P. vannamei 1 2010 P. vannamei Culture Current trends in Asian shrimp culture Rapidly increasing production
shrimp production in india: growth, profitability & controls
 shrimp production in india: growth, profitability & controls Ramesh Gangatharan. Ph.D Wenger Manufacturing Inc. & Vice President, Society of Aquaculture Professionals (SAP) Mob: +91-9444 384 369 Email:ramesh@wenger.com
Factors Affecting Global Agricultural Markets. Fred Giles Director, Agricultural Trade Office USDA / SP
 Factors Affecting Global Agricultural Markets Fred Giles Director, Agricultural Trade Office USDA / SP Factors Impacting Global Agricultural Markets Commodity Prices Energy Prices Value of the U.S. Dollar
Perspectives on Shrimp Industry. January 2016 Chilaw, Sri Lanka
 Perspectives on Shrimp Industry January 2016 Chilaw, Sri Lanka Market Conditions Today Lower Prices Higher Costs Disease Tilapia Shrimp Fishmeal (Peru) - 9 % - 14 % Jun-00Jan-02Aug-03Mar-05Oct-06 May-
The Story Behind the Numbers: Issues Impacting Production. Dr. George Chamberlain Global Aquaculture Alliance
 The Story Behind the Numbers: Issues Impacting Production Dr. George Chamberlain Global Aquaculture Alliance Dr. George Chamberlain has been president of the Global Aquaculture Alliance since its inception
AQUACULTURE SUMMARY. The State of World Fisheries and Aquaculture Report FAO 2016
 AQUACULTURE SUMMARY The State of World Fisheries and Aquaculture Report FAO 2016 The following report is a summary of the The State of World Fisheries and Aquaculture 2016 1 : Contributing to food security
Wild and farmed fish in the USA seafood market
 Wild and farmed fish in the USA seafood market John Connelly Your essential event for networking and information US Market Trends and Impact on Fishmeal October 2017 John Connelly Topics Outline National
Meeting the Future Demand for Aquatic Food: the Role of Aquaculture. Rohan Subasinghe FAO, Rome
 Meeting the Future Demand for Aquatic Food: the Role of Aquaculture Rohan Subasinghe FAO, Rome Animal Sourced Food Farmed Aquatics vs. Other Animal Source Foods Comparison of Sustainability Indicators
Commercial larviculture of Penaeid shrimp. Dan Fegan SCRD Co. Ltd. and BIOTEC Thailand
 Commercial larviculture of Penaeid shrimp Dan Fegan SCRD Co. Ltd. and BIOTEC Thailand Thanks to Patrick Sorgeloos, and the organisers/sponsors of Larvi 01 for inviting me and supporting my attendance Colleagues
Role of Trade in Disease Spread Regional Overview
 Network of Aquaculture Centres in Asia-Pacific Role of Trade in Disease Spread Regional Overview Eduardo M. Leaño Network of Aquaculture Centres in Asia-Pacific Bangkok, Thailand OIE Regional Workshop
8 TH ANNUAL ALLTECH GLOBAL FEED SURVEY
 8 TH ANNUAL ALLTECH GLOBAL FEED SURVEY Now in its eighth year, the annual Alltech Global Feed Survey has become the premier insight into the feed industry. The survey is cited in more than 80 articles
Agriculture Commodity Markets & Trends
 Agriculture Commodity Markets & Trends Agenda Short History of Agriculture Commodities US & World Supply and Demand Commodity Prices Continuous Charts What is Contango and Backwardation Barge, Truck and
Fresh Deciduous Fruit (Apples, Pears, and Grapes): World Markets and Trade
: World Markets and Trade") Fresh Deciduous Fruit (Apples, Pears, and Grapes): World Markets and Trade June 9 SUMMARY Global apple production is expected to expand percent and trade is expected to surge 5 percent in 8/9 due to strong
Fresh Deciduous Fruit (Apples, Pears, and Grapes): World Markets and Trade June 9 SUMMARY Global apple production is expected to expand percent and trade is expected to surge 5 percent in 8/9 due to strong
Government actions on EMS/AHPND in Thailand
 FAO TCP/INT/3502 Reducing and managing the risk of Acute Hepatopancreatic Necrosis Disease (AHPND) of Cultured Shrimp Government actions on EMS/AHPND in Thailand Putth Songsangjinda*, Tidaporn Chaweepack,
Putth Songsangjinda Senior Expert on Marine Shrimp Culture Department of Fisheries, Thailand
 Putth Songsangjinda Senior Expert on Marine Shrimp Culture Department of Fisheries, Thailand 2700 km of coastal line Located at the tropical climate, Ideal for coastal aquaculture Basic biophysical of
Global Agricultural Supply and Demand: Factors contributing to recent increases in food commodity prices
 Global Agricultural Supply and Demand: Factors contributing to recent increases in food commodity prices Ron Trostle Economic Research Service U.S. Department of Agriculture Agricultural Markets and Food
VA AGRICULTURE & FORESTRY: BUILDING DOMESTIC CAPACITY, EXPORTING TO THE WORLD
 VA AGRICULTURE & FORESTRY: BUILDING DOMESTIC CAPACITY, EXPORTING TO THE WORLD VIRGINIA ECONOMIC DEVELOPERS ASSOCIATION 2014 GOVERNOR S CONFERENCE ON ECONOMIC DEVELOPMENT VIRGINIA SECRETARY OF AGRICULTURE
Since 1977
 www.omarsa.com.ec Since 1977 sales@omarsa.com.ec Omarsa, Sustainable Shrimp Exporter Since 1977 Omarsa has been dedicated to the cultivation, processing and export of sustainable shrimp. Our dedication
SITUATION, TRENDS AND PROSPECTS OF THE SUPPLY OF FISHERIES AND AQUACULTURE PRODUCTS TO THE EU MARKET
 SITUATION, TRENDS AND PROSPECTS OF THE SUPPLY OF FISHERIES AND AQUACULTURE PRODUCTS TO THE EU MARKET European Commission Seminar Madrid 15 April 2010 Audun Lem, FAO 1 Outline World fish supply and demand
DDGS A World of Opportunities. Dr. Jerry Shurson Department of Animal Science University of Minnesota
 DDGS A World of Opportunities Dr. Jerry Shurson Department of Animal Science University of Minnesota Ethanol Plants June 16, 2004 Under Construction or proposed Ethanol Plants Source: Jim Jolly Land O
Worksheet for world asbestos consumption calculations
 Worksheet for world asbestos consumption calculations Apparent consumption calculation made using production data available on 6-8-2015 from the USGS and trade data available on 6-5-2015 from the United
The out look for shrimp aquaculture in India. Ravi Kumar Yellanki Vaisakhi Bio-Marine (P) Ltd, India.
 Ltd, India.") The out look for shrimp aquaculture in India Ravi Kumar Yellanki Vaisakhi Bio-Marine (P) Ltd, India. Indian Shrimp Production Year Monodon Vannamei Total PL billion Production tons PL billion Production
The out look for shrimp aquaculture in India Ravi Kumar Yellanki Vaisakhi Bio-Marine (P) Ltd, India. Indian Shrimp Production Year Monodon Vannamei Total PL billion Production tons PL billion Production
U.S. Rice Market Faces Larger Supplies and Lower Prices in 2018/19; Global Trade Projected Another Record High
 U.S. Rice Market Faces Larger Supplies and Lower Prices in 218/19; Global Trade Projected Another Record High 218 Rice Outlook Conference December 5-7, 218 Nathan Childs Economic Research Service USDA
SOUTHEAST ASIA PREPARING FOR INVESTMENT IN OFFSHORE CAGE PRODUCTION
 SOUTHEAST ASIA PREPARING FOR INVESTMENT IN OFFSHORE CAGE PRODUCTION Lukas Manomaitis Aquaculture Program Technical Contractor/Southeast Asian Technical Director USSEC WHAT IS THE U.S. SOYBEAN EXPORT COUNCIL
Global Sugar Consumption Expands While Production Stagnates
 United States Department of Agriculture Foreign Agricultural Service Sugar: World Markets and Trade Global Sugar Consumption Expands While Production Stagnates 180 Million Metric Tons, Raw Value 170 160
U.S. Agricultural Trade: Trends, Composition, Direction, and Policy
 U.S. Agricultural Trade: Trends, Composition, Direction, and Policy Charles E. Hanrahan Senior Specialist in Agricultural Policy Carol Canada Information Research Specialist Beverly A. Banks Acquisitions
Emerging Global Trade Patterns: USDA s Long-term Agricultural Projections
 Emerging Global Trade Patterns: USDA s Long-term Agricultural Projections Midwest Agriculture s Ties to the Global Economy Federal Reserve Bank of Chicago November 28, 217 Chicago Jim Hansen, Ph.D. USDA,
What future food security means to the developing and developed worlds. Reshaping the industry in turbulent times
 What future food security means to the developing and developed worlds Reshaping the industry in turbulent times Nan-Dirk Mulder, 12 November 2014 Content 1. Long term global animal protein outlook 2.
MARKETING STRATEGY FOR VIETNAMESE FRESHWATER SHRIMP TO THE UNITED STATES
 PO Box 1390, Skulagata 4 120 Reykjavik, Iceland Final Project 2002 MARKETING STRATEGY FOR VIETNAMESE FRESHWATER SHRIMP TO THE UNITED STATES Bui Thuy Diem Trang Promotion Department Vietnam Association
Functional feed additives to prevent disease in farmed shrimp
 As first published by Efeedlink on Friday 28 August 2015 Functional feed additives to prevent disease in farmed shrimp Bacterial and viral infections have caused disastrous collapses of the shrimp farming
September 12, USDA World Supply and Demand Estimates
 September 12, 2018 - USDA World Supply and Demand Estimates Corn Market Reaction: December 2018 corn futures closed down 14 ¼ cents at $3.52 ½ with a trading range for the day of $3.50 ¾ to $3.66 ¼. December
Argus Ethylene Annual 2017
 Argus Ethylene Annual 2017 Market Reporting Petrochemicals illuminating the markets Consulting Events Argus Ethylene Annual 2017 Summary Progress to the next peak of the economic cycle, now expected by
Global Food Security Index
 Global Food Security Index Sponsored by 26 September 2012 Agenda Overview Methodology Overall results Results for India Website 2 Overview The Economist Intelligence Unit was commissioned by DuPont to
Sugar: World Markets and Trade
 United States Department of Agriculture Foreign Agricultural Service November 2018 Sugar: World Markets and Trade Record Stocks and Consumption Despite Lower Production 205 185 Production Consumption Stocks
Sugar: World Markets and Trade
 United States Department of Agriculture Foreign Agricultural Service Sugar: World Markets and Trade May 218 Elevated in 218/19 Keeps Stocks High, Pressuring Prices Ending Stocks 2 18 16 14 12 1 8 6 4 Other
Global Efforts in Harmonization
 11 September 2015 Global Efforts in Harmonization Ignacio Antequera Senior Manager Technical KAM GLOBALG.A.P. THE SITUATION Projected world population by 2050: 9.6 billion To meet our needs, food production
Marine Shrimp Farming World Reality and the Challenges Confronted by that Sector in Brazil
 Stakeholder Consultation on Progressive Management Pathway (PMP) to Improve Aquaculture Biosecurity World Bank Headquarters, Washington, D.C. 10-12 April 2018 Marine Shrimp Farming World Reality and the
Indian Soybean meal- Demand /Supply. Pawan Kumar, Consultant, USSEC
 Indian Soybean meal- Demand /Supply Pawan Kumar, Consultant, USSEC USSEC INTRODUCTION We Represent U S farmers U S Industry U S Department of Agriculture We work on finding new applications of soy & Implement
FACTORS CREATING RISK IN U.S. GRAIN MARKETS
 FACTORS CREATING RISK IN U.S. GRAIN MARKETS WAY TOO EARLY GRAIN MARKET OUTLOOK TO 2050 22 ND NATIONAL WORKSHOP FOR DAIRY ECONOMISTS & POLICY ANALYSTS APRIL 30, 2015 JOHN NEWTON UNIV. OF ILLINOIS JCNEWT@ILLINOIS.EDU
FAO efforts on shrimp aquaculture health management including the AHPND International Technical Seminar
 FAO TCP/INT/3502 Reducing and managing the risk of Acute Hepatopancreatic Necrosis Disease (AHPND) of Cultured Shrimp FAO efforts on shrimp aquaculture health management including the AHPND International
The global feed industry: Producing more than 1 billion metric tons
 The global feed industry: Producing more than 1 billion metric tons Last year, the Alltech Global Feed Survey estimated world animal feed production at over 1 billion metric tons globally for the first
Global poultry and pork outlook
 Global poultry and pork outlook Shaping the industry for competitiveness in a fast changing world Nan-Dirk Mulder, 8 November 217 Content I Global meat outlook 225 II III Regional meat outlook strategies
Myanmar - Opportunities in Aquaculture. Lukas Manomaitis ASA-IM SEA Technical Director Aquaculture May Myat Noe Lwin ASA-IM Myanmar Local Coordinator
 Myanmar - Opportunities in Aquaculture Lukas Manomaitis ASA-IM SEA Technical Director Aquaculture May Myat Noe Lwin ASA-IM Myanmar Local Coordinator COUNTRY PROFILE: Total area of 676,577 km2 Five main
GLOBAL FEED SITUATION
 Aidan Connolly Chief Innovation Officer VP Corporate Accounts Colm Moran Director Regulatory Affairs, EMEA ALLTECH INC. GLOBAL FEED SITUATION AFMA FORUM 2016 How was this survey conducted? Estimates compound
Rice: Global Competitiveness of the U.S. Rice Industry
 Rice: Global Competitiveness of the U.S. Rice Industry October 7, 2015 Disclaimer: The views expressed here are those of the presenters, and do not necessarily represent those of any individual Commissioner
U.S. Rice Market Faces Tighter Supplies and Higher Prices in 2017/18
 U.S. Rice Market Faces Tighter Supplies and Higher Prices in 217/18 University of Arkansas Webinar Series October 26, 217 Nathan Childs Economic Research Service USDA Approved by the World Agricultural
FSC Facts & Figures. August 4, FSC F FSC A.C. All rights reserved
 FSC Facts & Figures August 4, 2016 FSC F0001000 FSC A.C. All rights reserved Global FSC-certified forest area North America 35.9% of total FSC-certified area ( 68,725,419 ha ) 249 certificates Europe 47.7%
FSC Facts & Figures. September 12, FSC F FSC A.C. All rights reserved
 FSC Facts & Figures September 12, 2016 FSC F0001000 FSC A.C. All rights reserved Global FSC-certified forest area North America 35.8% of total FSC-certified area ( 68,217,276 ha ) 243 certificates Europe
Implications for commodity prices and farm income
 Implications for commodity prices and farm income Mike Dwyer Director, Global Policy Analysis Office of Global Analysis Foreign Agricultural Service US Department of Agriculture Mike.Dwyer@fas.usda.gov
Forest Stewardship Council
 Global FSC certified area*: by region Africa CAMEROON CONGO, THE REPUBLIC OF GABON GHANA MOZAMBIQUE NAMIBIA SOUTH AFRICA SWAZILAND TANZANIA, UNITED UGANDA Asia CAMBODIA CHINA INDIA INDONESIA JAPAN KOREA,
Forest Stewardship Council
 Global FSC Certified Businesses: by country PUERTO RICO 4 FINLAND 83 BAHRAIN GUATEMALA 29 MACEDONIA 3 VIETNAM 004 CONGO, THE REPUBLIC OF 5 NEW ZEALAND 287 KOREA, REPUBLIC OF 243 UGANDA 3 MONACO 4 EGYPT
Competitive Study - Cluster Approach Study Highlights: Competitiveness of Thailand s Black Tiger Shrimp Industry
 Competitive Study - Cluster Approach Study Highlights: Competitiveness of Thailand s Black Tiger Shrimp Industry Institute for Management Education for Thailand Foundation Agenda 1. Competitiveness Framework
FSC Facts & Figures. March 13, FSC F FSC A.C. All rights reserved
 FSC Facts & Figures March 13, 2017 FSC F000100 0 FSC A.C. All rights reserved Global FSC-certified forest area North America 35.6% of total FSC-certified area ( 69,049,912 ha ) 248 certificates Europe
FSC Facts & Figures. January 6, FSC F FSC A.C. All rights reserved
 FSC Facts & Figures January 6, 2017 FSC F000100 0 FSC A.C. All rights reserved Global FSC-certified forest area North America 35.3% of total FSC-certified area ( 69,212,841 ha ) 248 certificates Europe
FSC Facts & Figures. February 1, FSC F FSC A.C. All rights reserved
 FSC Facts & Figures February 1, 2017 FSC F000100 0 FSC A.C. All rights reserved Global FSC-certified forest area North America 35.8% of total FSC-certified area ( 69,590,919 ha ) 249 certificates Europe
Import Rejections of Agricultural and Food Products from East Asia
 Import Rejections of Agricultural and Food Products from East Asia Lei Lei IDEJETRO 10/01/2015 1 The Role of the Agricultural Sector East Asia (14 countries) Brunei, Cambodia, Indonesia, Malaysia, Lao,
August 16 th, DDGS/cash corn value stands at 106 percent of its two-year average. INSIDE THIS ISSUE. General Comments:
 INSIDE THIS ISSUE 1. General Comments 2. DDGS Reference Prices 3. Ocean Freight Markets 3. Latest Export Figures (Calendar and Crop Year) 6. FOB US Gulf DDGS & Corn Prices 7. Council News DDGS/cash corn
London Seafood Investor Forum
 London Seafood Investor Forum Knut Nesse, CEO Nutreco 31 October 2014 Agenda 1 2 3 SHV offer for Nutreco Nutreco and Q3 trading update Industry fundamentals 1. SHV offer for Nutreco SHV recommended cash
May 10, USDA World Supply and Demand Estimates
 May 10, 2018 - USDA World Supply and Demand Estimates Corn Market Reaction: July 2018 corn futures closed down ¾ cent at $4.02 with a trading range for the day of $4.00 to $4.07. December 2018 corn futures
A Ten Year Strategic Outlook for the Global Flexible Plastic Packaging Market. Sample pages. Commodity Inside Ltd
 A Ten Year Strategic Outlook for the Global Flexible Plastic Packaging Market Sample pages Chapter 1- Executive summary 1.1 Changes in the global flexible plastic packaging industry 1.2 Cost effectiveness
FSC Facts & Figures. December 1, FSC F FSC A.C. All rights reserved
 FSC Facts & Figures December, 0 FSC F00000 FSC A.C. All rights reserved Global FSC certified forest area North America.9v of total FSC certified area m 67::08 ha I 47 certificates Europe 47.v of total
Cotton: World Markets and Trade
 United States Department of Agriculture Foreign Agricultural Service Circular Series FOP - December Cotton: World Markets and Trade Unprecedented Daily Price Volatility Rules the Market Now Daily NY Nearby
FSC Facts & Figures. September 1, FSC F FSC A.C. All rights reserved
 FSC Facts & Figures September 1, 2017 FSC F0001000 FSC A.C. All rights reserved Global FSC-certified forest area North America 34.9% of total FSC-certified area ( 69,014,953 ha ) 246 certificates Europe
FSC Facts & Figures. October 4, FSC F FSC A.C. All rights reserved
 FSC Facts & Figures October 4, 2017 FSC F0001000 FSC A.C. All rights reserved Global FSC-certified forest area North America 35.2% of total FSC-certified area ( 68,947,375 ha ) 246 certificates Europe
Dao Huy Giap, Po Garden and Louis Lebel
 Dao Huy Giap, Po Garden and Louis Lebel 1976 1981 1986 1991 1996 2001 2006 Import quantity (Millions of tonnes) 1976 1981 1986 1991 1996 2001 2006 Production (Millions of Tonnes) Introduction 3.0 75% of
FSC Facts & Figures. December 1, FSC F FSC A.C. All rights reserved
 FSC Facts & Figures December 1, 2017 FSC F0001000 FSC A.C. All rights reserved Global FSC-certified forest area North America 35.7% of total FSC-certified area ( 69,695,913 ha ) 248 certificates Europe
MICROBIAL MANAGEMENT AS PART OF THE OPERATIONAL STRATEGY FOR SHRIMP FARMING DISEASE CONTROL
 MICROBIAL MANAGEMENT AS PART OF THE OPERATIONAL STRATEGY FOR SHRIMP FARMING DISEASE CONTROL Peter De Schryver, PhD Project Team Leader Health Innovations Department INVE Technologies N.V. 1 DISEASES, A
BUSINESS PLAN. AQUATICAM Sustainable Shrimp Aquatic Culture Project POWERED BY: Ref: RADIUS Market Cambodia All Right Reserved
 AQUATICAM Sustainable Shrimp Aquatic Culture Project BUSINESS PLAN POWERED BY: Ref: 15032010 2011 RADIUS Market Cambodia All Right Reserved This document set out the key strategic directions for AQUATICAM,
CSM-PD. pre-heating, degassing and storage system for clean steam generators
 CSM-PD pre-heating, degassing and storage system for clean steam generators Clean steam generator feedwater treatment system To enable clean steam generators to provide the highest quality clean steam
FSC Facts & Figures. June 1, 2018
 FSC Facts & Figures June 1, 2018 Global FSC-certified forest area North America 34.6% of total FSC-certified area ( 69,460,004 ha ) 242 certificates Europe 49.4% of total FSC-certified area ( 99,068,686
Cargill Aqua Nutrition Sustainability Report 2017 Preview
 Nutrition Sustainability Report 2017 Preview PRESIDENT S LETTER Healthy Seafood for Future Generations MORE sustainable growth We deliver on our commitment to widen our reporting and build transparency
Seafish summary FAO World aquaculture 2010 (published 9 November 2011)
") Seafish summary FAO World aquaculture 2010 (published 9 November 2011) Key details Global production of fish from aquaculture, (including finfish, crustaceans, molluscs and other aquatic animals for human
Seafish summary FAO World aquaculture 2010 (published 9 November 2011) Key details Global production of fish from aquaculture, (including finfish, crustaceans, molluscs and other aquatic animals for human
FSC Facts & Figures. September 6, 2018
 FSC Facts & Figures September 6, 2018 Global FSC-certified forest area North America 34.5% of total FSC-certified area ( 69,584,479 ha ) 253 certificates Europe 49.4% of total FSC-certified area ( 99,747,108
Intensive culture of milkfish Chanos chanos in polyculture with white shrimp Penaeus indicus or mud crab Scylla serrata in brackishwater earthen ponds
 AQUACULTURE EXTENSION MANUAL NO. 57 JULY 2014 Intensive culture of milkfish Chanos chanos in polyculture with white shrimp Penaeus indicus or mud crab Scylla serrata in brackishwater earthen ponds Gerry
Opportunities & Challenges in Multimodal Logistics An Indian Perspective
 Opportunities & Challenges in Multimodal Logistics An Indian Perspective CONTENTS Logistics in India Current Status Multimodal Logistics Opportunities Challenges Logistics in India Current Status India
FSC Facts & Figures. August 1, 2018
 FSC Facts & Figures August 1, 2018 Global FSC-certified forest area North America 34.6% of total FSC-certified area ( 69,481,877 ha ) 253 certificates Europe 49.4% of total FSC-certified area ( 99,104,573
A global meat industry outlook
 A global meat industry outlook Capturing business opportunities in a fast changing world Copenhagen Nan-Dirk Mulder, 18 February 2017 Rabobank international introduction and global network of branches
Vannamei farming Penaeus Vannamei vs. Penaeus Monodon Last 7 Years average annual growth 211% AND T US HO T
 Vannamei Shrimp THOUSAND TONS $/lb - 2 - Vannamei farming Penaeus Vannamei vs. Penaeus Monodon 3500 3000 2500 Penaeus vannamei Penaeus monodon 2000 Last 7 Years average annual growth 211% 1500 1000 500
FSC Facts & Figures. February 9, FSC F FSC A.C. All rights reserved
 FSC Facts & Figures February 9, 2018 FSC F0001000 FSC A.C. All rights reserved Global FSC-certified forest area North America 34.5% of total FSC-certified area ( 68,976,317 ha ) 243 certificates Europe
FSC Facts & Figures. April 3, FSC F FSC A.C. All rights reserved
 FSC Facts & Figures April 3, 2018 FSC F0001000 FSC A.C. All rights reserved Global FSC-certified forest area North America 34.7% of total FSC-certified area ( 69,167,742 ha ) 242 certificates Europe 49.3%
Aruba FedEx International Priority. FedEx International Economy 3
 SERVICES AND RATES FedEx International Solutions for your business Whether you are shipping documents to meet a deadline, saving money on a regular shipment or moving freight, FedEx offers a suite of transportation
COMMITTEE ON COMMODITY PROBLEMS
 September 2009 E COMMITTEE ON COMMODITY PROBLEMS JOINT MEETING OF THE FOURTH SESSION OF THE SUB-GROUP ON BANANAS AND THE FIFTH SESSION OF THE SUB-GROUP ON TROPICAL FRUITS Rome, 9 11 December 2009 PRODUCT
FSC Facts & Figures. January 3, FSC F FSC A.C. All rights reserved
 FSC Facts & Figures January 3, 2018 FSC F0001000 FSC A.C. All rights reserved Global FSC-certified forest area North America 34.7% of total FSC-certified area ( 69,082,443 ha ) 245 certificates Europe
Rice Outlook and Baseline Projections. University of Arkansas Webinar Series February 13, 2015 Nathan Childs, Economic Research Service, USDA
 Rice Outlook and Baseline Projections University of Arkansas Webinar Series February 13, 2015 Nathan Childs, Economic Research Service, USDA THE GLOBAL RICE MARKET PART 1 The 2014/15 Global Rice Market:
National Renderers Association. Latin America. German Davalos NRA Convention Santa Barbara, CA October 26, 2017
 National Renderers Association Latin America German Davalos NRA Convention Santa Barbara, CA October 26, 2017 Fat Imports from USA (TMT) Jan-Dec 2016 Latin America Jan-Aug 2016 & 2017 384 TMT Mexico Central
Selective Breeding in Shrimp Farming
 Elastomer tagging is one method that is used to identify which characters have passed onto the next generation in breeding programmes. (Photo courtesy: Kona Bay vannamei breeding program, Hawaii) Selective
Global Meat Market Trade Barriers and Policies
 Global Meat Market Trade Barriers and Policies Cheyenne Dixon Manager, Technical Services Reciprocal Meat Conference June 18, 2013 Topics of Discussion Export Overview U.S. Import Restrictions Export Market
Interpreting Maps, Charts, and Graphs
 Interpreting Maps, Charts, and Graphs Crop Hearths (pg. 348) # s 1-5 1. The map of crop hearths indicates that a. coconuts, pigeonpeas, maize, and tomatoes were first domesticated in Southeast Asia. b.
FSC Facts & Figures. November 15. FSC F FSC A.C. All rights reserved
 FSC Facts & Figures November FSC F00000 FSC A.C. All rights reserved Global FSC certified forest area North America.u of total FSC certified area / 6.8.89 ha D 6 certificates Europe 8u of total FSC certified
Idaho Wheat Commission Cereal Schools. January 28, 2016
 Idaho Wheat Commission Cereal Schools January 28, 2016 About the Wheat Commission 2016 Supply Picture Segregating for Premium Price Protecting our Dams Maintaining Soft White Quality About the Idaho Wheat
FedEx International Priority. FedEx International Economy 3
 SERVICES AND RATES FedEx International Solutions for your business Whether you are shipping documents to meet a deadline, saving money on a regular shipment or moving freight, FedEx offers a suite of transportation
Feed Grains Outlook: Shifting Trade Patterns and Implications for the US Acreage Mix. May 23, 2018
 Feed Grains Outlook: Shifting Trade Patterns and Implications for the US Acreage Mix May 23, 2018 The Growth of Chinese Imports May Reshape World Trade in Corn Brazil s Safrinha Crop Could Play a Key Role
the unfulfilled potential of a farmed tropical whitefish in European markets
 Tilapia and Europe the unfulfilled potential of a farmed tropical whitefish in European markets Dave Little and Francis Murray Sustainable Aquaculture Group, Institute of Aquaculture, University of Stirling
Global Food Security Index 2014:
 Global Food Security Index 2014: Project results Sponsored by 12 June 2014 Overview Methodology Results Feeding Asia-Pacific: Australia s role in regional food security Overview In 2012 the Economist Intelligence
The World Cotton Situation * Terry Townsend, Executive Director Armelle Gruere, Statistician. Projections to 2020
 INTERNATIONAL COTTON ADVISORY COMMITTEE 1629 K Street NW, Suite 72, Washington, DC 26 USA Telephone (22) 463-666 Fax (22) 463-695 e-mail secretariat@icac.org The World Cotton Situation * Terry Townsend,
Argus Benzene Annual 2017
 Argus Benzene Annual 2017 Petrochemicals illuminating the markets Market Reporting Consulting Events Argus Benzene Annual 2017 Summary The Argus (formerly DeWitt) Benzene Annual has provided an accurate