Geospatial for Environment. Dr. Hussein Harahsheh Global Scan Technologies, Dubai. Natural Environment
|
|
|
- Sandra Hancock
- 5 years ago
- Views:
Transcription

1 Geospatial for Environment Dr. Hussein Harahsheh Global Scan Technologies, Dubai 2 Natural Environment All living and non-living things occurring naturally on Earth. Interaction of all living species. It is the climate, weather, and natural resources. All components affect human survival and economic activity 1


2 3 Human Impact man transformed landscapes into such as urban settings and agricultural land conversion, The natural environment is greatly modified and diminished: deforestation, waste, over population, pollution, overuse of natural resources, 4 2
")


3 5 6 Environmental Information- Scope Create policy, implement plan and regulations, and manage enforcement, example: geospatial intelligence (movement of controlled waste) easy access to sensor and imagery data gives the power to detect and monitor pollution, weather, hazards and make environmental analysis. Data analysis and visualization in 2D and 3F improve assessment and building scenarios for decision makers. Publish interactive online environmental data will spread the information and increase the public awareness. 3
4 7 Environmental Information- Scope Economy Providing economic expansion opportunities to maintain a diverse economy, rich in resources Transportation with specific focus on integrating transportation systems with land use and the environment Settlement t Pattern Balanced growth, focusing on accommodating growth so development is sustainable Environment Protecting the environment so our vast open spaces and clean lakes & waterways are maintained & enhanced 8 Answering Key Questions What locations are regionally significant to support economic expansions? What type of transportation investment do we want to facilitate growth? Where should we encourage settlement areas over the next 25 years? How do we protect our environmental assets? What problems fast growing region like Dubai is facing? 4
5 9 Why Geospatial Information System 1. Better understanding of land resource and utilization 2. Urban & regional Planning: 1. Available land is used in most optimal way. 2. Prepare comprehensive and operational infrastructure studies and development plans. 3. Wise and orderly use, management, and conservation of vegetation, soil and water resources. 4. Regional impact assessment studies. 5. Site selection for diverse activities 10 Continue Why Geospatial Information System 3. Vegetation Conservation & management: 1. Determination of species conservation values 2. landscape conservation, planning and management 3. Monitoring vegetation stress. 4. Define Protected or natural reserved Area Categories Based on Management Purpose. 5. Biodiversity conservation 5
6 11 Continue Why Geospatial Information System 4. Soil Conservation & Management: 1. Determine soil limitations for building and development 2. Evaluate the capability of a soil for agriculture activities 3. Determine the soil and water conservation practices necessary to maintain the soil. 4. Determine the limitation of the soil for sanitary landfill sites, and waste water renovation. 12 Why Geospatial Information System 1. Mineral, Oil, Gas and Water Explorations 2. Site Selection for: 1. Waste disposal 2. Settlement or industrial developments 3. Dams, artificial recharge & harvesting rainfall water 4. Recreational development 3. Protection and Conservation of Groundwater Resource 6

7 13 Continue Why Geospatial Information System 4. Answer some important equation where the natural underground has a hydraulic permeability watershed classes and characteristics flood prone areas, Stable ground, Landslides hazards Seismic activity (fault zones), Groundwater resources (high yield, good quality), Potential areas for mining of important mineral resources. 14 7
8 15 Case Studies Sustainable Site Selection Land Degradation Oil Spill 16 Site selection for Desert Resorts Development. 8
 Good Soils (Useful for afforestation and vegetation development) Good Hydrogeological zones (")

9 17 Methodology Input Parameters Soil Land use Geomorphology Natural Vegetation Hydrogeology GIS Analysis Multi-criteria Evaluation Potential Site for Desert Resort Development 18 Criteria & Rules Good Landforms ( with low slopes and Natural Vegetation) Good Soils (Useful for afforestation and vegetation development) Good Hydrogeological zones ( availability of groundwater) Nearness to the existing Road network ( accessibility ) Good Land use (Vacant and non-commercial land, far from main city excluding coastal areas) In-general, area should be plain area to avoid huge leveling cost Minimum available area should be 25 Sq. km * These rules can be modified as per the problem under investigation 9


10 19 Geospatial Information(layers) Area Percentage of Classes % 3 36% 2 7% 1 7% 6 7% 5 15% Suitability Class Area in Sq. Km


11 21 Land Degradation and Desertification 22 Desertification of Drylands of Asia 11


12 23 Desertification of Drylands of Asia 24 Desertification of West Asia 12


13 25 Desertification of West Asia Methodology 26 Desertification of West Asia -Results 13


14 27 Desertification of West Asia -Results Desertification in North of Jordan Objectives If unplanned human activities persist in semi-arid/arid area, an irreversible situation of desertification will occur in the near future. It is necessary to assess desertification. It is very important to monitor and estimate distribution of desertification in vast area by using remote sensing and GIS techniques


15 Study Area NEARAND MIDDLE EAST Mafraq area Jordan - Area = 1300km 2 - Climate : semi-arid/arid - Rainfall < 200mm 29 Satellite Image of Study Area Landsat TM image (1997/11) of Mafraq area Copyright Dr. Hussein Harahsheh 30 15

 Combination of Geomorphology and Land use")
16 Methodology and techniques for Desertification mapping Remote sensing data Satellite images Thematic map Statistical data -Socioeconomic factors - Natural factors GIS database Erosion susceptibility maps Land Degradation maps Water erosion map Wind erosion map Vegetation degradation map Salinization map Desertification map 31 Desertification Mapping Units (DMU) Combination of Geomorphology and Land use Information 32 16
 33 Water")

17 Environmental GIS database Satellites images Land use Soil Geomorphology units Slope Drainage system Natural vegetation Vegetation index Expansion of irrigated lands Rainfall distribution Susceptibility to wind erosion Susceptibility to water erosion Desertification Mapping Units(DMUs) 33 Water erosion susceptibility Modeling Slope map Vegetation cover map Soil map Drainage density map Binary information Binary information Binary information Binary information 4 Classes of erosion susceptibility 4 Classes of erosion susceptibility 16 Classes of erosion susceptibility Erosion susceptibility map 34 17
 Approach weighted linear")
 wi = weight of factor i xi = criterion score of")
18 Water erosion susceptibility Map 35 Modeling of land degradation Multi-Criteria Evaluation (MCE) Approach weighted linear combination (WLC) procedure: S = Σ wixi where S = suitability (land degradation type) wi = weight of factor i xi = criterion score of factor i 36 18

19 Multi-Criteria Evaluation (MCE) Step 1: factors identification Factors depend on degradation type Step 2: Standarization of factors Original values were assigned new values which progressively increased from 0 to 255 Step 3: Weighting - A pairwaise comparison matrix weighting procedure - Weights must sum to one - The comparisons concern the relative importance of the two criteria involved in determining suitability - Ratings are provided on a 9-point continuous scale, from extremely less importance (1/9) to extremely more importance (9). Step 4: Applying the model The result map has a range of value from 0-255, increasing with the degradation Step 5: Threshold The result divided into four classes of degradation; slight to very high. 37 Multi-Criteria Evaluation (MCE) 38 19
20 Water erosion modeling Step 1: factors identification for water erosion (WRE): Water erosion susceptibility- WREF1 increasing of abundant farmlands- WREF2 Decreasing in vegetation cover index- WREF3 Where, Water Erosion = Σ Wi WREFi i=1,2,3 Wi : weights to be assigned for water erosion factors 39 Water erosion modeling Continuo Step 2: Standarization of factors values Following standardized factors layers were created: SWREF1- Water erosion susceptibility SWREF2- Increasing of abundant farmlands- SWREF3- Decreasing in vegetation cover index
21 Water erosion modeling Continuo Step 3: Weighting A pairwaise comparison matrix weighting procedure was used to assign for each factor a weight value reflect its importance for land degradation type in equation, as a result: Water erosion susceptibility- W1 = increasing of abundant farmlands- W2 = Decreasing in vegetation cover index- W3 = Water erosion modeling Continuo Step 4: Applying the model The previous process lead to create Water Erosion Map base on the following model: Water erosion = * SWREF * SWREF *SWREF3 The resulting image map has a range of value from 0-255, increasing with the increase of water erosion

22 Water erosion modeling Continuo Step 5: Threshold The result was divided into four classes of degradation; slight, moderate, high and very high. 43 Land degradation Maps Water erosion Wind erosion Vegetation degradation Salinization 44 Copyright Dr. Hussein Harahsheh 22


23 Desertification map The general desertification map, which synthesize all types of land degradation, is achieved through the three next steps: Step1: Soil erosion map Step2: combination of soil erosion with vegetation degradation Step 3: Integration of salinization 45 Desertification Map 46 Copyright Dr. Hussein Harahsheh 23
24 47 Oil Spill Detection and Monitoring 48 Operational Remote Sensing Solutions Navigation Radar monitoring system Satellite Imagery monitoring system Aircraft Photography monitoring system 24


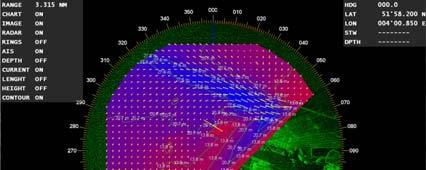
25 Real Time Oil Spill Detection and Monitoring SeaDarq System 50 Principles of Radar Clutter = reflection from waves 25


26 51 Clutter with Oil Spill 52 HH/VV 26


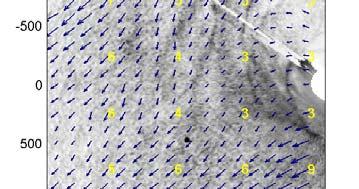
27 53 2 principles of operation Capillary waves Water waves On short pulse 0.5 M high 15 M length 54 2 principles of operation Water waves On short pulse 0.5 M high 15 M length 27


28 55 Functionality Capilar waves only Bottom topography Oil detection Saline/Fresh water interfaces Ship s wake Land/Water borders Small objects detection Bird detection 56 FUNCTIONALITY Water waves In addition of capilar wave functionality,.. MEASUREMENT OF: Wave frequency / length Wave speed Wave direction Wave height * Water depth Current speed vector Small object detection * With calibration 28
29 57 SeaDarQ Functionality Models Oil Spill Detection Hydrographic measurements Small Target Detection 58 Oil Spill Detection Features Detection of floating oil slicks All weather capability * Day and night Spill area determination Prediction of drift Relative layer thickness 29
30 59 Prevents illegal spills 100% chance to be caught Damage control following accidents Fast reaction Early warning system Well planned cleaning strategies Prediction of drift Ships can operate independently of helicopters during cleaning operations 60 OIL SPILL DETECTION RANGE Operational detection range is dependant on: Height of antenna above the water surface Opening angle antenna the longer the better (min 8 feet) Radar transceiver The weather & water condition * Min. wind speed: 2 m/s Accuracy and resolution = radar dependant 30


31 61 Economic model Benefits: Increase number of penalties (illegal spills) Minimise damage and protect fishing grounds, beaches, rocks etc. More oil can be removed from the water, thus reducing costs of cleaning shores Cost of a helicopter 6000 /hour Day and night operation = double useage time Eliminates need for wave buoy/current pole Additional calibration with models Enhanced small target detection 62 Oil Spill Detection (location & current information) 31


32 63 SeaDarQ Radiagreen Radiagreen B O N N E X 64 SeaDarQ radar image Slick with thickness differences Picture and image taken on the same time and place 32


33 65 SeaDarq Detecting Prestige Oil Sludge 66 Margaret wreckage La Spezia DECEMBER


34 67 Inland water Moerdijk 2 * 10 Liter of Radiagreen Land mobile system 68 Inland water Moerdijk VIDEO 34


35 System Process, 69 Raw image Enhanced Image Area Calculation 70 Charts overlay 35


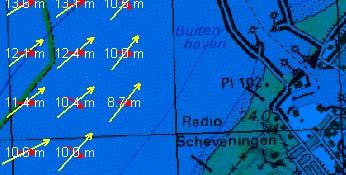
36 71 Hydrography Depth Contours 72 Water depth 36


37 73 Current 74 Bottom, Current & Contour lines 37

38 75 Current Pole measurements versus SeaDarQ results, 200 ns 76 Current Pole measurements versus SeaDarQ results, 50 ns 38
39 77 Correlation coefficient better than ,5 R 2 = 0, ,5 1 0,5 0-1,5-1 -0,5 0 0,5 1 1,5 2-0, ,5-2 mmnd 78 Time lapse Current measurement Video 39


40 79 video Bottom 80 topography Ameland 40


41 81 Sea Bottom Topography: Marsdiep 82 Prediction of drift 41


42 83 Detection of small objects 84 SHIPS /STATIONARY/MOBILE 42


43 UAE 85 Case Study 86 43


44 Dubai coast 87 Range, Dubai Offshore area 88 44


45
 from multiple satellites.")
46 91 Near Real Time Oil spill Monitoring The Challenge Detection of oil spills Rapid report of above-mentioned oil spills through alerting A usable and effective decision support and incident management response solution Our Solution SeaView, a fully managed web based service using space-based Synthetic Aperture Radar (SAR) from multiple satellites. The SeaView solution offers: broad-area based coverage a key advantage of SAR satellite imaging high revisit frequency using multiple satellites zero footprint - user not have to purchase any hardware or software no maintenance - since GST/MDA will be operating the system 24x7 intuitive & easy to use with a user interface built on top of Google Earth technology Additional options that further enhance and extend the oil spill detection capabilities Near Real Time Oil spill Monitoring procedure 92 Oil spill Monitoring Aerial Survey Receiving SAR Satellite data SAR data pre-processing SAR data interpretation Weather and GIS Database (wind ) Produce template map of oil spill Early Warring Alert (internet, phone, ) Customer Site:( decision process, verification, monitoring, combating) 46


47 93 94 Oil Spill Detecting Instrument-SAR SAR imagery is uniquely suited to detect both oil pollution and the ship responsible SAR data has been shown to be capable of detecting oil on the ocean surface in light to moderate sea conditions. The effect of the oil is to reduce backscatter by suppressing surface capillary waves 47


48 95 Detecting Instrument Housing 96 RADARSAT-2 Features & Benefits Powerful range of modes and capabilities Huge imaging capacity Fast tasking timelines Proven C-band performance RADARSAT operational experience and program continuity 48
49 97 SeaView SeaView service is a fully managed web-based service and allows the user to have access to SAR derived oil spill information with no hardware or software installation. Google Earth Navigation Interface Search Window It is intuitive and uses familiar functionality based on Google Earth s Plugin technology. Detailed Information Window Users can view different layers of information including Oil Spills, SAR Ship Detects and Wind Maps (and optionally space-based AIS). They can filter information based on time, on geographic region and on vessel characteristics (if AIS is incorporated). Because SeaView uses Google Earth Plugin, users can zoom and pan to areas of interest quickly and easily 98 SeaView: Architecture 49


50 99 SeaView: Acquisition Planning The ability to see the future acquisition schedule is key to cueing interdiction assets such as Coast Guard vessels or aircraft to deal with oil spills quickly and effectively. As shown in the following figure, the acquisition information is listed in a table format and overlaid on the map display SeaView: Information Layers Supported Various Information Layers: 1. Oil Spill 2. Ship Detects 3. Query past and present oil spills by region and date and to view multiple oil spills within the system. 4. With the AIS option integrated into SeaView, Ship tracks can be viewed in conjunction with ship movement in the region. 5. Wind Maps. Wind vector information derived from the Image displayed as raster 6. Google Earth,.. 50


51 10 1 SeaView: Oil Spill Details Detail zoom with metadata available for each probable oil slick detected on the RADARSAT image When a user queries for oil spill detects, the oil spills can be displayed visually, and also are presented in a table format: SeaView: 10 Oil Spill Information 2 Interpreted RADARSAT image illustrating a detected slick and potential source target Oil spills are highlighted through the icon shown in the figure above, and also can present metadata associated with the oil spill and the polygon outline of the oil spill during the time of detection. 51


52 10 3 Oil Slick Report- metadata Sent to the client in Near Real Time Suspected oil slick complex have been delineated and assigned Unique number that correspond to the oil slick report Example of Dissemination and Fusion of Maritime Situational Awareness Information layer: Oil slicks (detected from SAR imagery) 52


53 10 5 Example: SAR Derived Data Integration 10 6 Information layer: Green: AIS Correlated with vessel detections Red : Vessels not transmitting AIS AIS Vessel Information 53


54 10 7 Wind information Wind speed and direction over the ocean surface can be estimated directly from the same SAR image utilized for oil and ship detection. This rapidly derived information can be used as a key input for weather modeling/forecasting and oil spill trajectory modeling Example: Oil Slick, Gulf of Mexico 54


55 10 9 Example: Oil Slick, Gulf of Mexico 11 0 Example: Oil Slick, Gulf of Mexico 55
56 11 1 Sample Concept Operational scenario CONOPS Acquisition and Detection Viewing and Notification Incident Response Tracing Responsibility (AIS Option) Spill Trajectory Predictions 11 2 Acquisition and Detection 1. Users examine the upcoming acquisition schedule and surveillance area through SeaView. The key to effectively use SAR satellites is to understand when and where data acquisitions will occur. 2. User communicates with the organizations (eg. Coast Guard) with interdiction assets and prepares them to respond if a critical oil spill is detected 3. SAR satellite passes over the region and acquires data 4. GST/MDA receives the SAR data, processes it and then performs oil detection. The results are quality checked to confirm the detection is accurate 56


57 11 3 Example of SAR Acquisition Planning SAR Acquisition are planned to provide the best possible coverage of the area using the available satellites 11 4 SAR Acquisition and Processing Enhanced Service Operations using GST station Two criteria for a satellite based oil Spill monitoring program: The frequency of imaging The latency ( time of information delivery) Sensors: RADARSAT-1 & RADARSAT-2 data Frequency: Minimum time between imaging opportunities: about 12 hours. Average time between imaging opportunities: less than 1.5 days latency : Minimum Latency: less than 2 hours. Average Latency: 2 hours SeaView allows for easy integration of additional data sources 57
58 11 5 Viewing and Notification 1. Oil Spill results are made available on SeaView Service. 2. An oil report is generated and ed to the appropriate end users as an alert. An XML version of the oil report is also generated and made available on MDA s FTP server. 3. The Oil Report indicates certain spills have a high degree of hazard identification. The user visits SeaView and graphically locates the relevant oil spill polygons. He determines that one of the oil spills may indeed require intervention. 4. He starts the a modeling application and ingests the oil detection report XML file generated by SeaView. He uses the model to determine where the oil spill is now and where potentially it will go 11 6 Reporting SeaView will deliver a reporting solution that summarizes the oil spill events: Time of detection Spill coordinates Area of the spill at time of detection Hazard identification Expected level of uncertainty in the detection Two oil spill detection reports are generated: Two oil spill detection reports are generated: a text report meant for users and an XML report. 58


59 11 7 Reporting 11 8 Reporting 59
 to examine the spill and decide on next steps.")
60 11 9 Incident Response 1. The user communicates with the relevant intervention agency (eg. Coast Guard) and informs them where to find the oil spill. 2. The agency dispatches the relevant intervention assets (eg. a vessel) to examine the spill and decide on next steps Tracing Responsibility (AIS) The user visits SeaView and turns on the AIS layer and Oil spill layers. He looks at the historical tracks associated with various vessels, and adjusts the timeline as needed to analyze ship traffic patterns, trying to potentially trace responsibility to a specific vessel. 60
61 12 1 Spill Trajectory Predictions The GST solution supports integration of any spill trajectory prediction solution (model). SeaView can support export of SHP (shape), KML or CSV data which can be ingested by models. In this way, a user can import the parameters of the oil spill detection into the model. The Model would take this information, and combine it with known meteorological data to predict how/where the oil spill will migrate Hussein Harahsheh Global Scan Technologies (LLC) PO P.O. Box1286 Dubai, United Arab Emirates Tel: Fax: hussein@belhasa.ae Web: 61
EMSA s Integrated Maritime Services: Improving Operational Maritime Awareness at EU level
 EMSA s Integrated Maritime Services: Improving Operational Maritime Awareness at EU level Samy Djavidnia 1 Information Services Operational Management European Maritime Safety Agency (EMSA) Abstract Getting
Tactical Collaboration Management System TCMS APTOMAR.COM
 Tactical Collaboration Management System TCMS APTOMAR.COM TCMS AIRBORNE OFFSHORE NEAR SHORE ONSHORE SECurus Radar ROV Aerostat Surveilance Aircraft Satelites TACTICAL COLLABORATION MANAGEMENT SYSTEM Aptomar
eo4all The European EO Services Industry
 eo4all @ESA, Pío XI Glacier, Chile @Benjamin Grant/Google Earth/Digital Globe Man must rise above Earth to the top of the atmosphere & beyond, for only then Industry will he fully understand the world
VTOL UAV for Maritime ISR Role
 VTOL UAV for Page -1 The Maritime Arena Challenge Peace keeping / LIC scenarios: Over the Horizon ISR missions Low risk / LCC operation HIC / War time: Missile Threat - Standoff range Surface Warfare Littoral
07 June 2016 e-geos
 Geospatial Big Data Analytics Heatmap AIS main maritime routes per shiptype 07 June 2016 e-geos2017 www.e-geos.it 1 Enanched Online Analysis & Correlation SEnSE Portal 07 June 2016 e-geos2017 www.e-geos.it
CATCHMENT AREA TREATMENT PLAN
 CATCHMENT AREA TREATMENT PLAN 1 NEED FOR CATCHMENT AREA TREATMENT It is a wellestablished fact that reservoirs formed by dams on rivers are subjected to sedimentation. The process of sedimentation embodies
MARIN Seminar "VTS, een uitdagende toekomst"
 MARIN Seminar "VTS, een uitdagende toekomst" Toekomstige VTS-systemen Dominic Jarvis Sarnia Maritime b.v. Wageningen 23 april 2010 VTS definition a service implemented by a competent authority, designed
Why PORTUS Marine Information System?
 Why PORTUS Marine Information System? HF coastal radars have evolved over the past 40 years into worldwide operational networks that provide real-time data to a variety of end users. Over 450 such radars
DEVELOP National Program
 National Aeronautics and Space Administration NASA Earth Science Division Applied Sciences Program DEVELOP National Program Gulf of Mexico Oil Spill Monitoring Oil Spill and Wetlands Impact Assessment
Oil Spill Management Are you prepared?
 Oil Spill Management Are you prepared? Choosing the right strategy and the right tools An oil spill clean-up is a war An oil spill clean-up is a war involving an enemy of floating hydrocarbons in which
Innovative Geospatial Solutions towards a Sustainable Maritime Trade
 Innovative Geospatial Solutions towards a Sustainable Maritime Trade Celine ROUX, Australia Key words: Cartography, GNSS/GPS, hydrography, positioning, risk management, standards, environment protection,
Dryland Degradation: What Should We Monitor and How? Alan Grainger School of Geography, University of Leeds
 Dryland Degradation: What Should We Monitor and How? Alan Grainger School of Geography, University of Leeds Who Needs Information? Who Needs Information? All the bodies who need information on the drylands
SOLUTION MOTION VIDEO EXPLOITATION
 SOLUTION MOTION VIDEO EXPLOITATION SITUATIONAL AWARENESS IN A DYNAMIC ENVIRONMENT Conditions on the ground can change in an instant, and national security depends on up-to-the minute situational awareness.
Harmful Algal Bloom Use Case. Leveraging the ACT Architecture For Coastal Zone Management
 Applied Coherent Technology, Corp. Harmful Algal Bloom Use Case Leveraging the ACT Architecture For Coastal Zone Management (ACT-REACT TM Workstation and WIPE TM Server) www.actgate.com Table of Contents
GXP Xplorer. Take command of your data universe
 GXP Xplorer Take command of your data universe What is GXP Xplorer? Connect to your geospatial data wherever it is GXP Xplorer is a revolutionary data management application that makes it easy to locate,
Components, sub-components and statistical topics of the FDES 2013
 Environment Statistics Section, United Nations Statistics Division Components, sub-components and statistical topics of the FDES 2013 Component 1: Environmental conditions and quality 6. Environment Protection,
Intelligent Exploitation of the Blue Economy - A Hydrographic Perspective
 Intelligent Exploitation of the Blue Economy - A Hydrographic Perspective Don Ventura Fugro Pelagos, Inc. Meso-American and Caribbean Hydrographic Commission, St. Maarten December 2013 Introduction Blue
PROJECT TITLE: MAPPING POTENTIAL GROUNDWATER AQUIFERS IN NAIROBI COUNTY. Author: Mugo Dixon Mugai. F19/1469/2010. Supervisor: Dr. Ing. F. N Karanja.
 PROJECT TITLE: MAPPING POTENTIAL GROUNDWATER AQUIFERS IN NAIROBI COUNTY Author: Mugo Dixon Mugai. F19/1469/2010. Supervisor: Dr. Ing. F. N Karanja. Introduction Problem Statement Objectives Methodology
Asset Monitoring Intelligence Center (AMIC)
") Global Data Solutions (GDS) PortVision PRESENTATION 360 - Asset TITLE Protection HERE & Asset Monitoring Intelligence Center (AMIC) Association of Petroleum Surveying & Geomatics APSG 38: Fall 2017 Meeting
Global Data Solutions (GDS) PortVision PRESENTATION 360 - Asset TITLE Protection HERE & Asset Monitoring Intelligence Center (AMIC) Association of Petroleum Surveying & Geomatics APSG 38: Fall 2017 Meeting
Module 2 Measurement and Processing of Hydrologic Data
 Module 2 Measurement and Processing of Hydrologic Data 2.1 Introduction 2.1.1 Methods of Collection of Hydrologic Data 2.2 Classification of Hydrologic Data 2.2.1 Time-Oriented Data 2.2.2 Space-Oriented
Performing UAV Mission Planning, Design, & Optimization
 Performing UAV Mission Planning, Design, & Optimization Russ Magazzu UAV Product Manager Pg 1 of 30 Agenda Unmanned aerial systems application areas capabilities STK 8 Aircraft Mission Modeler Pg 2 of
WORK PROGRAMME on CO-OPERATION IN THE FIELD OF CLIMATE CHANGE VULNERABILITY, RISK ASSESSMENT, ADAPTATION AND MITIGATION Between THE MINISTRY OF
 WORK PROGRAMME on CO-OPERATION IN THE FIELD OF CLIMATE CHANGE VULNERABILITY, RISK ASSESSMENT, ADAPTATION AND MITIGATION Between THE MINISTRY OF SCIENCE, TECHNOLOGY AND ENVIRONMENT OF THE REPUBLIC OF CUBA
4/22/2013
 3 rd ARTES Workshop (18 th /19 th April, 2013) Maritime Surveillance Session Next Generation Recognised Maritime Picture Presenter: Paul Kiernan, Skytek www.skytek.com Skytek - Company Profile Skytek is
COPERNICUS MARITIME SURVEILLANCE SERVICE OVERVIEW
 COPERNICUS MARITIME SURVEILLANCE SERVICE OVERVIEW Copernicus Maritime Surveillance Service THE COPERNICUS PROGRAMME Copernicus is a European Union Programme aimed at developing European information services
SAR sensors are imagined oil spill based on Bragg scattering theory. Bragg scattering is a
 We thank the reviewer for the many useful comments. They have been incorporated into the revised draft, and we detail here how we have done so. SAR sensors are imagined oil spill based on Bragg scattering
Harbour Constructions
 Harbour Constructions River and Coastal morphology: They provide morphological services based on one-, two- and threedimensional computer models. These models are used to answer the questions of clients
Challenge to Change. Sandra Wu, Wen-Hsiu. Corporate voyage towards a CCA/CCM-centered business strategy
 Challenge to Change Corporate voyage towards a CCA/CCM-centered business strategy Sandra Wu, Wen-Hsiu Chairperson and CEO, Kokusai Kogyo, Co., Ltd. Director, Japan Asia Group Who we are Kokusai Kogyo is
Maritime Intelligence Risk Suite. Whatever your risk...
 Maritime Intelligence Risk Suite Whatever your risk... Identifying and evaluating maritime risk is a challenging business for marine insurers, finance, ship owners, operators and security agencies. In
POLLUTION RESPONSE SERVICES SUPPORTING POLLUTION RESPONSE FOR CLEANER EUROPEAN SEAS
 European Maritime Safety Agency POLLUTION RESPONSE SERVICES SUPPORTING POLLUTION RESPONSE FOR CLEANER EUROPEAN SEAS EMSA S POLLUTION RESPONSE SERVICES The European Maritime Safety Agency offers a range
Low Cost Aerial Mapping Alternatives for Natural Disasters in the Caribbean
 Low Cost Aerial Mapping Alternatives for Natural Disasters in the Caribbean Raid Al-Tahir, Marcus Arthur, and Dexter Davis The University of the West Indies, Trinidad and Tobago Presentation Outline: The
APTOMAR AS. Fra produktsalg til tjenestesalg, styrets påvirkning for endring av forretningsmodell. 1.November 2016
 Fra produktsalg til tjenestesalg, styrets påvirkning for endring av forretningsmodell 1.November 2016 APTOMAR Company overview ABOUT APTOMAR A leading provider of integrated field monitoring systems for
Maritime Intelligence Risk Suite
 IHS MARITIME & TRADE Maritime Intelligence Risk Suite Whatever your risk... Whatever your risk... Identifying and evaluating maritime risk is a challenging business for marine insurers, finance, ship owners,
3/1/18 USING RADAR FOR WETLAND MAPPING IMPORTANCE OF SOIL MOISTURE TRADITIONAL METHODS TO MEASURE SOIL MOISTURE. Feel method Electrical resistance
 3/1/18 USING RADAR FOR WETLAND MAPPING SOIL MOISTURE AND WETLAND CLASSIFICATION Slides modified from a presentation by Charlotte Gabrielsen for this class. Southeast Arizona: Winter wet period From C.
Questions 3-6 refer to the diagram of surface currents in the oceans. 3. A current responsible for moving heat away from the equator.
 1. Long term differences in which two variables are the primary determinants of climate? (A) Temperature and cloud cover (B) Precipitation and temperature (C) Precipitation and soil type (D) Temperature
...because safety matters. Admiralty Digital Publications
 Admiralty Digital Publications Admiralty Digital Publications What are Admiralty Digital Publications? Admiralty Digital Publications (ADP) are a collection of digital versions of the UKHO s industry leading
REAL-TIME MONITORING AND CONTROL. FleetManager Global maritime fleet tracking and management
 REAL-TIME MONITORING AND CONTROL FleetManager Global maritime fleet tracking and management Introduction REDEFINING SHIP MONITORING Introducing FleetManager, a powerful portal destined to set a new standard
Remote Sensing for Offshore Marine Oil Spill Emergency Management, Security and Pollution Control.
 Remote Sensing for Offshore Marine Oil Spill Emergency Management, Security and Pollution Control. A Presentation White Paper Prepared by Michael D. Long, Business Development for The Americas, Optimare
Taikichiro Mori Memorial Research Grants Graduate Student Researcher Development Grant Report
 Taikichiro Mori Memorial Research Grants Graduate Student Researcher Development Grant Report February 2016 Research Project: Detection and delineation of water bodies using Synthetic Aperture Radar data
Maritime Satellite Security Services
 ARATOS HOMELAND SECURITY Maritime Satellite Security Services Maritime Security Importance Maritime Security becomes more important in the ever-changing global market thus: The protection of Life Ship
USE OF GABIONS IN SMALL HYDRAULIC WORKS
 USE OF GABIONS IN SMALL HYDRAULIC WORKS SECTION 1 SITE SELECTION FOR SMALL DAMS Table of Contents 1.1 CLASSIFICATION ACCORDING TO USE... 2 1.2 CLASSIFICATION BY HYDRAULIC DESIGN (site and basin requirements)...2
Artificial Intelligence applied for electrical grid inspection using drones
 Artificial Intelligence applied for electrical grid inspection using drones 11/08/2018-10.22 am Asset management Grid reliability & efficiency Network management Software Drones are being used for overhead
Design of an open source framework for oil spill decision support system
 Design of an open source framework for oil spill decision support system Oil spill in marine ecosystems have serious short term and long term effects on aquatics lifecycle and on social and economic activities.
Andrew Menton Eric Comerma
 Interspill 2015 Amsterdam, March 2015 Conference Stream: Emerging Technologies and Strategies GIS, Spill Models, and Metocean Data Services Converge to Support the Common Operational Platform Requirements
Lake County Internet-based GIS tools
 Lake County Internet-based GIS tools This document highlights twenty-three Internet-based GIS tools that have been developed to provide information and tools that have greatly enhanced the productivity
POLLUTION RESPONSE SERVICES SUPPORTING POLLUTION RESPONSE FOR CLEANER EUROPEAN SEAS
 European Maritime Safety Agency POLLUTION RESPONSE SERVICES SUPPORTING POLLUTION RESPONSE FOR CLEANER EUROPEAN SEAS EMSA S POLLUTION RESPONSE SERVICES The European Maritime Safety Agency offers a range
Intelligent Exploitation of the Blue Economy - A Hydrographic Perspective
 Intelligent Exploitation of the Blue Economy - A Hydrographic Perspective Don Ventura Fugro Pelagos, Inc. IHO-FIG Blue Economy Seminar, Ocean Business, Southampton, 14 April 2015 Introduction Blue Economy
2.4.0 CLIMATE CHANGE, EXPOSURE & RISK. Contents of Set : Guide 2.4.1: Activity : Activity : Activity 3 IN THIS SET YOU WILL:
 2.4.0 SERIES 2 Understanding Vulnerability & Risk CLIMATE CHANGE, EXPOSURE & RISK Contents of Set 2.4.0: Guide 2.4.1: Activity 1 2.4.2: Activity 2 2.4.3: Activity 3 One component of vulnerability to climate
DAMPAK KEGIATAN MANUSIA TERHADAP KUALITAS LINGKUNGAN
 DAMPAK KEGIATAN MANUSIA TERHADAP KUALITAS LINGKUNGAN IMPACT OF HUMAN ACTIVITIES ON ENVIRONMENTAL QUALITY 1 Since Homo sapiens live on the planet of earth c.a.180,000 years ago, human activities have been
Oil & Gas Industry. Solutions from the space. Satellite applications in support to
 Satellite applications in support to Oil & Gas Industry Solutions from the space RARTEL S.A. 70 Dr. Iacob Felix, 011041, Bucharest, Romania Phone: +4021 3196804 Fax: +40213196806 www.rartel.ro Summary
Geospatial Cloud Analytics: The Confluence of Commercial Space and the Computing Revolution
 Geospatial Cloud Analytics: The Confluence of Commercial Space and the Computing Revolution Dolores Shaffer, Science and Technology Associates for Dr. Joseph B. Evans, Program Manger, DARPA/STO Chesapeake
INTEGRATED MARITIME SERVICES OPERATIONAL AWARENESS ACROSS SECTORS AND SEAS
 INTEGRATED SERVICES OPERATIONAL AWARENESS ACROSS SECTORS AND SEAS A TAILORED APPROACH TO AWARENESS DATA EXCHANGE AND DISTRIBUTION The Integrated Maritime Services platform integrates and combines many
23.7 billion billion CHALLENGES AND OPPORTUNITIES ENHANCING SECURITY AND CONNECTIVITY WITH DIGITAL TRANSFORMATION
 MARITIME DRIVING DIGITAL INNOVATION FOR FUTURE GROWTH Enhancing Security and Connectivity 24 Ang Mo Kio Street 65, Singapore 569061 mktg.elect@stengg.com www.stengg.com CHALLENGES AND OPPORTUNITIES ENHANCING
BAEN 673 / February 18, 2016 Hydrologic Processes
 BAEN 673 / February 18, 2016 Hydrologic Processes Assignment: HW#7 Next class lecture in AEPM 104 Today s topics SWAT exercise #2 The SWAT model review paper Hydrologic processes The Hydrologic Processes
FIG2006 Automated Road Sign Inventory Solution. Presenter: : Claude Laflamme Director of R&D
 FIG2006 Automated Road Sign Inventory Solution Presenter: : Claude Laflamme Director of R&D PRESENTATION OVERVIEW Geo-3D Introduction System components Data Extraction Detection Recognition Results Applications
TRANSFORMATION ON TAP
 WWW.WIPRO.COM TRANSFORMATION ON TAP Situational Intelligence Creating positive customer experiences for water utilities Authors: Vijay Perepa, Rohit Kastuar Table of contents 01 Introduction 01 Collaboration
Status of GSE - GMES Services Element
 Status of GSE - GMES Services Element Luigi Fusco ESA/ESRIN HALO Workshop, ECMWF, 16-17 November 2004 overview Introduction GSE as part of GMES 1. GSE consolidation phase 2. GSE and the Initial Services
e-navigation Development in Russia, industry View
 E-Navigation Underway 2013 Sergey Cherepanov Deputy Managing Director Transas Technologies Ltd. e-navigation Development in Russia, industry View 1. Major navigation activities Major government funded
GUIDE TO THE DEVELOPMENT OF A MINING AND RECLAMATION PLAN IN NEW BRUNSWICK
 PROVINCE OF NEW BRUNSWICK DEPARTMENT OF ENERGY AND RESOURCE DEVELOPMENT Minerals and Petroleum Development Branch GUIDE TO THE DEVELOPMENT OF A MINING AND RECLAMATION PLAN IN NEW BRUNSWICK Guide to the
AN/FSY-3: Space Fence System Overview of User Interface and Conjunction Assessment Study
 AN/FSY-3: Space Fence System Overview of User Interface and Conjunction Assessment Study 2016 Operator s Workshop Denver, CO 4 November 2016 Presenter: Co-Authors: Kameron J. Simon Space Fence Mission
WASA Quiz Review. Chapter 2
 WASA Quiz Review Chapter 2 Question#1 What is surface runoff? part of the water cycle that flows over land as surface water instead of being absorbed into groundwater or evaporating Question #2 What are
GIS APPLICATION IN GROUNDWATER QUALITY ESTIMATION
 GIS APPLICATION IN GROUNDWATER QUALITY ESTIMATION CRP 514 Term Paper Hatim H. Gazaz 5/18/2013 ID #: 200903270 Table of Contents GIS Application in Groundwater Quality Estimation 2013 TABLE OF CONTENTS...
the wheat fields is small, and as for fields of puddling and leveling in winter and other fields in similar, the difference is small. It is conclude t
 OBSERVATION OF JAPANESE PADDY RICE FIELDS USING MULTI TEMPORAL AND POLARIMETRIC PALSAR DATA PI No.365 Naoki ISHITSUKA 1, Genya SAITO 2, Fan YANG 3, Chinatsu YONEZAWA 4 and Shigeo OGAWA 5 1 National Institute
ENTERPRISE DREDGE (edredge): A DREDGING BUSINESS PRACTICE ENTERPRISE GIS APPLICATION
: A DREDGING BUSINESS PRACTICE ENTERPRISE GIS APPLICATION") ENTERPRISE DREDGE (edredge): A DREDGING BUSINESS PRACTICE ENTERPRISE GIS APPLICATION L.S. Lillycrop 1 and R. Dopsovic 2 ABSTRACT Implementation and management of US Army Corps of Engineers (USACE) dredging
ENTERPRISE DREDGE (edredge): A DREDGING BUSINESS PRACTICE ENTERPRISE GIS APPLICATION L.S. Lillycrop 1 and R. Dopsovic 2 ABSTRACT Implementation and management of US Army Corps of Engineers (USACE) dredging
DISASTER MANAGEMENT AND DATA NEEDS IN NIGERIA
 DISASTER MANAGEMENT AND DATA NEEDS IN NIGERIA Nigeria is located between 4 N and 14 N of the equator. The western frontiers runs from 3 E and the eastern reaches nearly 15 E of the meridian. It is bounded
INTRODUCTION TO THE BREAKOUT SESSIONS. ESA-FAO-GWSP Workshop on WEF Rome, Italy March 25, 2014 Richard Lawford Cat Downy, Lucie Pluschke
 INTRODUCTION TO THE BREAKOUT SESSIONS ESA-FAO-GWSP Workshop on WEF Rome, Italy March 25, 2014 Richard Lawford Cat Downy, Lucie Pluschke The Breakout Groups are a critical element in the Workshop structure
Sudan 2013 floods, From satellite images perspective, Case study: Eastern Nile Locality, Khartoum State
 Sudan 2013 floods, From satellite images perspective, Case study: Eastern Nile Locality, Khartoum State Amna A. Hamid, Eltayeb O. Adam and Yahya H. Altayeb Remote Sensing Authority - NCR Khartoum- Sudan
GIS Deployment at DeepWater Horizon. Lessons Learned 2010
 GIS Deployment at DeepWater Horizon Lessons Learned 2010 Primary Workflows Supported by GIS Connecting Individuals, Organizations and Communities Modeling and Analysis Planning Operations Field Data Collection/Damage
MTS Resilience: enavigation Best Practices
 MTS Resilience: enavigation Best Practices Transforming the Marine Transportation System: A Vision for R&D TRB Conference 2C Panel: Safety and Security Bahar Barami, Ph.D. Senior Economist Volpe Center,
COASTAL AREAS & MARITIME APPROACHES: DRUG THREAT/ VULNERABILITY RISK SELF-ASSESSMENT CHECKLIST
 COASTAL AREAS & MARITIME APPROACHES: DRUG THREAT/ VULNERABILITY RISK SELF-ASSESSMENT CHECKLIST COASTAL AREAS & MARITIME APPROACHES: DRUG THREAT/ VULNERABILITY RISK SELF-ASSESSMENT CHECKLIST A. Measures
The Great Lakes. Progress Report
 The Great Lakes Maritime Information Delivery System Progress Report Peter S. Lindquist GLMRI Affiliates Meeting September 28, 2007 INTERMODAL TRANSPORTATION INSTITUTE OVERVIEW Long-term web development
From Applied Research to Application - Remote Sensing Products for Waterway Management
 From Applied Research to Application - Remote Sensing Products for Waterway Management Herbert Brockmann H. Brockmann, PhoWo 2017, Stuttgart 1 Agenda Introduction Relevant products Selected potential applications
For PROPOSED IT PARK. By M/s.Balewadi Tech Park Pvt.Ltd. Submitted to State Environment Expert Appraisal Committee III, Maharashtra
 Draft Terms of References (ToR) (Based on the model TOR given in Environmental Impact Assessment Guidance Manual for building construction projects by MoEF & CC) For PROPOSED IT PARK By M/s.Balewadi Tech
Vessel Traffic Management & Information System. Ultimate extension for perfect coordination
 Vessel Traffic Management & Information System Ultimate extension for perfect coordination Application Vessel Traffic Management & Information System CUSTOMIZED VESSEL DATA WINDOW invtmis serves the needs
BE-AWARE II: Summary Report. Bonn Agreement Accord de Bonn
 Bonn Agreement Accord de Bonn BE-AWARE II: Summary Report DOCUMENT TITLE: Summary report TASK: AUTHOR: Morten Hjorth (COWI), Carsten Jürgensen (COWI), Anders Madsen (COWI), John Mouat (Bonn Agreement Secretariat),
28-30 November 2011, Zagreb, Croatia
 Government Departments and National Authorities that ITALIAN COAST GUARD is in charge to perform activities for: FMC FISHING MONITORING CENTRE MINISTRY OF ENVIRONMENT MINISTRY OF DEFENCE MINISTRY OF INFRASTRUCTURE
A Report on the City of Newport News Existing and Possible Urban Tree Canopy
 A Report on the City of Newport News Existing and Possible Urban Tree Canopy Key Terms UTC: Urban tree canopy (UTC) is the layer of leaves, branches, and stems of trees that cover the ground when viewed
Canadian Coast Guard Services in the Arctic
 Canadian Coast Guard Services in the Arctic Centre for Foreign Policy Studies June 5, 2015 Presented by Daniel Breton Senior Director, World Class Strategies 1 Purpose Discuss CCG s vision for its role
In cooperation with. Eastern Africa Farmers' Federation (EAFF)
") Southern Africa Confederation of Agricultural Unions (SACAU) In cooperation with Eastern Africa Farmers' Federation (EAFF) SACAU/EAFF- response to the Agriculture issues under SBSTA42 In June 2014, SBSTA40
Southern Africa Confederation of Agricultural Unions (SACAU) In cooperation with Eastern Africa Farmers' Federation (EAFF) SACAU/EAFF- response to the Agriculture issues under SBSTA42 In June 2014, SBSTA40
SINCE 1975 VTMIS SOLUTION. vtmis.elmansrl.it
 SINCE 1975 VTMIS SOLUTION vtmis.elmansrl.it The elman VTMIS (VeSSeL TrAffIc MANAgeMeNT ANd INforMATIoN SySTeM) IS AN INTegrATed ANd ScALAbLe SoLuTIoN designed To ensure SAfeTy ANd MANAgeMeNT of VeSSeL
KWAZULU WAZULU-NATAL COASTAL VULNERABILITY INDEX. Summary Guide
 KWAZULU WAZULU-NATAL COASTAL VULNERABILITY INDEX Summary Guide Prepared by the Oceanographic Research Institute (ORI) for the Department of Agriculture and Environmental Affairs (DAEA) BACKGROUND Introduction
What are successful examples of policy interventions that have contributed to addressing environmental and socio-economic root-causes of sand and
 What are successful examples of policy interventions that have contributed to addressing environmental and socio-economic root-causes of sand and dust storms? What are key policy areas and interventions
OPERATIONALISATION OF A MULTI-USER CONCEPT FOR SATELLITE BASED OIL SPILL AND SHIP DETECTION SERVICES
 OPERATIONALISATION OF A MULTI-USER CONCEPT FOR SATELLITE BASED OIL SPILL AND SHIP DETECTION SERVICES Line Steinbakk, Jan Petter Pedersen, Tony Bauna Kongsberg Satellite Services, N-9291 Tromsø, Norway
Site-Specific PM 10 Ambient Air Monitoring Plan
 Site-Specific PM 10 Ambient Air Monitoring Plan Great Plains Sand Processing Facility Wenck File #2771-01 Prepared for: GREAT PLAINS SAND, LLC 15870 Johnson Memorial Drive Jordan, MN 55352 February 2012
Contrail Web Pre-Launch Planning
 Contrail Web Pre-Launch Planning Software Version 6.0.X CORPORATE HEADQUARTERS OneRain Incorporated 1531 Skyway Drive, Unit D Longmont, CO 80504-6270 Revision 2.0 THE SPECIFICATIONS AND INFORMATION REGARDING
Accenture Aerial Monitoring Solution. For Electric Utilities and Oil & Gas companies
 Accenture Aerial Monitoring Solution For Electric Utilities and Oil & Gas companies Accenture Aerial Monitoring Solution for asset intensive companies Companies which have a large asset base and operate
GIS Portal as One Stop Services Tool PERTAMINA HULU MAHAKAM. Presented at Esri Global Petroleum GIS Conference Houston, Texas May 10, 2018
 GIS Portal as One Stop Services Tool Presented at Esri Global Petroleum GIS Conference Houston, Texas May 10, 2018 Novandy Ritung PERTAMINA HULU MAHAKAM Background Pertamina Hulu Mahakam is one subsidiary
Intergraph Mobile GeoSpatial Products. Bradley Skelton
 Intergraph Mobile GeoSpatial Products Bradley Skelton The Mobile Revolution Everyone has a mobile or tablet device People always have their mobile device with them Mobile market growing exponentially People
e-navigation Frequently Asked Questions
 e-navigation Frequently Asked Questions 1. What is e-navigation? e-navigation is an International Maritime Organization (IMO) led concept based on the harmonisation of marine navigation systems and supporting
CoastWatch VTMIS Traffic Management and Information System
 CoastWatch VTMIS Traffic Management and Information System SAAB SYSTEMS Saab can proudly present the CoastWatch VTMIS as an entirely in-house development. In order to achieve the world s best VTMIS solution,
Alternative Futures for the City of La Paz, Mexico
 O N T H E G R O U N D Alternative Futures for the City of La Paz, Mexico Caroline Dragoo University of Arizona and Robert Faris Harvard University La Paz, Mexico is working hard not to turn into Cabo San
IGOL: The Land Theme Integrated Global Observations for Land:
 IGOL: The Land Theme Integrated Global Observations for Land: IGOL Report: Scope Land cover, land cover change, fire Land use, land use change Agricultural production, food security, sustainable agriculture
IRRIS. White Paper GeoDecisions. Your Eye on Military Logistics and Transportation Security
 IRRIS White Paper 10. 21. 2004 GeoDecisions Your Eye on Military Logistics and Transportation Security Table of Contents 1 Introduction... 3 2 History of IRRIS... 4 3 IRRIS Components... 4 3.1 Geospatial
AGM PRESENTATION 12 th July 2017
 AGM PRESENTATION 12 th July 2017 SRT MARINE SYSTEMS PLC www.srt-marine.com SNAP SHOT Multi-billion dollar global addressable market opportunity MDA Established, strategic and defensible market position
Mapping Coastal Great Lakes Wetlands and Adjacent Land use Through Hybrid Optical-Infrared and Radar Image Classification Techniques
 Mapping Coastal Great Lakes Wetlands and Adjacent Land use Through Hybrid Optical-Infrared and Radar Image Classification Techniques Laura L. Bourgeau-Chavez, Kirk Scarbrough, Mary Ellen Miller, Zach Laubach,
e-navigation workshop
 e-navigation workshop EU initiatives related to the integration of the maritime information systems 1 17 and 18 October 2012 Haugesund, Norway Lazaros Aichmalotidis Head of Unit C.2 Vessel traffic and
CGIAR Research Program on Water, Land and Ecosystems: Use of remote sensing and GIS tools in the irrigation commands to assist planning and management
 CGIAR Research Program on Water, Land and Ecosystems: Use of remote sensing and GIS tools in the irrigation commands to assist planning and management Summary Remote sensing (RS) and geographic information
Note that the Server provides ArcGIS9 applications with Spatial Analyst and 3D Analyst extensions and ArcHydro tools.
 Remote Software This document briefly presents the hydrological and hydraulic modeling software available on the University of Nice Server with Remote Desktop Connection. Note that the Server provides
14 Water Resources. Looking for Water... in the Desert. Where Is Our Water? Lesson 1.1 Earth: The Water Planet
 CHAPTER 14 Water Resources Looking for Water... in the Desert The 2300-kilometer Colorado River once flowed deep and wide across the Southwest to Mexico s Gulf of California. Since the Colorado River Compact,
INTRODUCTION cont. INTRODUCTION. What is Impervious Surface? Implication of Impervious Surface
 Mapping Impervious Surface Changes In Watersheds In Part Of South Eastern Region Of Nigeria Using Landsat Data By F. I. Okeke Department of Geoinformatics and Surveying, University of Nigeria, Enugu Campus
Shoreland Rules Revision Project Using GIS in North-Central Minnesota
 Shoreland Rules Revision Project Using GIS in North-Central Minnesota Andrew J. Williquett Department of Resource Analysis, Saint Mary s University of Minnesota, Minneapolis, MN 55404 Keywords: GIS, docks,