CHAPTER 4 LAND USE PATTERNS AND CHANGES THEREIN. Land use means utilization of land in a particular area. Land use
|
|
|
- Willa Gibson
- 6 years ago
- Views:
Transcription
1 CHAPTER 4 LAND USE PATTERNS AND CHANGES THEREIN Land use means utilization of land in a particular area. Land use pattern includes types of land and how much land is being utilized under different uses. Land is basic resource of human society and land use is the surface utilization of all developed and vacant land on specific point at a given time and space. It is a systematic arrangement of various classes of land on the basis of certain similar characteristics mainly to identify and understand their fundamental utility, intelligently and effectively in satisfying the needs of human society (Chowdaiah, 2001). Agriculture land use firstly studies the land under different uses like net sown area, agricultural potential land, fallow land, forest land etc. (Sohal, 1979). Land use is very vital to understand the geographical adjustment of agricultural resources. It is also very important resource for man, so it should be put for right use according to its capability and according to its type. Fertile land should be used for cultivation purposes and infertile land should be used for non-agricultural purposes. Thus, land use classification helps the planner to make rational land use planning, because land resources are the most important national wealth. Land capability depends upon factors such as relief features, climate, Soil, vegetation, socio- economic and institutional factors. Today, the population pressure is increasing at a faster rate so the land is put under cultivation more to fulfill the growing 84
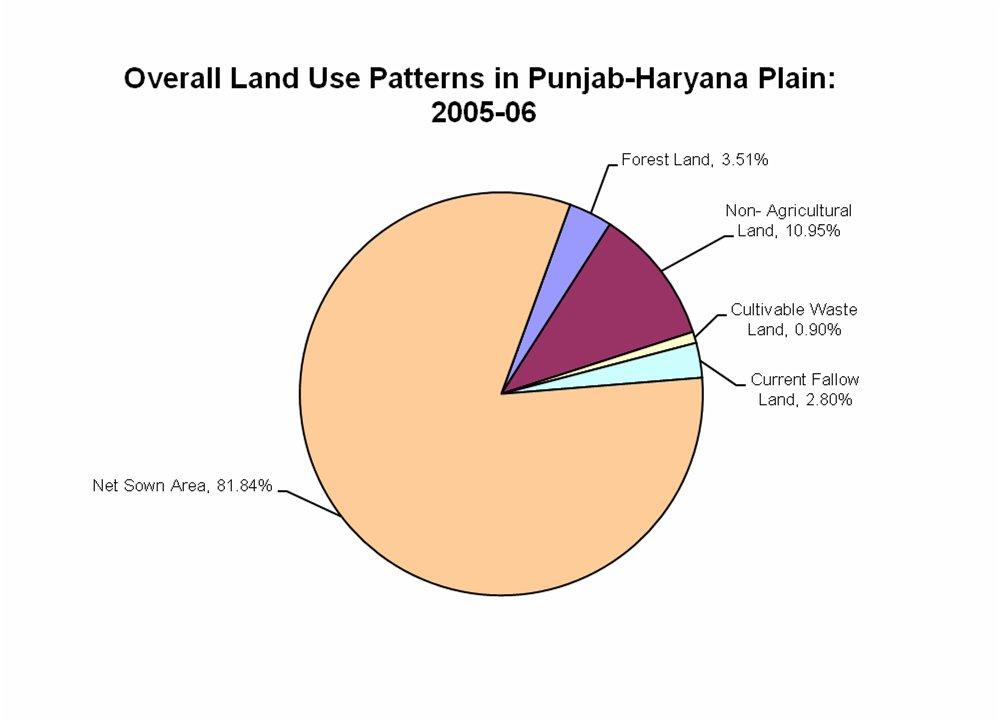
2 demand of food grains. Pawar and Phule (2006) have observed that in view of increasing pressure of population on land and growing demand of food and other materials, the pattern of land utilization has acquired a special significance in developing countries like India, because with increase in population, area under cultural uses also increases and consequently it will lead to decline in cultivated area. Thus, to know the land use patterns in Punjab-Haryana Plains, an attempt is made in this chapter to discuss the land use pattern, and changes within the land use pattern in the study region. Land Use Pattern In overall land use pattern of Punjab Haryana Plains, forest land had occupied 3.51 per cent area, Land not available for cultivation accounted for per cent area, cultivable waste land constituted 0.90 per cent, current fallow land to the tune of 2.80 per cent and net sown area covered per cent area of the total reporting area (Table 4.1 and Fig. 4.1). Table 4.1 Overall Land Use Patterns in Punjab-Haryana Plains: Sr. No. Land Use Per Cent to Total Reporting Area 1. Forest Land Land not Available for Cultivation 3. Cultivable Waste Land Current Fallow Land Net Sown Area Total Reporting Area Source: Statistical Abstract of Punjab, 2006 Forest land (Fig. 4.2) Forest land comprises 3.51 per cent of total reporting area in the study region. It varies from 0.2 per cent in Sirsa district to per cent in 85
3 Fig. 4.1
4 Hoshiarpur district of the study area. The derived results are shown in table 4.2 and fig. 4.2 which portrays the following four categories: 1. Areas of high proportion of forest land (>10 per cent) 2. Areas of moderate proportion of forest land (5-10 per cent) 3. Areas of low proportion of forest land (1-5 per cent) 4. Areas of very low proportion of forest land (<1 per cent) 1. Areas of high proportion of forest land (>10 per cent) This category covers the districts of Hoshiarpur, Nawanshahr, Rupnagar and S.A.S. Nagar. This category is found in a compact belt which runs along the Shiwaliks from north to south direction. These districts are having hills, dissected and undulating topography, and number of seasonal streams (Choes). In these districts, soil erosion occurs during rainy season. Due to all these prevailing physical conditions cultivation of crops is not possible. Thus, most of land is under forests. 2. Areas of moderate proportion of forest land (5-10 per cent) An area of moderate proportion of forest land includes only two districts, namely Yamunanagar and Gurdaspur. In Yamunanagar share of forest land is 8.72 per cent of the total occurrence. The topography of these areas is combination of high and low hills with piedmont plains which is again unfavourable for cultivation of crops. All these reasons are responsible for moderate proportion of forest land. 3. Areas of low proportion of forest land (1-5 per cent) Amritsar, Kapurthala, Jalandhar, Firozpur, Faridkot, Moga, Tarn Taran, Bathinda, Sangrur, Ludhiana, Mansa, Patiala, Fatehgarh Sahib, Panchkula, Kaithal, Panipat, Mahendragarh, Rewari and Gurgaon districts fall in this 86
5 category of the study area. It varies from 3.92 per cent in Patiala district to 1.03 per cent in Mahendragarh district. Most of the districts fall in this category which is Amritsar, Kapurthala, Tarn Taran, Ludhiana, Patiala, Fatehgarh Sahib, Jalandhar, Sangrur and Mansa. These are having flat land, fertile soil and well developed agricultural infrastructure. These are agriculturally developed areas of the study region, therefore, farmers also prefer to grow crop, which leads to low proportion of forest land in these districts. In Panchkula and Gurgaon districts, most of the land is under non-agricultural uses, Mahendragarh and Rewari have mostly sandy soil and patches of rocky surfaces which are responsible for low share of forest land in these districts of the study region. 4. Areas of very low proportion of forest land (<1 per cent) Out of 38, eight districts fall in this category namely, Muktsar, Sirsa, Jind, Ambala, Karnal, Bhiwani, Sonepat and Faridabad. The percentage of forest land is recorded low in these areas i.e. less than 1.00 per cent. Muktsar, Sirsa and Bhiwani are the districts where most of land is put under fodder, oilseeds, cotton and pulses cultivation, because or rugged and sandy topography. On the other hand, in case of Karnal, Sonepat and Jind districts, most of the land is under food grains cultivation. In case of Faridabad and Ambala districts, most of the area is under nonagricultural activities. So, all these reasons are responsible for low share of forest land in this category. 87
6 District Table 4.2 Land Use Patterns in Punjab - Haryana Plains Per Cent to Total Reporting Area Forest Land Land Not available for cultivation Cultivable Waste Land Current Fallow Land Net Sown Area Gurdaspur Amritsar Tarn Taran Kapurthala Jalandhar Nawan Shahr Hoshiarpur Rupnagar S.A.S. Nagar Ludhiana Firozpur Faridkot Muktsar Moga Bathinda Mansa Sangrur Patiala Fatehgarh Sahib Ambala Panchkula Yamunanagar Kurukshetra Kaithal Karnal Panipat Sonipat Rohtak Jhajjar Faridabad Gurgaon Rewari Mahendragarh Bhiwani Jind Hisar Fatehabad Sirsa REGION Source: Statistical Abstracts of Punjab and Haryana,
7 Fig. 4.2 PUNJAB-HARYANA PLAINS Forest Land Per Cent of TRA > > 1 Nil Region's Average = Kms Source: Statistical Abstracts of Punjab and Haryana
8 5. Areas with no forest land This category covers only 5 districts of the study region namely Fatehabad, Hisar, Rohtak, Jhajjar and Kurukshetra. Kurukshetra, Rohtak and Jhajjar are agriculturally sound districts of the study region, so most of the area in these districts is under cultivation. In Fatehabad and Hisar districts, most of the area is under sandy soils. Here, the average annual rainfall is also very low and natural vegetation cover is also thin. All these reasons are responsible for no share of forest land in these five districts of the study region. Land not Available for Cultivation (Fig. 4.3) per cent land is not available for cultivation of the total reporting area of the study region. The proportion varies from 3.59 to per cent in Rohtak and Panchkula districts respectively. Table 4.2 and fig. 4.3 shows its spatial variations through the following categories: 1. Areas with high proportion of land not available for cultivation (>12 per cent) 2. Areas with moderate proportion of land not available for cultivation (8-12 per cent) 3. Areas with low proportion of land not available for cultivation (<8 per cent) 1. Areas with high proportion of land not available for cultivation (>12 per cent) 14 districts namely Kapurthala, Ludhiana, S.A.S. Nagar Rupnagar, Kaithal, Karnal, Panchkula, Yamunanagar, Panipat, Sonipat, Mahendragarh, Rewari, Gurgaon and Faridabad fall under this category. The development of industrial area in Ludhiana, Panchkula, Gurgaon and Faridabad districts leads to high percentage of non-agricultural land. In case of other districts, 89
9 PUNJAB-HARYANA PLAINS Land not Available for Cultivation Fig. 4.3 Per Cent of TRA > < 8 Region's Average = Kms Source: Statistical Abstracts of Punjab and Haryana
10 expansion of settlements and presence of urban centers resulted in high proportion of land not available for cultivation. 2. Areas with moderate proportion of land not available for cultivation (8-12 per cent) This category includes the districts of Gurdaspur, Amritsar, Hoshiarpur, Faridkot, Moga, Bathinda, Sangrur, Patiala, Fatehgarh Sahib, Nawanshahr, Ambala, Kurukshetra, Fatehabad, Hisar and Bhiwani. These are agriculturally developed districts. Here the industrial development is moderate and urban development is also low. Due to all these reasons, share of land not available for cultivation is recorded moderate. 3. Areas with low proportion of land not available for cultivation (<8 per cent) This category of low proportion of land not available for cultivation is lying in rest of the entire study area. Here, the proportion varies from 3.59 per cent in Rohtak district to 7.52 per cent in Jalandhar district. Tarn Taran, Jalandhar, Firozpur, Muktsar, Sirsa, Mansa, Jind, Rohtak and Jhajjar districts form this category. The low proportion of land under non-agricultural use in Tarn Taran, Jalandhar, Firozpur, Mansa, and Muktsar is due to suitable land for agriculture. The land under settlements and industries is also less in these districts. All these reasons are responsible for low share of land not available for cultivation in these districts. Cultivable Waste Land (Fig. 4.4) Area under cultivable waste land is 0.90 per cent of total reporting area. It varies from 0.29 per cent in Hoshiarpur district to 8.38 per cent in Rohtak and Jhajjar districts. It shows that average cultivable waste land is not uniform in the study region. The spatial variations in the study regions are 90
11 Fig. 4.4 PUNJAB-HARYANA PLAINS Cultivable Waste Land Per Cent of TRA > < 0.5 Nil Region's Average = Kms Source: Statistical Abstracts of Punjab and Haryana
12 shown with the help of table 4.2 and fig. 4.4 which depict the following categories: 1. Category of high share of cultivable waste land (>1 per cent) 2. Category of moderate share of cultivable waste land (0.5 to 1 per cent) 3. Category of low share of cultivable waste land (<0.5 per cent) 4. Category of no cultivable waste land 1. Category of high share of cultivable waste land (>1 per cent) Nawanshahr, Rupnagar, Panchkula, Muktsar, Tarn Taran, Jhajjar, Sonepat, Panipat, Karnal and Rohtak districts form this category. The main reasons for high share of cultivable waste land in Nawanshahr, Rupnagar and Panchkula districts are undulating and dissected topography, soil erosion due to seasonal streams (choes), presence of hilly areas etc. Due to all these factors, the share of cultivable waste land is over 1.0 per cent and as a result the proportion of cultivable waste land is high, whereas in case of Jhajjar district, undulating sandy plains and occurrences of sand dunes are responsible for high share of cultivable waste land. 2. Category of moderate share of cultivable waste land (0.5-1 per cent) Only Eight districts namely, Mahendragarh, Rewari, Gurgaon, Faridabad, Kurukshetra, Ambala, Yamunanagar and Gurdaspur fall in this category. Due to the presence of flat terrain and developed agricultural infrastructure, most of the land in these districts is devoted to agricultural uses which minimise the share of cultivable waste land in these districts. 3. Category of low share of cultivable waste land (<0.5 per cent) This category covers small part of the study area. Out of 38 districts, 4 districts fall in this category namely, Hoshiarpur, Sangrur, Patiala and Kaithal. 91
13 Developed irrigation facilities, availability of modern techniques for farming, fertile soil, and flat topography are responsible for low share of cultivable waste land in above mentioned districts of the study region. 4. Category of no cultivable waste land Out of 38 districts, 16 districts are in this category of no cultivable waste land namely, Amritsar, Kapurthala, Jalandhar, S.A.S. Nagar, Ludhiana, Firozpur, Faridkot, Moga, Bathinda, Mansa, Fatehgarh Sahib, Bhiwani, Jind, Hisar, Fatehabad and Sirsa. Most of the above mentioned districts are agriculturally healthy and are having flat land, fertile soils, well developed irrigational facilities, etc. which are the main reasons accounted for no cultivable waste land Current Fallow Land (Fig. 4.5) Current fallow land occupies 2.80 per cent of the total reporting area. Highest percentage of current fallow land is found in Panchkula district (15.79 per cent) and lowest (0.19 per cent) in Firozpur district. Spatial distribution of current fallow land is shown with the help of table 4.2 and fig. 4.5 which depict the following three categories. 1. Area of high share of current fallow land (>5 per cent) 2. Area of moderate share of current fallow land (1-5 per cent) 3. Area of low share of current fallow land (<1 per cent) 4. Area of no share of current fallow land 1. Area of high share of current fallow land (>5 per cent) This category of high share of current fallow land includes the districts of Panchkula, Hisar, Bhiwani, Jhajjar, Gurgaon, Faridabad, Sonipat and Panipat. It varies from per cent in Panchkula district to 5.15 per cent in 92
14 Fig. 4.5 PUNJAB-HARYANA PLAINS Current Fallow Land Per Cent of TRA > < 1 Nil Region's Average = Kms Source: Statistical Abstracts of Punjab and Haryana
15 Bhiwani district. In case of Bhiwani and Jhajjar districts, the main reason is the occurrence of sand dunes, whereas in Sonipat and Panipat flood plains are responsible. But in Gurgaon and Faridabad districts presence of rocky hills and piedmont plains in Panchkula; are the main reasons which account for high share of current fallow land. 2. Area of moderate share of current fallow land (1-5 per cent) Tarn Taran, Amritsar, Rupnagar, Nawanshahr, Moga, Muktsar, Mansa, Patiala, Sirsa, Fatehabad, Karnal, Rohtak, Mahendragarh and Rewari are the districts form this category. Major reason responsible for moderate share of current fallow land are flat topography, developed agricultural infrastructure, fertile soil, irrigational facilities, etc. 3. Areas of low share of current fallow land (<1 per cent) This category exists in Firozpur, S.A.S. Nagar, Ludhiana, Sangrur and Jind districts. In all these districts, topography is flat and suitable for agriculture, so these districts are agriculturally healthy districts. Owing to all these reasons, share of current fallow land is low in these parts of the study area. 4. Areas of no share of current fallow land This category of no share of current fallow land comprises Gurdaspur, Kapurthala, Jalandhar, Hoshiarpur, Faridkot, Bathinda, Fatehgarh Sahib, Ambala, Yamunanagar, Kurukshetra and Kaithal districts. In these districts, no current fallow land is found in , because most of the current fallow is brought under cultivation through reclamation, development of irrigation, high degree of mechanization and introduction of short duration variety of crops. 93
16 Net Sown Area (Fig. 4.6) Net sown area is part of cultivated area which is sown almost once in one agricultural year. In Punjab-Haryana plains per cent of the total reporting area is net sown area. It is recorded maximum (92.51 per cent) in Sirsa district and minimum of (40.35 per cent) in Panchkula district. Existing spatial pattern of net sown area are shown in table 4.2 and fig. 4.6 which highlight the following three categories. 1. Area with high proportion of net sown area (>85 per cent) 2. Area with moderate proportion of net sown area (75-85 per cent) 3. Area with low proportion of net sown area (<75 per cent) 1. Areas with high proportion of net sown area (>85 per cent) This category comprises Tarn Taran, Jalandhar, Faridkot, Firozpur, Moga, Muktsar, Fatehgarh Sahib, Bathinda, Sangrur, Sirsa, Fatehabad, Mansa, Kaithal, Jind, Kurukshetra, Ambala and Rohtak districts. These districts are blessed with flat topography, fertile soils, and developed irrigation facilities. In these districts, farmers are also aware of the use of fertilizers and HYVs of seeds and new techniques of farming. Owing to these reasons, net sown area has recorded high share in these districts of the study region. 2. Areas with moderate proportion of net sown area (75-85 per cent) Eleven Out of 38 districts fall in the category of moderate proportion of net sown area. These are Gurdaspur, Amritsar, Kapurthala, Ludhiana, Patiala, Karnal, Hisar, Bhiwani, Jhajjar, Mahendragarh, and Rewari. In Gurdaspur district, the area under forest land is recorded high because of hilly and undulating topography. Whereas in Kapurthala district land not available for agriculture is recorded high which leads to moderate proportion of net sown 94
17 Fig. 4.6 PUNJAB-HARYANA PLAINS Net Sown Area Per Cent of TRA > < 75 Region's Average = Kms Source: Statistical Abstracts of Punjab and Haryana
18 area. In other districts growth of urban centers, marketing centers, dense settlement, industrialization etc. are the main reasons for moderate share of net sown area. 3. Area with low proportion of net sown area (<75 per cent) Hoshiarpur, Rupnagar, S.A.S. Nagar, Nawanshahr, Panchkula, Yamunanagar, Panipat, Sonipat, Gurgaon and Faridabad districts fall in this category. Main reasons responsible for low share of net sown area in these districts are infertile soils, lack of adequate irrigational facilities, number of urban centers and industrial development. In these districts most of the land is put under non-agricultural purposes and consequently it led to low proportion of net sown area. Conclusion The foregoing discussion reveals that there are great variations in land use patterns of the study region in Among the land use categories, forest land occupies 3.51 per cent area of the total reporting area. The areas with dissected and undulating topography are having high proportion of forest land; on the other hand, areas which are having flat terrain, well developed agricultural infrastructure are agriculturally healthy areas. The land not available for cultivation accounted for per cent area of the total reporting area. The share of land not available for cultivation is high in those areas which are more urbanized and have developed network of roads. Whereas, areas with deprived socio-economic progress are having low share of land not available for cultivation. Share of cultivable waste land is low, which is 0.90 per cent of the total reporting area. Current fallow land covers 2.80 per cent of the total reporting area. Share of fallow land is high along Shiwaliks, where 95
19 sandy soils and physical impediments are more feasible. Share of net sown area is per cent of the total reporting area in the study region. The percentage of this category is recorded high in areas having flat topography, well developed irrigation facilities, etc. On the other hand, the undulating areas, where extensive amount of terrain is not accessible for farming owing to physical restriction has lowest land under net sown area. Changes in Land Use Pattern Change in land use pattern is the outcome of physical and non physical environment. Any change in physical and non physical environment leads to changes in land use pattern, (Riar, 2000). Change in land use pattern provides an index for measuring the stage of agricultural development in an area. Physical parameters, human factors and economic factors are also responsible for land use changes of a particular area. With the increasing pressure of population, the only prospect of increasing food grains production and meeting the needs of food lie in expansion of cultivated area, reduction of fallow land, increase in net sown area and enhancing per unit yield of crops (Sohal, 1979). Population growth and urbanisation are the main instruments of change in land use patterns. Other important factors include improvements in road accessibility, increasing demand for food grains, increasing demand of land for settlement purposes, etc. All these are the key factors responsible for changes in land use pattern in the study region during the to The study region has undergone considerable changes in land use patterns during the research period. The net sown area in the study region has increased from per cent to per cent during to with positive change of 7.58 per cent. It portrays that forest land has increased from
20 per cent in to 3.68 per cent in with positive volume change of 1.78 per cent and it is also noticed that forest land has increased during to i.e. from 1.90 per cent to 3.51 per cent respectively. From to forest land has turn down significantly from 3.68 per cent to 3.51 per cent with a negative volume of change of 0.17 per cent. Land not available for cultivation has declined from per cent in to 9.38 per cent in with negative change of 2.19 per cent. In the same way, land not available for cultivation has lost its area from per cent in to per cent in During land not available for cultivation has increased from 9.37 per cent to per cent area in and registered a positive volume of change of 1.58 per cent. Area under cultivable waste land has declined from 3.90 per cent to 1.16 per cent during to and from 1.16 per cent in to 0.90 per cent in The overall change in cultivable waste land is 3.90 per cent to 0.90 per cent in to with negative volume of change of 2.74 per cent 0.26 per cent and 3 per cent respectively. Current follow land has experienced negative volume of change of 4.42 per cent from to and 3.64 per cent from to and has recorded positive volume of change during to of 0.78 per cent. To make an in-depth study of changes in land use patterns and factors responsible for them during to in the study region, the chapter is further divided into three sections. These are such as: A. Changes in land use patterns: to B. Changes in land use patterns: to C. Changes in land use patterns: to
21 A. Changes in Land Use Patterns: to (Fig. 4.7 and Table 4.3) From to the land use pattern has changed significantly. The forest land has experienced a positive volume of change of 1.78 per cent, land not available for cultivation and the study region during to has experienced 2.19 per cent of negative volume of change category of cultivable waste land has also experienced negative volume of change of 2.74 per cent. A negative volume of change of 4.42 per cent has recorded under category of current fallow land. At the same time there was a significant volume of change of 7.58 per cent has recorded under the category of Net sown area. Table 4.3 Changes in Land Use Patterns in Punjab-Haryana Plains: to Sr. No. Land Use Per Cent 1. Forest Land Land not Available for Cultivation Cultivable Waste Land Current Fallow Land Net Sown Area 7.58 Source: Statistical Abstracts of Punjab and Haryana, 1966 & Forest Land (Fig. 4.8) The study region has experienced positive volume of change of 1.78 per cent from to Spatial distribution of forest land in the study region was not uniform, some areas had recorded positive volume of change and some had experienced negative volume of change. The derived results are shown in fig. 4.8 and table 4.4 which are discussed as follow. 98
22 Fig. 4.7 Changes in Land Use Patterns in Punjab-Haryana Plains: to Forest Land Land not Available for Cultivation Net Sow n Area 7.58 Cultivable Waste Land, Current Fallow Land, -4.42
23 1. Areas with high positive volume of change: (> 1 per cent) This category included Amritsar, Tarn Taran, Hoshiarpur, Rupnagar, Faridkot, S.A.S. Nagar, Ludhiana, Sangrur, Mansa, Kaithal, Karnal, Panipat, Sonipat, Bhiwani, Mahendragarh, Gurgaon and Faridabad districts of the study region. Districts of Hoshiarpur, Rupnagar and S.A.S. Nagar were found in the Shiwalik hills or foothills of Shiwaliks. In these districts, topography was favourable for plantation of trees rather than crop cultivation. Here, the trees were also planted on hills and on slopes to check soil erosion by seasonal streams which resulted in positive volume of change under forest land while in other districts generous boost in forested area from to had been mainly the result of afforestation work by the Forest Department in Punjab-Haryana Plains during the study period resulted in high positive volume of change under forest land. 2. Areas with low positive volume of change (<1 Per cent) Gurdaspur, Kapurthala, Jalandhar, Moga, Muktsar, Bathinda, Nawanshahr, Fatehgarh Sahib, Patiala, Jind, Kurukshetra, Rohtak, Jhajjar and Rewari districts formed this category. In these districts, trees were planted along railways, road sides and canals. Kapurthala, Jalandhar, Fatehgarh Sahib, Patiala, Kurukshetra, Jind and Rohtak districts had fertile alluviums which were more suitable for the cultivation of crops than plantation of trees. Gurdaspur and Nawanshahr districts had found in the foothill zone of Shiwaliks. Here most of the land was not used for crop farming because of water logging and soils erosion, etc. Owing to all these the positive volume of change in forest land was low. 99
24 Table 4.4 Changes in Land Use Patterns in Punjab - Haryana Plains to Per Cent to Total Reporting Area District Forest Land Land Not available for cultivation Cultivable Waste Land Current Fallow Land Net Sown Area Gurdaspur Amritsar Tarn Taran Kapurthala Jalandhar Nawanshahr Hoshiarpur Rupnagar S.A.S. Nagar Ludhiana Firozpur Faridkot Muktsar Moga Bathinda Mansa Sangrur Patiala Fatehgarh Sahib Ambala Panchkula Yamunanagar Kurukshetra Kaithal Karnal Panipat Sonipat Rohtak Jhajjar Faridabad Gurgaon Rewari Mahendragarh Bhiwani Jind Hisar Fatehabad Sirsa REGION Source: Statistical Abstracts of Punjab and Haryana, 1966 and
25 PUNJAB-HARYANA PLAINS Volume of Change in Forest Land to Fig. 4.8 Per Cent + ve - ve > 1 < 1 Region's Average = > 1 < Kms Source: Abstracts of Punjab and Haryana & 1986
26 3. Areas with high negative volume of change (> 1 per cent) This category was found in districts of Panchkula, Ambala and Yamunanagar districts. The forested area in these parts had declined due to the industrialisation, urbanisation and development of transport facilities etc. 4. Areas with low negative volume of change (< 1 per cent) Negative change of less than 1 per cent had recorded in Firozpur, Sirsa, Fatehabad and Hisar districts of the study region. In these districts of the study region, topography was the main reason responsible for low negative volume of change in forest land. In these districts, most of the areas had covered with sandy soil which was not suitable for plantation of trees or even for the cultivation of crops. Here the annual average rainfall was also very low (less than 30 cms), which was again a major reason responsible for low negative volume of change in forest land. Changes in Land Not Available for Cultivation (Fig. 4.9) Area under land not available for cultivation in the study region recorded negative volume of change of 2.19 per cent from to This negative volume of change was basically due to land which was not available for cultivation and declared as forest land in most districts. The spatial variations in the volume of change in area under land not available for cultivation were shown in fig. 4.9 and table 4.4 which contained the following categories. These were: 1. Areas with high negative volume of change (> 5 per cent) This category was found in 2 separate belts. One belt was observed along the Shiwaliks foot hill plains and flood plains of Beas River. The second belt was lying along the Ghaggar flood plains. Hoshiarpur, Kapurthala, 101
27 PUNJAB-HARYANA PLAINS Fig. 4.9 Volume of Change in Land not Available for Cultivation to ve Per Cent - ve > 5 < 5 Region's Average = > Kms Source: Abstracts of Punjab and Haryana & 1986
28 Jalandhar, Nawanshahr, Rupnagar, S.A.S. Nagar, Kurukshetra, Kaithal and Jind were the districts formed in this category. Hoshiarpur, Nawanshahr, Rupnagar and S.A.S. Nagar districts of the study region had hills, undulating and dissected topography, numerous seasonal streams, etc. while Kapurthala and Jalandhar districts were lying in the flood plains of rivers Beas and Satluj. Owing to all these reasons most of the land in these districts was not available for cultivation and was declared as forest land by the Union Ministry of Forest, Agriculture and Environment. Thus, it is the main reason for high negative volume of change of land not available for cultivation in these districts. The second belt comprised Kurukshetra, Kaithal and Jind districts which were also lying in the flood plains of Ghaggar and Nakodar. So, here most of the area was also not available for cultivation and remain barren which was the main reason for high negative volume change of land not available for cultivation. 2. Areas with moderate negative volume of change (1-5 per cent) Moderate negative volume of change in land not available for cultivation was seen in the districts of Gurdaspur, Ludhiana, Karnal, Panipat, Sonipat, Jhajjar and Rewari. In Gurdaspur district, the main reason for moderate negative volume of change of land not available for cultivation was that of which had been brought under afforestation, soil conservation measures and improvement in the methods of farming, etc. While in the districts of Ludhiana, Karnal, Panipat, Sonipat and Jhajjar though most of the waterlogged area had been reclaimed yet little bit still exit. All these reasons were responsible for the negative volume of change of moderate extent in land not available for cultivation. 102
29 3. Category of low negative volume of change (< 1 per cent) This category covered Amritsar, Moga, Muktsar, Sirsa, Sangrur, Bhiwani and Rohtak districts of the study region. In this category, volume of change was recorded less than 1 per cent. Firstly in these districts of the study areas were having flat lands with soil richness developed agricultural infrastructure, irrigational facilities; thus most of the land was under cultivation of different crops etc. secondly most of the districts were lagging behind infrastructure, urban centers and industrial development. As a result, these areas were having low volume of change of land not available for cultivation. 4. Category of high positive volume of change (> 5 per cent) This category was formed around urban centers and cities. It included Gurgaon and Faridabad districts of the study region during to Here increase in rapid industrialization, expansion of residential areas both urban as well as rural; increase in transport facilities, etc. were responsible for high volume of positive change in land not available for cultivation. 5. Category of low positive volume of change (< 5 per cent) This category was found in two different belts. One belt was included foothill zone of Shiwaliks and Ghaggar plains which comprised the districts of Panchkula, Ambala, Yamunanagar, Patiala and Fatehgarh. The districts of Tarn Taran, Firozpur, Faridkot, Bathinda, Mansa, Fatehabad, Hisar and Mahendragarh districts formed the second belt of low positive volume of change in land not available for cultivation. Presence of physical hindrances such as undulating and dissected topography, hilly area and number of 103
30 seasonal streams, in Panchkula, Ambala, Yamunanagar and flood plains of Ghaggar River in Patiala district were the main factors which created problems in socio-economic development. In other districts poor soil productivity, lack of transport facilities, problem of water logging and lack of major towns and urban centers were factors which were responsible for low positive volume of change in land not available for cultivation. Changes in Cultivable Waste Land (Fig. 4.10) Cultivable waste land had experienced negative volume of change in overall land use patterns during to In cultivable waste land occupied 3.90 per cent area and in , its share was 1.16 per cent area of the total reporting area of study region. Thus, 2.74 per cent negative volume of change was recorded during to Developments of agricultural infrastructure, roads, railways, improvement in irrigational facilities were the key factors responsible for negative volume of change in cultivable waste land. To know the spatial variations of change in the extent of cultivable land fig and table 4.4 was mapped which portrait the following four categories. 1. Areas with high negative volume of change (> 5 per cent) This category of high negative volume of change was found in different patches. Six districts namely Amritsar, Tarn Taran, Ludhiana, Kurukshetra, Faridabad and Bhiwani formed this category. In these districts, due to reclamation of waterlogged area was the main cause for bringing more area under crop cultivation which led to high negative volume of change in cultivable waste land in this category. 104
31 to Fig PUNJAB-HARYANA PLAINS Volume of Change in Cultivable Waste Land Per Cent - ve > < 1 No Change Region's Average = Kms Source: Abstracts of Punjab and Haryana & 1986
32 2. Areas with moderate negative volume of change (1-5 per cent) This category of moderate change in cultivable waste land covered large parts of the study area. Gurdaspur, Hoshiarpur, Rupnagar, S.A.S. Nagar, Panchkula, Fatehgarh Sahib, Sangrur, Patiala, Ambala, Yamunanagar, Firozpur, Sirsa, Fatehabad, Kaithal, Karnal, Jind, Hisar, Panipat, Sonepat, Rohtak, Jhajjar and Mahendragarh were included in this category. In most of these districts, unfriendly topography was the main reason for moderate change. For example in some areas, undulating and dissected topography, seasonal streams were still creating problems and in some areas there was presence of sand dunes in the southern parts. Rest of the districts were lying in flood prone areas and were facing the problem of waterlogging. Owing to all these reasons, this category had experienced moderate negative volume of cultivable waste land. 3. Areas with low negative volume of change (< 1 per cent) Low negative volume of change in cultivable waste land had recorded in five districts namely, Kapurthala, Bathinda, Mansa, Rewari and Gurgaon. All these areas had recorded very low percentage of change in cultivable waste land i.e. less than 1 per cent. In these districts, a restricted proportion of land is under cultivation due to different reasons. In Moga, Bathinda, Mansa most of the land was sandy and infertile soil. In Kapurthala topography was the main hindrance because it was lying in the flood plains of Beas River. Lastly in Rewari and Gurgaon most of the area was under Aravalli hills which also had created problems in the way of reclamation of land for farming. Due to the above mentioned reasons low negative volume of change in the cultivable waste land was recorded in this category. 105
33 4. Areas with no change This category included five districts namely Nawanshahr, Jalandhar, Moga, Faridkot and Muktsar. In these districts there was no change in cultivable waste land from to because during this time period, these districts did not register any amount of land under cultivable waste land category. Changes in Current Fallow Land (Fig. 4.11) The reduction in area under current fallow land had been recorded in all the districts of the study area during to Increase in population pressure, development of infrastructure, awakening among the farmers etc. have led to significant decline in current fallow land. But this change is unique in its spatial distribution. These changes are shown in fig and table 4.4 which represent four categories. These are as follow: 1. Areas with high negative volume of change (> 6 per cent) This category of high negative volume of change included eight districts of the study region namely Gurdaspur, Amritsar, Firozpur, Fatehgarh Sahib, Patiala, Sirsa, Fatehabad and Hisar. High negative volume of change in these districts was the result of reclamation work, use of new agricultural technology and government policies. All these factors brought successful results and land under this category had declined during the study period. 2. Area with moderate negative volume of change (3-6 per cent) This category was well scattered in the study area and covered the districts of Tarn Taran, Kapurthala, Jalandhar, Hoshiarpur, S.A.S. Nagar, 106
34 PUNJAB-HARYANA PLAINS Fig Volume of Change in Current Fallow Land to Per Cent - ve > < 3 No Change Region's Average = Kms Source: Abstracts of Punjab and Haryana & 1986
35 Kurukshetra, Rohtak, Jhajjar, Rewari and Faridabad. Here the negative volume of change varied between 5 to 10 per cent. Topographical hindrances in these districts resulted in moderate change of current fallow land during study period. 3. Areas with low volume of negative change (< 3 per cent) This category was spread in the seventeen districts of the study region and included Nawanshahr, Rupnagar, Ludhiana, Bathinda, Sangrur, Mansa, Panchkula, Ambala, Yamunanagar, Kaithal, Jind, Karnal, Panipat, Sonipat, Bhiwani, Mahendragarh and Gurgaon districts. In these areas due to unfavourable socio-economic, physiographic, and climatic reasons uncultivable land could not be put under cultivation, as a result low volume of negative change in current fallow land was recorded in above mentioned districts. 4. Areas with no change Only three districts namely, Moga, Muktsar and Faridkot were included in this category of no current fallow land. During these years, there was no current fallow land in these areas because most of the land in above mentioned districts was under barren land, because the maximum area was covered by infertile sandy soils. Changes in Net Sown Area (Fig. 4.12) Net sown area had changed significantly during to In it was per cent and in it increased to per cent. This had recorded 7.58 per cent positive volume of change. During this period, study region had experienced radical changes in irrigation, agricultural infrastructure, progress in road transport, use of 107
36 Fig PUNJAB-HARYANA PLAINS Volume of Change in Net Sown Area to ve Per Cent - ve > < 5 Region's Average = 7.58 > 1 < Kms Source: Abstracts of Punjab and Haryana & 1986
37 recent farm technology, etc. which had led to changes in net sown area. All these changes are mapped in fig which shows three categories of positive volume of change and one category of negative volume of change (table 4.4). These are as follow: 1. Areas with high positive volume of change (> 10 per cent) Positive volume of change of more than 10 per cent was recorded in Gurdaspur, Amritsar, Firozpur, Sirsa, Kapurthala, S.A.S. Nagar, Fatehgarh Sahib, Patiala, Kurukshetra and Kaithal districts. Gurdaspur and S.A.S. Nagar districts were lying in the piedmont area and also along the rivers Ravi and Satluj respectively. Here, water-logging areas were being reclaimed and brought under net sown area. In other parts, reclamation of cultivable waste land, fallow land and current fallow land led to high positive volume of change in net sown area. 2. Areas of moderate positive volume of change (5 to 10 per cent) This category was found in two different belts. One belt was lying in hilly and piedmont plains with adjoining parts of Beas and Satluj flood plains. Second belt included the areas of Yamuna river's flood plains. Hoshiarpur, Nawanshahr, Rupnagar, Jalandhar, Tarn Taran and Ludhiana are the districts found in the first belt. The second belt covered the districts of Karnal, Panipat, Sonepat, Rohtak, Jhajjar, Hisar, Fatehabad and Rewari. Due to physical barriers all these areas, had moderate volume of increase in net sown area. 3. Areas of low positive volume of change (< 5 per cent) The low category of positive volume of change of less than 5 per cent was recorded in 9 districts namely Moga, Sangrur, Mansa, Jind, Panchkula, 108
38 Ambala, Yamunanagar, Bhiwani and Faridabad. In all these areas, barren land and fallow land were brought under net sown area with improvement in agricultural infrastructure. Due to these reasons, area under net sown area had recorded low positive volume of change. 4. Areas of high negative volume of change (>1 per cent) This category had covered only Gurgaon district of the study region urbanization, Industrilisation, development in urban settlements etc. were the main reasons responsible for high negative volume of change. 5. Areas of low negative volume of change (<1 per cent) This category of negative volume change in net sown area included Faridkot, Muktsar, Bathinda and Mahendragarh districts. Urbanisation and development of infrastructure were the main reasons for negative volume change in net sown area. Conclusion To sum up the changes in land use pattern of Punjab-Haryana plains during to had marked significant changes. The forest land had increased from 1.90 per cent in to 3.68 per cent in with a positive volume of change of 1.78 per cent. At the same time, land not available for cultivation had come down from per cent to 9.37 per cent and showed a negative volume of change of 2.19 per cent. Cultivable waste land had experienced negative volume of change of 2.74 per cent. It had declined from 3.90 per cent in to 1.16 per cent in While current fallow land had also decreased from 6.44 per cent to 2.02 per cent with a negative volume of change of 4.42 per cent. Outstanding improvement in agricultural infrastructure had witnessed positive change of 7.58 per cent 109
39 under net sown area. It had increased from per cent to per cent in the study region during study period. It had shown major shifts in the land use of Punjab-Haryana plains that had been changed, which can be attributed partly to physical and socio-economic factors. It also illustrated that there was a significant fall and down in the land use categories. Forest land and Net sown area had experienced overall positive volume of change under their areas, But in some areas negative changes had also recorded in rest of the categories namely cultivable waste land, current fallow land and land not available cultivation. B. Changes in Land Use Patterns: to From to , study area has experienced so many significant changes in land use patterns. During this time period socioeconomic development plays very important role in bringing changes in land use patterns. During this period, forest land, cultivable waste land and net sown area have recorded negative volume of change while land not available for cultivation and current fallow land have recorded positive volume of change. Table 4.5 Changes in Land Use Patterns in Punjab-Haryana Plains: to Sr. No. Land Use Per Cent 1. Forest Land Land not Available for Cultivation Cultivable Waste Land Current Fallow Land Net Sown Area Source: Statistical Abstracts of Punjab and Haryana, 1986 &
40 Fig Changes in Land Use Patterns in Punjab-Haryana Plains: to Forest Land, Net Sown Area, Land not Available for Cultivation, 1.58 Current Fallow Land, 0.78 Cultivable Waste Land,
41 Changes in Forest Land (Fig. 4.13) Forest land recorded over all negative volume of changes of 0.17 per cent in the study period during study time. But its distribution is not uniform which is shown in fig and table Areas with high positive volume of change (>1 per cent) High increase more than 1 per cent is observed in the districts of Gurdaspur, Hoshiarpur, Nawanshahr, Rupnagar, S.A.S. Nagar, Patiala, Jalandhar and Firozpur. Topography in the districts which are lying in hills (Gurdaspur, Nawanshahr, Hoshiarpur, Rupnagar and S.A.S. Nagar) and foot hills is favourable for forestry. Here government policies also encourage the farmers for the plantation of trees to avoid the soil erosion caused by seasonal streams. In Patiala, Jalandhar and Firozpur districts, most of the land is not used for cultivation due to the problem of water-logging and consequently plantation is done in the flood plains of river Satluj, Ghaggar and Beas. Owing to all these reasons, these districts have experienced high positive volume of change during study time. 2. Areas with low positive volume of change (< 1 per cent) This category covers only four districts of the study region namely Amritsar, Kapurthala, Ludhiana and Bathinda. These areas of the study region have recorded less than 1 per cent of positive volume of change. All these areas have fertile land, flat topography and well developed irrigational facilities. Thus cultivation of crops is more profitable than plantation of trees in this part of the study area. 111
42 Table 4.6 Changes in Land Use Patterns in Punjab - Haryana Plains to Per Cent to Total Reporting Area District Forest Land Land Not available for cultivation Cultivable Waste Land Current Fallow Land Net Sown Area Gurdaspur Amritsar Tarn Taran Kapurthala Jalandhar Nawanshahr Hoshiarpur Rupnagar S.A.S. Nagar Ludhiana Firozpur Faridkot Muktsar Moga Bathinda Mansa Sangrur Patiala Fatehgarh Sahib Ambala Panchkula Yamunanagar Kurukshetra Kaithal Karnal Panipat Sonipat Rohtak Jhajjar Faridabad Gurgaon Rewari Mahendragarh Bhiwani Jind Hisar Fatehabad Sirsa REGION Source: Statistical Abstracts of Punjab and Haryana, 1966 and
CHAPTER 6 DELIMITATION OF CROP DIVERSIFICATION REGIONS AND CHANGES THEREIN. Concept of crop diversification means competition among various
 CHAPTER 6 DELIMITATION OF CROP DIVERSIFICATION REGIONS AND CHANGES THEREIN Concept of crop diversification means competition among various grown crops for space in a given region. It also means raising
National Dairy Development Board. Dairying In. Punjab. A Statistical Profile 2014
 Dairying In National Dairy Development Board Punjab A Statistical Profile 2014 PUNJAB Formation of districts: Census 1991 to 2011 Foreword In this compilation of the statistical profile of the dairy sector
Kharif2014. Report Volume - 1
 Kharif2014 Basmati Acreage & Yield Estimation in Punjab, Haryana, Delhi, Uttarakhand, Himachal Pradesh, Western Uttar Pradesh and Parts of Jammu & Kashmir Report Volume - 1 Submitted to Basmati Export
Received: 2 December Revised: 7 December Accepted: 17 December
 Status of agricultural commercialization in North-Western India Dr. Sanjay Parihar Head, Department of Geography, S.G.G. Govt. College, Banswara Rajasthan Abstract: Today commercialization of agriculture
Growth and Pattern of Fertilizer Consumption in Haryana
 Available online at: http://euroasiapub.org pp. 138~148 Thomson Reuters Researcher ID: L-5236-2015 Growth and Pattern of Fertilizer Consumption in Haryana Dr. Sandeep Kumar 1, Lecturer Economics, dept.
Satellite Based Basmati Crop Acreage and Yield Estimation for Kharif Season-2013
 Satellite Based Basmati Crop Acreage and Yield Estimation for Kharif Season-2013 (Final Report Volume IV, 15 th November 2013) Submitted to: Basmati Export Development Foundation Agricultural and Processed
Basmati Acreage & Yield Estimation in Punjab, Haryana, Delhi, Uttarakhand, Himachal Pradesh, Western Uttar Pradesh and Parts of Jammu & Kashmir
 Kharif 2018 REPORT - 2 September 18th, 2018 Basmati Acreage & Yield Estimation in Punjab, Haryana, Delhi, Uttarakhand, Himachal Pradesh, Western Uttar Pradesh and Parts of Jammu & Kashmir Basmati Export
Development of Irrigation and Its Impact on Agriculture in Punjab: to
 IOSR Journal of Agriculture and Veterinary Science (IOSR-JAVS) e-issn: 2319-2380, p-issn: 2319-2372. Volume 10, Issue 6 Ver. II (June. 2017), PP 57-63 www.iosrjournals.org Development of Irrigation and
Productivity Zoning of Indian Mustard (Brassica spp.) in Haryana State by Climatic and Physical Factors
 in Haryana State by Climatic and Physical Factors") Available online at www.ijpab.com Anurag et al Int. J. Pure App. Biosci. 5 (5): 1075-1079 (2017) ISSN: 2320 7051 DOI: http://dx.doi.org/10.18782/2320-7051.5194 ISSN: 2320 7051 Int. J. Pure App. Biosci.
Available online at www.ijpab.com Anurag et al Int. J. Pure App. Biosci. 5 (5): 1075-1079 (2017) ISSN: 2320 7051 DOI: http://dx.doi.org/10.18782/2320-7051.5194 ISSN: 2320 7051 Int. J. Pure App. Biosci.
Drinking Water in Rural Haryana: Trends and Pattern
 [VOLUME 4 I ISSUE 3 I JULY SEPT. 2017] e ISSN 2348 1269, Print ISSN 2349-5138 http://ijrar.com/ Cosmos Impact Factor 4.236 Introduction Drinking Water in Rural Haryana: Trends and Pattern Kuldeep Singh
International Journal of Enhanced Research in
 Economic benefits and ecological cost of Green Revolution: A case study of Haryana, India Vinod Kumar Research Scholar, Dept. of Geography, Maharishi Dayanand University, Rohtak, Haryana Abstract: The
State government initiatives to control depleting groundwater level
 State government initiatives to control depleting groundwater level Shailender Singh Project Officer, Department of Revenue and Disaster management Government of Haryana. Received: May 19, 2018 Accepted:
Growth and Instability in Agricultural Production in Haryana: A District level Analysis
 International Journal of Scientific and Research Publications, Volume 4, Issue 7, July 2014 1 Growth and in Agricultural Production in Haryana: A District level Analysis Rakesh Sihmar Research Scholar
Regional Disparity in Cropping Intensity and Relative Impact of Irrigation in Haryana
 IOSR Journal of Business and Management (IOSR-JBM) e-issn: 2278-487X, p-issn: 2319-7668. Volume 18, Issue 9.Ver. III (September. 2016), PP 41-45 www.iosrjournals.org Regional Disparity in Cropping Intensity
POST HARVEST SURVEYS OF WHEAT GRAINS FOR THE PRESENGE OF.KARNAl- BUNT AND BLACK POINT DISEASES IN DIFFERENT AGROCLIMATIC ZONES OF INDIA
 IndianJ. Agric. Res., 37 (4): 264-268,2003 POST HARVEST SURVEYS OF WHEAT GRAINS FOR THE PRESENGE OF.KARNAl- BUNT AND BLACK POINT DISEASES IN DIFFERENT AGROCLIMATIC ZONES OF INDIA D.P. Singh, L.B. Goel,
Subject: Submission of manuscript for publication in Punjab Geographer.
 Dr. H.S. Mangat, Editor Punjab Geographer 3037, Urban Estate, Phase-II, Patiala Date:-------------------- Subject: Submission of manuscript for publication in Punjab Geographer. Respected Sir, I / We are
Kharif Report Volume - 7
 Kharif- 2016 Basmati Acreage & Yield Estimation in Punjab, Haryana, Delhi, Uttarakhand, Himachal Pradesh, Western Uttar Pradesh and Parts of Jammu & Kashmir Report Volume - 7 Submitted to Basmati Export
India is the largest user of groundwater for irrigation in the world. The
 Sheetal Sekhri University of Virginia Sustaining Groundwater: Role of Policy Reforms in Promoting Conservation in India* ABSTRACT Groundwater depletion has become an increasingly important policy concern
Gross Addition to Working Age Population-Supply (Lakhs) Gross Addition to Labour Force Supply (Lakhs)
 Gross Addition to Labour Force Supply (Lakhs)") 1. Executive Summary National Skill Development Corporation (NSDC) had mandated KPMG Advisory Services Pvt Ltd to undertake a District-level Skill Gap Study of the state of Punjab, involving various Departments
1. Executive Summary National Skill Development Corporation (NSDC) had mandated KPMG Advisory Services Pvt Ltd to undertake a District-level Skill Gap Study of the state of Punjab, involving various Departments
Risk in Punjab Agriculture: Current Status and Emerging Issues
 Risk in Punjab Agriculture: Current Status and Emerging Issues RS Sidhu and Kamal Vatta Department of Economics and Sociology, PAU, Ludhiana-141 004 Introduction Despite having less than 2 percent of the
AGRICULTURAL PRODUCTIVITY
 CHAPTER VI AGRICULTURAL PRODUCTIVITY 6.1 Introduction 6.2 Enyedi s Productivity Index 6.3 Productivity of Jowar 6.4 Productivity of Wheat 6.5 Productivity of Bajara 6.6 Productivity of Sugarcane 6.7 Quantitative
Agricultural Productivity of the Baramati Tahsil, Pune District (Maharashtra).
.") IOSR Journal of Agriculture and Veterinary Science (IOSR-JAVS) e-issn: 2319-2380, p-issn: 2319-2372. Volume 7, Issue 5 Ver. II (May. 2014), PP 25-30 Agricultural of the Baramati Tahsil, Pune District (Maharashtra).
IOSR Journal of Agriculture and Veterinary Science (IOSR-JAVS) e-issn: 2319-2380, p-issn: 2319-2372. Volume 7, Issue 5 Ver. II (May. 2014), PP 25-30 Agricultural of the Baramati Tahsil, Pune District (Maharashtra).
ESTIMATES OF CHANGES IN AGRICULTURAL RETURNS DUE TO CROPPING PATTERN CHANGES IN PUNJAB: THROUGH
 Bangladesh J. Agric. Econs. XVIII, 1(1995) : 21-30 ESTIMATES OF CHANGES IN AGRICULTURAL RETURNS DUE TO CROPPING PATTERN CHANGES IN PUNJAB: 1965-70 THROUGH 1988-93. Anju Sharma K.S. Dhindsa ABSTRACT In
Indian National Carbon Project SDG goal 13
 "...the "environment" is where we live; and "development" is what we all do in attempting to improve our lot within that abode. The two are inseparable. Our common future Indian National Carbon Project
Introduction, Major types of crops- Food crops and Cash crops, their distribution of as influenced by terrain.
 Introduction, Major types of crops- Food crops and Cash crops, their distribution of as influenced by terrain. AGRICULTURAL LAND USE Agriculture forms an important item in the economy of the study area
Variorum, Multi- Disciplinary e-research Journal Vol.-01, Issue-IV, May 2011
 1 Change in General Land Use Pattern in Raigarh District: A Geographical Analysis Mr. Deepak. S. Narkhede: Head, Dept. of Geography, C.K. Thakur College, New Panvel, Dist. Raigarh Dr. Sameer A. Butala:
Sustaining Groundwater: Role of Policy Reforms in Promoting Conservation in India
 Sustaining Groundwater: Role of Policy Reforms in Promoting Conservation in India Sheetal Sekhri University of Virginia July 17-18, 2012 India International Centre New Delhi National Council of Applied
Drivers of Agricultural Diversification in India, Haryana, and the Greenbelt Farms of India
 From the SelectedWorks of amarnath tripathi Fall December, 2009 Drivers of Agricultural Diversification in India, Haryana, and the Greenbelt Farms of India amarnath tripathi Brajesh Jha Available at: https://works.bepress.com/amarnath_tripathi/6/
Status, Quality and Management of Groundwater in India
 International Journal of Information and Computation Technology. ISSN 0974-2239 Volume 3, Number 7 (2013), pp. 717-722 International Research Publications House http://www. irphouse.com /ijict.htm Status,
Performance of Agriculture and Allied Sectors in Haryana
 Performance of Agriculture and Allied Sectors in Haryana Prof Arti Sharma S.D.College, Ambala. Mb:8950050777 Email: artisharma1109@gmail.com Abstract Agriculture occupies an important place in the development
CASE STUDY OF SAMPLE VILLAGES
 Chapter VIII CASE STUDY OF SAMPLE VILLAGES 8.1 INTRODUCTION 8.2 REASONING FOR SAMPLING OF VILLAGES 8.3 KOLVE 8.4 KHARSAI 8.5 VARSE 8.6 SHRIGAON 8.7 WAVE DIWALI 8.8 SHILOSHI 8.9 KADAV 8.10 TUPGAON 8.11
Process and Pattern of Marginalization of Gram Cultivation in Haryana: A Spatio-temporal Analysis
 Trans.Inst.Indian Geographers ISSN 0970-9851 Process and Pattern of Marginalization of Gram Cultivation in Haryana: A Spatio-temporal Analysis Ankita and M S Jaglan; Kurukshetra, Haryana Abstract The present
WHEAT YIELD AS INFLUENCED BY MOISTURE CONSERVATION PRACTICE THROUGH PLOUGHING AND PLANKING AFTER MAIZE HARVEST UNDER RAINFED CONDITIONS
 International Journal of Science, Environment and Technology, Vol. 2, No 2, 2013, 176-184 WHEAT YIELD AS INFLUENCED BY MOISTURE CONSERVATION PRACTICE THROUGH PLOUGHING AND PLANKING AFTER MAIZE HARVEST
JOURNAL OF INTERNATIONAL ACADEMIC RESEARCH FOR MULTIDISCIPLINARY Impact Factor 4.483, ISSN: , Volume 5, Issue 12, January 2018
 AGRICULTURAL LAND USE AND MORPHOMETRIC ANALYSIS OF NANGAVALLI SUB-WATERSHED, NANGAVALLI AND TOPPAIODAI(NTSW), MATTURTALUK, SALEM DISTRICT M.BALAMURUGAN* DR.A.ILANTHIRAYAN** * Research Scholar, External
Implications of Dynamics of Land Use Shifts in Rajasthan
 Annals of Arid Zone 53(3&4): 177-183, 2014 Implications of Dynamics of Land Use Shifts in Rajasthan Latika Sharma Rajasthan College of Agriculture, MPUAT, Udaipur 313 001, India Abstract: Land use pattern
Assessment of Pre and Post Harvest Losses in Wheat and Paddy Crops in Punjab
 AERC STUDY No. 31 Assessment of Pre and Post Harvest Losses in Wheat and Paddy Crops in Punjab D.K.Grover J.M.Singh Parminder Singh Agro-Economic Research Centre Department of Economics and Sociology Punjab
Critical Analysis of Land Use Planning along Kundli Manesar Palwal Expressway
 Critical Analysis of Land Use Planning along Kundli Manesar Palwal Expressway Ar. Manoj Panwar Assistant Professor, Faculty of Architecture, Urban and Town Planning, DCR University of Science & Technology,
ANIMAL HUSBANDRY & DAIRYING DEPARTMENT
 GOVERNMENT OF HARYANA ANIMAL HUSBANDRY & DAIRYING DEPARTMENT Integrated Sample Survey Report for Estimation of Major Livestock Products Milk, Eggs, Wool & Meat for the year 2015-16 Issued by STATISTICAL
Selection of Candidate Plus Trees of commercially important agro forestry species in Punjab
 Selection of Candidate Plus Trees of commercially important agro forestry species in Punjab Suresh Chauhan 1, Mohit Gera 2 1. Introduction Low productivity of forest and considerable land use change from
Agriculture landuse A case study of district Kathua.
 Journal of Biosphere, 2(1): 38-43, 2013 ISSN 2278 3342 Agriculture landuse A case study of district Kathua. Amrik Singh and Rajdeep Kour Abstract: Agriculture is one of the crucial sectors of Indian economy.
A Study on the Extent of Adoption of Various Recommended Technologies in Wheat Cultivation in Punjab
 Agricultural Economics Research Review Vol. 22 (Conference Number) 2009 pp 349-354 A Study on the Extent of Adoption of Various Recommended Technologies in Wheat Cultivation in Punjab Mandeep Singh and
Study of Cropping Pattern, Crop Ranking and Crop Combination in Somb River Basin at Lower Shiwalik Hills
 Cloud Publications International Journal of Advanced Remote Sensing and GIS 2017, Volume 6, Issue 1, pp. 2297-2305 ISSN 2320 0243, Crossref: 10.23953/cloud.ijarsg.295 Research Article Study of ping Pattern,
Creation of a Web GIS of Rural drinking water sources in Punjab using FOSS tools
 Creation of a Web GIS of Rural drinking water sources in Punjab using FOSS tools P.K. Litoria, Harpinder Singh, Pradeep Jangra, Brijendra Pateriya Punjab remote Sensing Centre P.A.U. Campus Ludhiana, Punjab,
CHAPTER - IV GROWTH OF AREA, PRODUCTION AND YIELD OF FRUITS AND VEGETABLES IN PUNJAB STATE AND IN PATIALA DISTRICT
 CHAPTER - IV GROWTH OF AREA, PRODUCTION AND YIELD OF FRUITS AND VEGETABLES IN PUNJAB STATE AND IN PATIALA DISTRICT The horticultural crops e.g. fruits and vegetables play an important role in human nutrition
CROPPING SYSTEM ANALYSIS USING REMOTE SENSING AND GIS: A BLOCK LEVEL STUDY OF KURUKSHETRA DISTRICT
 CROPPING SYSTEM ANALYSIS USING REMOTE SENSING AND GIS: A BLOCK LEVEL STUDY OF KURUKSHETRA DISTRICT M. P. Sharma 1, Manoj Yadav 1, R. Prawasi 1, Pavan Kumar 2 and R. S. Hooda 1 1 Haryana Space Applications
Changing agricultural land use patterns, Punjab (India)
") University of Montana ScholarWorks at University of Montana Graduate Student Theses, Dissertations, & Professional Papers Graduate School 1994 Changing agricultural land use patterns, Punjab (India) Rinu
University of Montana ScholarWorks at University of Montana Graduate Student Theses, Dissertations, & Professional Papers Graduate School 1994 Changing agricultural land use patterns, Punjab (India) Rinu
WATER LOGGING AND ITS EFFECT ON CROPPING PATTERN AND CROP PRODUCTIVITY IN SOUTH-WEST PUNJAB : A CASE STUDY OF MUKTSAR DISTRICT
 Journal of Economic & Social Development, Vol - IX, No. 1, 2013 WATER LOGGING AND ITS EFFECT ON CROPPING PATTERN AND CROP PRODUCTIVITY IN SOUTH-WEST PUNJAB : A CASE STUDY OF MUKTSAR DISTRICT *Sukhdeo Singh
Economic Analysis of Tube well driven Sprinkler irrigation and Furrow irrigation for Agriculture in Haryana, India
 Economic Analysis of Tube well driven Sprinkler irrigation and Furrow irrigation for Agriculture in Haryana, India LUHACH, M.S.*, MALIK, D.P.** AND PURAN MAL INTRODUCTION Water is the most precious natural
STATE BUDGETARY RESOURCES AND AGRICULTURE DEVELOPMENT IN HARYANA
 Research Study No. 2008/02 STATE BUDGETARY RESOURCES AND AGRICULTURE DEVELOPMENT IN HARYANA USHA TUTEJA AGRICULTURAL ECONOMICS RESEARCH CENTRE UNIVERSITY OF DELHI DELHI DECEMBER 2008 P R E F A C E Budgetary
Compendium of financing options for the food processing sector
 Investment Environment & Opportunities in Food Processing Punjab Compendium of financing options for the food processing sector Knowledge Partner Ministry of Food Processing Industries Government of India
Chapter- IV General and Agricultural Land Use in Thane District
 Chapter IV General and Agricultural Land Use in Thane District 4.1 Introduction 4.2 Concept of General land use 4.3 Classification of land use 4.4 Tahsil wise trends in general land use pattern in Thane
Impact of climate change on potato productivity in Punjab a simulation study
 Impact of climate change on potato productivity in Punjab a simulation study V. K. Dua*, B. P. Singh, P. M. Govindakrishnan, Sushil Kumar and S. S. Lal Central Potato Research Institute, Shimla 171 001,
Chapter 1 Problem of Residue Management Due to Rice Wheat Crop Rotation in Punjab
 Chapter 1 Problem of Residue Management Due to Rice Wheat Crop Rotation in Punjab Abstract Punjab agriculture supported by input and output price structure and superior yields of rice and wheat compared
THE CONCEPT OF ORGANIC FARMING:
 INTRODUCTION : Agriculture is one of the oldest and most fundamental primary occupation of all human beings since stone age. It is a foundation of all social Cultural and Economical condition of mankind.
Food Security in India: A Case Study of Kandi Region of Punjab
 Food Security in India: A Case Study of Kandi Region of Punjab Savita Ahlawat and Dhian Kaur Abstract Banishing hunger from the face of earth has been frequently expressed in various international, national
Testing of Bio-efficacy of Granular and Liquid formulations of Humic Acid in Rice
 Report on the Project Testing of Bio-efficacy of Granular and Liquid formulations of Humic Acid in Rice Kharif 2006 Principal Investigator : Dr. Dalel Singh, Sr.Scientist (Soils) Co-Investigator : Dr.
IMPACT OF NEEM-COATED UREA ON PRODUCTION, PRODUCTIVITY AND SOIL HEALTH IN PUNJAB D K GROVER J M SINGH SANJAY KUMAR JASDEV SINGH
 AERC STUDY No. 39 IMPACT OF NEEM-COATED UREA ON PRODUCTION, PRODUCTIVITY AND SOIL HEALTH IN PUNJAB D K GROVER J M SINGH SANJAY KUMAR JASDEV SINGH Study sponsored by Ministry of Agriculture and Farmers
Very slight to negligible limitations no special land management practices required.
 Land Capability Classes Land and Soil Capability Class 1 Class 1 Definition Very slight to negligible limitations no special land management practices required. On-site impact of land management practices
Rem()te Sensing and GIS Tedudques in Agricultural Development - A Case Study ()f Punjab
te Sensing and GIS Tedudques in Agricultural Development - A Case Study ()f Punjab") Jour. Agric. Physics, Vol. 3, No. I & 2, pp. 174-181 (2()03) Rem()te Sensing and GIS Tedudques in Agricultural Development - A Case Study ()f Punjab P K SHARMA AND ANIL SOOD Punjab Remote Sensing Centre,
Jour. Agric. Physics, Vol. 3, No. I & 2, pp. 174-181 (2()03) Rem()te Sensing and GIS Tedudques in Agricultural Development - A Case Study ()f Punjab P K SHARMA AND ANIL SOOD Punjab Remote Sensing Centre,
International Journal of Advance ISSN and Applied Research (IJAAR)
") International Journal of Advance ISSN 2347-7075 and Applied Research (IJAAR) Vol. 1 No.3 Peer Reviewed Bi-Monthly Jan Feb 2014 CHANGING CROPPING PATTERN IN PANCHAGANGA BASIN, MAHARASHTRA: A GEOGRAPHICAL
International Journal of Advance ISSN 2347-7075 and Applied Research (IJAAR) Vol. 1 No.3 Peer Reviewed Bi-Monthly Jan Feb 2014 CHANGING CROPPING PATTERN IN PANCHAGANGA BASIN, MAHARASHTRA: A GEOGRAPHICAL
CHAPTER - VIII SAMPLE SURVEY MICRO LEVEL CASE STUDIES This chapter is devoted to study the sample villages at micro level selected from each of the
 CHAPTER - VIII SAMPLE SURVEY MICRO LEVEL CASE STUDIES This chapter is devoted to study the sample villages at micro level selected from each of the crop combination zone. This helps to evaluate the interactions
STATE DISASTER MANAGEMENT PLAN PUNJAB
 STATE DISASTER MANAGEMENT PLAN PUNJAB DEPARTMENT OF REVENUE, REHABILITATION AND DISASTER MANAGEMENT GOVERNMENT OF PUNJAB Draft Punjab State Disaster Management Plan 1 FOREWARD Different parts of Punjab
Centers for International Projects Trust
 Centers for International Projects Trust Providing solutions for sustainability 1 2 The (CIPT) is the India Offi ce of the Columbia Water Center. Established in 2008 as a not-for-profi t trust, the purpose
A Balance Sheet of Performance of Large dams in India The case of irrigation and flood control
 1 A Balance Sheet of Performance of Large dams in India The case of irrigation and flood control Over the last 51 years of water resources development in Independent India, the nation has spent over Rs.
Dynamics of Land Use Competition in India: Perceptions and Realities. Vijay Paul Sharma
 INDIAN INSTITUTE OF MANAGEMENT AHMEDABAD INDIA Dynamics of Land Use Competition in India: Perceptions and Realities Vijay Paul Sharma W.P. No. 2015-06-02 June 2015 The main objective of the working paper
Changing Pattern of Area, Production and Productivity of Principal Crops in Haryana, India
 Int.J.Curr.Microbiol.App.Sci () (): - International Journal of Current Microbiology and Applied Sciences ISSN: - Volume Number () pp. - Journal homepage: http://www.ijcmas.com Original Research Article
Special Seminar on Food Security: Focusing on Water management and Sustainable Agriculture
 Special Seminar on Food Security: Focusing on Water management and Sustainable Agriculture Kyi Myint Ministry of Agriculture and Irrigation Location Latitude 9 58-28 31 N Longitude 92 9-100 10 E Country
Land Use pattern and Prospects of Paschim Medinipur District, West Bengal
 Land Use pattern and Prospects of Paschim Medinipur District, West Bengal Asit Kumar Jana Govt. Approved Part-Time Teacher Department of Geography Garhbeta College, West Bengal Email: asitgeo31@gmail.com
Factors Influencing Economic Viability of Marginal and Small Farmers in Punjab 1
 Agricultural Economics Research Review Vol. 22 July-December 2009 pp 269-279 Factors Influencing Economic Viability of Marginal and Small Farmers in Punjab 1 Mandeep Singh*, A.S. Bhullar and A.S. Joshi
Agro-Economic Research Centre Department of Economics and Sociology Punjab Agricultural University Ludhiana
 AERC STUDY No. 35 RELATIONSHIP BETWEEN WHOLESALE PRICES, RETAIL PRICES, EXPORT PRICES (FOB), PRICES REALIZED BY FARMERS AND DETAILS OF CONTRIBUTING FACTORS FOR THE PRICE DIFFERENCE FOR BASMATI RICE IN
Change in Land Use and Cropping Pattern in Assam: An Economic Analysis
 Economic Affairs, Vol. 63, No. 1, pp. 39-43, March 2018 DOI: 10.30954/0424-2513.2018.00150.5 2018 New Delhi Publishers. All rights reserved Change in and Use and Cropping Pattern in Assam: An Economic
ASSESSMENT OF GROUNDWATER RESOURCES AND QUALITY IN BIST DOAB REGION, PUNJAB, INDIA
 ASSESSMENT OF GROUNDWATER RESOURCES AND QUALITY IN BIST DOAB REGION, PUNJAB, INDIA Anju Pant, M S Rao, Y S Rawat, P Purushothaman & Gopal Krishan Hydrological Investigation Division, National Institute
Impact of national food security mission-pulses on legumes production performance in Punjab, India
 Legume Research, 38 (5) 2015: 609-615 Print ISSN:0250-5371 / Online ISSN:0976-0571 AGRICULTURAL RESEARCH COMMUNICATION CENTRE www.arccjournals.com/www.legumeresearch.in Impact of national food security
An Application of GIS for Mapping of Flood Hazard and Risk Area in Nakorn Sri Thammarat Province, South of Thailand
 An Application of GIS for Mapping of Flood Hazard and Risk Area in Nakorn Sri Thammarat Province, South of Thailand P. Pramojanee*, C. Tanavud** C. Yongchalermchai** C.Navanugraha*** 1. Abstract * Walailak
Scope and Prospects of Agricultural Production in Kolhapur District of Maharashtra, India
 International Journal of Current Microbiology and Applied Sciences ISSN: 2319-7706 Volume 6 Number 11 (2017) pp. 2478-2485 Journal homepage: http://www.ijcmas.com Original Research Article https://doi.org/10.20546/ijcmas.2017.611.291
MAPPING OF TREE OUTSIDE FOREST IN KALESAR BLOCK (YAMUNANAGAR DISTRICT, HARYANA) USING GEO-INFORMATICS TECHNIQUES
 USING GEO-INFORMATICS TECHNIQUES") International Journal of Science, Environment and Technology, Vol. 3, No 5, 2014, 1835 1842 ISSN 2278-3687 (O) MAPPING OF TREE OUTSIDE FOREST IN KALESAR BLOCK (YAMUNANAGAR DISTRICT, HARYANA) USING GEO-INFORMATICS
International Journal of Science, Environment and Technology, Vol. 3, No 5, 2014, 1835 1842 ISSN 2278-3687 (O) MAPPING OF TREE OUTSIDE FOREST IN KALESAR BLOCK (YAMUNANAGAR DISTRICT, HARYANA) USING GEO-INFORMATICS
Growth of Non-Agricultural Uses on Arable Land in Punjab (India): A Case Study from the Jalandhar District
: A Case Study from the Jalandhar District") International Journal of Research in Social Sciences Vol. 8 Issue 11, November 2018, ISSN: 2249-2496 Impact Factor: 7.081 Journal Homepage: Double-Blind Peer Reviewed Refereed Open Access International
International Journal of Research in Social Sciences Vol. 8 Issue 11, November 2018, ISSN: 2249-2496 Impact Factor: 7.081 Journal Homepage: Double-Blind Peer Reviewed Refereed Open Access International
Paper: 12, BUSINESS ENVIRONMENT Module: 18, Dependence of New Agriculture Strategy on Business
 Paper: 12, BUSINESS ENVIRONMENT Module: 18, Dependence of New Agriculture Strategy on Business Principal Co-Principal Investigator Paper Coordinator Content Prof. S P Bansal Vice Chancellor Maharaja Agrasen
REMOTE SENSING AND GIS FOR INTEGRATED LAND MANAGEMENT: CASE OF INDIA
 REMOTE SENSING AND GIS FOR INTEGRATED LAND MANAGEMENT: CASE OF INDIA R.B.Singh and Dilip Kumar Department of Geography Delhi School of Economics University of Delhi Delhi-110007, India E-mail:rbsgeo@hotmail.com
WATER AWARENESS PROGRAM (WAP) FOR FARMERS (Moga, Punjab)
 FOR FARMERS (Moga, Punjab)") WATER AWARENESS PROGRAM (WAP) FOR FARMERS (Moga, Punjab) Understand Conserve Protect Nestlé India OBJECTIVE OF THIS PROGRAM This program has been specially designed by Nestlé to create awareness amongst
WATER AWARENESS PROGRAM (WAP) FOR FARMERS (Moga, Punjab) Understand Conserve Protect Nestlé India OBJECTIVE OF THIS PROGRAM This program has been specially designed by Nestlé to create awareness amongst
Soil and Water Conservation/ Watershed Management
 Vandna B.Tech., 6 th Semester Department of Civil Engineering JNGEC Sundernagar, Mandi (H.P.) 175018 ABSTRACT The watershed is a geographical area through which water flows in the form of streams, rivers,
Research Methodology
 CHAPTER III Research Methodology In the present study, an attempt has been made to study the role of women in agriculture sector of Punjab. This study was based on the primary data collected from women
A Study of Agricultural Zoning of Huang-Huai-Hai Plain Based on GIS 1
 A Study of Agricultural Zoning of Huang-Huai-Hai Plain Based on GIS 1 Manping Hou 1, Jinmin Hao 2, Ying Shi 3, Jun Yang 4, Qian Wen 5, Mingzhu Cha 3, Lingkun Xiong 4 ( 1 China Institute of Defense Science
(60:40) NATIONAL RURAL LIVELIHOODS MISSION. NRLM Mission. NRLM Guiding Principles. NRLM Values
 NATIONAL RURAL LIVELIHOODS MISSION. NRLM Mission. NRLM Guiding Principles. NRLM Values") NATIONAL RURAL LIVELIHOODS MISSION (60:40) Aajeevika - National Rural Livelihoods Mission (NRLM) was launched by the Ministry of Rural Development (MoRD), Government of India in June 2011. The Mission
NATIONAL RURAL LIVELIHOODS MISSION (60:40) Aajeevika - National Rural Livelihoods Mission (NRLM) was launched by the Ministry of Rural Development (MoRD), Government of India in June 2011. The Mission
CHAPTER - 1 INTRODUCTION
 CHAPTER - 1 INTRODUCTION 1.1 THE ORIGIN OF THE SYSTEM : THE RIVER Jamuna rises in the Tehri Region ; 12.5 km west of the lofty Bander Punch mountain. It flows past the sacred shrine of Jamnotri and winds
GCSE Geography Revision Booklet Levelled questions
 NAME: GCSE Geography Revision Booklet Levelled questions Advice Pages 1-2 Unit 1 Tectonic hazards Page 3 Weather hazards & climate change Page 4 Ecosystems & tropical rainforests Page 5 Hot environments
Impacts of climate change on agriculture productivity: A case study of Haryana
 ISSN: 2455-4197 Impact Factor: RJIF 5.22 www.academicsjournal.com Volume 2; Issue 5; September 2017; Page No. 252-257 Impacts of climate change on agriculture productivity: A case study of Haryana 1 Surender
Livelihood Problems of Small and Marginal Farm Families in Rural Areas of Haryana State, India
 International Journal of Current Microbiology and Applied Sciences ISSN: 2319-7706 Volume 7 Number 01 (2018) Journal homepage: http://www.ijcmas.com Original Research Article https://doi.org/10.20546/ijcmas.2018.701.197
COUNTRY REPORT ENVIRONMENTAL IMPACT ASSESSMENT MAY 02 TO JUNE 02 YEAR 2000
 Page 1 of 8 KINGDOM OF CAMBODIA NATION RELIGION KING COUNTRY REPORT ON ENVIRONMENTAL IMPACT ASSESSMENT ON MAY 02 TO JUNE 02 YEAR 2000 Prepared by Srun Im Ministry of Environment # 48, Samdech Preah Sihanouk,
CONCEPT OF SUSTAINABLE AGRICULTURE
 CONCEPT OF SUSTAINABLE AGRICULTURE Agriculture is the process of producing food, feed, fibre and other desired products by cultivation of certain plants and raising of domesticated animals. Agriculture
International Journal of Advance Engineering and Research Development
 Scientific Journal of Impact Factor (SJIF): 4.72 International Journal of Advance Engineering and Research Development Volume 4, Issue 10, October -2017 e-issn (O): 2348-4470 p-issn (P): 2348-6406 Perspective
LIST OF COMPANIES REGISTERED (280)
") LIST OF COMPANIES REGISTERED (280) 1. M/s.Kamboj Export Indri, karnal 2. Advance Hydrau-tech., New Delhi 3. M/s. J.K. Agri Genetics Ltd. 4. M/s. Pacific Seeds 5. M/s. Shiv Ganga Hybrid Seeds 6. DKS Incorporate,
LIST OF COMPANIES REGISTERED (280) 1. M/s.Kamboj Export Indri, karnal 2. Advance Hydrau-tech., New Delhi 3. M/s. J.K. Agri Genetics Ltd. 4. M/s. Pacific Seeds 5. M/s. Shiv Ganga Hybrid Seeds 6. DKS Incorporate,
Major Crop Combination Regions in Jammu Province: A Spatio-Temporal Analysis
 Major Crop Combination Regions in Jammu Province: A Spatio-Temporal Analysis Nisha Lecturer, Department of Geography, G.G.M. Science College, University of Jammu, Jammu, India ABSTRACT: Agriculture occupies
Pre-Feasibility Report
 Pre-Feasibility Report NAME OF THE PROJECT- Construction of New Four-lane National Highway (NH-152D) from Gangheri to Narnaul in the state of Haryana. SUBMITTED BY National Highways Authority of India
Supplementary Report
 Supplementary Report To be included in District Model Land Use Plans By Bimal Kumar Sponsored By State Land Use Board, Uttar Pradesh Department of Planning, Government of U. P. Yojana Bhawan, Lucknow 226
Temporal Land Use and Cropping Pattern in Amravati District of Maharashtra State
 Temporal Land Use and Cropping Pattern in Amravati District of Maharashtra State National Academy of Agricultural Science (NAAS) Rating : 3. 03 Serials Publications Temporal Land Use and Cropping Pattern
AGRICULTURAL PRODUCTIVITY
 Chapter Four AGRICULTURAL PRODUCTIVITY 4.1 Introduction 4.2 Inputs Used 4.3 Methodology 4.4 Bhatia s Method 4.5 Crop Productivity And Changes 4.5.1 Jowar 4.5.2 Whet 4.5.3 Rice 4.5.4 Sugarcane 4.5.5 Groundnut
POPULATION PRESSURE AND RESPONSES IN RELATION TO AGRICULTURAL POTENTIALS: A STUDY IN ALMORA DISTRICT. Estelar THESIS. Submitted by
 POPULATION PRESSURE AND RESPONSES IN RELATION TO AGRICULTURAL POTENTIALS: A STUDY IN ALMORA DISTRICT THESIS Submitted to KUMAON UNIVERSITY, NAINITAL For the Degree of DOCTOR OF PHILOSOPHY In GEOGRAPHY
A Study of Temporal Changes in Land Use and Cropping Pattern in Jammu district of J&K State
 2014 Renu Publishers. All rights reserved 2 Renu Publishers A Study of Temporal Changes in Land Use and Cropping Pattern in Jammu district of J&K State Sudhakar Dwivedi, Pawan Kumar Sharma and Harminder
Agrobiodiversity potential of Nagaland state, Northeastern India
 Indian Journal of Traditional Knowledge Vol. 9 (2), April 2010, pp. 350-354 Agrobiodiversity potential of Nagaland state, Northeastern India SC Tiwari 1*, Supong Sashi 2 & Lalit Acharya 2 Department of