Agri-Environmental statistics and indicators within FAOSTAT
|
|
|
- Phoebe Holland
- 6 years ago
- Views:
Transcription
1 Agri-Environmental statistics and indicators within FAOSTAT Robert Mayo UNECE/FAO/Eurostat Workshop on Environment Statistics (Budva, Montenegro, May 2013)
2 FAOSTAT ( Data for: Agricultural production; Forestry; Fisheries; Land use; Fertilizers, pesticides, water, etc; Emissions agriculture and Land use;
3 FAOSTAT World s central repository of national agricultural statistics data and key in: The development of environmental indicators; Assessing environmental costs and benefits; National accounts: with respect to environmental expenditures, environmental taxes and subsidies; Production and trade in environmental goods and services and hazardous substances, and resource productivity.
4 Characteristics of Agri-Environmental data Problems of scale: environmental phenomena are site specific; statistics at the country level may be not very significant in some cases (e.g. big countries like Russia, with a variety of landscapes). Different data sources: questionnaires, surveys, remote sensing, modeling, field measurements. Different data types: statistical data, geo-referenced maps, etc.
5 Agri-Environmental data Data source Pros Cons Issues Examples Questionnaires Official data Limited coverage; Different compilers. Methodologies, reliability FAOSTAT Surveys Standard methodologies Different compilers, Big projects: updates quite rare GLASOD Remote sensing Continuous monitoring, Standard methodologies, Global coverage at the pixel scale. Indirect measurements (inverse problem) Methodologies, Spatial resolution issues, Quality assessment Vegetation monitoring, LC maps. Modelling Standard methodologies, Global coverage at the pixel scale (if spatial modelling) Dependence on model limitations Model reliability Input data quality ( garbage in, garbage out ) GAEZ land suitability, GLADIS Measurements Direct measurements, Input for geostatistical processing. Quality assessment, Not uniform, coverage, Point measurements.,vary ing reliability Meteo data from stations (CLIMPAG)


6 Agri-Environmental data types Tables Generally data at country level Usually from questionnaires Geo-referenced datasets Varying spatial resolutions Vector or raster formats Possible extraction of statistics according to different subdivisions
7 Agri-Environmental databases at FAO Thematic Thematic area area Database Database Examples Examples of data of data Climate Climate Water Water Land Land &Water &Water CLIMPAG/ FAOCLIM-Net AQUASTAT Land Land and and Water Water Digital Digital Media Media Series Series Precipitation, ET, ET, Temperature, Vap.Pressure, Vap.Pressure, Wind Wind speed Average precip., precip., Tot.Renew.Water Tot.Renew.Water Res., Res., Agr.withdrawals. Global Global map map of of Irrigated Irrigated Areas, Areas, Soil Soil and and Terrain Terrain Database Database for for Southern Southern Africa, Africa, Digital Digital Soil Soil Map Map of of the the World World and and derived derived soil soil properites properites Production, harvested area, Yield for different crops Agriculture Agro-MAPS Production, ( ). harvested Large data area, gaps. Yield for different crops Agriculture Agro-MAPS ( ). Large data gaps. Length of growing period (LGP) zones of the world, Environment, land FGGD (Food Insecurity, Poverty and Environment, land Length Coefficient of growing of variation period (CV) (LGP) of length zones of growing the world, period productivity, population. Environment FGGD (FoodGlobal Insecurity, GIS Database) Poverty and productivity, Coefficient (LGP), of variation (CV) of length of growing Environment Global GIS Database) Environment, population. period Global (LGP), Change In Net Primary Productivity (1981- GEONETWORK Catalogue population. 2003); Global map of irrigated areas Environment, Global Change In Net Primary Productivity (1981- Livestock GEONETWORK Catalogue population. GLW (Gridded Livestock of the World) 2003); Livestock Global density, map of Livestock irrigated production areas systems Statistics on: production, trade, prices, land, forestry, Agricultural statistics FAOSTAT Livestock GLW (Gridded Livestock of the World) Livestock population, density, fertilizers, Livestock pesticides. production systems Forested areas, characteristics, policy, trends, Forests FRA (Forest resource assessment) Statistics management. on: production, trade, prices, land, Agricultural statistics FAOSTAT forestry, population, fertilizers, pesticides. FI Stat Statistics on : fish production, trade, fleet Fishery Forested areas, characteristics, policy, trends, Forests FIRMS FRA (Forest (Fishery resource Resources assessment) Monitoring Status and trends of fishery resources, characteristics System) management. of resources and fisheries, management measures

 maintained through massive artificial inputs")
8 Agri-Environmental characteristics Natural ecosystems: Natural fluxes, high biodiversity, highly differentiated productivity. Controlled natural ecosystems Fisheries and forestry: Human intervention on natural fluxes via harvest control and enhancement (planting, stocking, fertilization, engineering, pest/predator control), med biodiversity, med productivity. Agroecosystems: low biodiversity and high productivity (only for the selected species) maintained through massive artificial inputs (fertilizers, work, pesticides).
9 Linking Policy and Environment External Factors Food demand Preference, Trade, Technology Market Responses Prices-inputs,crops- Organizational set-up AGRICULTURAL POLICY Land Use and Management 1.Land use choices 2. Crop Choice 3. Management practices (fertilizers, pesticides, rotations) Environmental Outcomes Degradation of ecosystem functions - productivity, diversity, Natural resource status Fish & Forest Management 1. Harvest control 2. Enhancement (stocking, plantation, pest control, engineering) Urbanization Pollution, Wastages, Degradation of natural ecosystems ECONOMIC POLICY Natural Factors Climate change, Productivities, Natural hazards, Biosecurity
10 Agri-environmental Indicators An agri-environmental indicator is a summary measure, combining raw data, used to describe the state of the environment, a risk to the environment, a change in the environment, or a driving force behind such a change, that can be attributed wholly or in part to an agricultural activity or activities. from OECD 2000

11 Statistics Agri-environmental Indicators: Policy relevance Example: European directives requiring Agri-Environmental Indicators. Eurostat 2011 Policy relevance: need to monitor the impacts of agriculture on the environment and the environmental performance of the agricultural sector.
12 Agri-environmental Indicators International activities on Agri-environmental indicators in the last 15 years Institution Area N. of indicators First set Latest set References OECD OECD countries Environmental performance of Agric. At a glance Eurostat/EE A/JRC EU EEA Environmental indicators: typology and overview. European Commission Communication from the Commission.
13 FAOSTAT Agri-Env Indicators Dataset developed following as much as possible the EUROSTAT and OECD frameworks. At the moment 25 indicators are available, plus a complete new domain on Greenhouse Gases (GHG) Emissions. Data are from FAO databases and from external sources (e.g. IEA, IFOAM).
14 FAO collaboration and international methodology UN/UNECE, World Bank, OECD, EUROSTAT and other agencies in carrying on this work; Framework of the Development of Environment Statistics(FDES); System of National Accounts (SNA); The Central Framework for System of Environmental-Economic Accounting (SEEA).
15 FAOSTAT Agri-Env Indicators Domain Subdomain Indicator title Indicator definition Responses Land N Fertilizers consumption/arable land&permanent Crops Environmental Commitments Protected area as % on total area Organic Agriculture Organic Agriculture (% of total agricultural land) Fertilizers Mineral Fertilizers Consumption P Fertilizers consumption/arable land&permanent Crops N+P (total nutrients) consumption/arable land&permanent Crops Pesticides Pesticide Consumption Pesticide use by Ha Arable land&permanent Crops Area equipped for irrigation Area equipped for irrigation/arable Land and Permanent Crops Energy Energy use Share of agricultural energy consumption on the total energy consumption Agricultural land use change Agricultural land use change compared to the previous year Share agricultural land Agricultural Area/Land Area Driving Forces Land Share Perm.Crops on AgrLand Cropping patterns Share Perm.Pasture on AgrLand Share arable land on AgrLand Conservation agriculture Conservation agriculture area as % of cultivated area Livestock Livestock patterns Cattle, Pigs, Sheep, Poultry total density Pigs share on total livestock Cattle share on total livestock Poultry share on total livestock Sheep share on total livestock Air & Climate Change Ammonia emissions Share of agricultural ammonia emissions on total ammonia emissions Water Water use in Agriculture Agricultural water withdrawal as % of total water withdrawal Pressures Soil Soil Erosion Average Soil Erosion Average Soil Degradation Energy Bioenergy Share of bioenergy on total renewable energy production State Soil Soil Quality Average carbon content in the Topsoil

16 FAOSTAT Agri-Env Indicators

17 FAOSTAT Agri-Env Indicators
18 FAOSTAT Agri-Env Indicators


19 FAOSTAT GHG emissions database
20 Some Domains within FAOSTAT
21 Fertilizers use issues Run off the land due to heavy rainfall/erosion; Leaching into groundwater; Escape in the form of gas into atmosphere.

22
23
24 Statistics Fertilizers consumption: patterns per region FERTILIZER CONSUMPTION TO ARABLE LAND RATIO 1980/ / kh/ha World Developed Economies in transition Developing Latin Am & the Caribb. Near East & North Africa Sub-Saharan Africa E. Asia, South E. Asia & China South Asia Africa Latin America Caribbean Asia Oceania Australia and New Zeal.

25 FAOSTAT: Pesticides page
26 Pesticides use issues Overuse and abuse of pesticides at many places E.g.: cotton, vegetables, rice; Highly toxic products: Some countries are lagging behind in phasing out high incidence of accidental and self poisoning; Food safety and other public health risks (residues); Environmental risks ; Market access Pesticide residue requirements are increasingly important in trade; Pesticide quality (Illegal trade in pesticides; counterfeit products; some countries lack sufficient quality control); Obligations under international instruments.
27 Pesticides consumption (hundreds of tonnes, 2008)
28 Indicator: Pesticides average usage (tonnes /Ha agricultural area, 2008 ) As seen in the previous slide, China is the biggest consumer of pesticides. However, to evaluate the environmental impact it is important to consider the actual average usage (an AgriEnv Indicator).


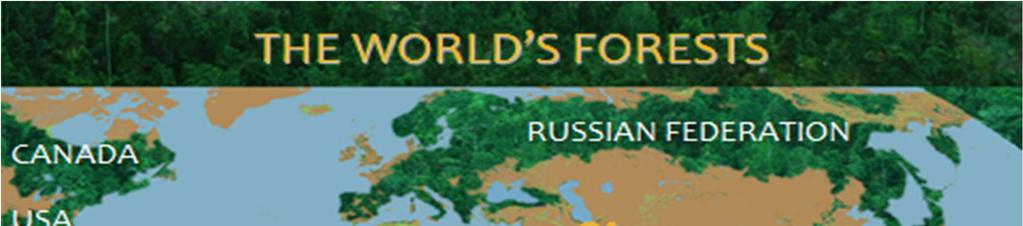
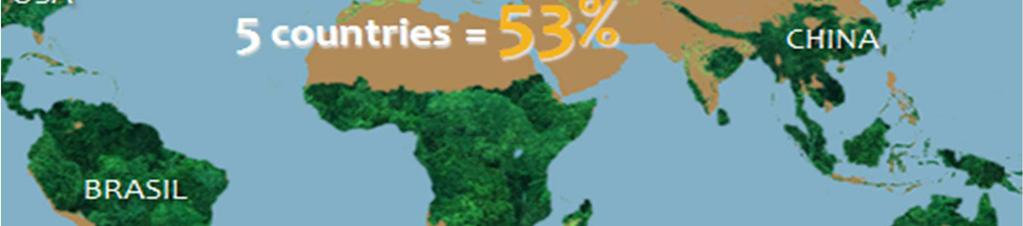
29 The world s forests 31% OF TOTAL LAND AREA 4,000,000,000 ha

30
31 Net change = Σ(gain) - Σ(loss) : -8.3 million ha/year : -5.2 million ha/year


32


33 Capture Fisheries and aquaculture production in the world
34 Statistics Status of world marine stocks % Non-fully exploited Fully exploited Overexploited

35 Statistics Agri-Environmental statistics at FAO: the ESS website
36 Further information and acknowledgements Further information available at: FAO Statistics : FAOSTAT : Land, Fertilizers and Pesticides: FAOSTAT : Emissions - Agriculture: Acknowledgements: The input of Dominic Ballayan, Giorgia De Santis and Simona Mosco is very much appreciated in preparing this presentation.
Session 4: Agri-Environmental statistics and indicators within FAOSTAT
 Session 4: Agri-Environmental statistics and indicators within FAOSTAT Workshop on Environment Statistics (Yaounde, Cameroon, 5-9 December 2011) Characteristics of Agri-Environmental data Problems of scale:
Environment related constraints to productivity growth
 AGRI-ENVIRONMENT STATISTICS AND INDICATORS: CURRENT STATUS AND FUTURE DIRECTIONS Expert Group Meeting on Strategies for Improving Environment Statistics in Asia and the Pacific Bangkok, 2-4 December 2013
FAO-OEA/CIE-IICA WORKING GROUP ON AGRICULTURAL AND LIVESTOCK STATISTICS FOR LATIN AMERICA AND THE CARIBBEAN
 June 2013 ESS/ALSLAC/ E FAO-OEA/CIE-IICA WORKING GROUP ON AGRICULTURAL AND LIVESTOCK STATISTICS FOR LATIN AMERICA AND THE CARIBBEAN Twenty-sixth Session Port of Spain, Trinidad and Tobago, 5-7 June 2013
Asia and Pacific Commission on Agricultural Statistics
 January 2014 APCAS/14/12.4 E Asia and Pacific Commission on Agricultural Statistics Twenty-fifth Session Vientiane, Lao PDR, 18-21 February 2014 Agenda Item 12 Agri-environmental indicators and the recently
Minimum Core Data Set
 Global Strategy IMPROVING AGRICULTURAL AND RURAL STATISTICS IN ASIA PACIFIC Minimum Core Data Set Regional Office for the Asia-Pacific Regional Action Plan to Improve Agricultural and Rural Statistics
Global Strategy. Session 1.2: Minimum Set of Core Data Items. Module 1: Sampling in the Context of the Global Minimum Set of Core Data Items
 Global Strategy IMPROVING AGRICULTURAL AND RURAL STATISTICS IN ASIA PACIFIC Module 1: Sampling in the Context of the Global Minimum Set of Core Data Items Session 1.2: Minimum Set of Core Data Items 13
Overview of Global Strategy Minimum Core Data Set requirements
 Global Strategy IMPROVING AGRICULTURAL AND RURAL STATISTICS IN ASIA PACIFIC Overview of Global Strategy Minimum Core Data Set requirements Allan Nicholls, Regional Coordinator Workshop on Statistical Capacity
System of Environmental-Economic Accounting for Agriculture, Forestry and Fisheries SEEA-AGRICULTURE
 System of Environmental-Economic Accounting for Agriculture, Forestry and Fisheries SEEA-AGRICULTURE 21 St Meeting of the London Group for Environmental Accounting 2-4 November 2015, The Hague, The Netherlands
Mapping global soil Carbon stocks and sequestration potential
 Mapping global soil Carbon stocks and sequestration potential John Latham Renato Cumani UN/FAO Environmental Assessment and Monitoring Unit FAO, Rome, April 16, 2009 1 Food and Agriculture Organization
Deciding Minimum Set of Core Data at national and global level
 Global Strategy IMPROVING AGRICULTURAL AND RURAL STATISTICS IN ASIA PACIFIC Item 5 Deciding Minimum Set of Core Data at national and global level Allan Nicholls, Regional Coordinator Orientation Programme
Issues associated with wetland biodiversity and. agriculture globally. and the extent of agriculture in Ramsar wetlands.
 research for a sustainable future Issues associated with wetland biodiversity and agriculture globally and the extent of agriculture in Ramsar wetlands Max Finlayson Institute for Land, Water & Society,
System of Environmental-Economic Accounting. for Agriculture, Forestry and Fisheries. SEEA Agriculture CONSULTATION DRAFT
 DEPARTMENT OF ECONOMIC AND SOCIAL AFFAIRS - STATISTICS DIVISION UNITED NATIONS System of Environmental-Economic Accounting for Agriculture, Forestry and Fisheries SEEA Agriculture CONSULTATION DRAFT The
Environment Statistics for evidence-based decision making
 Environment Statistics for evidence-based decision making Final Workshop on Environment Statistics for the East African Community Region Arusha, Tanzania 23 27 October 2017 ENVIRONMENT Team FAO STATISTICS
Definition: The change in water use efficiency over time (CWUE). The change in the ratio of the value added to the volume of water use, over time.
. The change in the ratio of the value added to the volume of water use, over time.") Goal 6: Ensure availability and sustainable management of water and sanitation for all Target 6.4: By 2030, substantially increase water-use efficiency across all sectors and ensure sustainable withdrawals
Goal 6: Ensure availability and sustainable management of water and sanitation for all Target 6.4: By 2030, substantially increase water-use efficiency across all sectors and ensure sustainable withdrawals
System of Environmental Economic Accounting for Agriculture (SEEA AGRI)
") November 2013 System of Environmental Economic Accounting for Agriculture (SEEA AGRI) A measurement framework for agri-environmental Indicators and analysis Carl Obst, Silvia Cerilli Consultants to FAO
November 2013 System of Environmental Economic Accounting for Agriculture (SEEA AGRI) A measurement framework for agri-environmental Indicators and analysis Carl Obst, Silvia Cerilli Consultants to FAO
Minimum Core Data Set
 Minimum Core Data Set Dalip Singh Statistician Regional Office for the Asia-Pacific Regional Action Plan to Improve Agricultural and Rural Statistics 1 Background The Global Strategy describes three pillars
BIODIVERSITY AND MEAT CONSUMPTION
 BIODIVERSITY AND MEAT CONSUMPTION Impacts of meat consumption on biodiversity Carolyn Imede Opio Food and Agriculture Organization - FAO Outline 1. Global livestock sector trends 2. Key features important
System of Environmental-Economic Accounting 2015
 System of Environmental-Economic Accounting 2015 Agriculture, Forestry and Fisheries GUIDELINES Cover photo: FAO/ Mario Marzot FAO/J. Thompson FAO/Roberto Faidutti System of Environmental-Economic Accounting
The Water-Climate Nexus and Food Security in the Americas. Michael Clegg University of California, Irvine
 The Water-Climate Nexus and Food Security in the Americas Michael Clegg University of California, Irvine The Global Challenge Global population is projected to increase by about 30% between now and 2050
Geospatial Information and Earth Observations: Data Sources for Climate Change and Disaster Statistics
 Geospatial Information and Earth Observations: Data Sources for Climate Change and Disaster Statistics Francesco N. Tubiello Statistics Division, FAO Expert Forum for producers and users of climate changerelated
INTRODUCTION TO THE BREAKOUT SESSIONS. ESA-FAO-GWSP Workshop on WEF Rome, Italy March 25, 2014 Richard Lawford Cat Downy, Lucie Pluschke
 INTRODUCTION TO THE BREAKOUT SESSIONS ESA-FAO-GWSP Workshop on WEF Rome, Italy March 25, 2014 Richard Lawford Cat Downy, Lucie Pluschke The Breakout Groups are a critical element in the Workshop structure
World Gross Domestic Product
 Figure 1 World Gross Domestic Product 1950-1992 Year World GDP 1950 2,238 1973 6,693 1992 11,664 Century World (New York: W. W. Norton, 2000), 6. These are index numbers relative to 1500, index number
Food and Agriculture Organization of the United Nations Land and Water Division AQUASTAT. FAO s global information system on water and agriculture
 Food and Agriculture Organization of the United Nations Land and Water Division AQUASTAT FAO s global information system on water and agriculture PRODUCTS and CHALLENGES by Karen FRENKEN AQUASTAT Programme
Components, sub-components and statistical topics of the FDES 2013 Component 2: Environmental resources and their use
 Components, sub-components and statistical topics of the FDES 2013 Component 2: Environmental resources and their use 6. Environment Protection, Management and Engagement 2. Environmental Resources and
Implementation of the Research Plan. December, Rome. Elisabetta Carfagna, FAO Statistics Division University of Bologna. 4th
 Implementation of the Research Plan 4th December, Rome Elisabetta Carfagna, FAO Statistics Division University of Bologna Global Output 1 - Effective governing bodies set up and functioning at global and
Spatial data needs in the new CAP and beyond
 Spatial data needs in the new CAP and beyond INSPIRE CONFERENCE 19 September 2018 European Commission DG AGRI D.3 Implementation support & IACS Why do we need to share existing data? Policy monitoring
ENVIRONMENTAL-ECONOMIC ACCOUNTING 101
 ENVIRONMENTAL-ECONOMIC ACCOUNTING 101 The need for Environmental-Economic Accounting Traditional accounting approaches have failed to account for the relationship between economic activity, as measured
12693/15 LS/dd 1 DGB 1B
 Council of the European Union Brussels, 12 October 2015 (OR. en) 12693/15 AGRI 511 CLIMA 105 ENV 608 NOTE From: To: Subject: Presidency Delegations Towards climate-smart agriculture Exchange of views In
Components, sub-components and statistical topics of the FDES 2013 Component 2: Environmental resources and their use
 Components, sub-components and statistical topics of the FDES 2013 Component 2: Environmental resources and their use 6. Environmental Protection, Management and Engagement 2. Environmental Resources and
COMMITTEE ON AGRICULTURE
 March 2012 Food and Agriculture Organization of the United Nations Organisation des Nations Unies pour l'alimentation et l'agriculture Продовольственная и cельскохозяйственная организация Объединенных
AGRICULTURE & FORESTRY
 AGRICULTURE AND FORESTRY Emissions and mitigation potential Agriculture, forestry and other land use (AFOLU) is a broad category of emissions that has been used by the IPCC since 2006. It widely used in
Unit 3. The primary sector
 Unit 3. The primary sector - Economic activities devoted to obtaining resources directly from nature. Agrarian space - Agrarian space: land where agrarian activities are undertaken - Rural space: non urban
FAO s work on climate change SOFA. THE STATE OF FOOD AND AGRICULTURE Climate change, agriculture and food security
 FAO s work on climate change SOFA THE STATE OF FOOD AND AGRICULTURE Climate change, agriculture and food security Climate change is a growing threat to the agriculture sectors. The negative effects on
Learning portfolio of bioenergy markets and policies
 Learning portfolio of bioenergy markets and policies Hsiao-Fan Wu 291361 11 February 2018 The role of policy on bioenergy markets There are different policies affecting production and consumption of bioenergy.
Livestock s Long Shadow Environmental Issues and Options
 Livestock s Long Shadow Environmental Issues and Options Pierre Gerber Methane to Markets Partnership Expo Beijing - 30 October 2007 Henning Steinfeld Pierre Gerber Tom Wassenaar Vincent Castel Mauricio
How do climate change and bio-energy alter the long-term outlook for food, agriculture and resource availability?
 How do climate change and bio-energy alter the long-term outlook for food, agriculture and resource availability? Günther Fischer, Land Use Change and Agriculture Program, IIASA, Laxenburg, Austria. Expert
Indicators on Land Use and Agriculture: Fertilizer and Pesticides
 Indicators on Land Use and Agriculture: Fertilizer and Pesticides Robert Mayo Senior Statistician Robert.Mayo@fao.org Dominic Ballayan Statistician Dominic.Ballayan@fao.org Indicators on Fertilizer and
Services Supply Account (Levels 1 and 2)
") Services Supply Account (Levels 1 and 2) Project: Advancing the SEEA Experimental Ecosystem Accounting Overview: Services Supply 1. Learning objectives 2. Review of Level 0 (5m) 3. Level 1 (Compilers)
Services Supply Account (Levels 1 and 2) Project: Advancing the SEEA Experimental Ecosystem Accounting Overview: Services Supply 1. Learning objectives 2. Review of Level 0 (5m) 3. Level 1 (Compilers)
OVERVIEW OF AGRICULTURAL STATISTICS IN LITHUANIA Legislative and institutional settings
 OVERVIEW OF AGRICULTURAL STATISTICS IN LITHUANIA Legislative and institutional settings Aušra Jablonskienė Head of Agriculture and Environment Statistics Division INSTITUTIONAL FRAMEWORK Statistics Lithuania
The Water-Energy-Land (WEL) nexus and the analysis of Land issues
 nexus and the analysis of Land issues") The Water-Energy-Land (WEL) nexus and the analysis of Land issues Karl Harmsen Sr Fellow, ZEF, University of Bonn Consultant, DIE, Bonn European Report on Development (ERD) 2012 Consultation on Governance
The Water-Energy-Land (WEL) nexus and the analysis of Land issues Karl Harmsen Sr Fellow, ZEF, University of Bonn Consultant, DIE, Bonn European Report on Development (ERD) 2012 Consultation on Governance
Organisation of environmental statistics and accounting in Finland
 Organisation of environmental statistics and accounting in Finland Co-operation and data flows between the National Statistical Office and the Ministry of the Environment in Finland Activity A.12: Methodology
Sustainable Agriculture within a Green Economy Side Event to PrepCom2, New York, 8 March with Agriculture. FAO, Rome, Italy
 Sustainable Agriculture within a Green Economy Side Event to PrepCom2, New York, 8 March 2011 Greening the Economy with Agriculture Nadia El-Hage Scialabba FAO, Rome, Italy GREENING THE ECONOMY WITH AGRICULTURE
How Trade Liberalization Can Benefit the Environment (or The Fallacy of Food Miles )
") How Trade Liberalization Can Benefit the Environment (or The Fallacy of Food Miles ) Robert L. Thompson Gardner Endowed Chair in Agricultural Policy University of Illinois at Urbana-Champaign 12 May 2008
How Trade Liberalization Can Benefit the Environment (or The Fallacy of Food Miles ) Robert L. Thompson Gardner Endowed Chair in Agricultural Policy University of Illinois at Urbana-Champaign 12 May 2008
Sustainable Conservation Practices for Natural Resources
 Sustainable Conservation Practices for Natural Resources Rajdeep Mundiyara 1, Prem Kumar 2 and Mamta Bajya 3 1 Seed Officer, Rajasthan State Seeds Corporation,Mandore, Jodhpure 2 Department of Plant Philology,
Valuation of livestock eco-agri-food systems: poultry, beef and dairy
 Valuation of livestock eco-agri-food systems: poultry, beef and dairy TEEB for Agriculture & Food expert Workshop Brussels 8 September 2015, Willy Baltussen & Arianne de Blaeij Acknowledgement Study has
The Blueprint and Council Conclusions:
 The Blueprint and Council Conclusions: Essential to address the challenges that threaten the water ecosystems and their services on which society depends Proposed solutions include assessment of the costs
Use of CORINE Land Cover in delivering the EEA strategy
 Use of CORINE Land Cover in delivering the EEA strategy Prof. Jacqueline McGlade Executive Director EIONET Member Countries national teams / co-funding Commission Services: Acknowledgements JRC: joint
Agricultural Development and Reduced Glasshouse Gas Emmission
 Agricultural Development and Reduced Glasshouse Gas Emmission Paper for Workshop on 22 April 2013 Hymawari, Hotel, Phnom Penh, Cambodia By Mak Soeun, PhD in Agronomy/Farming System Specialist Director
UN recommendation on environmental accounting. Environmental accounting in the EU
 UN recommendation on environmental accounting Environmental accounting in the EU Activity A.12: Methodology on environmental accounting with emphasis on air and waste accounts 9-12 December 2013 Jukka
THE AGRICULTURE SECTORS IN THE INTENDED NATIONALLY DETERMINED CONTRIBUTIONS: SUMMARY ENVIRONMENT AND NATURAL RESOURCES MANAGEMENT WORKING PAPER
 THE AGRICULTURE SECTORS IN THE INTENDED NATIONALLY DETERMINED CONTRIBUTIONS: SUMMARY ENVIRONMENT AND NATURAL RESOURCES MANAGEMENT WORKING PAPER E N V I R O N M E N T [ C L I M A T E C H A N G E ] Background
Agricultural practices that reduce greenhouse gases (GHGs) and generate co-benefits
 and generate co-benefits") Environmental Toxicology II 61 Agricultural practices that reduce greenhouse gases (GHGs) and generate co-benefits K. Duncan Health Studies, University of Toronto at Scarborough, Canada Abstract Human
Environmental Toxicology II 61 Agricultural practices that reduce greenhouse gases (GHGs) and generate co-benefits K. Duncan Health Studies, University of Toronto at Scarborough, Canada Abstract Human
How the SEEA Experimental Ecosystem Accounting framework could be used for growth accounting and productivity analysis
 How the SEEA Experimental Ecosystem Accounting framework could be used for growth accounting and productivity analysis Paper prepared for the OECD Expert Workshop on Measuring Environmentally Adjusted
2 nd Day -16 April 2016: System of Environmental-Economic Accounting for Agriculture, Forestry and Fisheries (SEEA-Agriculture)
") 2 nd Day -16 April 2016: System of Environmental-Economic Accounting for Agriculture, Forestry and Fisheries (SEEA-Agriculture) This presentation starts by introducing the Driving forces-pressure-state-impact-responses
2 nd Day -16 April 2016: System of Environmental-Economic Accounting for Agriculture, Forestry and Fisheries (SEEA-Agriculture) This presentation starts by introducing the Driving forces-pressure-state-impact-responses
Agricultural Population Growth Marginal as Nonagricultural Population Soars
 Population (Millions) Agricultural Population Growth Marginal as Nonagricultural Population Soars Sohpie Wenzlau February 19, 2013 T he global agricultural population defined as individuals dependent on
Towards a regulatory framework for climate smart agriculture in Europe
 Jonathan Verschuuren Tilburg, 15 December 2017 Towards a regulatory framework for climate smart agriculture in Europe Photocredit: GettyImages Introduction Welcome! Goal of this symposium Project financed
Agriculture, Food and GHGs
 Agriculture, Food and GHGs P A U L M C K I E R N A N C L I M A T E C H A N G E D I V I S I O N D E P A R T M E N T O F A G R I C U L T U R E, F O O D A N D T H E M A R I N E 9 TH O C T O B E R 2 0 1 3
Global Assessment of impacts of climate change on agricultural productivity the FAO GAEZ portal
 Global Assessment of impacts of climate change on agricultural productivity the FAO GAEZ portal John Latham, Gianluca Franceschini Geospatial Coordination Unit (GCU) Climate and Biodiversity Department;
Review of FAO Experiences in Good Agriculture Practices at Global, Regional and National Levels: Key Lessons and Question
 Review of FAO Experiences in Good Agriculture Practices at Global, Regional and National Levels: Key Lessons and Question Dost Muhammad Plant Production Officer, FAO RNE, Cairo, Egypt FAO Role in Good
Environmental Spring Review Part 2
 1 1. The mechanization of many jobs, which resulted in major population shifts from rural areas to urban areas occurred during a. The cold war post WWII b. Ecosystem services c. Industrial Revolution d.
Soils and Food Security
 Soils and Food Security Soils: The Foundation of Life National Academy of Sciences Workshop 5 December 2016 Pedro A. Sanchez University of Florida pedrosanchez@ufl.edu Soils are the foundation of food
Livestock s Long Shadow Environmental Issues and Options
 Livestock s Long Shadow Environmental Issues and Options Henning Steinfeld Pierre Gerber Tom Wassenaar Vincent Castel Mauricio Rosales Cees de Haan presented by Irene Hoffmann ERFP Workshop - Dublin 25
GEF 2020 Strategy does not really seem to be long-term? STAP meeting March 21, 2013
 WORKING DRAFT Last Modified 3/21/2013 8:45 AM Eastern Standard Time Printed 3/12/2013 11:59 AM Eastern Standard Time GEF 2020 Strategy STAP meeting March 21, 2013 2020 does not really seem to be long-term?
FAOSTAT Statistics for Climate Change Agriculture, Forestry and Other Land use
 FAOSTAT Statistics for Climate Change Agriculture, Forestry and Other Land use Final Workshop on Environment Statistics for the East African Community Region Arusha, Tanzania 23 27 October 2017 ENVIRONMENT
A System of Integrated Economic-Environmental Accounts for Food and Agriculture: Information Paper for the London Group Meeting in Brussels *
 A System of Integrated Economic-Environmental Accounts for Food and Agriculture: Information Paper for the London Group Meeting in Brussels * Introduction Xiaoning Gong FAO Statistics Division 26 September
SDG Indicators and the SEEA
 SEEA AND SDGs SDG Indicators and the SEEA The Statistical Commission recognized SEEA as an important statistical framework for the post-2015 development agenda and the sustainable development goals indicators
Objectives for background paper
 Short Rotation Forestry, Short Rotation Coppice and energy grasses in the European Union: Agro-environmental aspects, present use and perspectives Introduction to background paper Rothamsted, 17 October
Session 2: Refresher on key concepts of FDES
 Session 2: Refresher on key concepts of FDES 6. Environment Protection, Management and Engagement 2. Resources and their Use 5. Human Settlements and Health 1. Conditions and Quality 4. Extreme Events
FOOD, NUTRITION AND FOOD SECURITY
 ECONOMIC INDICATORS FOOD, NUTRITION AND FOOD SECURITY Per capita food supply Quantity [kcal/capita/day] 1996 2001 2006 Food Aid shipments Quantity [1000 t] Prevalence of undernutrition Prevalence [%] Food
Approaches in using common Rural Development indicators in regional RDPs
 WORKING DOCUMENT Approaches in using common Rural Development indicators in regional RDPs Good Practice Workshop Specific challenges in using common RD indicators at regional level Rome, 6 and 7 March
Ecosystem accounting at the European Environment Agency: a summary of progress 1
 Ecosystem accounting at the European Environment Agency: a summary of progress 1 Glenn-Marie Lange, The Earth Institute at Columbia University Jean-Louis Weber, European Environment Agency 25 October 2006
Introduction to the SEEA & Policy Applications
 Introduction to the SEEA & Policy Applications Project: Advancing the SEEA Experimental Ecosystem Accounting 1 1. Policy Setting 2. An Integrated Information System for Sustainable Development 3. Adoption
The Harmonized World Soil Database (HWSD) A Global Soil Information System.
 A Global Soil Information System.") The Harmonized World Soil Database (HWSD) A Global Soil Information System. Freddy Nachtergaele freddy_nachtergaele@hotmail.it Harrij van Velthuizen velt@iiasa.ac.at INTRODUCTION The Food and Agriculture
The Harmonized World Soil Database (HWSD) A Global Soil Information System. Freddy Nachtergaele freddy_nachtergaele@hotmail.it Harrij van Velthuizen velt@iiasa.ac.at INTRODUCTION The Food and Agriculture
European Soil Data Centre (ESDAC): Soil data infrastructure for research and policy making in Europe
: Soil data infrastructure for research and policy making in Europe") European Soil Data Centre (ESDAC): Soil data infrastructure for research and policy making in Europe Ana Payá Pérez, Panos Panagos & Marc Van Liedekerke Convegno sul tema: Evento internazionale EUGRIS:
European Soil Data Centre (ESDAC): Soil data infrastructure for research and policy making in Europe Ana Payá Pérez, Panos Panagos & Marc Van Liedekerke Convegno sul tema: Evento internazionale EUGRIS:
(some) Tools available for assessing the environmental needs at EU level
 Tools available for assessing the environmental needs at EU level") (some) Tools available for assessing the environmental needs at EU level JM Terres JRC.D5 (F Bouraoui, F Dentener, B Grizzetti, A Leip, E Lugato, P Panagos, ML Paracchini, A de Roo) Best practices addressing
(some) Tools available for assessing the environmental needs at EU level JM Terres JRC.D5 (F Bouraoui, F Dentener, B Grizzetti, A Leip, E Lugato, P Panagos, ML Paracchini, A de Roo) Best practices addressing
Overview of experience on the ground in the area of land use and climate change: Challenges and opportunities
 Overview of experience on the ground in the area of land use and climate change: Challenges and opportunities María J. Sanz FAO 1 May 2013 Outline What is at stake Role of FAO: what is need and it can
Impact of WTO Accession on China's Agriculture, Rural Development and on Farmers
 Impact of WTO Accession on China's Agriculture, Rural Development and on Farmers Li Xiande Professor Institute of Agricultural Economics, Chinese Academy of Agricultural Sciences May 16, 2006, World Bank
JOINT RESEARCH CENTRE - Work Programme 2010 Action n SOIL - Soil Data and Information Systems
 JOINT RESEARCH CENTRE - Work Programme 2010 Action n 22004 - SOIL - Soil Data and Information Systems Institute for environment and sustainability (Ispra) Policy Theme: 2 - Solidarity and the responsible
A study on the impact of EU consumption on deforestation. GIULIANA TORTA European Commission DG ENVIRONMENT
 A study on the impact of EU consumption on deforestation GIULIANA TORTA European Commission DG ENVIRONMENT Published on 2 nd July! http://ec.europa.eu/environment/forests/im pact_deforestation.htm 03.07.2013
Overview of land cover & change
 Note The results presented here are based on a change analysis of 44 land cover types mapped consistently on a 1:1. scale across Europe over the decade 199-2 - see Corine land cover programme for details.
Key messages of chapter 3
 Key messages of chapter 3 With GHG emissions along livestock supply chains estimated at 7.1 gigatonnes CO 2 -eq per annum, representing 14.5 percent of all human-induced emissions, the livestock sector
World Economic and Social Survey (WESS) 2011: The Great Green Technological Transformation
 2011: The Great Green Technological Transformation") World Economic and Social Survey (WESS) 2011: The Great Green Technological Transformation Chapter I: Why a green technological transformation is needed Chapter II: The clean energy technological transformation
World Economic and Social Survey (WESS) 2011: The Great Green Technological Transformation Chapter I: Why a green technological transformation is needed Chapter II: The clean energy technological transformation
Country fact sheet. Land cover Luxembourg. September Photo: Toni García, My City/EEA
 Country fact sheet Land cover 2012 Luxembourg September 2017 Photo: Toni García, My City/EEA Land cover 2012 Overview of land cover & change The small country of Luxembourg shows significant decrease of
The Resource Efficiency Scoreboard
 EUROPEAN COMMISSION EUROSTAT Directorate E: Sectoral and regional statistics Doc. ENV/ DIMESA Bureau Oct 2013/ 04 Point 4 of the agenda The Resource Efficiency Scoreboard 2 nd DIMESA Bureau Meeting 2013
Human Impact on the Environment: Part III
 Human Impact on the Environment: Part III The late Alan Gregg pointed out that human population growth within the ecosystem was closely analogous to the growth of malignant tumor cells, that man was acting
Prof. Dr. Tamás Németh*, Béla Pirkó**
 17 th Experts Meeting of the Ecology Working Group Focussing on Soil Conservation of Danube Countries Working Community March 17-18, 2010 St. Pölten, Austria Prof. Dr. Tamás Németh*, Béla Pirkó** *Research
Global manufacturing
 Global manufacturing Modern manufacturing companies operate in increasingly competitive markets. In the fast developing global economy they must constantly monitor and respond to the costs of production.
Montpellier, 13 Juillet, 2011
 Systèmes d information et approches pour l évaluation de la performance environnementale des filières d élevage au niveau mondial Montpellier, 13 Juillet, 2011 La problématique Évaluation basés sur des
Target indicator fiches for Pillar II (Priorities 1 to 6)
") Working document Target indicator fiches for Pillar II (Priorities 1 to 6) APRIL 2015 List of target / result indicators FA 1A Focus Area Target indicator Complementary result indicators Fostering innovation,
Working document Target indicator fiches for Pillar II (Priorities 1 to 6) APRIL 2015 List of target / result indicators FA 1A Focus Area Target indicator Complementary result indicators Fostering innovation,
Linking forestry, land use, and energy models for climate change mitigation assessment
 Linking forestry, land use, and energy models for climate change mitigation assessment Petr Havlík 1, Mykola Gusti 1, Nicklas Forsell 1, Tatiana Ermolieva 1, Georg Kindermann 1, Hannes Bötcher 1, Pekka
Livestock manure and related statistics
 Livestock manure and related statistics 30 November 2015, Kigali, Rwanda International Workshop on Statistics on nitrogen input from livestock manure: Estimating availability and use Outline The challenge
ENVIRONMENTAL PERFORMANCE OF AGRICULTURE IN OECD COUNTRIES SINCE 1990: European Union Country Section
 Organisation for Economic Co-operation and Development Organisation de Coopération et de Développement Économiques ENVIRONMENTAL PERFORMANCE OF AGRICULTURE IN OECD COUNTRIES SINCE 1990: European Union
What is happening to the world? The importance of green growth
 What is happening to the world? The importance of green growth Professor Sir John Beddington Chief Scientific Adviser to HM Government and Head of the Government Office for Science An inevitable increase
Aus dem Institut für Betriebswirtschaft, Agrarstruktur und ländliche Räume
 Aus dem Institut für Betriebswirtschaft, Agrarstruktur und ländliche Räume Heike Nitsch Good farming practice - definitions, implementation, experiences : Report on the results of work package 2 within
Session 2: Frameworks for Environmental Statistics and for the Development of Indicators
 Session 2: Frameworks for Environmental Statistics and for the Development of Indicators Reena Shah United Nations Statistics Division Workshop on Environment Statistics (Abuja, 19-23 May 2008) Frameworks
Director OECD Environment Directorate
 For more information, see www.oecd.org/greengrowth Launch of the OECD Environmental Performance Review of Slovenia, Ljubljana, 6 June 2012 Simon Upton Director OECD Environment Directorate GDP per capita
Agriculture. Victim, Culprit and Potentials for Adaptation and Mitigation. Luis Waldmüller, GIZ
 Agriculture Victim, Culprit and Potentials for Adaptation and Mitigation Luis Waldmüller, GIZ Results IPCC Report 2014 In many regions, changing precipitation or melting snow and ice are altering hydrological
Palm Oil TEEB FOR AGRICULTURE AND FOOD
 Palm Oil TEEB FOR AGRICULTURE AND FOOD Overview Palm Oil Countries in this study are responsible for 96% of global palm oil production - Africa Palm oil consumption set to double in 40-years Aim Support
Chapter 11 Feeding the World
 Chapter 11 Feeding the World HUMAN NUTRITIONAL REQUIREMENTS ARE NOT ALWAYS SATISFIED Undernutrition The condition in which not enough calories are ingested to maintain health. Malnourished Having a diet
ECONOMIC COMMISSION FOR EUROPE 15 January 2009 AGRICULTURAL STATISTICS IN THE CIS COUNTRIES
 STATISTICAL COMMISSION and ECE/CES/BUR/2009/FEB/3/Add.1 ECONOMIC COMMISSION FOR EUROPE 15 January 2009 CONFERENCE OF EUROPEAN STATISTICIANS Second meeting of the 2008/2009 Bureau Geneva, 2-3 February 2009