AGRICULTURE AND NATIONAL ACCOUNTS
|
|
|
- Willis Henderson
- 6 years ago
- Views:
Transcription

1 AGRICULTURE AND NATIONAL ACCOUNTS Domenico Ciaccia Roberto Moro Division for supply of goods and services Directorate for National accounts
2 Overview The Statistical classification of economic activities in the European Community (NACE rev.2) National Accounts (Central Framework) and Economic Accounts for Agriculture EAA The Bridge Table Some Agriculture figures for Italy and EU28 Main sources. Sectoral statistics The estimate of output for Agriculture, Forestry and Fishing The estimate of intermediate consumption for Agriculture, Forestry and Fishing Indicator A (index of the real income of factors in agricultural per annual work unit)
3 The Statistical classification of economic activities in the European Community (NACE rev.2) A AGRICULTURE, FORESTRY AND FISHING 01 Crop and animal production, hunting and related service activities 01.1 Growing of non-perennial crops 01.2 Growing of perennial crops 01.3 Plant propagation 01.4 Animal production 01.5 Mixed farming 01.6 Support activities to agriculture and post-harvest crop activities 01.7 Hunting, trapping and related service activities 02 Forestry and logging 02.1 Silviculture and other forestry activities 02.2 Logging 02.3 Gathering of wild growing non-wood products 02.4 Support services to forestry 03 Fishing and aquaculture 03.1 Fishing 03.2 Aquaculture B MINING AND QUARRYING C MANUFACTURED PRODUCTS. U SERVICES PROVIDED BY EXTRATERRITORIAL ORGANISATIONS AND BODIES EUROSTAT - RAMON - Reference And Management Of Nomenclatures -


4 National Accounts National Accounts (Central Framework) Satellite Accounts EAA (Economic Accounts for Agriculture) Consistency between NA and EAA is obtained via an annual bridge table elaborated with reference to each year.
5 National Accounts (Central Framework) Quarterly National Account Preliminary GDP flash GDP flash GDP and main aggregates t+30 days t+45 days t+60 days Annual National Account Regulation 549/2013 (European system of national and regional accounts in the European Union) March September
6 Economic Accounts for Agriculture - EAA The main purpose of the EAA is to analyze the production process and the generated primary income. Satellite account providing complementary information and concepts adapted to the particular nature of the agricultural industry. Regulation 138/2004. Timeliness and high level of detail.
7 EAA Regulation 138/2004 transmission deadlines Transmission date via edamis Reg. CE 138/2004 Gentlemen's agreement edamis DATASET EAA First Estimates November 2015 X - COSAEA_AGR1_A EAA Second Estimates January 2016 X - COSAEA_AGR2_A EAA Constant n-1 prices Final 2015 EAA Current prices Final 2015 X - COSAEA_AGR3CON_A X - COSAEA_AGR3CUR_A 30 September UV (unit Values) X COSAEA_UV_BP_A 2016 EAA Regional data X COSAEA_REGION_A ALI (Labour Input) final 2015 X - COSAEA_ALI3_A
8 The Bridge table : differences between the central framework of NA and EAA PRODUCTION AGGREGATES Central framework NA (ESA 2010) (review 2014) Satellite account EAA Wine Wine from own grapes Wine made by cooperatives included Oil Pressed oil made from own olives Pressed oil made by cooperatives included Kitchen gardens Included Not included Small animal farming Included Not included Seeds for research, certification and experiments Included Not included Christmas trees and others Not included Included Very small production enterprises Included Not included Associated activities, including: - land and landscape preservation Included Included - use and rental of third party farming machines, with staff (pure sub-contracting) Included Not included - first processing of product Included Included
9 The Bridge table : differences between the central framework of NA and EAA INTERMEDIATE CONSUMPTION AGGREGATES Central framework NA (ESA 2010) (review 2014) Satellite account EAA Expenses for energy, fertilizer, animal feedstuffs, pesticides, other goods and services (very small enterprises) Included Non included Expenses for wine and oil processing Non included Included (cooperatives), milk, fruit and other Agricultural tourism Included Included Expenses for bottling and marketing of wine and oil Expenses for packaging, first processing of the product and arrangement for the markets Own production only included Including cooperatives wine and oil expenses included
10 Some data: principals EAA aggregates in EU28 year 2013 (million EUR) Ue28 Germany Spain France Italy Poland Others Agricultural Goods Output 390, , , , , , , Agricultural Services Output 19, , , , , Secondary Activities (Inseparable) 15, , , , , Output Of The Agricultural 'Industry' 425, , , , , , , Total Intermediate Consumption 253, , , , , , , Gross Value Added At Basic Prices 171, , , , , , , Fixed Capital Consumption 61, , , , , , , Net Value Added At Basic Prices 110, , , , , , , Other Taxes On Production 4, , , Other Subsidies On Production 52, , , , , , , Factor Income 157, , , , , , , Entrepreneurial Income 100, , , , , , , Gross Fixed Capital Formation (Excluding Deductible Vat) 57, , , , , , ,048.88
11 Some Agriculture figures for Italy At national level: Agriculture, forestry and fishing represents 2.1% of total value added at basic prices. At European level: Italian agriculture is the second in EU28 in terms of Output Of The Agricultural 'Industry Italian agriculture is the first in EU28 in terms of Net Value Added At Basic Prices
12 Transmission programme of EAA data Reg 138/2004 Timeliness: with reference to a year n, the transmission programme of EAA data is: First estimates: November n Second estimates: January (n+1) Final Data: September (n+1) High level of detail
13 Transmission programme of EAA data Reg 138/2004 Item List of variables Transmission concerning reference year n 1. Production account November year N (estimates) January year n+1 (estimates) September year n+1 01 Cereals (including seeds) X X X 01.1 Wheat and spelt X X X 01.1/1 Soft wheat and spelt X 01.1/2 Durum wheat X 01.2 Rye and meslin X X X 01.3 Barley X X X 01.4 Oats and summer cereal mixtures X X X 01.5 Grain maize X X X 01.6 Rice X X X 01.7 Other cereals X X X 02 Industrial crops X X X 02.1 Oil seeds and oleaginous fruits (including seeds) X X X 02.1/1 Rape and turnip rape seed X 02.1/2 Sunflower X 02.1/3 Soya X 02.1/4 Other oleaginous products X 02.2 Protein crops (including seeds) X X X 02.3 Raw tobacco X X X 02.4 Sugar beet X X X 02.5 Other industrial crops X X X 02.5/1 Fibre plants X 02.5/2 Hops X 02.5/3 Other industrial crops: others X
14 Transmission programme of EAA data Reg 138/2004 Item List of variables Transmission concerning reference year n November year N (estimates) January year n+1 (estimates) September year n+1 03 Forage plants X X X 03.1 Fodder maize X 03.2 Fodder root crops (including forage beet) X 03.3 Other forage plants X 04 Vegetables and horticultural products X X X 04.1 Fresh vegetables X X X 04.1/1 Cauliflower X 04.1/2 Tomatoes X 04.1/3 Other fresh vegetables X 04.2 Plants and flowers X X X 04.2/1 Nursery plants X 04.2/2 Ornamental plants and flowers (including Christmas trees) X 04.2/3 Plantations X 05 Potatoes (including seeds) X X X 06 Fruits X X X 06.1 Fresh fruit X X X 06.1/1 Dessert apples X 06.1/2 Dessert pears X 06.1/3 Peaches X 06.1/4 Other fresh fruit X
15 Transmission programme of EAA data Reg 138/2004 Item List of variables Transmission concerning reference year n November year N (estimates) January year n+1 (estimates) 06.2 Citrus fruits X X X 06.2/1 Sweet oranges X 06.2/2 Mandarins X 06.2/3 Lemons X 06.2/4 Other citrus fruits X 06.3 Tropical fruit X X X 06.4 Grapes X X X 06.4/1 Dessert grapes X 06.4/2 Other grapes X 06.5 Olives X X X 06.5/1 Table olives X 06.5/2 Other olives X September year n+1 07 Wine X X X 07.1 Table wine X 07.2 Quality wine X 08 Olive oil X X X 09 Other crop products X X X 09.1 Vegetable materials used primarily for plaiting X 09.2 Seeds X 09.3 Other crop products: others X 10 Crop output (01 to 09) X X X
16 Transmission programme of EAA data Reg 138/2004 Item List of variables Transmission concerning reference year n November year N (estimates) January year n+1 (estimates) September year n+1 11 Animals X X X 11.1 Cattle X X X 11.2 Pigs X X X 11.3 Equines X X X 11.4 Sheep and goats X X X 11.5 Poultry X X X 11.6 Other animals X X X 12 Animal products X X X 12.1 Milk X X X 12.2 Eggs X X X 12.3 Other animal products X X X 12.3/1 Raw wool X 12.3/2 Silkworm cocoons X 12.3/3 Other animal products: others X 13 Animal output (11+12) X X X 14 Agricultural goods output (10+13) X X X 15 Agricultural services output X X X 15.1 Agricultural services X 15.2 Renting of milk quota X 16 Agricultural output (14+15) X X X 17 Non-agricultural secondary activities (inseparable) X X X 17.1 Processing of agricultural products X X X 17.2 Other inseparable secondary activities (goods and services) X X X 18 Output of the agricultural industry (16+17) X X X
17 Transmission programme of EAA data Reg 138/2004 Item List of variables Transmission concerning reference year n November year N (estimates) January year n+1 (estimates) 19 Total intermediate consumption X X X Seeds and planting stock X X X Energy; lubricants X X X 19.02/1 electricity X 19.02/2 gas X 19.02/3 other fuels and propellants X 19.02/4 other X 19,03 Fertilizers and soil improvers X X X 19,04 Plant protection products and pesticides X X X 19,05 Veterinary expenses X X X 19,06 Animal feedingstuffs X X X 19.06/1 feedingstuffs supplied by other agricultural holdings X X X 19.06/2 feedingstuffs purchased from outside the agricultural industry X X X 19.06/3 feedingstuffs produced and consumed by the same holding X X X Maintenance of materials X X X Maintenance of buildings X X X Agricultural services X X X Other goods and services X X X September year n+1
18 Transmission programme of EAA data Reg 138/2004 Item List of variables Transmission concerning reference year n November year N (estimates) January year n+1 (estimates) 20 Gross value added at basic prices (18-19) X X X 21 Fixed capital consumption X X X 21.1 Equipment X 21.2 Buildings X 21.3 Plantations X 21.4 Others X 22 Net value added at basic prices (20-21) X X X September year n+1 2. Generation of income account 23 Compensation of employees X X X 24 Other taxes on production X X X 25 Other subsidies on production X X X 26 Factor income ( ) X X X 27 Operating surplus/mixed income ( ) X X X 3. Entrepreneurial income account 28 Rents and other real estate rental charges to be paid X X X 29 Interest paid X X X 30 Interest received X X X 31 Entrepreneurial income ( ) X X X
19 Transmission programme of EAA data Reg 138/2004 Item List of variables Transmission concerning reference year n 4. Elements of the capital account November year N (estimates) January year n+1 (estimates) 32 GFCF in agricultural products X 32.1 GFCF in plantations X 32.2 GFCF in animals X 33 GFCF in non-agricultural products X 33.1 GFCF in materials X 33.2 GFCF in buildings X 33.3 Other GFCF X 34 Gross fixed capital formation (excluding deductible VAT) (32+33) X 35 Net fixed capital formation (excluding deductible VAT) (34-21) X 36 Changes in stocks X 37 Capital transfers X 37.1 Investment grants X 37.2 Other capital transfers X September year n+1 5. Agricultural labour input 38 Total agricultural labour input X X X 38.1 Non-salaried agricultural labour input X X X 38.2 Salaried agricultural labour input X X X
20 Main sources. Sectoral statistics (1/3) Estimate of crop, flower and pot plants production and area Areas and production of tobacco, rice and sugar beet collected by sugar factories Monthly report on production prices of products sold by farmers Monthly report on prices of products purchased by farmers Survey on livestock Monthly slaughtering of animals for red meat Monthly slaughtering of animals for white meat Monthly survey on milk and dairy products Economic outcomes of agricultural holdings RICA-REA (FADN)
21 Main sources. Sectoral statistics (2/3) Distribution of fertilizers for agricultural purposes Distribution of plant protection products for agricultural purposes Report on production and distribution of complete and complementary feeding stuff Report on seed distribution Report on certified seeds Survey on felling surfaces and wood and non-wood removals from forest Survey on lagoon and sea fishing products Aquaculture survey
22 Main sources. Sectoral statistics (3/3) Survey on rural tourism accommodations National Energy Balance Energy consumption by final consumption sector and type of energy source Energy from renewable source plants (biomasses, photovoltaic, biogas)
23 The estimate of output for Agriculture (div.01) The quantity by price method is used: the quantity of each product is multiplied by its average annual price per unit. Quantities are provided by the survey Estimate of crop, flower and pot plant production and area (IST02049). Prices are collected through a specific survey called Monthly report of production prices of products sold by farmers (IST00106). The average prices (producer prices) are then increased by the subsidies on products and at the same time taxes on product are deducted. The quantity by price method now allows to obtain for each product the value of output at basic price.
24 An example: cereal group (including rice) - Year 2011 Quantity Basic price Current values (000 t.) (EUR for t.) (million EUR) CEREALS Common wheat Durum wheat Rye Barley Oats Rice (paddy rice) domestic maize hybrid maize other cereals (sorghum, spelt, triticale, other) Straws
25 The estimate of output for Agriculture (div.01) The method (quantity by price) is used also: to estimate other agricultural products, such as industrial crops, vegetables and horticultural products, fresh fruit and citrus fruit. to estimate animal and animal products: Quantities, including in-progress production, are derived from specific surveys on enterprises: the most relevant are the slaughterhouses for meat ( Monthly slaughtering of animals for red meat ) and dairies for dairy products ( Monthly survey on milk and dairy products ). Prices are collected by provincial Chambers of Commerce and Industry through the survey Monthly report of production prices of products sold by farmers.
26 Support and secondary activities traditional activities agritourism transformation of products (e.g. milk, fruit, meat ) emerging activities production of renewable energy (photovoltaic, biogas and biomass) educational farms, recreational activities and social farming direct sales/marketing parks and gardens maintenance production of feedstuffs The output is included in the value of output of agriculture, to account for the multi-functionality of farms (both Central framework and EAA). All support and secondary activities have reached a significant impact (about 20% of total agricultural output in the year 2011).
 A 256 DESCRIPTION Growing of crops, plant Animal propagation production, and support hunting and agricolture related service Forestry and logging Fishing and")
27 Table of domestic production, NACE rev.2 Section A - Year 2011 (million EUR) A 256 DESCRIPTION Growing of crops, plant Animal propagation production, and support hunting and agricolture related service Forestry and logging Fishing and aquaculture Wholesale trade, except of motor vehicles and motorcycles Retail trade, except of motor vehicles and motorcycles Libraries, archives, museums and activities TOTAL 1 Cereals 4.811,5 0,0 0,0 0,0 322,2 0,0 0, ,7 2 Fruits and vegetables ,8 0,0 0,0 0,0 339,3 75,7 0, ,8 3 Products of agriculture for intermediate use 2.605,1 0,0 0,0 0,0 0,0 0,0 0, ,1 4 Cannabis 0,0 0,0 0,0 0,0 0,0 0,0 0,0 0,0 5 Plant nursery products 2.743,8 0,0 0,0 0,0 68,7 0,8 2, ,0 6 Live animals and animal products for final use 0, ,2 0,0 0,0 35,8 134,9 0, ,9 Live animals and animal products for 5.003,9 7 0, ,9 0,0 0,0 0,0 0,0 0,0 intermediate use 8 Agricultural and animal husbandry services 5.898,8 0,0 0,0 0,0 0,0 0,0 0, ,8 9 Products of forestry, logging and related services 0,0 0, ,1 0,0 0,0 0,0 0, ,1 10 Fish and other fishing products 8,4 0,0 0, ,9 0,0 47,6 0, ,9 19 Preserved meat and meat products 0,0 317,8 0,0 0,0 317,8 21 Processed and preserved fruit and vegetables 157,8 0,0 0,0 0,0 157,8 22 Vegetable and animal oils and fats 0,0 0,0 0,0 0,0 0,0 23 Dairy products 0,0 301,4 0,0 0,0 301,4 Sub-contracted operations as part of 195, ,9 0,0 0,0 0,0 manufacturing of food products 47 Products of wood for intermediate use 59,0 0,0 0,0 0,0 59,0 142 Electricity, transmission and distribution services 847,7 0,0 0,0 0,0 847,7 160 Retail trade services (except of automotive fuel) 265,0 0,0 0,0 0,0 265,0 182 Other accommodation services 1.164,0 0,0 0,0 0, ,0 226 Services to buildings and landscape 328,4 0,0 0,0 0,0 328,4 TOTAL , , , ,9 766,0 259,1 2, ,2
28 An example: electricity production from renewable energy (photovoltaic, biomass, biogas) The approach used is basically quantity by price. Data on the electricity produced in KW/h for the main economic activity sectors (agriculture, manufacturing, services) are provided by Italian Energy Services Manager (GSE in Italian). The quantities in the agricultural sector are evaluated through the average market price, including any subsidies on products. The same method applies to biogas, a technique created to contribute to the disposal of livestock waste (cattle and pigs) as well as biomasses from raw farming materials, such as maize or sorghum, which were heavily incentivized. The impact of renewable energies (mainly photovoltaic) was particularly significant in the period due to production incentives.
29 The estimate of intermediate consumption for Agriculture (div.01) Most of the items of intermediate consumption listed in the EAA technical manual refer almost exclusively to agriculture. Seeds, fertilizers, feeds, plant protections and energy are the main items. The approach used is basically quantity by price. The quantities are taken from statistical surveys that collect detailed data for each item. The prices used are those collected through the survey on prices of products purchased by farmers. The other expenses, such as agricultural services and other goods and services, are estimated through specific elaborations on FADN survey data.
30 The estimate of output for forestry (div.02) The output of forestry is calculated with a quantity by price approach of tree removals, by applying to each type of wood (manufacturing wood or wood for energy purposes) the corresponding prices. According to the NACE Rev.2 classification, the evaluation of the vegetable and fruit picking from woods (previously included in agriculture division 01) is now included in the output of division 02.
31 The estimate of intermediate consumption for forestry (div.02 ) The estimation of intermediate consumption of forestry includes: forest seedlings of forest essences maintenance equipment expenses for extraction and forestry fees. The approach used is quantity by price using the data of survey run on a sample of forestry farms. The costs for energy are estimated through processing data of the Italian national energy balance (BEN).
32 The estimate of output for fishing (div. 03) The output of fishing is calculated via a quantity by price approach. Data on catches (distinguished among finfish, shellfish and crustaceans) are integrated with other sources and are valued with the corresponding average prices. The production from aquaculture is also included in the estimates of the sector.
33 The estimate of intermediate consumption for fishing (div. 03) More than 50% concerns the energy component (diesel fuel for fishing vessels). This component is estimated through data collected from the Italian national energy balance (BEN). The items of intermediate consumption related to aquaculture (for example costs for networks, specific feeds and aquaculture tanks) are estimated using specific survey data on aquaculture.
34 Indicator A Index of the real income of factors in agricultural per annual work unit Indicator A = ((F n / (D/100))/F n-1 )/(L n /L n-1 )-1 F = Factor Income D = Price Index of GDP L = Total Agricultural Labour Input (in 1000 AWU)
 0 ITEMS aggregation errors 1 INDEXES rounding warnings Code Label Value 2015 Volume index Volume 2016 Price index Value 2016 20000 GROSS VALUE ADDED AT BASIC PRICES")
 1119,8")
35 Indicator A EAA first & second estimates (agricultural income index exercise) IT Country 2016 Year English (en) Language -7,65% INDICATOR A 0 VALUE AT BASIC PRICES aggregation errors 0 GDP Price index (not between 80 and 120) 0 ITEMS aggregation errors 1 INDEXES rounding warnings Code Label Value 2015 Volume index Volume 2016 Price index Value GROSS VALUE ADDED AT BASIC PRICES 32238,9 99, ,6 94, ,6 93, FACTOR INCOME 23299, ,9 94, OPERATING SURPLUS/MIXED INCOME 15966, ,8 90, RENTS AND OTHER REAL ESTATE RENTAL CHARGES TO BE PAID 1497,9 1508,4 100, INTEREST PAID 980,2 966,4 98, INTEREST RECEIVED 0,0 0, ENTREPRENEURIAL INCOME 13488, ,0 89, TOTAL AGRICULTURAL LABOUR INPUT (IN 1000 AWU) 1119,8 1139,1 101, NON SALARIED AGRICULTURAL LABOUR INPUT (IN 1000 AWU) 771,0 779,5 101, SALARIED AGRICULTURAL LABOUR INPUT (IN 1000 AWU) 348,8 359,6 103, PRICE INDEX OF GDP 100,95 Indicator A = ((22095,9 / (100,95/100))/23299,4)/(1139,1/1119,8)-1 = - 0,0765 Value index
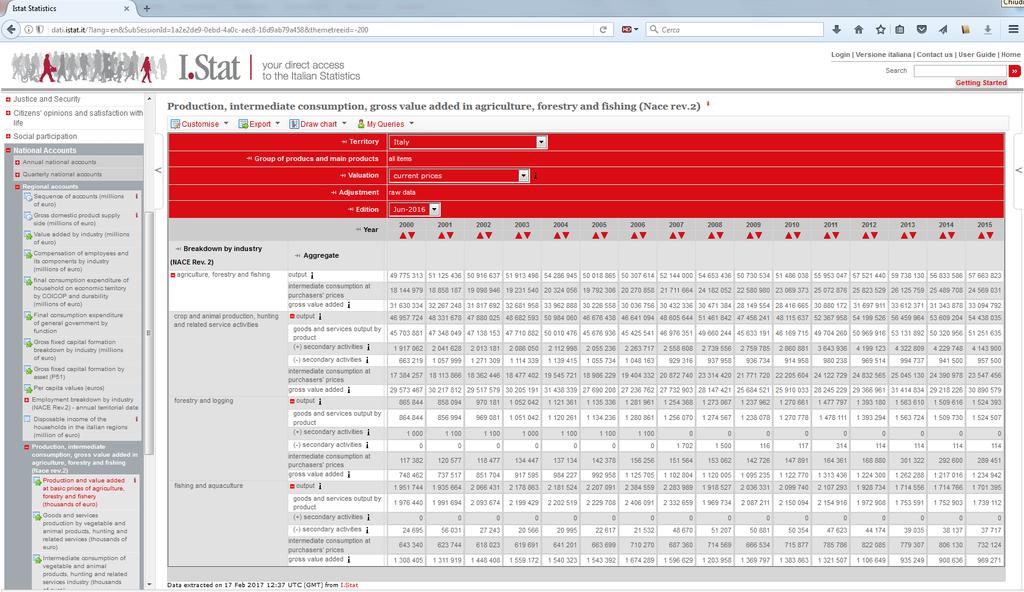
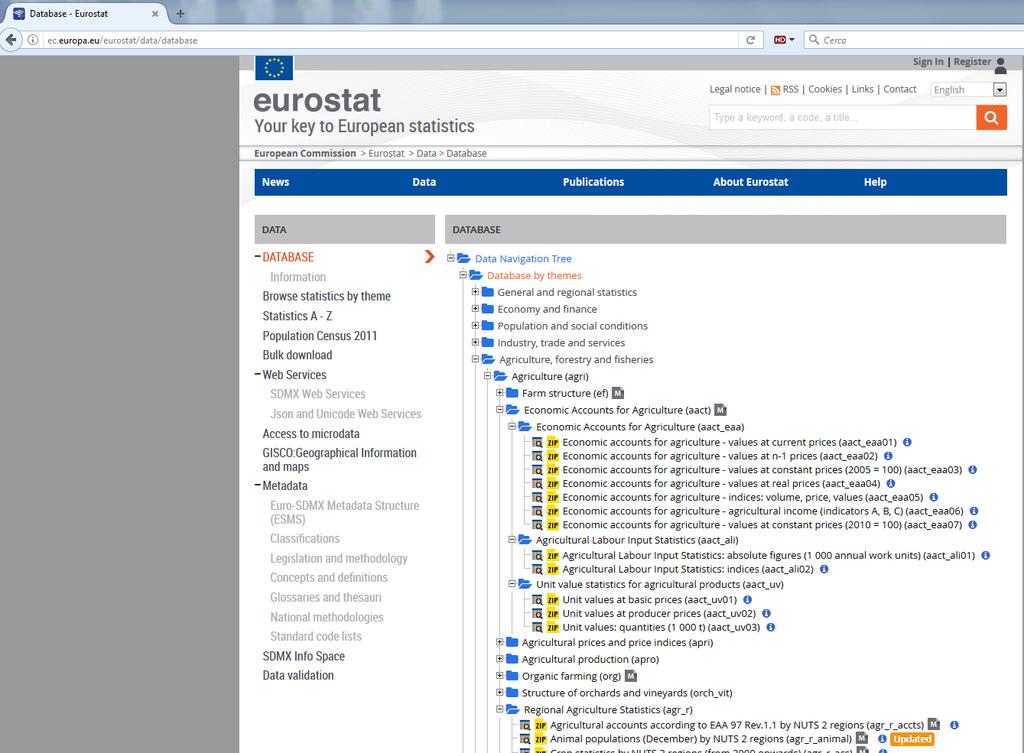
36 How to find Agriculture National Accounts data Istat datawarehouse ( National Accounts Regional Accounts Production, intermediate consumption, gross value added in agriculture, forestry and fishing (Nace rev.2) Eurostat database ( Agriculture, forestry and fisheries Economic Accounts for Agriculture Agricultural Labor Input Statistics Unit value statistics for agricultural products Regional Agricultural Statistics Agricultural accounts according to EAA 97 by NUTS 2 regions
37
38
39 Thank you Domenico Ciaccia Roberto Moro
ECONOMIC ACCOUNTS FOR AGRICULTURE FOR 2017 (FIRST ESTIMATION)
") ECONOMIC ACCOUNTS FOR AGRICULTURE FOR 2017 (FIRST ESTIMATION) According to the first estimate of Economic Accounts for Agriculture the final output at basic prices 1 in 2017 amounted to 7 700.1 million
ECONOMIC ACCOUNTS FOR AGRICULTURE FOR 2017 (FIRST ESTIMATION) According to the first estimate of Economic Accounts for Agriculture the final output at basic prices 1 in 2017 amounted to 7 700.1 million
ECONOMIC ACCOUNTS FOR AGRICULTURE FOR 2018 (FIRST ESTIMATION)
") ECONOMIC ACCOUNTS FOR AGRICULTURE FOR 2018 (FIRST ESTIMATION) According to the first estimate of Economic Accounts for Agriculture the final output at basic prices 1 in 2018 amounted to 8 077.2 million
ECONOMIC ACCOUNTS FOR AGRICULTURE FOR 2018 (FIRST ESTIMATION) According to the first estimate of Economic Accounts for Agriculture the final output at basic prices 1 in 2018 amounted to 8 077.2 million
OVERVIEW OF AGRICULTURAL STATISTICS IN LITHUANIA Legislative and institutional settings
 OVERVIEW OF AGRICULTURAL STATISTICS IN LITHUANIA Legislative and institutional settings Aušra Jablonskienė Head of Agriculture and Environment Statistics Division INSTITUTIONAL FRAMEWORK Statistics Lithuania
E U R O P E A N U N I O N
 May 2018 Statistical Factsheet E U R O P E A N U N I O N CONTENTS Key figures EU-28 1. POPULATION & ECONOMY 2. FINANCIAL ASPECTS 3. ECONOMIC ACCOUNTS 4. AGRICULTURAL TRADE 5. FARM STRUCTURE 1 2-5 6-8 9-16
agriculture, forestry & fisheries Department: Agriculture, Forestry and Fisheries REPUBLIC OF SOUTH AFRICA
 2014 agriculture, forestry & fisheries Department: Agriculture, Forestry and Fisheries REPUBLIC OF SOUTH AFRICA Economic Review of the South African Agriculture 2014 DEPARTMENT OF AGRICULTURE, FORESTRY
PRICE INDICES IN AGRICULTURE, FIRST QUARTER OF
 PRICE INDICES IN AGRICULTURE, FIRST QUARTER OF 2018 1 Producer price indices in agriculture The producer price index in agriculture in the first quarter of 2018 decreased by 7.4% in comparison with the
PRICE INDICES IN AGRICULTURE, THIRD QUARTER OF
 PRICE INDICES IN AGRICULTURE, THIRD QUARTER OF 2017 1 Producer price indices in agriculture The producer price index in agriculture in the third quarter of 2017 increased by 3.6% in comparison with the
Economic Review. South African Agriculture. of the DEPARTMENT OF AGRICULTURE, FORESTRY AND FISHERIES
 Economic Review of the South African Agriculture 2018 DEPARTMENT OF AGRICULTURE, FORESTRY AND FISHERIES Compiled by the Directorate: Statistics and Economic Analysis, Private Bag X246, PRETORIA 0001 Published
ANNEXES. to the Proposal for a REGULATION OF THE EUROPEAN PARLIAMENT AND OF THE COUNCIL
 EUROPEAN COMMISSION Brussels, 9.12.2016 COM(2016) 786 final ANNEXES 1 to 5 ANNEXES to the Proposal for a REGULATION OF THE EUROPEAN PARLIAMENT AND OF THE COUNCIL on integrated farm statistics and repealing
Farm structure in Malta
 Agriculture and fisheries Authors: Maria BERGUA, Pol MARQUER, Carla MARTINS Statistics in focus 73/2008 Farm structure in Malta - 2007 Increase in the number of horticultural holdings: 39% from 2005 to
Crop Statistics in Germany
 Crop Statistics in Germany Follow up regional workshop on crop statistics Zagreb, 17 18 April 2008 Ute Walsemann Head of Subdivision Land use and Crop statistics Federal Statistical Office of Germany Federal
Appendix 2 Description of EU Farm Typology Classification System
 Appendices Appendix 2 Description of EU Farm Typology Classification System Introduction The EU Farm Typology Classification System was developed in order to identify and classify relatively homogeneous
in focus Statistics Farm structure in Austria 2005 Contents One-third of the holders are women AGRICULTURE AND FISHERIES 11/2007 Agriculture
 Statistics in focus AGRICULTURE AND FISHERIES Agriculture 11/2007 Authors György BENOIST Pol MARQUER Contents Table 1 Labour force by size of the farms 3 Table 2 Agricultural holdings by size.4 Table 3
A European Food Prices Monitoring Tool
 EUROPEAN COMMISSION EUROSTAT Directorate G: Business Statistics Unit G-6: Price statistics Luxembourg, October 2009 A European Food Prices Monitoring Tool A first design A European Food Prices Monitoring
Agriculture in National Accounts: Value added in current and constant prices 1
 Agriculture in National Accounts: Value added in current and constant prices 1 Introduction This paper continues the series dedicated to extending the contents of the Handbook Essential SNA: Building the
Minimum Core Data Set
 Global Strategy IMPROVING AGRICULTURAL AND RURAL STATISTICS IN ASIA PACIFIC Minimum Core Data Set Regional Office for the Asia-Pacific Regional Action Plan to Improve Agricultural and Rural Statistics
Agriculture and Food Industry
 Agriculture and Food Industry Data from the year under review 26 Saxony Data from the year under review 26 AREA AND POPULATION UTILIZATION OF LAND AREA Total area 1, ha 1,842 35,75 Agricultural area 1,
Israel. Agriculture. Account
 NIS billion Israel 35 1: AGRICULTURE ACCOUNT 2015 30 Agriculture Livestock 25 and livestock products 20 12.3 Depreciation 2.3 15 Excl. compensation 10 Crops for 17.2 employee jobs(1) 5 17.4 0 Account Agricultural
Global Strategy. Session 1.2: Minimum Set of Core Data Items. Module 1: Sampling in the Context of the Global Minimum Set of Core Data Items
 Global Strategy IMPROVING AGRICULTURAL AND RURAL STATISTICS IN ASIA PACIFIC Module 1: Sampling in the Context of the Global Minimum Set of Core Data Items Session 1.2: Minimum Set of Core Data Items 13
Agriculture in Bulgaria
 Agriculture in Bulgaria Situation and development of the national economy Economy of Bulgaria in 2007 the first year as a Member State of the European Union is economically stable and there is an increase
Summary. Scope. Summary
 33 The objective of the Yearbook of Agricultural Statistics is to compile a manageable portion of the available statistics relating to agriculture and food. The main part of the yearbook covers agriculture
ESS AGREEMENT ON ANNUAL CROP STATISTICS: ADDITIONAL CROP VARIABLES AND EARLY ESTIMATES
 ESS AGREEMENT ON ANNUAL CROP STATISTICS: ADDITIONAL CROP VARIABLES AND EARLY ESTIMATES 1. Introduction The present document shall be regarded as a European Statistical System (ESS) Agreement within the
Official Journal of the European Union
 L 190/8 COMMISSION REGULATION (EU) No 715/2014 of 26 June 2014 amending Annex III to Regulation (EC) No 1166/2008 of the European Parliament and of the Council on farm structure surveys and the survey
This document is meant purely as a documentation tool and the institutions do not assume any liability for its contents
 2004R0138 EN 01.04.2011 004.001 1 This document is meant purely as a documentation tool and the institutions do not assume any liability for its contents B REGULATION (EC) No 138/2004 OF THE EUROPEAN PARLIAMENT
Summary. Scope. 1 Summary 27
 1 Summary 27 Summary The objective of the Yearbook of Agricultural Statistics is to compile a manageable portion of the available statistics relating to agriculture and food. The main part of the yearbook
Ministry of Agriculture THE HUNGARIAN AGRICULTURE AND FOOD INDUSTRY IN FIGURES
 Ministry of Agriculture THE HUNGARIAN AGRICULTURE AND FOOD INDUSTRY IN FIGURES 2016 Preface The common professional publication of the Research Institute of Agricultural Economics, the Ministry of Agriculture
Producer price index 1998/99 to 2002/03 (July to June) / / / / /03 Year
 / / / / /03 Year") Economic review for the 12 months that ended on 30 June 2003 Volume of agricultural production During 2002/03, the estimated total volume of agricultural production was 3 % lower than during 2001/02. As
Economic review for the 12 months that ended on 30 June 2003 Volume of agricultural production During 2002/03, the estimated total volume of agricultural production was 3 % lower than during 2001/02. As
Variability of the global warming potential and energy demand of Swiss cheese
 Federal Department of Economic Affairs FDEA Agroscope Reckenholz-Tänikon Research Station ART Variability of the global warming potential and energy demand of Swiss cheese Thomas Nemecek, Martina Alig,
Contents of the 2018 (48 th ) Edition
 Edition") Contents of the 2018 (48 th ) Edition Published September 2017 CONTENTS I. GENERAL 1 PAGE 1. The Use of Gross Margins 1 2. Complete Enterprise Costings 2 3. Farm Business Survey Data 3 4. Main Assumptions
Contents of the 2018 (48 th ) Edition Published September 2017 CONTENTS I. GENERAL 1 PAGE 1. The Use of Gross Margins 1 2. Complete Enterprise Costings 2 3. Farm Business Survey Data 3 4. Main Assumptions
PRICES OF COMMODITY PRODUCTS
 PRICES OF COMMODITY PRODUCTS The gross farm value of the commodities reported in the parish tables was computed based upon estimated annual per-unit prices. The state average prices listed below were used
ARGENTINA S COMMENTS ON AGRICULTURE, FORESTRY, FISHING AND RELATED SERVICE ACTIVITIES. Based on ISIC rev.4
 ARGENTINA S COMMENTS ON AGRICULTURE, FORESTRY, FISHING AND RELATED SERVICE ACTIVITIES Based on ISIC rev.4 For the meeting to be held from 14 February to 18 February 2005 1 THE OPENINGS THAT MAKE UP THE
Glossary Agricultural holding
 13 AGRICULTURE On the basis of the latest available data, there were about 243,141 operational agricultural holdings in Sicily in 2009, employing 126,374 units of work, 25,716 of which as dependent worker.
11.O. Hungary and Poland. Martin Banse
 11.O Hungary and Poland Martin Banse 11.O.1 Introduction This document describes the procedure followed in compiling input-output tables of Hungary and Poland for version 5 of the GTAP data base. The input-output
Overview of Global Strategy Minimum Core Data Set requirements
 Global Strategy IMPROVING AGRICULTURAL AND RURAL STATISTICS IN ASIA PACIFIC Overview of Global Strategy Minimum Core Data Set requirements Allan Nicholls, Regional Coordinator Workshop on Statistical Capacity
Guidance note G Baseline indicators fiches
 Guidance note G Baseline s fiches This guidance note presents the "fiches" of common baseline s. The purpose of the fiches is to provide information concerning: the measurement of the and of the sub-s
1. LEGAL STATUS OF THE FARM (to confirm, write ``x``)
") 69 1 LEGAL STATUS OF THE FARM (to confirm write ``x``) 1 LEGAL PERSON 3 FAMILY FARM (OPG) 2 FARM INFORMATION (to confirm write ``x``) 4 Farm is no longer engaged in agricultural production 8 Other (out
69 1 LEGAL STATUS OF THE FARM (to confirm write ``x``) 1 LEGAL PERSON 3 FAMILY FARM (OPG) 2 FARM INFORMATION (to confirm write ``x``) 4 Farm is no longer engaged in agricultural production 8 Other (out
EU agricultural income 2014 first estimates
 EU Agricultural and Farm Economics Briefs No 3 December 2014 EU agricultural income 2014 first estimates Contents 1. EU-28 agricultural income down by 1.7% 2. Crop output value most affected in 2014 3.
Deciding Minimum Set of Core Data at national and global level
 Global Strategy IMPROVING AGRICULTURAL AND RURAL STATISTICS IN ASIA PACIFIC Item 5 Deciding Minimum Set of Core Data at national and global level Allan Nicholls, Regional Coordinator Orientation Programme
Organic versus conventional farming, which performs better financially?
 Farm Economics Brief No 4 November 2013 Organic versus conventional farming, which performs better financially? An overview of organic field crop and milk production in selected Member States Contents
The European Commission s science and knowledge service. Scene-setter on jobs and growth in EU agri-food sector. Joint Research Centre
 The European Commission s science and knowledge service Joint Research Centre Scene-setter on jobs and growth in EU agri-food sector Emanuele Ferrari Alfredo J. Mainar Causapé With contributions from T.
A brief focus on Georgia s agricultural industry
 A brief focus on Georgia s agricultural industry 2010 Total Farm Gate Value $200,000,000 - $475,048,630 $80,000,000 - $200,000,000 $45,000,000 - $80,000,000 $20,000,000 - $45,000,000 $313,000 - $20,000,000
Economic Contributions of Agriculture, Natural Resources and Food Industries in Polk County, Florida
 Economic Contributions of Agriculture, Natural Resources and Food Industries in Polk County, Florida Sponsored Project Report to Polk County, Florida Farm Bureau Alan W. Hodges, Ph.D., Extension Scientist
ACTUAL PROBLEMS OF THE STRUCTURAL REFORM IN BULGARIAN AGRICULTURE
 ORIGINAL PAPER ACTUAL PROBLEMS OF THE STRUCTURAL REFORM IN BULGARIAN AGRICULTURE D. Lulcheva 1, Stela Atanasova Todorova 2 1 Department of Management and Marketing, University of Agriculture, Bulgaria
Agricultural statistics
 agricultural 1995 2004 PR.indd 1 17-01-2006 10:43:06 2 0 0 6 E D I T I O N Agricultural statistics Data 1995-2004 E U R O P E A N COMMISSION THEME Agriculture and fisheries agricultural 1995 2004 PR.indd
Enterprise Budgeting... 1 Crop Inputs Introduction... 46
 Contents Enterprise Budgeting... 1 Crop Inputs... 3 Introduction... 4 Fertiliser... 4 Lime... 4 Slurry and Manure... 4 Nutrient Planning... 6 Residual Values of Fertilisers, Manures and Lime... 8 Pesticide
Market opportunities for Queensland agribusiness from FTAs with China, Japan and South Korea. Queensland Production
 Market opportunities for Queensland agribusiness from FTAs with China, Japan and South Korea Queensland Production Scope Australia recently signed Free Trade Agreements (FTAs) with China (June 2015), Japan
11.F. Taiwan. Hsing-Chun Lin, Lin-Chun Chung and Ruey-Wan Liou. References
 11.F Taiwan Hsing-Chun Lin, Lin-Chun Chung and Ruey-Wan Liou This documentation outlines the main procedure followed by the Directorate-General of Budget, Accounting and Statistics (DGBAS), Executive Yuan,
Economic Impacts of Connecticut s Agricultural Industry Update 2015
 Economic Impacts of Connecticut s Agricultural Industry Update 2015 Presented to The Connecticut Farm Bureau Association on February 16, 2017 The Connecticut Department of Agriculture on March 10, 2017
Chapter 23: Classifications
 Chapter 23: Classifications Regrouping and coding of industries (A) and products (P) The classifications of activities and products to be used are NACE Rev. 2 and CPA 2008. The corresponding aggregations
Kosovo*: Agricultural Policy Development and Assessment ( )
") 2 nd Interim Meeting: NATIONAL POLICY INSTRUMENTS AND EU APPROXIMATION PROCESS: EFFECTS ON FARM HOLDINGS IN THE WESTERN BALKAN COUNTRIES (EUEWB) Kosovo*: Agricultural Policy Development and Assessment
2 nd Interim Meeting: NATIONAL POLICY INSTRUMENTS AND EU APPROXIMATION PROCESS: EFFECTS ON FARM HOLDINGS IN THE WESTERN BALKAN COUNTRIES (EUEWB) Kosovo*: Agricultural Policy Development and Assessment
Chapter 9: Economic Geography, Agriculture and Primary Activities
 Chapter 9: Economic Geography, Agriculture and Primary Activities Oil tanker indicating increasing economic interdependence Categories of Activities Primary Activities: related to harvesting or extracting
Minimum Core Data Set
 Minimum Core Data Set Dalip Singh Statistician Regional Office for the Asia-Pacific Regional Action Plan to Improve Agricultural and Rural Statistics 1 Background The Global Strategy describes three pillars
UTILIZATION OF AGRICULTURAL RESIDUES FOR BIOENERGY IN TURKEY
 Cereals straw and agricultural residues for bioenergy in New Member States and Candidate Countries UTILIZATION OF AGRICULTURAL RESIDUES FOR BIOENERGY IN TURKEY Dr. H. Huseyin Ozturk University of Cukurova
Appendix B. General Explanation and Report Form
 Appendix B. General Explanation and Report Form DEVELOPMENT OF THE REPORT FORM Planning for the NASS organic production survey began in the fall of 2013. Report form content was developed with individuals
ECONOMIC. Impact of Arkansas Agriculture
 ECONOMIC Impact of Arkansas Agriculture 2010 Contents Total Impact... 4 Arkansas Counts on Agriculture... 8 The Natural State... 10 Crops Sector... 14 Strength in Diversity... 16 Animal Agriculture Sector...
AGRIBUSINESS OPPORTUNITIES
 AGRIBUSINESS OPPORTUNITIES MINISTRY OF AGRICULTURE AGRICULTURE PROMOTION CENTRE (CEPAGRI) 1 Content Introduction: Mozambique s economy & agricultural sector Principal crops Market Opportunities Agri-businesses
Austria - European Union Farm Structure Survey 1999/2000 Main Results
 Austria - European Union Farm Structure Survey 1999/2000 Main Results Number and total area of holdings Number of holdings Total area (ha) Total 199 470 6 804 610 Number and total area of holdings by size
Nitrogen Mass Flow in China s Animal Production System and Environmental Implications
 Nitrogen Mass Flow in China s Animal Production System and Environmental Implications Fanghao Wang, Zhengxia Dou, Lin Ma, Wenqi Ma, J. T. Sims, and Fusuo Zhang Supplementary Table S1. Original data and
Table 1 shows the general form of China 2010 I-O Table:
 China Liu Yu 1 and Jie Chen The original 2010 Input-Output Table doesn t have multi-product sector. After some adjustments, the data tables are reclassified and re-balanced to provide the matrices required
STATISTICS IN FOCUS Agriculture, forestry and fisheries
 1996 Π 8 STATISTICS IN FOCUS Agriculture, forestry and fisheries ISSN 1024-4263 TRENDS IN THE EU AGRICULTURAL PRICE INDICES (OUTPUT AND INPUT) IN 1995 Producer prices of agricultural products (Output)
STATISTICAL PROFILE OF HALIFAX AND HANTS COUNTIES. Prepared By: Nova Scotia Federation of Agriculture
 STATISTICAL PROFILE OF HALIFAX AND HANTS COUNTIES Prepared By: Nova Scotia Federation of Agriculture 1.0 Introduction Agriculture in the Local Economy Agriculture in Halifax and Counties are characterized
Swiss agriculture, agricultural policy and biodiversity
 Department for Economic Affairs DEA Federal Office for Agriculture FOA Swiss agriculture, agricultural policy and biodiversity BioBio, Engelberg, 21 June 2012 Dominique Kohli, Assistant Director of the
Identifying Investment Priorities for Malawian Agriculture
 Identifying Investment Priorities for Malawian Agriculture Rui Benfica (IFAD) and James Thurlow (IFPRI) Presentation to the Ministry of Agriculture, Irrigation and Water Development Lilongwe, 8 February
Direct support scheme in Kosovo*
 NATIONAL POLICY INSTRUMENTS AND EU APPROXIMATION PROCESS: EFFECTS ON FARM HOLDINGS IN THE WESTERN BALKAN COUNTRIES (EUEWB) Direct support scheme in Kosovo* Mihone Kerolli-Mustafa, PhD *Kosovo "This designation
Belarus. Irina Tochitskaya. 1. Source Data
 Belarus Irina Tochitskaya The Belarusian input-output (I-O) table in the GTAP 7 p4 Data Base was constructed from inputoutput tables and some supporting data supplied by the Ministry of Statistics and
Site specific enterprise planning and implementation for developing farming system model
 Site specific enterprise planning and implementation for developing farming system model L E C T U R E 7 S S R A N A S R S C I E N T I S T Determinants of Farming Systems Natural Resources and Climate
STATISTICAL PROFILE OF COLCHESTER COUNTY. Prepared By: Nova Scotia Federation of Agriculture
 STATISTICAL PROFILE OF COLCHESTER COUNTY Prepared By: Nova Scotia Federation of Agriculture 1.0 Introduction Agriculture in the Local Economy Agriculture in County is characterized by a diversity of farm
Producer Price Index in Iran Dey 1397
 (December 22, 2018 - January 20, 2019) Central Bank of the Islamic Republic of Iran General Directorate of Economic Statistics (December 22, 2018 - January 20, 2019) (1395 = 100) Economic Statistics Bahman
Bulletin No October 18, Broadway, Suite 900 Oakland, CA Fax
 WCIRB Bulletin Bulletin 2017-21 October 18, 2017 1221 Broadway, Suite 900 Oakland, CA 94612 415.777.0777 Fax 415.778.7007 www.wcirb.com wcirb@wcirb.com Revised Standard Endorsement Form Farm Schedule Endorsement
Lowland cattle and sheep farms, under 100 hectares
 GROSS OUTPUT, VARIABLE COSTS AND FARM GROSS MARGIN, 2003/2004 Output Milk 0 0 Milk quota leasing, milk levy and compensation 0 0 Cattle 280 415 Herd depreciation -1 8 Cattle subsidies 135 211 Sheep 127
STATISTICS IN FOCUS Agriculture, forestry and fisheries
 L STATISTICS IN FOCUS Agriculture, forestry and fisheries 1996D1 ISSN 1024-4263 TRENDS IN THE EU AGRICULTURAL PRICE INDICES (OUTPUT AND INPUT) IN THE THIRD QUARTER OF 1995 Notice This is the first Statistics
Census of commercial agriculture, 2007 Mpumalanga Provincial statistics for selected products
 Census of commercial agriculture, 2007 Mpumalanga Provincial statistics for selected products Report No. 11-02-09 (2007) i Census of commercial agriculture, 2007 - Mpumalanga / Statistics South Africa
Saskatchewan remains the breadbasket of Canada
 Catalogue no. 95-640-X Saskatchewan remains the breadbasket of Canada Release date: May 10, 2017 How to obtain more information For information about this product or the wide range of services and data
European Union. Directorate-General for Agriculture and Rural Development AGRICULTURE IN THE EUROPEAN UNION STATISTICAL AND ECONOMIC INFORMATION
 European Union Directorate-General for Agriculture and Rural Development AGRICULTURE IN THE EUROPEAN UNION STATISTICAL AND ECONOMIC INFORMATION 2011 March 2012 Foreword Each year the Commission Directorate-
EU milk margin index estimate up to 2018
 EU Agricultural and Farm Economics Briefs No 17 December 2018 EU milk margin index estimate up to 2018 An overview of estimates of of production and gross margin indexes of milk production in the EU Contents
SDA cattle and sheep farms, 120 hectares and over
 GROSS OUTPUT, VARIABLE COSTS AND FARM GROSS MARGIN, 2003/2004 Output Milk 0 0 Milk quota leasing, milk levy and compensation 0 0 Cattle 138 160 Herd depreciation -12-16 Cattle subsidies 92 101 Sheep 131
Statistics of Food Grain Stocks in Ukraine
 Review of Ukrainian Grain Statistics Statistics of Food Grain Stocks in Ukraine O. Prokopenko Director Department of Agriculture and Environment Statistics 214 OLGA MARTYNIUK Senior Specialist of the Department
France - European Union Farm Structure Survey 1999/2000 Main Results
 France - European Union Farm Structure Survey 1999/2000 Main Results Number and total area of holdings Number of holdings Total area (ha) Total 663 810 29 897 670 Number and total area of holdings by size
Landscape of global agrofood GVCs: the place of China
 Landscape of global agrofood GVCs: the place of China OECD-ATPC-ICTSD Workshop Agro-Food Global Value Chains and Farm Policy: The place of China Dr Jared Greenville, Senior Agriculture Policy Analyst,
PLANT ENTERPRISES PRODUCTION
 Crop PLANT ENTERPRISES PRODUCTION Acres Yield per Acre FORESTRY Pulpwood Hardwood 1,622 cords Pulpwood () 1,622 Saw Timber Hardwood 1,119,782 board feet Saw Timber () 1,119,782 Pulpwood, Chip & Saw, $569,010
NACE: Statistical Classification of Economic Activities
 NACE: Statistical Classification of Economic Activities NACE Rev.1 : To use until the 2008 operation included Section A Agriculture, hunting and forestry 01 Agriculture, hunting and related service activities
301. Definitions. When used in this article: (see 13 below ) 1. "Agricultural assessment value" means the value per acre assigned to land for
 1. Agricultural assessment value means the value per acre assigned to land for") 301. Definitions. When used in this article: (see 13 below ) 1. "Agricultural assessment value" means the value per acre assigned to land for assessment purposes determined pursuant to the capitalized
301. Definitions. When used in this article: (see 13 below ) 1. "Agricultural assessment value" means the value per acre assigned to land for assessment purposes determined pursuant to the capitalized
The output of Environmental Goods and Services Sector in Poland
 Broniewicz E. (2016), The of Environmental Goods and Services Sector in Poland, Journal of International Studies, Vol. 9, No 3, pp. 53-61. DOI: 10.14254/2071-8330.2016/9-3/4 The of Environmental Goods
INDONESIA. Sectoral Activities Department. Agriculture. Fig. 1: Employment by Major Economic Activity ('000s)
") INDONESIA 100,000 80,000 60,000 40,000 20,000 2,500,000 2,000,000 1,500,000 1,000,000 500,000 0 0 Fig. 1: Employment by Major Economic Activity ('000s) 2000-2008 2000 2002 2004 2006 2008 Fig. 2: Sectoral
INDONESIA 100,000 80,000 60,000 40,000 20,000 2,500,000 2,000,000 1,500,000 1,000,000 500,000 0 0 Fig. 1: Employment by Major Economic Activity ('000s) 2000-2008 2000 2002 2004 2006 2008 Fig. 2: Sectoral
EU Milk Margin Estimate up to 2015
 Ref. Ares(2016)5774609-05/10/2016 EU Agricultural and Farm Economics Briefs No 13 September 2016 EU Milk Margin Estimate up to 2015 An overview of estimates of of production and gross margins of milk production
6.1 Direct Requirements Coefficients
 Chapter 6 Data Base Summary: Input-Output Multipliers Betina V. Dimaranan and Robert A. McDougall For many purposes it is useful to know the answer to the following question: If the final demand for a
DRAFT. Uses Allowed in Farm Zones Supportive of the Agricultural Industry. Farm Use - ORS /308A.056:
 DRAFT Uses Allowed in Farm Zones Supportive of the Agricultural Industry [Prepared by Ronald Eber, Farm and Forest Lands Specialist, DLCD] [May 2006] Farm Use - ORS 215.203/308A.056: The definition of
Rural NYS II. Agriculture. Farmland in NYS. Top AgCounties (receipts) Grape Regions. Pumpkins. New York is an Agricultural State
 Grape Regions. Pumpkins. New York is an Agricultural State") Farmland in NYS Rural NYS II Agriculture Prof. Anthony Grande AFG 2012 New York is an Agricultural State Top AgCounties (receipts) NATIONAL RANK COMMODITY 26 Tot. Value, Agric Products 2 Pumpkins 2 Apples
Farmland in NYS Rural NYS II Agriculture Prof. Anthony Grande AFG 2012 New York is an Agricultural State Top AgCounties (receipts) NATIONAL RANK COMMODITY 26 Tot. Value, Agric Products 2 Pumpkins 2 Apples
China. Li Shantong and He Janus Data Source. 2. Sector Classification
 China Li Shantong and He Janus 1 1. Data Source The source of the initial input-output (I-O) table for China is "Input-Output Table of China - 2002 from the Department of National Economy Accounting, State
THE AGRICULTURE AND FOOD INDUSTRY IN RUSSIA: 2015 FACTS AND FIGURES
 THE AGRICULTURE AND FOOD INDUSTRY IN RUSSIA: 2015 FACTS AND FIGURES 2016, April. Russian Direct Investment Fund TABLE OF CONTENTS 4 18 32 RUSSIA IN THE GLOBAL AGRICULTURE AND FOOD INDUSTRY THE AGRICULTURE
Special Seminar on Food Security: Focusing on Water management and Sustainable Agriculture
 Special Seminar on Food Security: Focusing on Water management and Sustainable Agriculture Kyi Myint Ministry of Agriculture and Irrigation Location Latitude 9 58-28 31 N Longitude 92 9-100 10 E Country
CHAPTER 8. Agriculture and the Malaysian Economy
 CHAPTER 8 Agriculture and the Malaysian Economy 8.1 Contribution of agriculture to the gross domestic product (GDP) Agriculture is part of the primary sector in the Malaysian economy which contributes
The Republic of Armenia Food Balance Sheets Presentation
 The Republic of Armenia Food Balance Sheets Presentation Definition of the Food Balance Sheet FOOD BALANCE SHEETS present a comprehensive picture of the pattern of a country's food supply and utilisation,
IMPORTANCE OF CAP REFORMS FOR THE DUTCH AGRICULTURAL SECTOR IN Andrzej Tabeau, Myrna van Leeuwen
 IMPORTANCE OF CAP REFORMS FOR THE DUTCH AGRICULTURAL SECTOR IN 2000-2020 Andrzej Tabeau, Myrna van Leeuwen The Agricultural Economics Research Institute (LEI), The Netherlands Contact: andrzej.tabeau@wur.nl
Application for Agricultural Classification must be made on or before March 1.
 Application for Agricultural Classification must be made on or before March 1. Please submit the signed and dated application as well as the supplemental form to: Akin Akinyemi Leon County Property Appraiser
INTERNATIONAL TRADE ANALYSIS
 October Period analysed: 211 INTERNATIONAL TRADE ANALYSIS International trade of agricultural and fisheries sector: 211 INTERNATIONAL TRADE EVOLUTION (millon ) 29 21 211 26-1 ( Five year Total annual Total
EU Milk Margin Estimate up to 2013
 Farm Economics Brief No 5 April 2014 EU Milk Margin Estimate up to 2013 An overview of estimates of of production and gross margins of milk production in the EU Contents Need for monitoring milk margin
New York Direct Marketing Association Model Zoning for Roadside Stands and Farm Markets. Permitted Uses. Definitions
 New York Direct Marketing Association Model Zoning for Roadside Stands and Farm Markets Permitted Uses The following sections contain proposed language that would incorporate into a zoning ordinance, as
Agricultural reform in Uzbekistan
 Agricultural reform in Uzbekistan National team: Dildora Tadjibaeva Igor Pugach Yuliy Yusupov Zafar Berdinazarov Halle, Germany April 2015 www.iamo.de/agriwanet Total area - 448,978 square kilometer -
GENERAL AGREEMENT ON TARIFFS AND TRADE
 GENERAL AGREEMENT ON TARIFFS AND TRADE RESTRICTED L/5102/Add.13 22 January 1982 Limited Distribution Original: English SUBSIDIES Notifications Pursuant AUSTRIA to Article XVI:1 The following communication