What Does the Illinois Nutrient Loss Reduction Strategy Mean for Water Quality in Illinois?
|
|
|
- Ginger Barnett
- 5 years ago
- Views:
Transcription


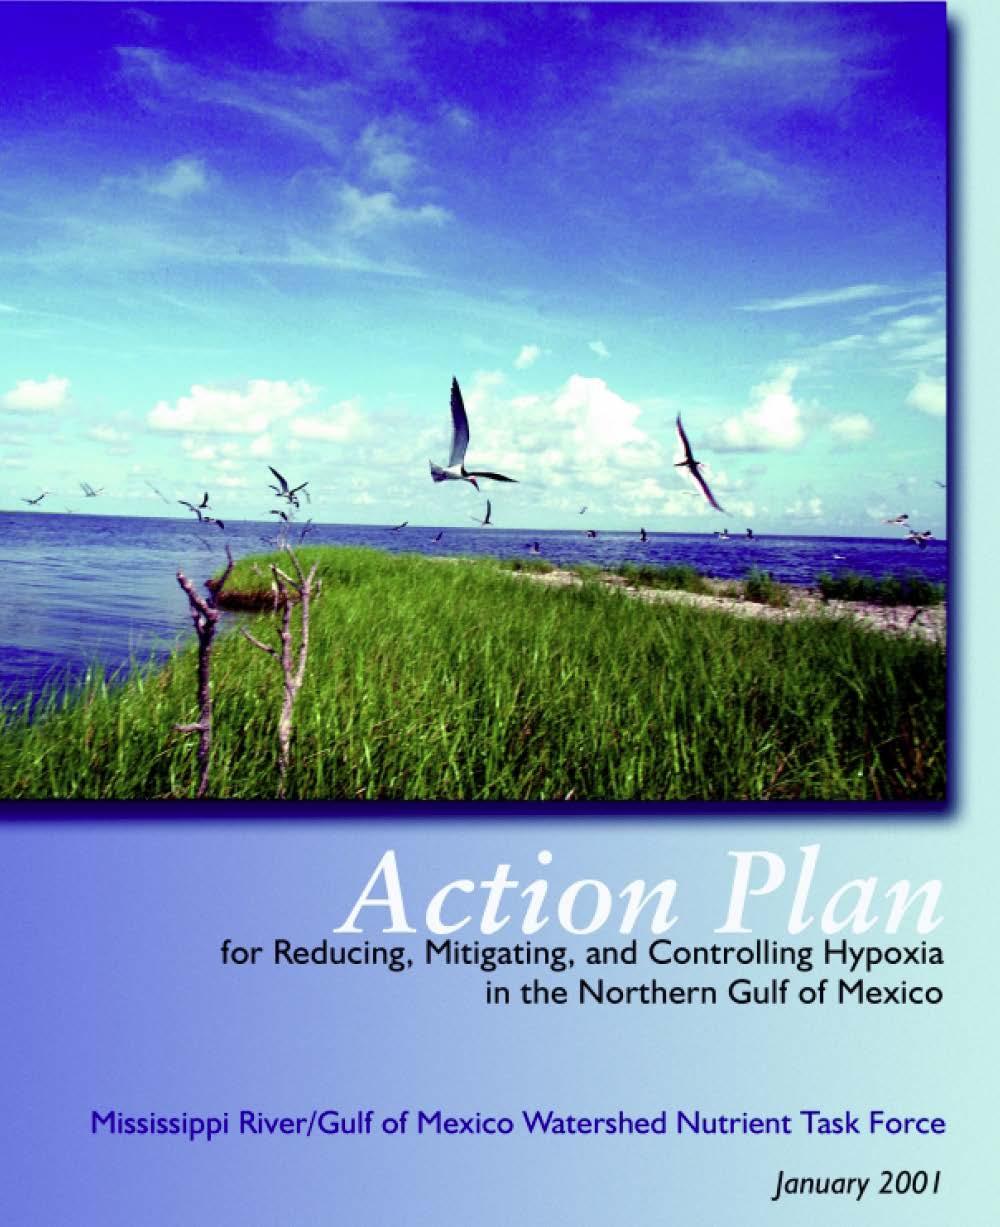
1 What Does the Illinois Nutrient Loss Reduction Strategy Mean for Water Quality in Illinois? Mark B. David University of Illinois at Urbana-Champaign ISTC, December 3,

2 Illinois NLRS USEPA asked all 12 states along Mississippi River to develop led by Dept. of Ag. and IEPA we did science assessment open process to develop 60 day public comment period closed Jan.24 (~1000 comments)


3 Local Water Quality Copper Slough Sangamon River Fisher Jordan Creek North Fork Salt Creek Big Ditch Outlet North Fork Vermilion
4

5


6 Hypoxic zone, 2015
7

8
9 Progress? 2008 Action Plan had target date of 2015 for reaching a 5,000 km 2 dead zone driven by 45% nutrient load reductions on Feb. 12, 2015 new strategies were released extended target date to 2035 to track progress and spur action, 20% reduction in nutrient loads by 2025

10
11

12
13 Science Assessment for NLRS science based technical assessment of: current conditions in Illinois of nutrient sources and export by rivers methods that could be used to reduce these losses and their effectiveness estimates of the costs to reduce nutrient losses to meet local and Gulf of Mexico goals
14 Water and nutrients leaving state are variable Flow (10 12 ft 3 yr -1 ) Nitrate-N or Total P (millions lb N or P yr -1 ) Nitrate-N Total P

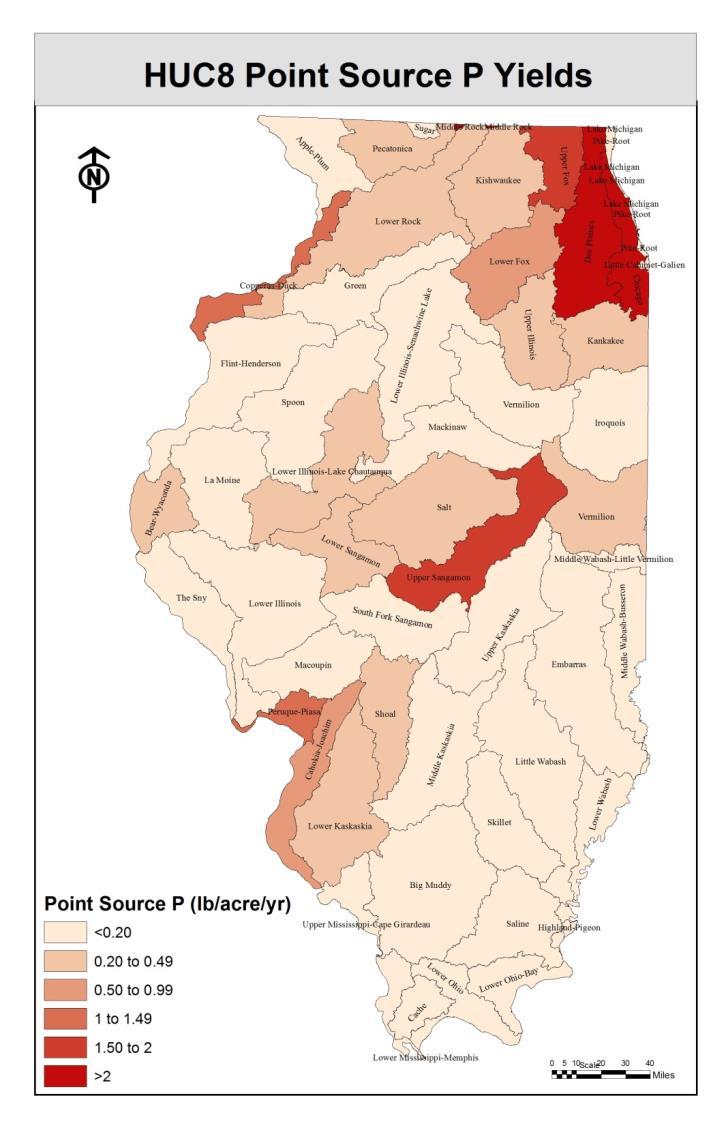
15 Illinois Nutrient Sources 2% Nitrate-N 18% Urban runoff Point sources Agricultural 80%
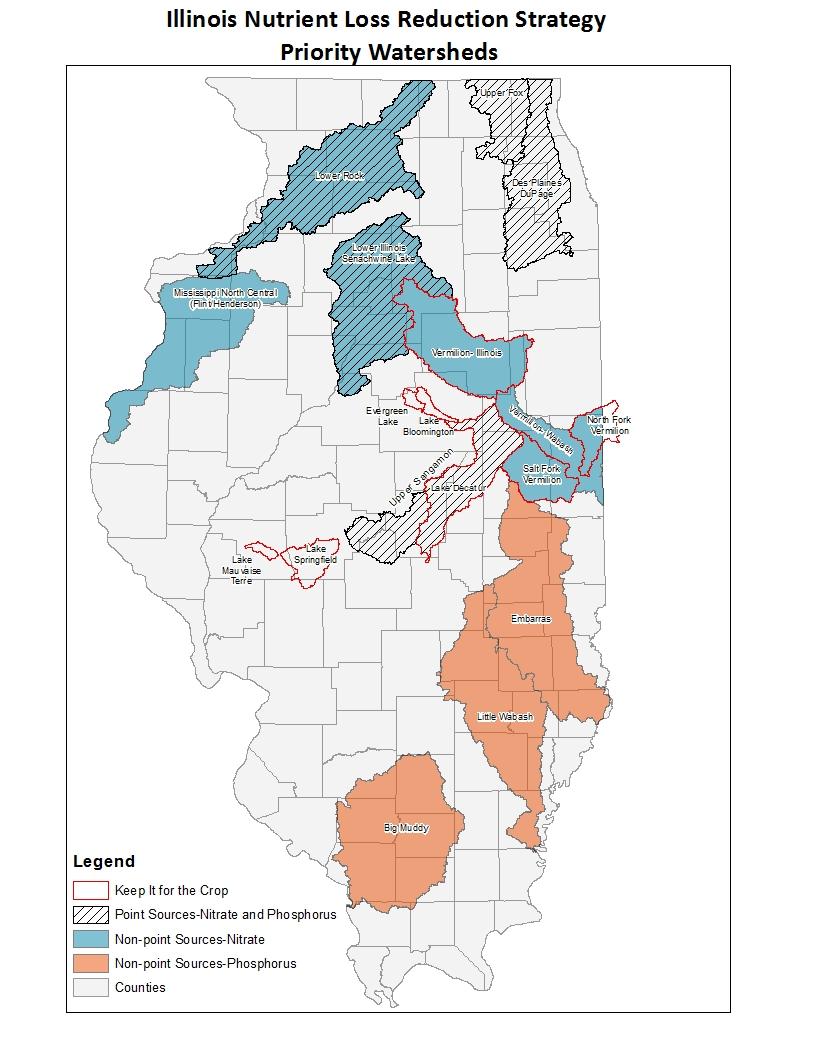
16 Point and agricultural sources Nitrate-N Total P Vermilion Green Rock Illinois Embarras Kaskaskia Little Wabash Big Muddy Illinois-All Goal Point sources Agricultural Goal Riverine Load (million lb N or P yr -1 )
17 Average concentrations of nitrate and total P are quite high Nitrate-N (mg L -1 ) Total P (mg L -1 )
18 Illinois as % of MRB Illinois Nitrate-N or Total P Load as Percent of MRB Nitrate-N Total P
19 Targets call for large reductions 800 Nitrate-N 70 Total P Nitrate-N or Total P Load (million lb N or P yr -1 ) Red line is target, purple is average 1997 to 2011
20

21

22
23


24 Drainage by tiles and ditches

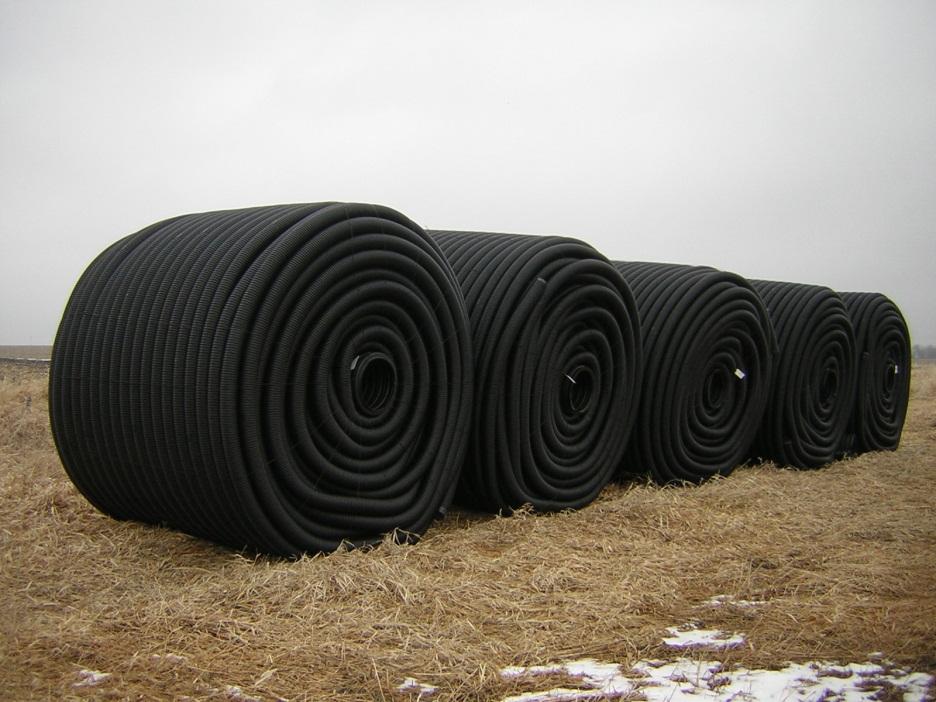
25 Patterned tile systems
26

27 NH 3 Nitrification NO 3 - NO 3

28 Surface Runoff

29
30
 from")
31 Major Land Resource Areas (MLRAs) from NRCS

32 Compiled agricultural data at various scales, combined using GIS to nine MLRAs
33 Agricultural Management by MLRA Combined MLRA Description Corn (acres) Soybean (acres) Wheat (acres) Drained acres (% of crop acres) Corn yield (bushels /acre) Soybean yield (bushels /acre) MLRA 1 MLRA 2 MLRA 3 Northern Illinois drift plain 515, ,186 20, ,491 (39) Northeastern Illinois heavy till plain 1,532,100 1,111,885 42,404 2,063,695 (78) Northern Mississippi Valley 163,507 52,432 1,975 20,942 (10) MLRA 4 Deep loess and drift 5,579,980 3,343,444 76,078 5,437,807 (61) MLRA 5 Claypan 1,609,633 1,991, , ,087 (9) MLRA 6 Thin loess and till 664, , , ,971 (17) MLRA 7 MLRA 8 MLRA 9 Central Mississippi Valley, Northern Part 2,058,853 1,288,686 73,884 1,284,588 (38) Sandstone and shale hills and valleys 83, ,244 10,658 49,565 (25) Central Mississippi Valley, Western Part 203, ,662 78,250 23,769 (5) Sum 12,411,925 9,132, ,460 9,705,916 (43) Average crop acres and yields 2008 through 2012
34 Agricultural N Management by MLRA Combined MLRA Description Estimated corn fertilizer (lbs N/acre/yr) Estimated corn fertilizer + manure (lbs N/acre/yr) Row crops (acres) Nitrate-N yield per row crop acre (lbs N/acre/yr) MLRA 1 MLRA 2 MLRA 3 Northern Illinois drift plain , Northeastern Illinois heavy till plain ,686, Northern Mississippi Valley , MLRA 4 Deep loess and drift ,999, MLRA 5 Claypan ,954, MLRA 6 Thin loess and till ,515, MLRA 7 MLRA 8 MLRA 9 Central Mississippi Valley, Northern Part ,421, Sandstone and shale hills and valleys , Central Mississippi Valley, Western Part , Sum ,361,636
35 Corn Fertilizer N by MLRA Combined MLRA Description Estimated CS fertilizer + manure (lb/acre/yr) MRTN (10 to 1) CS (lb N/acre/yr) Estimated CC fertilizer + manure (lb/acre/yr) MRTN (10 to 1) CC (lb N/acre/yr) MLRA 1 MLRA 2 MLRA 3 Northern Illinois drift plain Northeastern Illinois heavy till plain Northern Mississippi Valley MLRA 4 Deep loess and drift MLRA 5 Claypan MLRA 6 Thin loess and till MLRA 7 MLRA 8 Central Mississippi Valley, Northern Part Sandstone and shale hills and valleys MLRA 9 Central Mississippi Valley, Western Part MRTN is Maximum Return to N
36 Nitrate Yield by MLRA Combined MLRA MLRA 1 MLRA 2 MLRA 3 MLRA 4 Description Northern Illinois Drained cropland (acres) Nitrate-N yield per row crop acre (lb N/acre/yr) Nitrate-N yield per tile drained acre (lb N/acre/yr) Nitrate-N yield from non-tiled land (lb N/acre/yr) drift plain 288, Northeastern Illinois heavy till plain 2,063, Northern Mississippi Valley 20, Deep loess and drift 5,437, MLRA 5 Claypan 310, MLRA 6 Thin loess and till 226, MLRA 7 MLRA 8 MLRA 9 Central Mississippi Valley, Northern Part 1,284, Sandstone and shale hills and valleys 49, Central Mississippi Valley, Western Part 23,
37 Nitrate Yield by MLRA Combined MLRA MLRA 1 MLRA 2 MLRA 3 MLRA 4 Description Northern Illinois Drained cropland (acres) Nitrate-N yield per row crop acre (lb N/acre/yr) Nitrate-N yield per tile drained acre (lb N/acre/yr) Nitrate-N yield from non-tiled land (lb N/acre/yr) drift plain 288, Northeastern Illinois heavy till plain 2,063, Northern Mississippi Valley 20, Deep loess and drift 5,437, MLRA 5 Claypan 310, MLRA 6 Thin loess and till 226, MLRA 7 MLRA 8 MLRA 9 Central Mississippi Valley, Northern Part 1,284, Sandstone and shale hills and valleys 49, Central Mississippi Valley, Western Part 23,
38 Agricultural P Management by MLRA Combined MLRA Description Estimated fertilizer (lb P/acre/yr) Estimated manure (lb P/acre/yr) Row crops (acres) Total P yield per row crop acre (lb P/acre/yr) MLRA 1 MLRA 2 MLRA 3 Northern Illinois drift plain , Northeastern Illinois heavy till plain ,686, Northern Mississippi Valley , MLRA 4 Deep loess and drift ,999, MLRA 5 Claypan ,954, MLRA 6 Thin loess and till ,515, MLRA 7 MLRA 8 MLRA 9 Central Mississippi Valley, Northern Part ,421, Sandstone and shale hills and valleys , Central Mississippi Valley, Western Part , Sum 22,361,636

39 Illinois Transect Survey Soil Loss Estimates

40
41
42 Conservation practices nutrient-use efficiency (4Rs) right source, rate, time, and place in-field management cover crops, drainage water management, buffers strips, perennials off-site measures bioreactors, wetlands, saturated lateral buffers, two stage ditches


43 Agricultural practices then applied by MLRA Tile installation is faster than ever
44 Practice/Scenario Costs per acre Cost Per Acre Notes Reducing N rate from background to the MRTN (10% of acres) Nitrification inhibitor with all fall applied fertilizer on tiledrained corn acres -$8 Reduce N rates (20 pounds) $7 Cost of inhibitor In-field Split (50%) fall and spring (50%) on tile-drained corn acres $17 Additional field pass, switch to N solutions Fall to spring on tile-drained corn acres $18 Switch to N solutions, higher ammonia price, additional application costs Cover crops on all corn/soybean tile-drained acres $29 Aerial applications of cereal rye Cover crops on all corn/soybean non-tiled acres $29 Aerial applications of cereal rye Bioreactors on 50% of tile-drained land $17 Upfront costs of $133 per acre Edge-offield Land use change Wetlands on 25% of tile-drained land $60 5% of farmland out of production Major cost is land ($11,000) Buffers on all applicable crop land (reduction only for water that interacts with active area) Perennial/energy crops equal to pasture/hay acreage from 1987 $294 per buffer acre Land costs plus $50 planting, $10 yearly maintenance $86 Less profit compared to corn-soybean rotation Perennial/energy crops on 10% of tile-drained land $86 Less profit compared to corn-soybean rotation
45 P Reduction Practices Reduce tillage: -$16 per acre One less field pass Eliminate P application for six years: -$15 per acre Eliminate 6 years of applications, spread over 20 years to draw down P reserves Incorporate P: $6 per acre Additional application costs

46 Point source P and N removal Cost ($/lb P or N) Total P Total N $13.71/lb for total P at 1.0 mg/l $3.30/lb for total N at 10 mg/l
47 In-field Example Statewide Results for N Practice/Scenario Nitrate- N reduction per acre (%) Nitrate- N reduced (million lb N) Baseline 410 Reducing N rate from background to the MRTN (10% of acres) Nitrification inhibitor with all fall applied fertilizer on tile-drained corn acres Split (50%) fall and spring (50%) on tile-drained corn acres Nitrate-N Reduction % (from baseline) Cost ($/lb N removed) to Fall to spring on tile-drained corn acres 15 to Cover crops on all corn/soybean tile-drained acres Cover crops on all corn/soybean non-tiled acres
48 Example Statewide Results for N Practice/Scenario Nitrate- N reduction per acre (%) Nitrate- N reduced (million lb N) Baseline 410 Reducing N rate from background to the MRTN (10% of acres) Nitrate-N Reduction % (from baseline) Cost ($/lb N removed) In-field Nitrification inhibitor with all fall applied fertilizer on tile-drained corn acres Split (50%) fall and spring (50%) on tile-drained corn acres to Fall to spring on tile-drained corn acres 15 to Cover crops on all corn/soybean tile-drained acres Cover crops on all corn/soybean non-tiled acres Edge-offield Bioreactors on 50% of tile-drained land Wetlands on 35% of tile-drained land Buffers on all applicable crop land (reduction only for water that interacts with active area)
49 Example Statewide Results for N Practice/Scenario Nitrate- N reduction per acre (%) Nitrate- N reduced (million lb N) Baseline 410 Reducing N rate from background to the MRTN (10% of acres) Nitrate-N Reduction % (from baseline) Cost ($/lb N removed) In-field Nitrification inhibitor with all fall applied fertilizer on tile-drained corn acres Split (50%) fall and spring (50%) on tile-drained corn acres to Fall to spring on tile-drained corn acres 15 to Cover crops on all corn/soybean tile-drained acres Cover crops on all corn/soybean non-tiled acres Edge-offield Land use change Bioreactors on 50% of tile-drained land Wetlands on 35% of tile-drained land Buffers on all applicable crop land (reduction only for water that interacts with active area) Perennial/energy crops equal to pasture/hay acreage from Perennial/energy crops on 10% of tile-drained land
50 Example Statewide Results for N Practice/Scenario Nitrate- N reduction per acre (%) Nitrate- N reduced (million lb N) Baseline 410 Reducing N rate from background to the MRTN (10% of acres) Nitrate-N Reduction % (from baseline) Cost ($/lb N removed) In-field Nitrification inhibitor with all fall applied fertilizer on tile-drained corn acres Split (50%) fall and spring (50%) on tile-drained corn acres to Fall to spring on tile-drained corn acres 15 to Cover crops on all corn/soybean tile-drained acres Cover crops on all corn/soybean non-tiled acres Edge-offield Land use change Point source Bioreactors on 50% of tile-drained land Wetlands on 35% of tile-drained land Buffers on all applicable crop land (reduction only for water that interacts with active area) Perennial/energy crops equal to pasture/hay acreage from Perennial/energy crops on 10% of tile-drained land Point source reduction to 10 mg nitrate-n/l Point source reduction in N due to biological nutrient removal for P 8 1.8
51 Example Statewide Results for P Practice/Scenario Total P reduction per acre (%) Total P reduced (million lb P) Baseline 37.5 Convert 1.8 million acres of conventional till eroding >T to reduced, mulch or no-till Total P Reduction % (from baseline) Cost ($/lb P removed) In-field P rate reduction on fields with soil test P above the recommended maintenance level Cover crops on all corn/soybean acres Cover crops on 1.6 million acres eroding>t currently in reduced, mulch or no-till Edgeof-field Wetlands on 25% of tile-drained land Buffers on all applicable crop land Land use change Perennial/energy crops equal to pasture/hay acreage from 1987 Perennial/energy crops on 1.6 million acres>t currently in reduced, mulch or no-till Perennial/energy crops on 10% of tile-drained land Point source Point source reduction to 1.0 mg total P/L (majors only) USLE method
52 Example Statewide N & P Scenarios Name Combined Practices and/or Scenarios NP1 MRTN, fall to spring, bioreactors 50%, wetlands 25%, no P fert. on 12.5 million ac above STP maintenance, reduced till on 1.8 million ac conv. till eroding > T, buffers on all applicable lands, point source to 1.0 mg TP/L and 10 mg nitrate-n/l NP2 NP3 MRTN, fall to spring, bioreactors 50%, no P fert. on 12.5 million ac above STP maintenance, reduced till on 1.8 million ac conv. till eroding > T, cover crops on all CS, point source to 1.0 mg TP/L and 10 mg nitrate-n/l MRTN, fall to spring, bioreactors 15%, no P fert. on 12.5 million ac above STP maintenance, reduced till on 1.8 million ac conv. till eroding > T, cover crops on 87.5% of CS, buffers on all applicable lands, perennial crops on 1.6 million ac >T, and 0.9 million additional ac. Nitrate-N (% reduction) Total P (% reduction) Cost of Reduction ($/lb) Annualized Costs (million $/year) ** ** ** 791
53 Example Statewide N & P Scenarios Name Combined Practices and/or Scenarios NP1 MRTN, fall to spring, bioreactors 50%, wetlands 25%, no P fert. on 12.5 million ac above STP maintenance, reduced till on 1.8 million ac conv. till eroding > T, buffers on all applicable lands, point source to 1.0 mg TP/L and 10 mg nitrate-n/l NP2 NP3 NP4 MRTN, fall to spring, bioreactors 50%, no P fert. on 12.5 million ac above STP maintenance, reduced till on 1.8 million ac conv. till eroding > T, cover crops on all CS, point source to 1.0 mg TP/L and 10 mg nitrate-n/l MRTN, fall to spring, bioreactors 15%, no P fert. on 12.5 million ac above STP maintenance, reduced till on 1.8 million ac conv. till eroding > T, cover crops on 87.5% of CS, buffers on all applicable lands, perennial crops on 1.6 million ac >T, and 0.9 million additional ac. MRTN, fall to spring N, bioreactors 35%, no P fert. on 12.5 million ac above STP maintenance, reduced till on 1.8 million ac conv. till eroding > T, buffers on 80% of all applicable land NP5 MRTN, fall to spring N, bioreactors 30%, wetlands 15%, no P fert. on 12.5 million ac above STP maintenance, reduced till on 1.8 million ac conv. till eroding > T, point source to 1.0 mg TP/L and 10 mg nitrate-n/l on 45% of discharge NP6 MRTN, fall to spring N, no P fert. on 12.5 million ac above STP maintenance, reduced till on 1.8 million ac conv. till eroding > T, cover crops on 1.6 million ac eroding >T and 40% of all other CS Nitrate-N (% reduction) Total P (% reduction) Cost of Reduction ($/lb) Annualized Costs (million $/year) ** ** ** ** ** ** 244
54 Practice list summary what we included: fertilizer amounts, timing, placement reduced tillage cover crops bioreactors wetlands riparian buffers perennials also consider: drainage water management sidedressing fertilizer
55 Now we need to do it point sources already started on P will be looking to agriculture to make reductions as well Illinois Farm Bureau, Corn Growers, IFCA, and ICBMP all behind strategy all voluntary for agriculture Nutrient Research and Education Council (NREC) has funded projects to further evaluate practices strategy will be updated periodically
56
57 Showing Progress track implementation activities and environmental outcomes National Pollutant Discharge Elimination System (NPDES) 319 program Soil Conservation Transect Surveys Natural Resources Inventory NRCS Annual Report Ag Industry Voluntary Reporting monitoring programs local water quality/nutrient loads Statewide Nutrient Export Loadings Network
 Current IEPA Ambient site/historical")
58 USGS/IEPA Monitoring Basins covering ~75% of Illinois Rock River Green River Illinois River Kaskaskia River Big Muddy Little Wabash Embarras River Vermilion River Current USGS gaging station (flow) Current IEPA Ambient site/historical Data
59 Implementation Status Workgroups, Forums, and Councils Nutrient Monitoring Council May 5 and Sept. 16, 2015 next meeting Dec. 3, 2015 Ag Water Quality Partnership Forum - May 22, August 26, and Sept. 22, 2015 next meeting Feb. 16, 2016 Urban Stormwater Working Group July 20, 2015 conference call Dec. 11, 2015 Nutrient Science Advisory Committee held first meeting Nov. 19, 2015 Policy Working Group August 4 and Nov. 18, 2015 next meeting March 8, 2016
60 Will the Illinois NLRS work? 45% reductions are large both point sources and agriculture need to make major changes right now everyone is committed monitoring will tell us
The University of Minnesota Water Resources Center: My Vision, My Experience
 The University of Minnesota Water Resources Center: My Vision, My Experience Mark B. David University of Illinois at Urbana-Champaign November 20, 2014 What I will cover vision for a water resources center
WELCOME TO THE JUNE EDITION OF THE 2015 M&R SEMINAR SERIES
 WELCOME TO THE JUNE EDITION OF THE 2015 M&R SEMINAR SERIES PLEASE SILENCE CELL PHONES OR SMART PHONES QUESTION AND ANSWER SESSION WILL FOLLOW PRESENTATION PLEASE FILL EVALUATION FORM SEMINAR SLIDES WILL
Nutrient Reduction Strategy and Best Management Practices
 Nutrient Strategy and Best Management Practices Matthew Helmers Dean s Professor, College of Ag. & Life Sciences Professor, Dept. of Ag. and Biosystems Eng. Iowa State University Situation Increasing concern
Science Assessment to Support an Illinois Nutrient Loss Reduction Strategy
 Science Assessment to Support an Illinois Nutrient Loss Reduction Strategy Mark B. David Gregory F. McIsaac Gary D. Schnitkey George F. Czapar Corey A. Mitchell University of Illinois at Urbana-Champaign
Nitrogen For Corn Production
 Nitrogen For Corn Production John Sawyer Professor and Soil Fertility Extension Specialist Department of Agronomy Iowa State University Why Nitrogen Is Applied For Corn Corn Yield Response Corn Yield,
Illinois Nutrient Loss Reduction Strategy: What is it? How does it impact me?
 Illinois Nutrient Loss Reduction Strategy: What is it? How does it impact me? Lauren Lurkins Director of Natural and Environmental Resources Illinois Farm Bureau WHY IS THE STRATEGY NEEDED? Gulf Hypoxia
Nitrate-N Loss Reduction: Scale of In- Field and Edge-of-Field Practice Implementation to Reach Water Quality Goals
 Department of Agricultural and Biosystems Engineering Nitrate-N Loss Reduction: Scale of In- Field and Edge-of-Field Practice Implementation to Reach Water Quality Goals Matthew Helmers Dean s Professor,
For the full report Iowa Nutrient Reduction Strategy go to
 For the full report Iowa Nutrient Reduction Strategy go to http://www.nutrientstrategy.iastate.edu Section 2.1 Executive Summary Iowa Science Assessment of Nonpoint Source Practices to Reduce Nitrogen
What the Nutrient Loss Reduction Strategy Means to Farmers. Sustainability Showcase Event July 23, 2015
 What the Nutrient Loss Reduction Strategy Means to Farmers Sustainability Showcase Event July 23, 2015 NLRS Stakeholder Involvement Stakeholders met August 2013 May 2014: Illinois Department of Agriculture,
Acknowledgements. Background and Purpose of Survey
 Acknowledgements The National Agricultural Statistics Service (NASS) would like to thank the University of Illinois Extension Service for all of their efforts in this project. They have been an excellent
Illinois Farmers as Nutrient Stewards: Opportunities via the Illinois Nutrient Loss Reduction Strategy
 Illinois Farmers as Nutrient Stewards: Opportunities via the Illinois Nutrient Loss Reduction Strategy IFB Commodities Conference July 30, 2014 Lauren Lurkins Director of Natural and Environmental Resources
New Practices for Nutrient Reduction: STRIPs and Saturated Buffers. Matthew Helmers and Tom Isenhart Iowa State University
 New Practices for Nutrient Reduction: STRIPs and Saturated Buffers Matthew Helmers and Tom Isenhart Iowa State University Situation Increasing concern for local and regional waters Substantial demand for
For the full report Iowa Nutrient Reduction Strategy go to
 For the full report Iowa Nutrient Reduction Strategy go to www.nutrientstrategy.iastate.edu Section 2.1 Executive Summary Iowa Science Assessment of Nonpoint Source Practices to Reduce Nitrogen and Phosphorus
Cover Crops, Wetlands, and Conservation Drainage
 Department of Agricultural and Biosystems Engineering Cover Crops, Wetlands, and Conservation Drainage Matthew Helmers Dean s Professor, College of Ag. & Life Sciences Professor, Dept. of Ag. and Biosystems
Nutrient Management in Tile Drained Fields
 Nutrient Management in Tile Drained Fields (Results from 2016 NREC Projects) Lowell Gentry Principal Research Specialist in Agriculture University of Illinois at Urbana-Champaign IFCA Annual Conference
Statewide Nutrient Management Programs--- (and more J)
") Statewide Nutrient Management Programs--- (and more J) Illinois Lake Management Association- 32 nd Annual Conference Crystal Lake, Illinois March 31, 2017 Photo by Andrew Jenkins, Water Is Photo Contest
Statewide Nutrient Management Programs--- (and more J) Illinois Lake Management Association- 32 nd Annual Conference Crystal Lake, Illinois March 31, 2017 Photo by Andrew Jenkins, Water Is Photo Contest
Adaptive Watershed Management for Control of Nutrient Loss in the Mackinaw River Watershed. Krista Kirkham and Maria Lemke The Nature Conservancy
 Adaptive Watershed Management for Control of Nutrient Loss in the Mackinaw River Watershed Krista Kirkham and Maria Lemke The Nature Conservancy Innovative Partnerships Mackinaw River Program Federal Government
F1. Reducing Cropland Nitrogen Losses to Surface Waters
 F1. Reducing Cropland Nitrogen Losses to Surface Waters Author: Dave Wall, MPCA Technical support from: William Lazarus, David J. Mulla, Geoffrie Kraemer, and Karina Fabrizi (University of Minnesota) Minnesota
Squaw Creek WMA: From watershed planning to implementation
 X Squaw Creek WMA: From watershed planning to implementation Introductions Pat Conrad, Water Resources Specialist Dan Haug, Watershed Educator WMA Overview Formed in 2012-28E Agreement Webster Stratford
Strategies for nitrate reduction: The Cedar River Case Study
 2010 Integrated Crop Management Conference - Iowa State University 195 Strategies for nitrate : The Cedar River Case Study Matthew J. Helmers, associate professor, Agricultural and Biosystems Engineering,
Analysis of the Minnesota Agricultural Water Quality Certification Program s assessment tool
 Analysis of the Minnesota Agricultural Water Quality Certification Program s assessment tool Presenter: Peter Gillitzer Minnesota Department of Agriculture Dennis Fuchs, Stearns SWCD Ben Jordan, Sense
Using Cover Crops to Reduce Leaching. Losses of Nitrate
 Using Cover Crops to Reduce Leaching USDA-ARS National Laboratory for Agriculture and the Environment Ames, Iowa Tom Kaspar, Ben Knutson, Keith Kohler, Kent Heikens, Dan Jaynes, Tim Parkin, Tom Moorman,
Management and Conservation in the Face of Lower Returns
 Management and Conservation in the Face of Lower Returns Gary Schnitkey, Dale Lattz, and Nick Paulson www.farmdocdaily.illinois.edu www.farmdoc.illinois.edu Habits of Resilient Farmers Presentation at
Iowa Nutrient Reduction Strategy: Background Information
 Iowa Nutrient Reduction Strategy: Background Information 2013 Iowa Water Conference Reid Christianson, P.E., Ph.D. Center for Watershed Protection Ellicott City, Maryland Project Components Project Goal
How Efficient is Your Nitrogen Program? Assessing Nitrogen Use Efficiency on Your Farm
 How Efficient is Your Nitrogen Program? Assessing Nitrogen Use Efficiency on Your Farm Presented at Wisconsin Discovery Farms Conference Wisconsin Dells, WI December 9, 2014 by C.S. Snyder, PhD, CCA Nitrogen
Iowa Senate Natural Resources Committee February 3, 2015
 Iowa Senate Natural Resources Committee February 3, 2015 Dr. Matthew Helmers Dean s Professor, College of Agriculture & Life Sciences Professor, Department of Agricultural & Biosystems Engineering mhelmers@iastate.edu,
Nutrient and Sediment Loss Reduction by Perennial & Cover Crops
 Nutrient and Sediment Loss Reduction by Perennial & Cover Crops Gregory McIsaac, PhD Agricultural Watershed Institute &University of Illinois at Urbana Champaign outline Variability of nutrient and sediment
The effect of N management and cover crops on tile nitrate loads
 The effect of N management and cover crops on tile nitrate loads Lowell Gentry - Principal Research Specialist in Agriculture, NRES, U of I Midwest Cover Crop Council February 21, 2019 By using cover crops,
How much nitrogen is in a healthy Iowa soil from 0-45?
 How much nitrogen is in a healthy Iowa soil from 0-45? a. 0-100 lbs per acre c. 5000-7000 lbs per acre b. 2000-4000 lbs per acre d. 9000-11000 lbs per acre How much nitrogen is in a healthy Iowa soil from
Timing of Nitrogen Applications, Cover Crops, and Water Quality
 Timing of Nitrogen Applications, Cover Crops, and Water Quality PIs: Dr. Shalamar Armstrong2 and Dr. Catherine O Reilly1 1Associate Profess of Hydrogeology Department of Geography-Geology, Illinois State
AGRICULTURAL & APPLIED ECONOMICS
 University of Wisconsin-Madison February 2001 Staff Paper No. 439 A Study of Costs of Compliance Related to Non-Point Pollution: Rules for Wisconsin Crop Producers By T. Randall Fortenbery AGRICULTURAL
Pete Fandel Illinois Central College llinois Council on Best Management Practices
 Pete Fandel Illinois Central College llinois Council on Best Management Practices July 2013 Hypoxic Zone Mississippi River Watershed Nitrogen N Sales in 2012 was 2,293,812,952 pounds Target Reduction
St. Peter Wellhead Protection
 St. Peter Wellhead Protection Nitrogen Rate Results September 2003 A Demonstration Project Funded Through Section 319 of the Federal Clean Water Act Page 1 You farm and/or own land within the St. Peter
Nitrogen Cycling with Cover Crops
 Nitrogen Cycling with Cover Crops Shalamar Armstrong Assistant Professor of Soil and Water Conservation Agronomy Department Purdue University sarmstro@purdue.edu The Gulf Of Mexico's Dead Zone Is The Biggest
Best Management Practices for Nitrogen Use in SOUTHWESTERN AND WEST-CENTRAL MINNESOTA
 N Best Management Practices for Nitrogen Use in SOUTHWESTERN AND WEST-CENTRAL MINNESOTA B E S T M A N AG E M E N T P R AC T I C E S F O R N I T R O G E N A P P L I C AT I O N Best Management Practices
Nitrogen (N) affects in-state and downstream waters in three primary ways:
 affects in-state and downstream waters in three primary ways:") G. Conclusions Concerns with nitrogen in waters Nitrogen (N) affects in-state and downstream waters in three primary ways: 1. Aquatic life toxicity - Aquatic life have been found to be adversely affected
G. Conclusions Concerns with nitrogen in waters Nitrogen (N) affects in-state and downstream waters in three primary ways: 1. Aquatic life toxicity - Aquatic life have been found to be adversely affected
Phosphorus Loading to Western Lake Erie: Trends and Sources
 Phosphorus Loading to Western Lake Erie: Trends and Sources Western Lake Erie Conference Toledo Yacht Club March 13, 28 Dr. David B. Baker National Center for Water Quality Research Heidelberg College
Saturated Buffer. Subsurface Drainage PURPOSE N REDUCTION LOCATION COST BARRIERS
 Saturated Buffer To intercept tile drainage prior to discharging to surface waters and redistribute the water laterally in the soil profile of the streamside buffer. Subsurface drainage, also known as
Cover Crops and Soil Health Harvesting the Potential: Environmental Impacts of Cover Crops
 Cover Crops and Soil Health Harvesting the Potential: Environmental Impacts of Cover Crops February 18, 2014 Omaha, Nebraska The Role of Winter Cover Crops in the Restoration of Chesapeake Bay Ken Staver
IOWA WATER QUALITY INITIATIVE
 IOWA WATER QUALITY INITIATIVE Moving From Strategy to Implementation Iowa Pork Congress January 23, 2014 1 Nutrient Reduction Strategy Overview Strategy Development: Lead by IDALS, IDNR, and ISU Integration
Cover Crop Considerations. Charles Ellis Extension Natural Resource Engineer Lincoln County Extension Center
 Cover Crop Considerations Charles Ellis Extension Natural Resource Engineer Lincoln County Extension Center ellisce@missouri.edu 636-528-4613 Incorporating Cover Crops Do I have the capability and time
Natural Resources & Environmental Stewardship
 Natural Resources & Environmental Stewardship Fundamentals of Nutrient Management Melissa L. Wilson Department of Environmental Science & Technology Ag Nutrient Management Program University of Maryland,
Modeling the Influence of Agricultural Practices on Watershed Export of Phosphorus
 Modeling the Influence of Agricultural Practices on Watershed Export of Phosphorus Rem Confesor Jr., Ph.D. Sr. Research Scientist NCWQR, Heidelberg University 310 E. Market St., Tiffin, OH rconfeso@heidelberg.edu
Protecting Your Water and Air Resources
 Protecting Your Water and Air Resources Montana Agri-Business Association Convention (Feb 1, 2013) by Clain Jones, Extension Soil Fertility Specialist and Adam Sigler, Extension Associate Water Quality
HYPOXIA ACTION PLAN: WHAT CAN MIDWEST AGRICULTURE DO? Dennis McKenna Illinois Department of Agriculture
 HYPOXIA ACTION PLAN: WHAT CAN MIDWEST AGRICULTURE DO? Dennis McKenna Illinois Department of Agriculture The hypoxic zone is an area in the northern Gulf of Mexico where dissolved oxygen concentrations
Targeting Best Management in Contrasting Watersheds
 Targeting Best Management in Contrasting Watersheds Andrew Sharpley, Tommy Daniel, Sheri Herron & Bil Gburek University or Arkansas, BMP s Inc. & USDA-ARS ARS Today s s P Cycle is Fragmented Grain P Manure
Bob Broz University of Missouri Extension
 Bob Broz University of Missouri Extension brozr@missouri.edu 573-882-0085 What is the purpose on the nutrient reduction committee? Reduce nutrient loading into the Mississippi River and into the Gulf of
Western Lake Erie Watersheds
 Western Lake Erie Watersheds 7.1 Million Acres 70% Oh, 12% In, & 18% Mi About 76% Cropland, 3/4 Corn & Soybeans Maumee Drains 2/3 rds Area Average Annual Export From the Maumee WS is 1.1 Pounds of P per
Addressing Economic & Environmental Risks While No-Tilling
 19th 18th 20th Annual National No-Tillage Conference Cincinnati, Des St. Louis, Moines, Missouri Ohio Iowa * * * Jan. 12-15, 13-16, 11-14, 2011 2010 2012 Addressing Economic & Environmental Risks While
Nitrogen Management Tools for Reducing Nitrogen losses in the Chesapeake Bay Watershed
 Nitrogen Management Tools for Reducing Nitrogen losses in the Chesapeake Bay Watershed John (Jack) Meisinger Soil Scientist, USDA-ARS, Beltsville, MD Adj. Assoc. Prof, Unv. Md, College Pk, MD Principles
WDNR - Using Snap-Plus to Quantify Phosphorus Trading Credits ( )
") WDNR - Using Snap-Plus to Quantify Phosphorus Trading Credits (10-23-) Purpose The purpose of this document is to provide technical assistance for using the P Trade report in SnapPlus to quantify Phosphorus
WDNR - Using Snap-Plus to Quantify Phosphorus Trading Credits (10-23-) Purpose The purpose of this document is to provide technical assistance for using the P Trade report in SnapPlus to quantify Phosphorus
WATERSHEDS. City Council Workshop August 21, 2018
 WATERSHEDS City Council Workshop August 21, 2018 Watersheds City of Ames was a founding member of the 28E Agreement that established the Squaw Creek Watershed Management Authority in 2012 Reduce Riverine
Nutrient Management in. A presentation to the West Metro Water Alliance
 Nutrient Management in Developing and Agricultural Areas A presentation to the West Metro Water Alliance Chris Meehan, P.E. May 25, 2011 Agenda Physical Improvements Planning Improvements How to get it
Chapter 10: Economics of Nutrient Management and Environmental Issues
 Chapter 10: Economics of Nutrient Management and Environmental Issues Agustin Pagani, John E. Sawyer, and Antonio P. Mallarino / Department of Agronomy, Iowa State University Developed in cooperation with
Rapid National Model Assessments to Support US Conservation Policy Planning Mike White
 Rapid National Model Assessments to Support US Conservation Policy Planning Mike White USDA-ARS Grassland, Soil and Water Research Laboratory, Temple, TX 1 Topics Current National Assessments Future National
Local Water Quality and Watersheds. Raccoon River & Des Moines River Watersheds. Hypoxia in the Gulf of Mexico: Implications and Strategies for Iowa
 Local Water Quality and Watersheds Raccoon River & Des Moines River Watersheds Hypoxia in the Gulf of Mexico: Implications and Strategies for Iowa October 16, 2008 Ames, Iowa Chris Jones and Roger Wolf
The Effect of Cover Crops on Surface Water Quality: A Paired Watershed Experiment in the Lake Bloomington Watershed.
 The Effect of Cover Crops on Surface Water Quality: A Paired Watershed Experiment in the Lake Bloomington Watershed. February, 2017 Submitted by: Catherine O Reilly, Shalamar Armstrong, and Bill Perry
IIHR s Continuous Monitoring Network and Water Quality Information System. Chris Jones University of Iowa-IIHR
 IIHR s Continuous Monitoring Network and Water Quality Information System Chris Jones University of Iowa-IIHR Unit of the College of Engineering Director: Larry Weber 90 Graduate Students from 16 countries
A Summary of Efforts to Reduce Phosphorus in the Red Cedar River Basin
 A Summary of Efforts to Reduce Phosphorus in the Red Cedar River Basin State Laws to Reduce Phosphorus 1970s - Restriction on phosphorus in laundry detergent 1992 - Limits on point sources with significant
A Presentation of the 2013 Drainage Research Forum. November 14, 2013 SDSU Extension Regional Center Sioux Falls, SD
 A Presentation of the 2013 Drainage Research Forum November 14, 2013 SDSU Extension Regional Center Sioux Falls, SD 1 Integrated Drainage and Wetland Landscape Systems Challenges & Opportunities Shawn
Nitrate Load Reduction Strategies for the Raccoon and Des Moines Rivers. Keith Schilling, Calvin Wolter Iowa DNR Geological and Water Survey
 Nitrate Load Reduction Strategies for the Raccoon and Des Moines Rivers Keith Schilling, Calvin Wolter Iowa DNR Geological and Water Survey Outline of Presentation Background of nitrate impairments Nitrate
What Will Replace the Corn-Soybean Rotation? Emerson D. Nafziger Crop Sciences Department, University of Illinois, Urbana, IL 61801
 27 Indiana CCA Conference Proceedings What Will Replace the Corn-Soybean Rotation? Emerson D. Nafziger Crop Sciences Department, University of Illinois, Urbana, IL 6181 The first question we need to ask
Addressing Economic & Environmental Risks While No-Tilling
 19th 18th 20th Annual National No-Tillage Conference Cincinnati, Des St. Louis, Moines, Missouri Ohio Iowa * * * Jan. 12-15, 13-16, 11-14, 2011 2010 2012 Addressing Economic & Environmental Risks While
Top Environmental Regulations Affecting Agriculture in 2015
 Top Environmental Regulations Affecting Agriculture in 2015 Lauren Lurkins Director of Natural and Environmental Resources Illinois Farm Bureau WHAT WE WILL COVER Waters of the United States Proposed Regulation
Wisconsin Wastewater Operators Association. Protecting Our Water Resources: The Future Bill Hafs - NEW Water 10/2014
 Wisconsin Wastewater Operators Association Protecting Our Water Resources: The Future Bill Hafs - NEW Water 10/2014 The Fox River Contributes 1/3 of All Nutrients to Lake Michigan APRIL 15, 2011 Photo
GLASI GLASI. Priority Subwatershed Project. Great Lakes Agricultural Stewardship Initiative
 GLASI GLASI Great Lakes Agricultural Stewardship Initiative Priority Subwatershed Project Wigle Creek Priority Subwatershed Project Essex Region Conservation Authority Up to $75,000 per eligible farm business
Simulated Nitrogen Loading from Corn, Sorghum, and Soybean Production in the Upper Mississippi Valley
 This paper was peer-reviewed for scientific content. Pages 344-348. In: D.E. Stott, R.H. Mohtar and G.C. Steinhardt (eds). 2001. Sustaining the Global Farm. Selected papers from the 10th International
Using Paired Edge of Field Data to Assess Impacts of Management on Surface and Subsurface P Loss
 Using Paired Edge of Field Data to Assess Impacts of Management on Surface and Subsurface P Loss Kevin W. King, Mark R. Williams, and Norm R. Fausey USDA ARS Soil Drainage Research Unit Columbus, OH Edge-of-field
Appendix X: Non-Point Source Pollution
 Appendix X: Non-Point Source Pollution Sources Nonpoint source of pollution, unlike pollution from industrial and sewage treatment plants, comes from many different sources. Nonpoint source pollution is
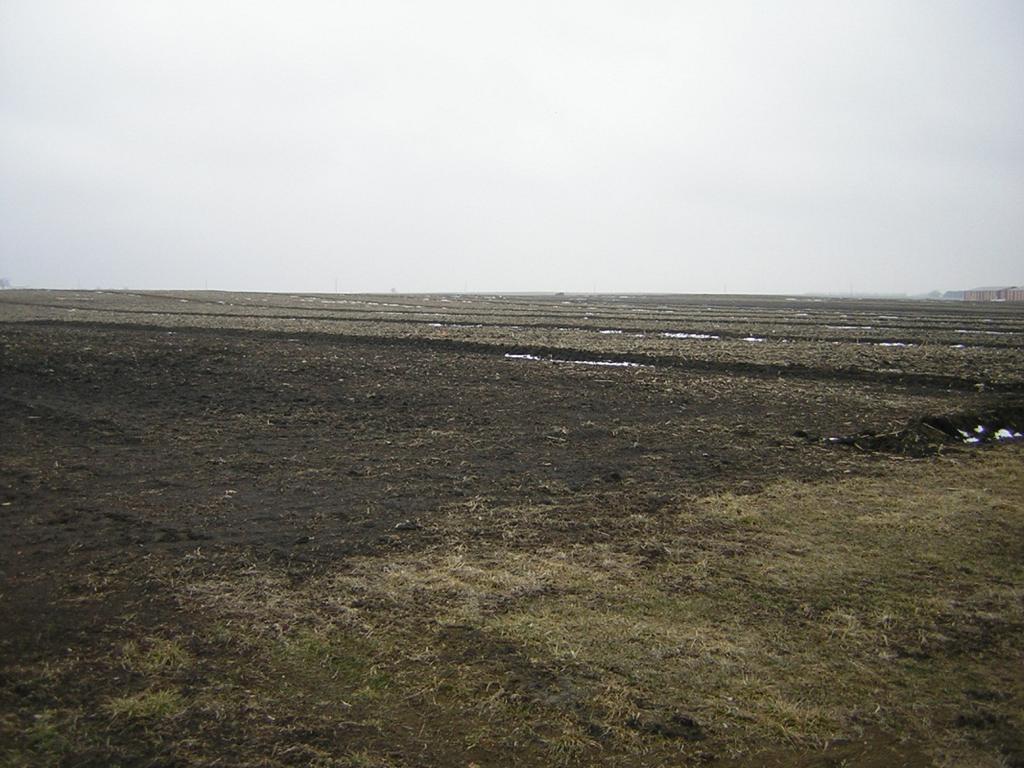
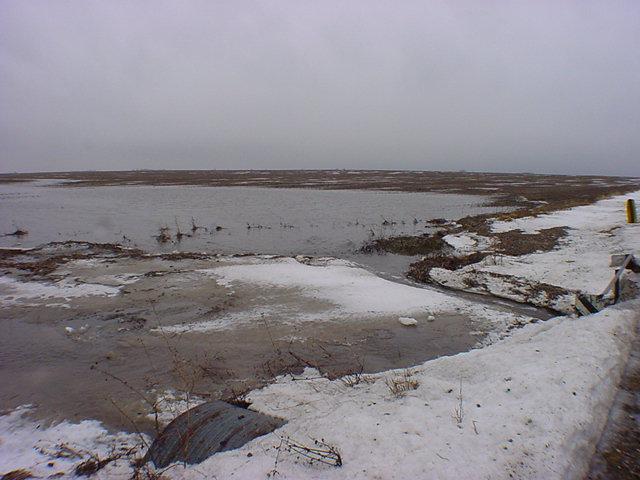
Impacts of 2008 flooding on agricultural lands in Illinois, Missouri, and Indiana Kenneth R. Olson
 FEATURE doi:10.2489/jswc.64.6.167a Impacts of 2008 flooding on agricultural lands in Illinois, Missouri, and Indiana Kenneth R. Olson T he 2008 spring rains in Illinois, Missouri, and Indiana delayed planting,
St. Peter Wellhead Protection
 St. Peter Wellhead Protection Nitrogen Rate Results October 2003 A Demonstration Project Funded Through Section 319 of the Federal Clean Water Act Page 1 How much nitrogen should be applied to a corn crop
IIHR s Continuous Monitoring Network and Water Quality Information System. Chris Jones University of Iowa-IIHR
 IIHR s Continuous Monitoring Network and Water Quality Information System Chris Jones University of Iowa-IIHR Unit of the College of Engineering Director: Larry Weber 90 Graduate Students from 16 countries
NWQI and Beyond: NRCS s Focused Watershed Approach
 NWQI and Beyond: NRCS s Focused Watershed Approach Fletcher (Kip) Potter Water Quality Specialist NRCS Vermont Helping Private Landowners Protect and Improve Natural Resources on Agricultural Lands 435
Edge-of-Field Monitoring
 Edge-of-Field Monitoring Karma Anderson Water Quality Specialist National Water Quality and Quantity Team NRCS Edge-of-Field Monitoring NRCS WQ monitoring first introduced in 2010 as Interim CPS 799 in
Discovery Farms Minnesota N and P, what is happened in Farm Fields? Jerome Lensing January 9, 10, 11, 2018 AgVise Labs
 Discovery Farms Minnesota N and P, what is happened in Farm Fields? Jerome Lensing January 9, 10, 11, 2018 AgVise Labs Jerome.lensing@hotmail.com Discovery Farms is a farmer led water quality research
SOIL P-INDEXES: MINIMIZING PHOSPHORUS LOSS. D. Beegle, J. Weld, P. Kleinman, A. Collick, T. Veith, Penn State & USDA-ARS
 SOIL P-INDEXES: MINIMIZING PHOSPHORUS LOSS D Beegle, J Weld, P Kleinman, A Collick, T Veith, Penn State & USDA-ARS Part of a larger national effort to improve the P Index and P Management Chesapeake Bay
Monitoring Runoff and Sediment at the Platteville Pioneer Farm
 Monitoring Runoff and Sediment at the Platteville Pioneer Farm Christopher A. Baxter Assistant Professor, Soil and Crop Science UW-Extension Nutrient Management Specialist University of Wisconsin - Platteville
What Every CCA Should Know About Drainage
 What Every CCA Should Know About Drainage Matt. J. Helmers Agricultural and Biosystems Engineering Department Iowa State University Water table management through the use of artificial subsurface drainage
Minnesota Nutrient Management Initiative. On-Farm Evaluation of Nitrogen and Phosphorous Nutrient Management
 Minnesota Nutrient Management Initiative On-Farm Evaluation of Nitrogen and Phosphorous Nutrient Management Nutrient Management Initiative On Farm Evaluation Sponsored by USDA-NRCS in collaboration with
RESEARCH. AFREC Research Projects. htm
 RESEARCH AFREC Research Projects MDA Drainage Demonstration s http://www.mda.state.mn.us/chemicals/fertilizers/afrec. htm http://www.mda.state.mn.us/protecting/bmps/drainage demos.htm Advancing Improved
Environmental Concerns in Midwest Agricultural Landscapes. Roberta Parry US EPA Office of Water June 25, 2014
 Environmental Concerns in Midwest Agricultural Landscapes Roberta Parry US EPA Office of Water June 25, 2014 Water Quality Nutrients Local Regional Key Concerns Agricultural Drainage Human Health Wildlife
Degradation of the resource Fertility loss Organic matter Tilth degradation. Water quality Sediment Nutrients
 Near Blue River ca. 1980 Degradation of the resource Fertility loss Organic matter Tilth degradation Water quality Sediment Nutrients Program cost Cheaper to prevent Still expensive Long-term productivity
1,100+ Members Including: Ag Retailers. Fertilizer & Pesticide Manufacturers and Distributors. Equipment Suppliers. Input Transporters
 IFCA s Mission Statement: To assist and represent the crop production supply and service industry while promoting the sound stewardship and utilization of agricultural inputs 1,100+ Members Including:
Agricultural Chemicals and Groundwater Protection
 Economic Considerations of Nutrient Management BMPs Concern about nutrients from fertilizers and manure degrading water supplies has resulted in a search for nutrient management approaches that protect
Spring Nutrient Flux to the Gulf of Mexico and Nutrient Balance in the Mississippi River Basin
 Spring Nutrient Flux to the Gulf of Mexico and Nutrient Balance in the Mississippi River Basin C.S. Snyder, PhD, CCA Nitrogen Program Director, Conway, AR T. Scott Murrell, PhD Director, North American
Water Quality and Freedom to Operate
 DTN/The Progressive Farmer s Ag Summit 2014 Water Quality and Freedom to Operate Presented by Sean McMahon And Tim Smith Iowa Water Quality Initiative IOWA DEPARTMENT OF AGRICULTURE & LAND STEWARDSHIP
The 4 th Annual Biomass Crop Production Workshop
 The 4 th Annual Biomass Crop Production Workshop Emily Heaton 1 and Ferman Milster 2 1 Dept. of Agronomy, Iowa State University 2 Office of Sustainability, University of Iowa Overview Heaton Introduction
6. Implementation Strategies
 6. Implementation Strategies The following section describes specific strategies to address the objectives established by the WMA. The section is organized by the six main goals of the WMA defined above.
CONSERVATION WORK ON RENTED ACRES
 CONSERVATION WORK ON RENTED ACRES IN IOWA: OPERATORS & LANDLORDS WORKING TOGETHER Tesdell Century Farm, Slater, IA Lee Tesdell: Owner Michael Helland: Row-crop operator Practical Farmers of Iowa Annual
Where does the nitrogen go? Christopher Kelley Washington State University School of the Environment
 Where does the nitrogen go? Christopher Kelley Washington State University School of the Environment Outline My background Research in Eastern Washington o o Background Previous research on nitrate leaching
4Rs for Healthy Soils & Healthy Waters
 4Rs for Healthy Soils & Healthy Waters C.S. Snyder, PhD, CCA Nitrogen Program Director, Conway, AR Healthy Soils and Healthy Waters Workshop Columbus, OH September15-16, 2014 www.ipni.net Acknowledging
Lincoln County Verdi Township Spring Creek Watershed Survey
 D:\fanmap\mda\verdi\data\report\report1.doc Date of last update 6/2/98 Printing date-1/11/02 Lincoln County Verdi Township Spring Creek Watershed Survey For additional information, contact: Denton Bruening
AGRONOMY 375 Exam II Key November 2, 2018
 1 AGRONOMY 375 Exam II Key November 2, 2018 3 pts 1. a) Latitude, previous crop residue, and soil drainage all influence soil temperature, which is critical in determining early season corn crop growth
The Iowa Policy Project 20 E. Market Street Iowa City, Iowa (319)
") The Iowa Policy Project 20 E. Market Street Iowa City, Iowa 52245 (319) 338-0773 www.iowapolicyproject.org Solution to Pollution: It Starts on the Farm By Andrea Heffernan, Teresa Galluzzo and Will Hoyer
The Iowa Policy Project 20 E. Market Street Iowa City, Iowa 52245 (319) 338-0773 www.iowapolicyproject.org Solution to Pollution: It Starts on the Farm By Andrea Heffernan, Teresa Galluzzo and Will Hoyer
University of Maryland Phosphorus Management Tool (The Revised Maryland PSI)
") University of Maryland Phosphorus Management Tool (The Revised Maryland PSI) Joshua McGrath Frank Coale Laboratory for Agriculture and Environmental Studies DEPARTMENT OF ENVIRONMENTAL SCIENCE & TECHNOLOGY
University of Maryland Phosphorus Management Tool (The Revised Maryland PSI) Joshua McGrath Frank Coale Laboratory for Agriculture and Environmental Studies DEPARTMENT OF ENVIRONMENTAL SCIENCE & TECHNOLOGY
TILLAGE PRACTICES IN KANSAS: 2010 SURVEY RESULTS
 Proceedings of the 24th Annual Central Plains Irrigation Conference, Colby, Kansas, February 21-22, 2012 Available from CPIA, 760 N.Thompson, Colby, Kansas TILLAGE PRACTICES IN KANSAS: 2010 SURVEY RESULTS
Soil and fertilizer management in vegetable production
 Soil and fertilizer management in vegetable production Dan M. Sullivan Dept. Crop & Soil Science Oregon State University, Corvallis N. Willamette Hort Society Vegetable Day Jan 9, 2018 3:30 pm Free download.
MODELING CARBON CHANGES IN AGRICULTURAL SOILS
 MODELING CARBON CHANGES IN AGRICULTURAL SOILS FORESTRY AND AGRICULTURE MODELING FORUM 14 OCT 2004 John Brenner and Joel Brown USDA NRCS CarbOn Management Evaluation Tool (VRGG-COMET) Calculation tool designed
Minnesota Agricultural Water Quality Certification Program Program Update
 Minnesota Agricultural Water Quality Certification Program Program Update Brad Redlin MAWQCP Program Manager Memorandum of Understanding Support for a voluntary program Coordinate and prioritize funding
Lake Creek Watershed Management Plan Public Meeting. Arrowhead Lake May 3, :00 PM
 Lake Creek Watershed Management Plan Public Meeting Arrowhead Lake May 3, 2018 6:00 PM Agenda I. Welcome and Introductions II. III. IV. Watershed Basics Overview of Lake Creek Watershed Elements of a Successful