Phase 6 Land Use. Peter Claggett, U.S. Geological Survey Quentin Stubbs, U.S. Geological Survey
|
|
|
- Kenneth Blaze Baldwin
- 5 years ago
- Views:
Transcription
1 Phase 6 Land Use Peter Claggett, U.S. Geological Survey Quentin Stubbs, U.S. Geological Survey


2 Building a 2012 Phase 6 Land Use Raster Database: Land Use Land Cover


3 Two Primary Approaches Towards constructing the Phase 6 Land Use dataset Low Resolution or No Local Data 30m or larger Spatial Resolution Imagery Vs. Output Phase 6 Land Use Dataset 10m 2m 29m High Resolution Local Data Less than 2m Diagram: Spatial resolution. Source: Satellite Imaging Corporation
4 Inputs NAVTEQ* Methods (example) Target Land Uses Roadways Institutions Spatial Aggregations Phase 6 Land Use Levels I, II, III Level II Impervious Level I Impervious Surfaces Developed National Land Cover Dataset* Forest Cover Tree Canopy Shrub/Scrub/Grass Agriculture Pervious Open Space Tree Canopy Turf Grass Crop Data Layer Agriculture National Hydrography Dataset DEM Waterbodies Streams Forest Cover Water Natural National Wetland Inventory* Flow Path Analysis Wetlands
5 Proposed Developed Phase 6 Land Uses Developed Level I Developed Level II Impervious Pervious Construction Extractive Level III Roads Tree Canopy Other (e.g. Buildings, parking lots, etc.) Open Space Turf

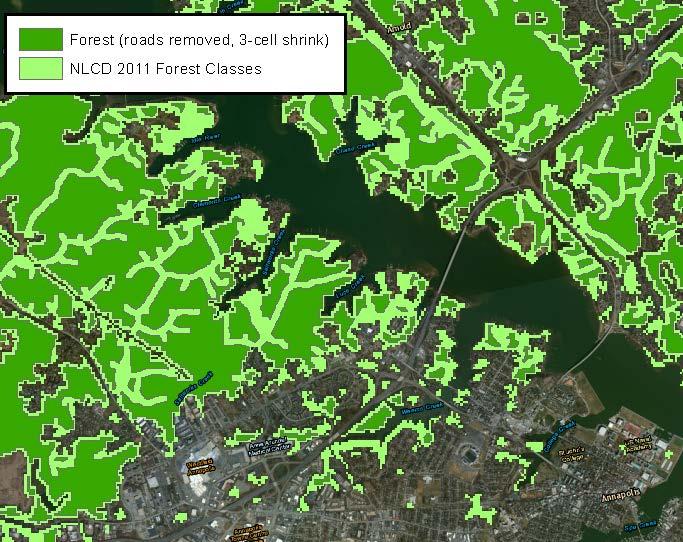
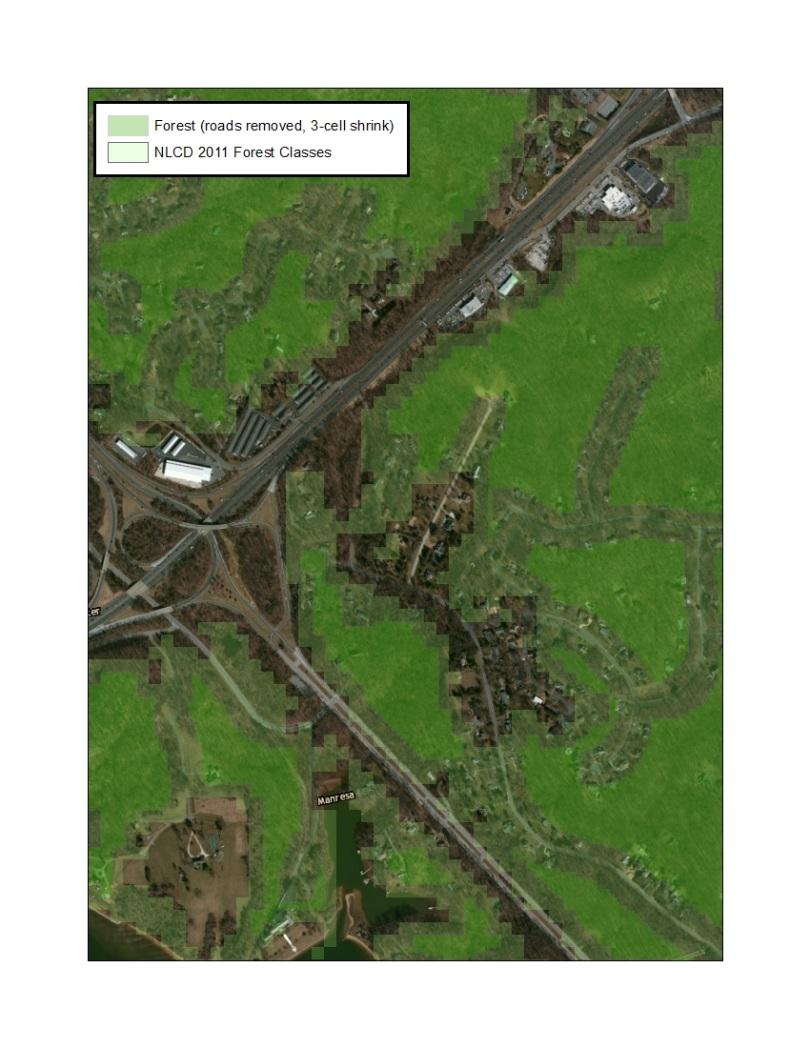
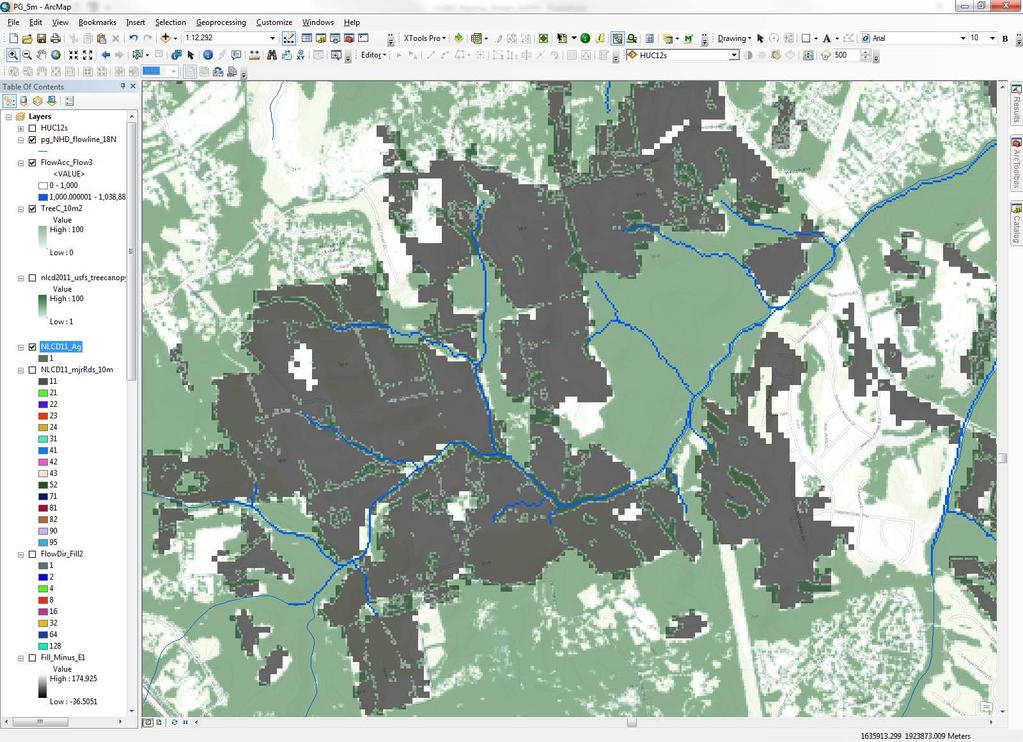
6 PG County, MD 2009 LUD with NAVTEQ at 10m resolution

7 NLCD 2011 with NAVTEQ at 10m resolution
8 Proposed Developed Phase 6 Land Uses Developed Phase 6 Roads Buildings, parking lots, etc. Turf grass Tree canopy Open space Construction Extractive Phase Impervious surfaces Turf grass (pervious) Construction Extractive * provisional, pending further work on loading differences and model fitness
9 Proposed Developed Phase 6 Land Uses Agriculture Level I Agriculture Level II Commodity Crops Hay and Legume forage Specialty and Other Crops Farmsteads Level III Corn Alfalfa and other legumes Vines Animal Soybeans Non-legume forage Low Cover Non-animal Small Grains Pasture and pastured Cropland High Cover

10
11 Proposed Agricultural Phase 6 Land Uses (from Ag Workgroup and Ag Modeling Subcommittee) Agriculture Phase 6 Phase Corn Soybeans Small grains Alfalfa Non-legume forage Pasture Vines Low cover specialty High cover specialty Impervious CAFO & AFO farmsteads Impervious non-animal farmsteads Pervious CAFO & AFO farmsteads Pervious non-animal farmsteads Hightill w/ & w/o manure Lowtill with manure Nutrient management hightill w/ & w/o manure Nutrient management lowtill Alfalfa Hay w/ & w/o nutrients Nutrient management alfalfa Nutrient management hay Pasture Nutrient management pasture Nursery AFOs CAFOs Degraded riparian pasture
 Level III Undisturbed Tidal (saline & fresh) Harvested Floodplain Disturbed (e.g.")
12 Proposed Developed Phase 6 Land Uses Natural Level I Natural Level II Forests Wetlands Water (e.g., lakes, streams and ponds) Level III Undisturbed Tidal (saline & fresh) Harvested Floodplain Disturbed (e.g. insects, fire, etc.) Headwater Depressional
13
14

15
16
17 Proposed Natural Phase 6 Land Uses Natural Phase 6 Forests Harvested forest Disturbed forest Phase Woody/open Harvested forest Tidal emergent wetlands Fresh emergent wetlands Non-tidal woody wetlands Water* Water * Will expand water coverage to include 1:24K National Hydrography Dataset waterbodies and possibly Dynamic Surface Water Extent.


18 Modeling Sediment (update) What s been done for Phase 6: WVU automated stream cross-section techniques to extract fluvial geomorphic data from LiDAR: bank height, channel width, valley width. WVU compared results with field data with favorable results. CWP refined techniques to estimate contribution of stream bank erosion to urban stream sediment loads.
19 Modeling Sediment (update) What will be done for Phase 6: Develop conceptual models to represent spatial variability in sediment processes by physiographic province (e.g., urban Piedmont vs rural Piedmont). Enhance automated methods to include: bank angle, channel and floodplain profile slopes, active floodplain width, and drainage area. Generate and compare continuous geospatial indicators of bank erosion and floodplain deposition with cross-section derived indicators. Summarize metrics by NHD+ catchment and evaluate with SPARROW Develop regression model for the Piedmont and Ridge and Valley provinces relating metrics to dendro-geomorphic measures of floodplain deposition. Expand analysis of stream source ratios of sediment to more urban areas.
20
21
22
23
24 Option 1 Three Approaches for Monitoring Land Cover Change Option 2 Option 3 Coarse 30m Wall-to-Wall Mapping Pros: Comprehensive Flexible- multiple uses Adaptable- changing objectives Cons: Accuracy Interpretation Level of expertise High-res 1m Wall-to-Wall Mapping Pros: Accuracy Comprehensive Flexible- multiple uses Adaptable- changing objectives Cons: Cost Interpretation Level of expertise High-res 1m Stratified Random Sampling Pros: Accuracy Interpretation Level of expertise Citizen participation and education Cons: Focused Limited utility Fixed QA/QC
25 Value of High-res Land Cover for Phase 6 High-Direct Partial- Indirect Level I Developed Level II Impervious Pervious Construction Extractive Level III Roads Tree Canopy Other (e.g. Buildings, parking lots, etc.) Open Space Turf

26 Value of High-res Land Cover for Phase 6 High-Direct Partial- Indirect Level I Agriculture Level II Commodity Crops Hay and Legume forage Specialty and Other Crops Farmsteads Level III Corn Alfalfa and other legumes Vines Animal Soybeans Non-legume forage Low Cover Non-animal Small Grains Pasture and pastured Cropland High Cover

 Level III")

27 Value of High-res Land Cover for Phase 6 High-Direct Partial- Indirect Level I Natural Level II Forests Wetlands Water (e.g., lakes, streams and ponds) Level III Undisturbed Tidal (saline & fresh) Harvested Floodplain Disturbed (e.g. insects, fire, etc.) Headwater Depressional
28 Phase 6 Land Use Peter Claggett, pclaggett@usgs.gov Quentin Stubbs, qstubbs@usgs.gov
Mapping Phase 6 Land Uses Wetlands Delaware. February 26, 2015 Quentin Stubbs
 Mapping Phase 6 Land Uses Wetlands Delaware February 26, 2015 Quentin Stubbs Phase 6 Land Use Classification WETLANDS Outline Review of Wetland Types and Source Data Preliminary Analysis Methods Results
Mapping Proposed Phase 6 Land Uses and Related Information
 Mapping Proposed Phase 6 Land Uses and Related Information I. INTRODUCTION The goal for developing the Phase 6 Watershed Model Land Use Dataset is to spatially represent all major and unique source areas
Agricultural Model Data Inputs and Assumptions: Presentation to the Water Quality GIT October, 2014
 Agricultural Model Data Inputs and Assumptions: Presentation to the Water Quality GIT October, 2014 Curtis Dell Chair, Agricultural Modeling Subcommittee USDA-ARS PSWMRU October 8, 2014 Precipitation Phase
Maryland Phase II WIP Strategies. MONTGOMERY Agriculture - Annual Practices
 Maryland Phase II Strategies MONTGOMERY Agriculture - Annual Practices BMP Name Conservation Tillage Acres/Year 28,436 27,984 27,677 Cover Crop Acres/Year 4,275 10,816 11,000 Cropland Irrigation Management
E3 Model Scenario Purpose and Definitions
 E3 Model Scenario Purpose and Definitions Gary Shenk (USGS) Jeff Sweeney (EPA) Chesapeake Bay Program Office Water Quality GIT Meeting August 14, 2017 Documentation of E3 and Planning Targets Chesapeake
Research and Conservation Opportunities Arising from a High Resolution LiDAR Mission for the Long Point Biosphere Reserve and Surrounding Region
 Research and Conservation Opportunities Arising from a High Resolution LiDAR Mission for the Long Point Biosphere Reserve and Surrounding Region Dr. Stewart J. Sweeney, Environmental Management Branch,
Planting and Harvesting Crops
 Planting and Harvesting Crops Chesapeake Bay Program Agricultural Workgroup s Building a Better Bay Model Workshop 05/22/2013 Gary Shenk Chesapeake Bay Program s Integrated Analysis Coordinator Photos
Department of the Environment. Use. October 26, 2015 MDP and MDE SSA Stephanie Martins
 Department of the Environment Chesapeake Bay Phase 6 Watershed Model Land- Use October 26, 2015 MDP and MDE SSA Stephanie Martins Stephanie.Martins@Maryland.gov Jeff White Jeff.White@Maryland.gov Shannon
Modeling the Urban Stormwater (and the rest of the watershed) Katherine Antos, Coordinator Water Quality Team U.S. EPA Chesapeake Bay Program Office
 Katherine Antos, Coordinator Water Quality Team U.S. EPA Chesapeake Bay Program Office") Modeling the Urban Stormwater (and the rest of the watershed) Katherine Antos, Coordinator Water Quality Team U.S. EPA Chesapeake Bay Program Office May 13, 2010 Management Actions Chesapeake Bay Program
Modeling the Urban Stormwater (and the rest of the watershed) Katherine Antos, Coordinator Water Quality Team U.S. EPA Chesapeake Bay Program Office May 13, 2010 Management Actions Chesapeake Bay Program
Chesapeake Bay Watershed Model Construction Land Use
 Chesapeake Bay Watershed Model Construction Land Use Guido Yactayo University of Maryland Center for Environmental Science U.S. EPA Chesapeake Bay Program Office Matt Johnston University of Maryland Department
We re looking for residue Have you seen any?
 We re looking for residue Have you seen any? Delaware s Cropland Transect Survey Marcia Fox & Tyler Monteith DNREC Watershed Assessment and Management Section Why residue? What is residue? Leftover crops
Department of the Environment & Maryland Department of Planning. Phase 6 Land-Use. Maryland s Methods
 Department of the Environment & Maryland Department of Planning Phase 6 Land-Use Maryland s Methods Baltimore County Pilot Pilot project using data submitted to MDE Current conditions Parcels & Address
Recent updates to USGS StreamStats application for North Carolina
 J. Curtis Weaver, Hydrologist USGS South Atlantic Water Science Center (Raleigh) Recent updates to USGS StreamStats application for North Carolina U.S. Department of the Interior U.S. Geological Survey
CAST Pass Through Factors and Deliverd Loads for New Wastewater Sources in Phase 6 Model
 CAST Pass Through Factors and Deliverd Loads for New Wastewater Sources in Phase 6 Model A Presentation to the CBP Wastewater Workgroup July 11, 2017 Ning Zhou, CBPO New Wastewater Sources in CAST For
To provide timely, accurate, and useful statistics in service to U.S. agriculture
 NASS MISSION: To provide timely, accurate, and useful statistics in service to U.S. agriculture What does NASS do? Administer USDA s Statistical Estimating Program Conduct the 5-year Census of Agriculture
Recovery Potential Screening: EPA Tools, Data and Support for Watershed Planning and Prioritizing
 Recovery Potential Screening: EPA Tools, Data and Support for Watershed Planning and Prioritizing Doug Norton Watershed Branch WRAPD/OWOW, EPA Office of Water ASWM Webinar, June 2018 1 What is Recovery
Land Conservation & Chesapeake Restoration
 Land Conservation & Chesapeake Restoration Peter Claggett Research Geographer, U.S. Geological Survey Coordinator, CBP Land Use Workgroup May 17, 2018 Maryland Land Conservation Conference Linthicum Heights,
7 Section 7: Land to Water
 7 Section 7: Land to Water 7.1 Introduction As discussed in Section 1, the multiple modeling approach permits P6 to represent processes on a finer scale than previous versions of the Watershed Model. Table
Chesapeake Bay Program Watershed Modeling. Gary Shenk, Lewis Linker, Rich Batiuk Presentation to STAC 3/22/2011
 Chesapeake Bay Program Watershed Modeling Gary Shenk, Lewis Linker, Rich Batiuk Presentation to STAC 3/22/2011 1 Chesapeake Bay Partnership Models 2 Recent History of the Chesapeake Bay Program s Watershed
Integrating Agricultural Land Management into a Watershed Response Model
 Integrating Agricultural Land Management into a Watershed Response Model Adam Freihoefer, Tom Beneke, & Aaron Ruesch Wisconsin Department of Natural Resources NCASI Northern Region Meeting May 6, 2014
Iowa Nutrient Reduction Strategy: Background Information
 Iowa Nutrient Reduction Strategy: Background Information 2013 Iowa Water Conference Reid Christianson, P.E., Ph.D. Center for Watershed Protection Ellicott City, Maryland Project Components Project Goal
USC BMP Definitions - Agricultural Best Management Practices (including NEIEN Code Id)
") USC BMP Definitions - Agricultural Best Management Practices (including NEIEN Code Id) Animal Waste Management Systems or Waste Storage Facility (840, 23) Practices designed for proper handling, storage,
USC BMP Definitions - Agricultural Best Management Practices (including NEIEN Code Id) Animal Waste Management Systems or Waste Storage Facility (840, 23) Practices designed for proper handling, storage,
Laura Zanolli Geography Major/GIS/Geology/Water Resources Portland State University
 Laura Zanolli Geography Major/GIS/Geology/Water Resources Portland State University The canopy is one part of a system of shade and cover that promotes bank stability and along with vegetation helps to
West Fork White River Watershed Conservation Map Summaries. Prepared for the Beaver Watershed Alliance. By the Watershed Conservation Resource Center
 West Fork White River Watershed Conservation Map Summaries Prepared for the Beaver Watershed Alliance By the Watershed Conservation Resource Center November 2014 The Watershed Conservation Resource Center
Prioritizing Water-Quality Improvement Efforts on Agricultural Lands Using LiDAR Elevation Data
 Prioritizing Water-Quality Improvement Efforts on Agricultural Lands Using LiDAR Elevation Data Aaron Ruesch and Theresa Nelson Wisconsin Department of Natural Resources WLWCA March 11, 2014 Outline WLWCA
GLASI GLASI. Priority Subwatershed Project. Great Lakes Agricultural Stewardship Initiative
 GLASI GLASI Great Lakes Agricultural Stewardship Initiative Priority Subwatershed Project Wigle Creek Priority Subwatershed Project Essex Region Conservation Authority Up to $75,000 per eligible farm business
Nitrate removal by Chesapeake watershed riparian buffers and potential additional removal from buffer restoration
 Nitrate removal by Chesapeake watershed riparian buffers and potential additional removal from buffer restoration Donald E. Weller, Matthew E. Baker, and Thomas E. Jordan Smithsonian Environmental Research
Proposed Interim Application Reduction Efficiency
 Proposed Interim Application Reduction Efficiency 1 Terminology Historically, CBP has referred to application reduction as nutrient management Comprehensive nutrient management involves having the correct
Appendix 5A Priority Landscapes GIS Analysis Methodology
 Appendix 5A Priority Landscapes GIS Analysis Methodology Overview This appendix describes the methodology used for Pennsylvania s Priority Landscapes GIS Analysis. The figure below is a conceptual diagram
Spreadsheet Tool for Estimating Pollutant Loads. Models & Decision Support Tools Forum Penn State, Harrisburg, PA August 1, 2011
 Spreadsheet Tool for Estimating Pollutant Loads Models & Decision Support Tools Forum Penn State, Harrisburg, PA August 1, 2011 What is STEPL? A customized MS Excel spreadsheet model Simple and easy to
A Report on the City of Lexington s Existing and Possible Urban Tree Canopy
 A Report on the City of Lexington s Existing and Possible Urban Tree Canopy Project Background Key Terms The analysis of Lexington s urban tree canopy (UTC) was carried out at the request of the Virginia
Chesapeake Bay s Problems
 Environmental Issues for the Chesapeake Bay Russ Perkinson Virginia State Feed Association Conference February 16, 2011 Chesapeake Bay s Problems Congressional appropriation of $27 million for six year
Vegetative Buffer Regulations to Protect Water quality
 Vegetative Buffer Regulations to Protect Water quality Robert Jontos, PWS, CPESC Land-Tech Consultants, Inc. Environmental Scientists and Engineers Connecticut Association of Conservation and Inland Wetland
APPENDIX B: POLLUTANT LOADING ANALYSIS. Appendix B: Pollutant Loading Analysis
 APPENDIX B: POLLUTANT LOADING ANALYSIS Appendix B: Pollutant Loading Analysis This page has been intentionally left blank. Appendix B: Pollutant Loading Analysis Appendix B Pollutant Loading Analysis Methodology
I-3 THE IMPERVIOUS COVER MODEL
 I-3 THE IMPERVIOUS COVER MODEL AT A GLANCE Imperviousness is a metric that represents the sum of roads, parking lots, sidewalks, rooftops, and other impermeable surfaces that prevents water from infiltrating
Degradation of the resource Fertility loss Organic matter Tilth degradation. Water quality Sediment Nutrients
 Near Blue River ca. 1980 Degradation of the resource Fertility loss Organic matter Tilth degradation Water quality Sediment Nutrients Program cost Cheaper to prevent Still expensive Long-term productivity
United States Department of Agriculture (USDA) Highlights of various programs. Wetlands Reserve program (WRP)
 Highlights of various programs. Wetlands Reserve program (WRP)") Funding Sources: (USDA) United States Department of Agriculture The following is a listing of the various funding sources offered to farmers by the USDA. Each source shows the eligibility, what it will
Funding Sources: (USDA) United States Department of Agriculture The following is a listing of the various funding sources offered to farmers by the USDA. Each source shows the eligibility, what it will
Theresa M. Possley Nelson, PE. Wisconsin Department of Natural Resources
 Theresa M. Possley Nelson, PE Wisconsin Department of Natural Resources WLWCA March 10, 2015 Aaron Ruesch Dave Evans Andrew Craig Adam Freihoefer Ann Hirekatur Impaired Waters & TMDLs Nonpoint Source Implementation
Center for Nutrient Solutions (CNS) Nutrient Solution Scenarios Concept Paper September 5, 2014 Draft
 Nutrient Solution Scenarios Concept Paper September 5, 2014 Draft") I. Introduction Center for Nutrient Solutions (CNS) Nutrient Solution Scenarios Concept Paper September 5, 2014 Draft A key goal of the CNS is to develop and test tools for evaluating tactics and strategies
I. Introduction Center for Nutrient Solutions (CNS) Nutrient Solution Scenarios Concept Paper September 5, 2014 Draft A key goal of the CNS is to develop and test tools for evaluating tactics and strategies
California Rapid Assessment Method for Wetlands (CRAM) Introduction
 Introduction") California Rapid Assessment Method for Wetlands (CRAM) Introduction What is CRAM? CRAM is a field-based walk and talk diagnostic tool that, when used as directed, provides rapid, repeatable, numeric assessment
California Rapid Assessment Method for Wetlands (CRAM) Introduction What is CRAM? CRAM is a field-based walk and talk diagnostic tool that, when used as directed, provides rapid, repeatable, numeric assessment
Suggested Citation: Report Prepared by: Shari Clare and Shantel Koenig
 Front Cover Photo: Aerial view of a riparian area in the North Saskatchewan River basin, captured from a unmanned aerial vehicle. Credit: Fiera Biological Consulting Ltd. Suggested Citation: Fiera Biological
CENTRAL COAST POST-CONSTRUCTION REQUIREMENTS IMPLEMENTATION GUIDANCE SERIES 1
 CENTRAL COAST POST-CONSTRUCTION REQUIREMENTS IMPLEMENTATION GUIDANCE SERIES 1 SERIES ISSUE #2: DECENTRALIZED STORMWATER MANAGEMENT TO COMPLY WITH RUNOFF RETENTION POST-CONSTRUCTION STORMWATER CONTROL REQUIREMENTS
Chesapeake Bay Maryland Phase I WIP Strategy Key Concepts: Septics and Stormwater June 13 th, 2011
 1 Chesapeake Bay Maryland Phase I WIP Strategy Key Concepts: Septics and Stormwater June 13 th, 2011 Topics Covered Purpose of Reviewing Phase I WIP Context of our WIP Planning Urban Stormwater Septic
The Water Institute
 The Water Institute http://www.oaecwater.org/ Assessing Cumulative Watershed Stressors: Using LIDAR to Assess the Amount of Open Lands and Young Forest Associated with In- Channel Erosion for North Shore
Impervious Cover as a Indicator and Tool of Watershed Protection
 Impervious Cover as a Indicator and Tool of Watershed Protection Tom Schueler Director of Watershed Research & Practice Center for Watershed Protection Ellicott City, MD trs@cwp.org Key Themes A. The strength
Cost Efficiency and Other
 Cost Efficiency and Other Factors in Urban Stormwater BMP Selection WIP Local Technical Meeting Series November 2013 Greg Busch MarylandDepartmentof the Environment gbusch@mde.state.md.us 1 Which BMPs
What is Urban Tree Canopy?
 The following report was prepared by University of Vermont for Cacapon Institute in support of the WV UTC A&E project. Understanding our tree canopy is an essential first step in setting urban tree canopy
BMP Verification: What is it and How Will it Impact Pennsylvania?
 BMP Verification: What is it and How Will it Impact Pennsylvania? Chesapeake Bay Program Conservation District and Agency Staff Meeting March 13, 2017 + over 400 other unique practices approved by the
New Approaches to Watershed Modelling Using STELLA. WeSMART Conference, December 11, 2014 Heather Cray & Michael McTavish
 New Approaches to Watershed Modelling Using STELLA WeSMART Conference, December 11, 2014 Heather Cray & Michael McTavish Ecosystem Modelling What are models and ecosystem models? Broadly, a model is a
Post-Development Stormwater Runoff Performance Standards
 Post-Development Stormwater Runoff Performance Standards December 9, 2014 Topics Why performance standards? What practices/requirements are in effect in other States? The Workgroup s preliminary and final
USING LIDAR AND RAPIDEYE TO PROVIDE
 USING LIDAR AND RAPIDEYE TO PROVIDE ENHANCED AREA AND YIELD DESCRIPTIONS FOR NEW ZEALAND SMALL-SCALE PLANTATIONS Cong (Vega) Xu Dr. Bruce Manley Dr. Justin Morgenroth School of Forestry, University of
The Impervious Cover Model, Revisited (Again)
") The ICM, Revisited, Again The Impervious Cover Model, Revisited (Again) Tom Schueler Chesapeake Stormwater Network Ellicott City, MD www.chesapeakestormwater.net watershedguy @hotmail.com The Evolution
The ICM, Revisited, Again The Impervious Cover Model, Revisited (Again) Tom Schueler Chesapeake Stormwater Network Ellicott City, MD www.chesapeakestormwater.net watershedguy @hotmail.com The Evolution
Modeling the Influence of Agricultural Practices on Watershed Export of Phosphorus
 Modeling the Influence of Agricultural Practices on Watershed Export of Phosphorus Rem Confesor Jr., Ph.D. Sr. Research Scientist NCWQR, Heidelberg University 310 E. Market St., Tiffin, OH rconfeso@heidelberg.edu
West Virginia Watershed Assessment Pilot Project Outline & Assessment Methodology March 2012
 Introduction The West Virginia Watershed Assessment Pilot Project was developed to define the methodology and identify the information and tools necessary to meet the project objectives stated below. The
1. Does the source or cover type depart in a meaningful way from the average nutrient loading for generic pervious land?
 Scientific and Technical Advisory Committee February 12-13, 2014 Workshop Agenda Location: Sheraton Baltimore North 903 Dulaney Valley Road - Baltimore, MD 21204 Workshop Webpage: http://www.chesapeake.org/stac/workshop.php?activity_id=230
Appendix X: Non-Point Source Pollution
 Appendix X: Non-Point Source Pollution Sources Nonpoint source of pollution, unlike pollution from industrial and sewage treatment plants, comes from many different sources. Nonpoint source pollution is
County- Scale Carbon Estimation in NASA s Carbon Monitoring System
 County- Scale Carbon Estimation in NASA s Carbon Monitoring System Ralph Dubayah, University of Maryland 1. Motivation There is an urgent need to develop carbon monitoring capabilities at fine scales and
A Report on the City of Chesapeake s Existing and Possible Urban Tree Canopy
 A Report on the City of Chesapeake s Existing and Possible Urban Tree Canopy Project Background The analysis of Chesapeake s urban tree canopy (UTC) was carried out at the request of the Virginia Department
Poultry in the Chesapeake Bay Program s Phase 6 Watershed Model
 Poultry in the Chesapeake Bay Program s Phase 6 Watershed Model Matt Johnston University of Maryland CBPO CBPO Non-Point Source Data Analyst Gary Shenk USGS CBPO Phase 6 Model Structure How much? Applied
A Report on the Montgomery County s Existing and Possible Tree Canopy
 A Report on the Montgomery County s Existing and Why is Tree Canopy Important? Tree canopy (TC) is the layer of leaves, branches, and stems of trees that cover the ground when viewed from above. Tree canopy
EFFICIENT UTILIZATION OF ALL CROP NUTRIENTS SAVE TIME AND MONEY INVEST THOSE DOLLARS ELSEWHERE PHOSPHORUS AFFECTS SURFACE WATER (EUTROPHICATION)
") NUTRIENT MANAGEMENT EFFICIENT UTILIZATION OF ALL CROP NUTRIENTS - ON-FARM (MANURE, LEGUMES, SOIL TEST) - PURCHASED FERTILIZER - OTHER (SLUDGE, WHEY, ETC.) WHY THE CONCERN - ECONOMICS SAVE TIME AND MONEY
NUTRIENT MANAGEMENT EFFICIENT UTILIZATION OF ALL CROP NUTRIENTS - ON-FARM (MANURE, LEGUMES, SOIL TEST) - PURCHASED FERTILIZER - OTHER (SLUDGE, WHEY, ETC.) WHY THE CONCERN - ECONOMICS SAVE TIME AND MONEY
Conservation Practices. Conservation Choices. These five icons will show the benefits each practice offers... 6/4/2014
 Conservation Choices Your guide to conservation and environmental farming practices. Conservation Choices These five icons will show the benefits each practice offers... The practice reduces soil erosion
1. Introduction. 1 Black Creek Watershed Management Plan Subwatershed Report
 SUBWATERSHED REPORT 1. Introduction The Watershed Prioritization of s provides a description of s natural features such as hydrology, floodplains, and wetlands, along with consideration of water quality
Production and Conservation Trade-off (PaCT) assessment tool
 assessment tool") Production and Conservation Trade-off (PaCT) assessment tool Seeking to better understand the trade-offs associated with different forms of management practices on ecological and economic outcomes Spatial
Production and Conservation Trade-off (PaCT) assessment tool Seeking to better understand the trade-offs associated with different forms of management practices on ecological and economic outcomes Spatial
East Baton Rouge Parish Micro-Watershed Characterization
 26 th Annual Louisiana Remote Sensing and GIS Workshop José E. Villalobos-Enciso Warren L. Kron, Jr. April 28, 2010 Presentation Outline Objectives Warren Kron Data Warren Kron Concept José Villalobos
Hydroecological tool: enhancements and results. enhancements and results. Marci Meixler. Project partners: Sponsored by:
 Hydroecological tool: Marci Meixler Sponsored by: Project partners: Motivation Great Lakes Charter Annex establish uniform, regional protections for Great Lakes waters ensure that authority over the Lake
Request for Proposal Scope Development Guide. Asotin County Geomorphic Assessment. and. Conceptual Restoration Plan
 Request for Proposal Scope Development Guide Asotin County Geomorphic Assessment and Conceptual Restoration Plan Asotin County Conservation District December 3, 2015 1 1.0 INTRODUCTION The Asotin County
CHATHAM PARK EXCEPTIONAL DESIGN EVALUATION
 CHATHAM PARK EXCEPTIONAL DESIGN EVALUATION 1 Chatham Park Basics 7,600 Acre Mixed Use Development 22,000 New Residences 22 Million Square Feet Commercial Space 60,000 Jobs 2,000+ Acres Open Space Estimated
Jason R. Vogel, Ph.D., P.E. Biosystems and Agricultural Engineering Oklahoma State University
 Stormwater 101 OKLAHOMA STATE UNIVERSITY Biosystems and Agricultural Engineering Department Jason R. Vogel, Ph.D., P.E. Biosystems and Agricultural Engineering Oklahoma State University Stormwater is excess
PA Chesapeake Bay Phase II Watershed Implementation Plan Schuylkill County Planning Targets
 PA Chesapeake Bay Phase II Watershed Implementation Plan Schuylkill County Planning Targets What are Planning Targets? The Chesapeake Bay TMDL established regulatory waste load allocations and load allocations
Telling watershed stories with science
 Telling watershed stories with science An example in Swatara Creek, PA Emily Trentacoste, PhD EPA Chesapeake Bay Program Office Communications Workgroup 11/1/2017 DRAFT. DO NOT CITE OR DISTRIBUTE. * References
15A NCAC 02B.0238 NEUSE RIVER BASIN-NUTRIENT SENSITIVE WATERS MANAGEMENT STRATEGY: AGRICULTURAL NITROGEN REDUCTION STRATEGY The following
 15A NCAC 02B.0238 NEUSE RIVER BASIN-NUTRIENT SENSITIVE WATERS MANAGEMENT STRATEGY: AGRICULTURAL NITROGEN REDUCTION STRATEGY The following requirements apply to all persons in the Neuse River Basin who
California Rapid Assessment Method for Wetlands (CRAM) Buffer and Landscape Context Attribute
 Buffer and Landscape Context Attribute") California Rapid Assessment Method for Wetlands (CRAM) Buffer and Landscape Context Attribute Buffer and Landscape Context Attribute Presence and/or continuity of wetlands and riparian areas adjacent to
California Rapid Assessment Method for Wetlands (CRAM) Buffer and Landscape Context Attribute Buffer and Landscape Context Attribute Presence and/or continuity of wetlands and riparian areas adjacent to
1/16/2016. California Rapid Assessment Method for Wetlands (CRAM) Buffer and Landscape Context Attribute. Buffer and Landscape Context Attribute
 Buffer and Landscape Context Attribute. Buffer and Landscape Context Attribute") California Rapid Assessment Method for Wetlands (CRAM) Buffer and Landscape Context Attribute Buffer and Landscape Context Attribute Presence and/or continuity of wetlands and riparian areas adjacent to
California Rapid Assessment Method for Wetlands (CRAM) Buffer and Landscape Context Attribute Buffer and Landscape Context Attribute Presence and/or continuity of wetlands and riparian areas adjacent to
1985 Scenario Scenario. Tributary Strategy Scenario. Appendix J
 Appendix J Key Chesapeake Bay TMDL Reference and Management Modeling Scenarios: Definitions and Descriptions 1985 Scenario This scenario uses the estimated 1985 land uses, animal numbers, atmospheric deposition,
Future Urbanization in the Chesapeake Bay Watershed
 Future Urbanization in the Chesapeake Bay Watershed Peter Claggett, Labeeb Ahmed, Jacob Czawlytko, David Donato, Fred Irani, Quentin Stubbs, and Renee Thompson Chesapeake Bay Program s Local Government
Appendix E : Guidelines for Riparian Buffer Areas
 Appendix E : Guidelines for Riparian Buffer Areas This document should be read in conjunction with the CRCA Planning Policy. 1.0 PURPOSE The purpose of this document is to summarize the recommendations
Water Quality Buffers for Waters and Wetlands
 Water Quality Buffers for Waters and Wetlands 2008 Nor easter: Indian River Bay Progress Towards Pollution Reduction Goals for the Inland Bays Phosphorus (lbs. per day) Nitrogen (lbs. per day) 1,471
Nelson Branch Data Loggers
 Nelson Branch Data Loggers Pilot Assessment of Stream Temperature for an Impaired Waterway Bill Frost, PE, D.WRE, Sr Water Resources Engineer, KCI Technologies, Inc. Andy Becker, Project Scientist, KCI
Nutrient and Sediment Loss Reduction by Perennial & Cover Crops
 Nutrient and Sediment Loss Reduction by Perennial & Cover Crops Gregory McIsaac, PhD Agricultural Watershed Institute &University of Illinois at Urbana Champaign outline Variability of nutrient and sediment
CHAPTER 6 ADDITIONAL STANDARDS APPLYING TO SHORELAND AREAS AND PUBLIC WATERS
 CHAPTER 6 ADDITIONAL STANDARDS APPLYING TO SHORELAND AREAS AND PUBLIC WATERS Section 1 Intent. 49 Section 2 Floodplain Requirements 49 Section 3 Water-Oriented Accessory Structures 50 Section 4 Stairways,
Land Use Trends and Loss of Perennial Cover in the Corn Belt States: Biomass Crops as a Multifunctional Alternative
 Land Use Trends and Loss of Perennial Cover in the Corn Belt States: Biomass Crops as a Multifunctional Alternative Mid-Continent Regional Science Association 44 th Annual Conference May 29-31, 2013 Kansas
Introduction to the Riparian Areas Regulation
 Information Note #1: Introduction to the Riparian Areas Regulation This Information Note is a guide only. It is not a substitute for the federal Fisheries Act, the provincial Riparian Areas Regulation,
Chesapeake Bay Program Models:
 Chesapeake Bay Program Models: A Guide to Better Understanding Modeling and Decision Support Tool Forum Penn State Harrisburg August 1, 2011 1 Mark Dubin Agricultural Technical Coordinator University of
Modeling Nutrient and Sediment Losses from Cropland D. J. Mulla Dept. Soil, Water, & Climate University of Minnesota
 Modeling Nutrient and Sediment Losses from Cropland D. J. Mulla Dept. Soil, Water, & Climate University of Minnesota Watershed Management Framework Identify the problems and their extent Monitor water
Watercourses and Wetlands and Agricultural Activities
 Watercourses and Wetlands and Agricultural Activities Watercourses and regulated wetlands can be found throughout New Brunswick, including on agricultural lands. The Clean Water Act defines a watercourse
ORDINANCE APPENDIX C RUNOFF COEFFICIENTS AND CURVE NUMBERS
 ORDINANCE APPENDIX C RUNOFF COEFFICIENTS AND CURVE NUMBERS TABLE C-1. RUNOFF CURVE NUMBERS Source: Table 2-2a, Table 2-2b, and Table 2-2c from U. S. Department of Agriculture, Natural Resources Conservation
Floodplains are an important constituent of coho habitats and can be targeted for restoration. NetMap s advanced floodplain mapping tool calculates
 1 2 3 Floodplains are an important constituent of coho habitats and can be targeted for restoration. NetMap s advanced floodplain mapping tool calculates floodplains based on multiples of bankfull depths
NWI 2007 NEW TOOLS AND TECHNOLOGIES. Ralph Tiner Wetland Ecologist U.S. Fish & Wildlife Service National Wetlands Inventory Program
 NWI 2007 NEW TOOLS AND TECHNOLOGIES Ralph Tiner Wetland Ecologist U.S. Fish & Wildlife Service National Wetlands Inventory Program WHERE WE ARE GOING Improved mapping Expanded wetland classification Preliminary
WATER, HEAT STRESS, AND DROUGHT
 WATER, HEAT STRESS, AND DROUGHT Barbara Bellows, NCAT Agriculture Specialist 2004 NCAT Slide 1 800-346-9140 www.attra.ncat.org Livestock Water Use Criteria Animal characteristics Animal species and breed
Field-based Agricultural Resource Inventory of the Innisfil Creek Subwatershed, 2015
 Nottawasaga Valley Conservation Authority Field-based Agricultural Resource Inventory of the Innisfil Creek Subwatershed, 2015 August 12, 2015 Written By: Stephanie McPhie and Ryan Post 8195 8 th Line,
Manure Management Manual Revisions
 Manure Management Manual Revisions Jim Spontak PA DEP Farms In PA 63,136 farms in PA 33813 have livestock Average farm is 124 acres, about 75% under 200 acres Women as the primary farm operator increased
A Report on the City of Newport News Existing and Possible Urban Tree Canopy
 A Report on the City of Newport News Existing and Possible Urban Tree Canopy Key Terms UTC: Urban tree canopy (UTC) is the layer of leaves, branches, and stems of trees that cover the ground when viewed
The Midpoint Assessment and Phase III WIP
 The Midpoint Assessment and Phase III WIP A Regional Workshop from the Maryland Department of the Environment Generously sponsored by the Harry R. Hughes Center for Agro-Ecology of the University of Maryland
Agriculture in the Great Lakes Basin Stewardship and Innovation
 Agriculture in the Great Lakes Basin Stewardship and Innovation November 2008 AGRICULTURE IS IMPORTANT IN THE GREAT LAKES BASIN The Great Lakes Basin provides 20 per cent of the world s fresh surface water,
Agricultural Trip Generation - Linking Spatial Data and Travel Demand Modeling using SAS
 MWSUG 2017 Paper AA18 Agricultural Trip Generation - Linking Spatial Data and Travel Demand Modeling using SAS Alan Dybing, North Dakota State University UGPTI, Fargo, ND ABSTRACT Data linkages from GIS
Integrating erosion and phosphorus runoff assessment with nutrient management planning in SnapPlus
 Integrating erosion and phosphorus runoff assessment with nutrient management planning in SnapPlus L Laura Ward Good Department of Soil Science University of Wisconsin-Madison What is nutrient management
FieldDoc.io User Guide For 2016 NFWF Chesapeake Bay Stewardship Fund Applicants
 FieldDoc.io User Guide For 2016 NFWF Chesapeake Bay Stewardship Fund Applicants This guide provides step-by-step instructions for the use of FieldDoc.io to estimate nutrient and sediment load reductions
Attachment # 1. Commonwealth of Pennsylvania. Pennsylvania Code. Title 25. Environmental Protection. Department of Environmental Protection
 Attachment # 1 Commonwealth of Pennsylvania Pennsylvania Code Title 25. Environmental Protection Department of Environmental Protection Chapter 102.4 1 Attachment #1 Pennsylvania Code, 102.4 Erosion and
2010 Growing Season - Barton County, Kansas Land Cover Summary
 2010 Growing Season - Barton County, Kansas Land Cover Summary Number of Fields Percent of Total Fields Total Acres Percent of Acres ALFALFA 39 7.1% 3,075.5 6.4% CORN 45 8.1% 5,328.6 11.1% CRP 4 0.7% 408.5