To provide timely, accurate, and useful statistics in service to U.S. agriculture
|
|
|
- Cory Fleming
- 6 years ago
- Views:
Transcription

1 NASS MISSION: To provide timely, accurate, and useful statistics in service to U.S. agriculture What does NASS do? Administer USDA s Statistical Estimating Program Conduct the 5-year Census of Agriculture Coordinate Federal/State agricultural statistical needs Provide statistical consulting for Federal/State governments, universities, and other countries Collect and summarize agricultural data under reimbursable agreements Conduct statistical research Rick Mueller National Agricultural Statistics Service Research and Development Division Spatial Analysis Research September 2,


2 NASS issues about 500 statistical reports each year and about 9,000 reports and news releases from its 46 field offices County Estimates Census of Agriculture Vegetation Condition NASS begins preparing year end county crop production estimates immediately after publishing the annual Crop Production Summary in January Cropland Data Layer 2
3 The NASS Annual County Estimates Program provides for the collection of crop data through cooperative agreements with each state Measures year to year change at the county level The county data are assembled starting with the state estimate and working back to the county NASS Field Offices set the annual county estimates for acreage, yield and production and submit them to headquarters for dissemination A release schedule provides the dates for when the data is available 3


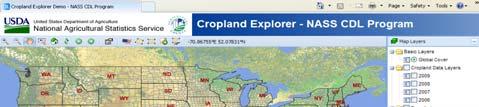
4 Data can be accessed using Quick Stats interactive statistical database from County maps can be accessed by selecting Charts and Maps-County Maps from 4
5 5


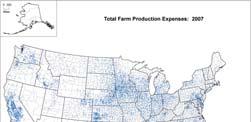
6 Ethanol maps showing US and State level corn production with ethanol plant locations can be accessed by selecting Charts and Maps- selecting A Z & Ethanol Plants Ethanol Plants and Corn Production by County 2007 Census of Agriculture Census of Agriculture is conducted every 5 years A complete accounting of crops and livestock on all farms Collects information on operator characteristics, demographics, income and expenses 6


7 The 2007 Census of Agriculture Guide to Census Products can be accessed by selecting 2007 Census from Users can view or download census data online using the Quick Stats database Users can download Desktop Query Tool to their desktop Users can view, print or download static maps 2007 Census data can be accessed using the Quick Stats database 7


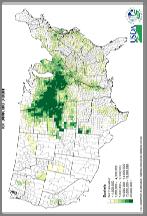
8 The Desktop Data Query Tool allows users offline access to the 2007 data Users are able to query by Census table Data can be downloaded as csv files for use in a spreadsheet or in a GIS 250 Static Atlas Maps are available in the following areas Crops and Plants Economics Farms Livestock and Animals Operators 8
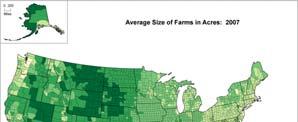
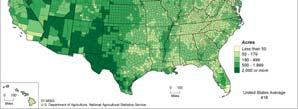

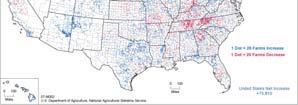
9 Choropleth (shaded) Maps Dot Density Maps Dot Density Change Maps 9


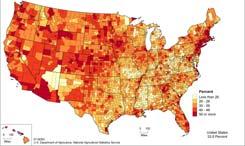
10 Farms Farms Farms with Internet Access 10

11 Economics Economics Economics 11

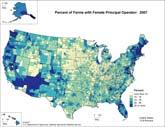
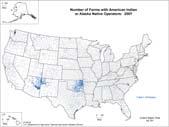
12 Operators Operators Operators 12

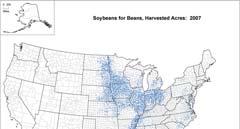
13 Crops Crops 13


14 County profiles Watershed data published at the 6 digit hydrologic unit code for 38 selected landuse characteristics Vegetation condition images can be accessed from Research and Science 14
15 Bi-weekly composite images utilizing the normalized difference vegetation index (NDVI) from the Advanced Very High Resolution Radiometer (AVHRR) weather satellite. Integration of remote sensing along with survey data are used to illustrate weather effects on various sources of information Weather satellite is used to monitor changing vegetation conditions throughout the growing season Vegetation condition images are based on a Normalized Vegetation Index or NDVI The NDVI measures vegetation vigor (greenness) caused by "chlorophyll activity NDVI values have been shown to have a close relationship to the growth stages of crops 15


16 Vegetation Condition Vegetation Condition Lower NDVI values are likely to show areas under stress due to drought excessive moisture disease Higher NDVI values represent healthy vegetation 16

?")


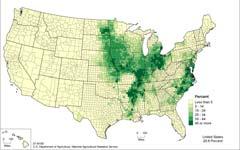
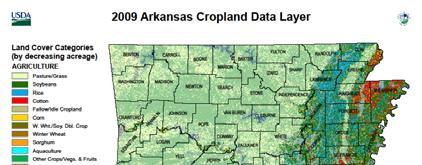
17 1998 Drought in Texas What is a Cropland Data Layer (CDL)? Identifies agriculture type and location Each pixel represents a type of crop or land cover 1996 Drought in Winter Wheat Areas 48 State Continental US Coverage 17


18 Cropland Data Layer can be accessed from Research and Science Cropland Data Layer is available on CD-ROM or DVD and from the NRCS Geospatial Data Gateway Release, Jan 4, 2010 National product 56m 18
19 Cropland Data Layer Objectives Cropland Data Layers Cropland Data Layer Program Components & Census by Satellite Without area duplication Annually cover major program crop regions Provide timely, accurate, useful independent estimates t Measurable error County, State, District and Watershed level Output crop specific Cropland Data Layer Distribute free to public NRCS Geospatial Data Gateway Publish accuracy statistics/metadata 07 & & & & Inputs o Resourcesat-1 AWiFS & Landsat imagery o Farm Service Agency Common Land Unit o NASS June Ag Survey o Ancillary data -USGS NLCD & derivative products Outputs o Acreage Estimates o Cropland Data Layer Process o Commercial software 19


20 Satellite Imagery - AWiFS & Landsat TM Farm Service Agency CLU NLCD & Derivative products NASS June Agriculture Survey Ground Truth Preparation ESRI ArcMap Image Preparation Leica Geosystems ERDAS Imagine 9.1 Image Classification See 5 Acreage Estimates SAS/IML Workshop See5 Decision Tree State-of-the-art technique for image classification Relatively inexpensive ($900) Uses ground truth categories and spectral bands from imagery to define specific rules to classify imagery Incorporates a powerful ensemble method known as boosting 20
21 Data Partnerships Foreign Agricultural Service o Resourcesat-1 AWiFS Farm Service Agency o Common Land Unit ground truth US Geological Survey o National Land Cover Dataset US Geological Survey/ NASA o Landsat TM 5 & 7 o MODIS Cropland Data Layer The CDL program has undergone major restructuring, reengineering and modernization the past few years. The new efficiencies allow for production of inseason crop acreage estimates, that were not previously possible with our older methods. The CDL is now able to deliver state/district/county estimates throughout the growing season starting with Winter Wheat for the June 30 th Crop Acreage Report. Additional states are processed as the growing season progresses NASS Estimation Systems NASS Satellite Census & Systems Surveys *Geospatial Decision Support Systems USDA NASS Field Administrative Offices Data * NASS Uses Geospatial Decision NASS Support Systems to provide updated Agricultural information to the Ag Statistics Board Statistics Board and data users National, State, District, County Estimates 21


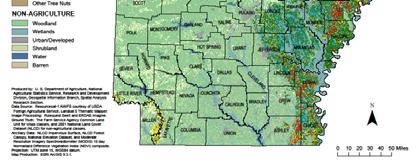
22 Agriculture Ground Truth Non-Agriculture Ground Truth Acreage Report Winter Wheat Crop Production Report Corn & Soybeans The CLUs from the Farm Service Agency supply the agricultural data needed to distinguish between the different crop types in a particular state Provided by Farm Service Agency Identifies known fields and crops Divide known fields into 2 sets 70 % used for training software 30% used for validating results USGS National Land Cover Dataset Identifies urban infrastructure and non-agriculture land cover Forest, grass, water, cities Crop Production Report CDL Cotton, Rice, & Peanuts The National Land Cover Data (NLCD) is used to identify areas of urban infrastructure, like cities and roads, as well as land cover that is not considered agriculture, like forest, wetland or water Small Grains Summary Crop Production Report All Crops 22


23 Satellite Imagery Ancillary Data Sampling Done by See5 Decision Tree Forest Canopy Elevation Impervious Surfaces Ground Truth Classification Ancillary datasets help separate the agricultural landscape; determining agricultural potential 23
24 24


25 Operational Program Early delivery of estimates Provides measureable statistical error Results used for setting national acreage estimate Components AWiFS/Landsat imagery Farm Service Agency Commercial Software June Agricultural Survey Distribution datagateway.nrcs.usda.gov 25


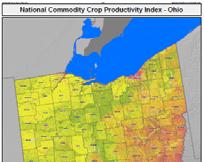
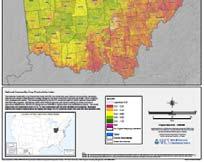
26 CDL program paramount to other NASS geospatial activities Partnerships with cooperating agencies critical for success Heavy reliance on satellites and information technology National CDL crop year 2010 Target release Jan 2011 Funded Geospatial CDL portal George Mason University/Center for Spatial Information Science and Systems National Commodity Crop Productivity Index NRCS dynamic soils layer Change analysis Live CDL Timely delivery of geospatial data and statistical information are critical 26
27 California Change Map 27
28 County Estimates Accessing NASS County maps and County data Census of Agriculture Accessing AgAtlas maps and Census data Vegetation Condition Accessing vegetation condition maps Cropland Data Layer Accessing the CDL from the NRCS Geospatial Gateway 28
Remote Sensing Uses in Agriculture at NASS
 Remote Sensing Uses in Agriculture at NASS United States Department of Agriculture (USDA) National Agriculture Statistics Service (NASS) Research and Development Division Geospatial Information Branch
Cropland Mapping with Satellite Data
 Cropland Mapping with Satellite Data Rick Mueller Head/Spatial Analysis Research USDA/National Agricultural Statistics Service Border-Area Water Management Remote Sensing Workshop Agenda Cropland Data
Remote Sensing for Monitoring USA Crop Production: What is the State of the Technology
 Remote Sensing for Monitoring USA Crop Production: What is the State of the Technology Monitoring Food Security Threats from Space - A CELC Seminar Centurion, SA 21 April 2016 David M. Johnson Geographer
Rapid Land Use and Land Cover Database Development
 Rapid Land Use and Land Cover Database Development Utility of the Land Use and Land Cover Database Socio-Economic Climate Change Water Quantity Water Quality 2 Overview of the Mapping Approach Goal: Develop
ArcGIS Agricultural Land-Use Maps: The Mississippi Cropland Data Layer Fred L. Shore, Ph.D., Thomas L. Gregory, and Rick Mueller
 ESRI Federal User Conference, 1/31/06-2/02/06, Washington, D.C. ArcGIS Agricultural Land-Use Maps: The Mississippi Cropland Data Layer Fred L. Shore, Ph.D., Thomas L. Gregory, and Rick Mueller Abstract:
National Agricultural Statistics Service Overview
 National Agricultural Statistics Service Overview Hubert Hamer, Administrator USDA s National Agricultural Statistics Service Lincoln, Nebraska September 24, 2016 Mission of NASS The National Agricultural
EVALUATING THE ACCURACY OF 2005 MULTITEMPORAL TM AND AWiFS IMAGERY FOR CROPLAND CLASSIFICATION OF NEBRASKA INTRODUCTION
 EVALUATING THE ACCURACY OF 2005 MULTITEMPORAL TM AND AWiFS IMAGERY FOR CROPLAND CLASSIFICATION OF NEBRASKA Robert Seffrin, Statistician US Department of Agriculture National Agricultural Statistics Service
A Report on the City of Lexington s Existing and Possible Urban Tree Canopy
 A Report on the City of Lexington s Existing and Possible Urban Tree Canopy Project Background Key Terms The analysis of Lexington s urban tree canopy (UTC) was carried out at the request of the Virginia
Use of Remote Sensing to Measure Land Use Change from Biofuel Production
 Studies assert that the conversion process of native ecosystems to agriculture for biofuel production may result in carbon releases from native biomass and negatively affect the greenhouse gas profile
A Report on the City of Radford s Existing and Possible Urban Tree Canopy
 A Report on the City of Radford s Existing and Possible Urban Tree Canopy Project Background Key Terms The analysis of Radford s urban tree canopy (UTC) was carried out at the request of the Virginia Department
Agricultural Trip Generation - Linking Spatial Data and Travel Demand Modeling using SAS
 MWSUG 2017 Paper AA18 Agricultural Trip Generation - Linking Spatial Data and Travel Demand Modeling using SAS Alan Dybing, North Dakota State University UGPTI, Fargo, ND ABSTRACT Data linkages from GIS
SOUTHERN INDIANA 2008 FLOODS: DAMAGE ASSESSMENT AND WEB MAPPING
 SOUTHERN INDIANA 2008 FLOODS: DAMAGE ASSESSMENT AND WEB MAPPING Ejaz Hussain KyoHyouk kkim Jie Shan, Associate Professor {ehussain,kim458,jshan}@,j purdue.edu Tel:765-494-2168 School Of Civil Engineering
Crop mapping with satellite data
 Crop mapping with satellite data Dr. C.S. Murthy Head, Agricultural Sciences and Applications National Remote Sensing Centre, Hyderabad murthy_cs@nrsc.gov.in, csmurthy09@gmail.com Geospatial Technology
Phase 6 Land Use. Peter Claggett, U.S. Geological Survey Quentin Stubbs, U.S. Geological Survey
 Phase 6 Land Use Peter Claggett, U.S. Geological Survey Quentin Stubbs, U.S. Geological Survey Building a 2012 Phase 6 Land Use Raster Database: Land Use Land Cover Two Primary Approaches Towards constructing
Groundwater and Agricultural Bioenergy
 Groundwater and Agricultural Bioenergy Feedstock Production Noel Gollehon Natural Resources Conservation Service, USDA 2011 Ground Water Protection Council Annual Forum Atlanta GA September 26, 2011 September
A Report on the City of Newport News Existing and Possible Urban Tree Canopy
 A Report on the City of Newport News Existing and Possible Urban Tree Canopy Key Terms UTC: Urban tree canopy (UTC) is the layer of leaves, branches, and stems of trees that cover the ground when viewed
MOBILE BAY. Darius Hixon (Project Lead) Austin Clark Tyler Lynn Manoela Rosa. Monitoring Marsh Conditions in Coastal Alabama. Conservation Initiatives
 Austin Clark Tyler Lynn Manoela Rosa. Monitoring Marsh Conditions in Coastal Alabama. Conservation Initiatives") National Aeronautics and Space Administration MOBILE BAY MOBILE ECOLOGICAL BAY ECOLOGICAL FORECASTING FORECASTING II II Monitoring Marsh Conditions in Coastal Alabama Monitoring Using NASA Marsh Earth
National Aeronautics and Space Administration MOBILE BAY MOBILE ECOLOGICAL BAY ECOLOGICAL FORECASTING FORECASTING II II Monitoring Marsh Conditions in Coastal Alabama Monitoring Using NASA Marsh Earth
A Report on the City of Chesapeake s Existing and Possible Urban Tree Canopy
 A Report on the City of Chesapeake s Existing and Possible Urban Tree Canopy Project Background The analysis of Chesapeake s urban tree canopy (UTC) was carried out at the request of the Virginia Department
Integrated Modeling: ENVISION
 Integrated Modeling: ENVISION Cimarron River Watershed Gehendra Kharel Oklahoma State University Cimarron River Watershed Research and Extension Symposium November 17, 2016 1 Research, Data Archiving,
Estimating Soil Carbon Sequestration Potential: Regional Differences and Remote Sensing
 Estimating Soil Carbon Sequestration Potential: Regional Differences and Remote Sensing Tris West Environmental Sciences Division Technical Working Group on Agricultural Greenhouse Gases (T-AGG): Experts
Rapid National Model Assessments to Support US Conservation Policy Planning Mike White
 Rapid National Model Assessments to Support US Conservation Policy Planning Mike White USDA-ARS Grassland, Soil and Water Research Laboratory, Temple, TX 1 Topics Current National Assessments Future National
Regional Ecosystem Analysis Puget Sound Metropolitan Area
 Final Report: 7/25/98 Regional Ecosystem Analysis Puget Sound Metropolitan Area Calculating the Value of Nature Report Contents 2 Project Overview and Major Findings 3 Regional Level Analysis 4 Neighborhood
New Tech Predicts Local Corn Supply. -The Opportunities and Limits of Statistical Ag Data-
 New Tech Predicts Local Corn Supply -The Opportunities and Limits of Statistical Ag Data- Presented by: Steffen Mueller, PhD Principal Economist Biofuel and Bioenergy Research University of Illinois at
REMOTE SENSING, NORMALIZED DIFFERENCE VEGETATION INDEX (NDVI), AND CROP YIELD FORECASTING XIJIE LV THESIS
, AND CROP YIELD FORECASTING XIJIE LV THESIS") REMOTE SENSING, NORMALIZED DIFFERENCE VEGETATION INDEX (NDVI), AND CROP YIELD FORECASTING BY XIJIE LV THESIS Submitted in partial fulfillment of the requirements for the degree of Master of Science in
REMOTE SENSING, NORMALIZED DIFFERENCE VEGETATION INDEX (NDVI), AND CROP YIELD FORECASTING BY XIJIE LV THESIS Submitted in partial fulfillment of the requirements for the degree of Master of Science in
system that supports soil and crop water management.
 NEWS ON IRRIGATING THE SOIL TO MAXIMIZE THE CROP AN APPROACH FOR WHEAT TO EFFICIENT AND ENVIRONMENTALLY SUSTAINABLE IRRIGATION WATER MANAGEMENT IN KENTUCKY Ole Wendroth, Javier Reyes, Xi Zhang, and Chad
Figure Zimbabwe Crop Assessment Route
 1 of 8 June 2, 2009 Satellite Imagery Indicates 2009 Corn Area in Zimbabwe Is Less Than Corn Area in 2000 USDA s Foreign Agricultural Service (FAS) performed a mid-season crop assessment in Zimbabwe from
Laura Zanolli Geography Major/GIS/Geology/Water Resources Portland State University
 Laura Zanolli Geography Major/GIS/Geology/Water Resources Portland State University The canopy is one part of a system of shade and cover that promotes bank stability and along with vegetation helps to
COMPARATIVE STUDY OF NDVI AND SAVI VEGETATION INDICES IN ANANTAPUR DISTRICT SEMI-ARID AREAS
 International Journal of Civil Engineering and Technology (IJCIET) Volume 8, Issue 4, April 2017, pp. 559 566 Article ID: IJCIET_08_04_063 Available online at http://www.iaeme.com/ijciet/issues.asp?jtype=ijciet&vtype=8&itype=4
Urban Ecosystem Analysis Roanoke, Virginia
 June 2002 Urban Ecosystem Analysis Roanoke, Virginia Calculating the Value of Nature Report Contents 2-3 Project Overview 4 Major Findings 5 Roanoke Area Green Data Layer 6 Tree Canopy Loss Over Time 7
Local Ecosystem Analysis Garland, Texas Calculating the Value of Nature
 April 2000 Local Ecosystem Analysis Garland, Texas Calculating the Value of Nature Report Contents 2 Project Overview and Major Findings 3 Urban Ecosystem Analysis Methods 4-5 Garland Study Sites 6 Analysis
Crop Information Portal Agriculture Information System Building Provincial Capacity for Crop Forecasting and Estimation
 International Conference on Innovative Agricultural Financing April 28-29, 2015 at Hotel Serena Islamabad Day 1 Tuesday 28 April 2015 Session B: Digital platforms in building data-ecosystem for agri-finance
Satellite image classification of vegetation and surface water for assessment of flood damage to agricultural crops
 Satellite image classification of vegetation and surface water for assessment of flood damage to agricultural crops Lisa Colson 2, Mark Lindeman 1, Dath Mita 1, Tatiana Nawrocki 2, Paulette Sandene 1,
Drought Indicators for the SADC
 Drought Indicators for the SADC Bruce Eady DHI-SA Annual Conference Coping with Drought: Adaptions to Water Stress in the Face of Climate Change Agenda Introduction Satellite Data Drought and Flood Portal
A Report on the City of Richmond s Existing and Possible Urban Tree Canopy
 A Report on the City of Richmond s Existing and Possible Urban Tree Canopy Key Terms UTC: Urban tree canopy (UTC) is the layer of leaves, branches, and stems of trees that cover the ground when viewed
A Report on Greater Fairfax County s Existing and Possible Tree Canopy
 A Report on Greater Fairfax County s Existing and Possible Tree Canopy Why is Tree Canopy Important? Tree canopy (TC) is the layer of leaves, branches, and stems of trees that cover the ground when viewed
A Report on Existing and Possible Tree Canopy in the borough of Pottstown, PA
 Pottstown Land Cover A Report on Existing and Possible Tree Canopy in the borough of Pottstown, PA Why is Tree Canopy Important? Tree canopy (TC) is the layer of leaves, branches, and stems of trees that
Climate Data and Drought Research
 Climate Data and Drought Research Can NLWIS Help the Drought Research Initiative? A. Howard: Agriculture and Agri-Food Canada What is the National Land and Water Information Service? An across-canada,
Regional Ecosystem Analysis for Metropolitan Denver and Cities of The Northern Front Range, Colorado
 April 2001 Regional Ecosystem Analysis for Metropolitan Denver and Cities of The Northern Front Range, Colorado Calculating the Value of Nature Report Contents 2 Project Overview and Major Findings 5 Local
Research projects of Landuse changes in Latvia
 Research projects of Landuse changes in Latvia Ilmars Krampis University of Latvia, faculty of Geography and Earth Science Juris Zariņš Latvian State Forest Research Institute "Silava" Joint NASA LCLUC
Recent HARVIST Results: Classifying Crops from Remote Sensing Data
 Recent HARVIST Results: Classifying Crops from Remote Sensing Data Kiri Wagstaff and Dominic Mazzoni (kiri.wagstaff@jpl.nasa.gov) Jet Propulsion Laboratory, California Institute of Technology, 4800 Oak
Outlook for the 2014 U.S. Farm Economy. Kevin Patrick Farm Economy Branch Resource and Rural Economics Division
 Outlook for the 214 U.S. Farm Economy Kevin Patrick Farm Economy Branch Resource and Rural Economics Division Overview Net farm income in 214 forecast: $95.8 billion Down more than 25% from 213 Net cash
Collaboration of Space Research Institute NASU-SSAU with EC JRC on satellite monitoring for food security: background and prospects
 Collaboration of Space Research Institute NASU-SSAU with EC JRC on satellite monitoring for food security: background and prospects Prof. Nataliia Kussul 1 Space Research Institute NASU-SSAU, Ukraine Context
TARGETING WATERSHEDS FOR RESTORATION ACTIVITIES IN THE CHESAPEAKE BAY WATERSHED. Technical Documentation October 4, 2002
 TARGETING WATERSHEDS FOR RESTORATION ACTIVITIES IN THE CHESAPEAKE BAY WATERSHED Technical Documentation October 4, 2002 Acknowledgements and Disclaimer This project was funded by the Chesapeake Bay Foundation,
30 Years of Tree Canopy Cover Change in Unincorporated and Incorporated Areas of Orange County,
 30 Years of Tree Canopy Cover Change in Unincorporated and Incorporated Areas of Orange County, 1986-2016 Final Report to Orange County July 2017 Authors Dr. Shawn Landry, USF Water Institute, University
Expert Meeting on Crop Monitoring for Improved Food Security, 17 February 2014, Vientiane, Lao PDR. By: Scientific Context
 Satellite Based Crop Monitoring & Estimation System for Food Security Application in Bangladesh Expert Meeting on Crop Monitoring for Improved Food Security, 17 February 2014, Vientiane, Lao PDR By: Bangladesh
Crop Growth Remote Sensing Monitoring and its Application
 Sensors & Transducers 2014 by IFSA Publishing, S. L. http://www.sensorsportal.com Crop Growth Remote Sensing Monitoring and its Application Delan Xiong International School of Education, Xuchang University,
Overview of Selected USDA Agencies and Efforts Related to Agriculture, Groundwater, and Water Availability
 Overview of Selected USDA Agencies and Efforts Related to Agriculture, Groundwater, and Water Availability Mary Scruggs Senior Advisor for Water Resources Office of the Chief Scientist United States Department
WATERSHED LAND COVER CHANGE IN GUAM. Yuming Wen Shahram Khosrowpanah Leroy F. Heitz
 WATERSHED LAND COVER CHANGE IN GUAM Yuming Wen Shahram Khosrowpanah Leroy F. Heitz Technical Report No. 124 March 2009 Watershed Land Cover Change in Guam by Yuming Wen Shahram Khosrowpanah Leroy F. Heitz
Time Series Evapotranspiration and Applied Water Estimates from Remote Sensing
 Applied Water Estimates from Remote Sensing Prepared By March 213 Contents Kaweah Delta Water Conservation District Time Series Evapotranspiration and Applied Water Estimates from Remote Sensing Contents
DETERMINING LAND USE CHANGE WITHIN THE DOG RIVER WATERSHED USING LANDSAT IMAGERY
 DETERMINING LAND USE CHANGE WITHIN THE DOG RIVER WATERSHED USING LANDSAT IMAGERY Joshua M. Pritchard, Department of Earth Sciences, University of South Alabama, Mobile, AL 36688-0002. E-mail: jmp601@gmail.com.
DIFFERENCES IN ONSET OF GREENNESS: A MULTITEMPORAL ANALYSIS OF GRASS AND WHEAT IN KANSAS*
 Houts, M. E., K. P. Price, and E. A. Martinko. 2001. Differences in onset of Greenness: A multitemporal analysis of Grass and Wheat in Kansas. Proceedings, Annual Convention, American Society of Photogrammetric
Crop Progress. Special Note
 Crop Progress ISSN: 0 Released November, 0, by the National Agricultural Statistics Service (NASS), Agricultural Statistics Board, United s Department of Agriculture (USDA). Special Note COMING SOON NASS
FOREST COVER MAPPING AND GROWING STOCK ESTIMATION OF INDIA S FORESTS
 FOREST COVER MAPPING AND GROWING STOCK ESTIMATION OF INDIA S FORESTS GOFC-GOLD Workshop On Reducing Emissions from Deforestations 17-19 April 2007 in Santa Cruz, Bolivia Devendra PANDEY Forest Survey of
Crop Monitoring for Food Security from Space
 San Diego, 18-22 February 2010 AAAS Annual Meeting 1 Crop Monitoring for Food Security from Space Felix Rembold Joint Research Centre (JRC) The European Commission s Research-Based Policy Support Organisation
Field-Scale Targeting of Cropland Sediment Yields Using ArcSWAT
 Field-Scale Targeting of Cropland Sediment Yields Using ArcSWAT Prasad Daggupati Biological and Agricultural Engineering, Kansas State University, 30A Seaton Hall, Manhattan, KS 66506, prasad9@ksu.edu
Evaluating Vegetation Evapotranspiration (VegET) Modeling Results in South Dakota
 Modeling Results in South Dakota") Evaluating Vegetation Evapotranspiration (VegET) Modeling Results in South Dakota Gabriel Senay 1 and Geoffrey Henebry 2 1 SAIC, contractor to the U.S. Geological Survey (USGS) Center for Earth Resources
Evaluating Vegetation Evapotranspiration (VegET) Modeling Results in South Dakota Gabriel Senay 1 and Geoffrey Henebry 2 1 SAIC, contractor to the U.S. Geological Survey (USGS) Center for Earth Resources
Objectives of the Study
 Integration of AGNPS, GIS, and Remote Sensing for Estimating Nonpoint Source Pollution in the Saginaw Bay, Michigan Chansheng He Department of Geograophy Western Michigan University Kalamazoo, MI 49008
Tracking Restoration Success
 Tracking Restoration Success A Presentation on Duette Preserve Environmental Monitoring Program Parks & Natural Resources Department Environmental Protection Division 1112 Manatee Avenue West, Suite 203
REMOTE SENSING: DISRUPTIVE TECHNOLOGY IN AGRICULTURE? DIPAK PAUDYAL
 Place image here (13.33 x 3.5 ) REMOTE SENSING: DISRUPTIVE TECHNOLOGY IN AGRICULTURE? DIPAK PAUDYAL Principal Consultant, Remote Sensing- Esri Australia Adjunct Associate Prof., University of Queensland
A Report on the City of Portsmouth s Existing and Possible Urban Tree Canopy
 A Report on the City of Portsmouth s Existing and Possible Urban Tree Canopy Key Terms Project Background UTC: Urban tree canopy (UTC) is the layer of leaves, branches, and stems of trees that cover the
Use of Remote Sensing Technology in Crop Monitoring and Assessment of Impact of Natural Disaster
 Use of Remote Sensing Technology in Crop Monitoring and Assessment of Impact of Natural Disaster Shibendu S. Ray Mahalanobis National Crop Forecast Centre Department of Agriculture & Cooperation Government
Overview of the NASS Nuts and Pecan Estimating Program. USDA National Agricultural Statistics Service New Orleans, LA February 18, 2011
 NASS NUTS and PECAN ESTIMATES Overview of the NASS Nuts and Pecan Estimating Program USDA National Agricultural Statistics Service New Orleans, LA February 18, 2011 NASS National Agricultural Statistics
Theresa M. Possley Nelson, PE. Wisconsin Department of Natural Resources
 Theresa M. Possley Nelson, PE Wisconsin Department of Natural Resources WLWCA March 10, 2015 Aaron Ruesch Dave Evans Andrew Craig Adam Freihoefer Ann Hirekatur Impaired Waters & TMDLs Nonpoint Source Implementation
Tree Canopy Mapping & Modeling of Ecosystem Services for Georgia Communities
 Brown Bag Webinar March 31, 2010 Tree Canopy Mapping & Modeling of Ecosystem Services for Georgia Communities AGRICULTURE COMMERCIAL INDUSTRIAL/OFFICE PROW PUBLIC/SEMI-PUBLIC RESIDENTIAL VACANT 0 1,000
Mapping Urban Tree Canopy in Virginia Localities
 Mapping Urban Tree Canopy in Virginia Localities Jennifer McKee 1, Jim Pugh 2, John McGee 1, Randy Wynne 1 Virginia Tech Department of Forest Resources and Environmental Conservation 1, Virginia Department
DMC 22m Sensors for Supertemporal Land Cover Monitoring. Gary Holmes DMC International Imaging Ltd June 2014
 DMC 22m Sensors for Supertemporal Land Cover Monitoring Gary Holmes DMC International Imaging Ltd June 2014 DMC 2 nd Generation Satellites UK-DMC2 and Deimos-1 launched 29 th July 2009 650km swath width
The GEO Global Agricultural Monitoring (GEOGLAM) Initiative
 Initiative") The GEO Global Agricultural Monitoring (GEOGLAM) Initiative Chris Justice GEOGLAM Global Co-Lead The Center for Agricultural Monitoring Research, Department of Geographical Sciences, GEOGLAM Launched by
The GEO Global Agricultural Monitoring (GEOGLAM) Initiative Chris Justice GEOGLAM Global Co-Lead The Center for Agricultural Monitoring Research, Department of Geographical Sciences, GEOGLAM Launched by
Crop Growth Monitor System with Coupling of AVHRR and VGT Data 1
 Crop Growth Monitor System with Coupling of AVHRR and VGT Data 1 Wu Bingfng and Liu Chenglin Remote Sensing for Agriculture and Environment Institute of Remote Sensing Application P.O. Box 9718, Beijing
Integrating Agricultural Land Management into a Watershed Response Model
 Integrating Agricultural Land Management into a Watershed Response Model Adam Freihoefer, Tom Beneke, & Aaron Ruesch Wisconsin Department of Natural Resources NCASI Northern Region Meeting May 6, 2014
Evaluating and improving cover crop performance and adoption
 Evaluating and improving cover crop performance and adoption W. Dean Hively U.S. Geological Survey Eastern Geographic Science Center U.S. Department of the Interior U.S. Geological Survey NESARE Cover
Global Agricultural Monitoring in the CGIAR
 Global Agricultural Monitoring in the CGIAR CGIAR-CSI Consortium for Spatial Information Enrica Porcari Chief Information Officer - CGIAR Rome, Italy GEOSS Agric. Monitoring Workshop FAO, Rome 16-18 July,
ACE 427 Spring Lecture 9. USDA Crop Reports. by Professor Scott H. Irwin
 ACE 427 Spring 2013 Lecture 9 USDA Crop Reports by Professor Scott H. Irwin Required Readings: Good, Darrel L. and Scott H. Irwin. USDA Corn and Soybean Acreage Estimates and Yield Forecasts: Dispelling
Minimum Core Data Set
 Global Strategy IMPROVING AGRICULTURAL AND RURAL STATISTICS IN ASIA PACIFIC Minimum Core Data Set Regional Office for the Asia-Pacific Regional Action Plan to Improve Agricultural and Rural Statistics
Drought Impact on Agriculture Approaches $1.5 Billion Early in David P. Anderson J. Mark Welch John Robinson. Texas AgriLife Extension Service
 DroughtImpactonAgricultureApproaches$1.5BillionEarlyin2011 DavidP.Anderson J.MarkWelch JohnRobinson TexasAgriLifeExtensionService Thedryweatherthatbeganinthefallof2010hasexpandedandintensifiedin2011.InearlyAugust,
Remote Sensing (C) School Name: Student Name(s):
 School Name: Student Name(s):") School Name: Student Name(s): Remote Sensing (C) Nebraska Science Olympiad State Competition University of Nebraska-Lincoln Saturday, April 2 nd 2011 Question and Answer Sheet 100 points total Show all
School Name: Student Name(s): Remote Sensing (C) Nebraska Science Olympiad State Competition University of Nebraska-Lincoln Saturday, April 2 nd 2011 Question and Answer Sheet 100 points total Show all
Continuing, Cooperative and Comprehensive Transportation Report Process Improvements Henrico County, Virginia Page 1
 Page 1 1. Program Overview The Henrico County Continuing, Cooperative and Comprehensive (3-C) Transportation Report Process Improvements Program is an analysis and upgrade of the methods used to produce
Crop Assessment using Space, Agro-Meteorology & Land based observations : Indian Experience
 Crop Assessment using Space, Agro-Meteorology & Land based observations : Indian Experience Shibendu S. Ray Mahalanobis National Crop Forecast Centre Department of Agriculture, Cooperation & Farmers Welfare,
DEVELOPMENT OF A VALUE-ADDED, REMOTELY SENSED PRODUCT FOR COMMERCIAL DISTRIBUTION*
 DEVELOPMENT OF A VALUE-ADDED, REMOTELY SENSED PRODUCT FOR COMMERCIAL DISTRIBUTION* John M. Lomas Kevin P. Price Edward A. Martinko Stephen L. Egbert Dietrich L. Kastens Kansas Applied Remote Sensing Program
Cesalea N. Osborne Environmental Science Haskell Indian Nations University This project was sponsored by Haskell Indian Nations University through
 Impacts of Land Use Changes Over Time on the Arbuckle Simpson Aquifer in South Central Oklahoma Cesalea N. Osborne Environmental Science Haskell Indian Nations University This project was sponsored by
SECTION 8: FOOD ACCESS AND AGRICULTURE
 SECTION 8: FOOD ACCESS AND AGRICULTURE Like medical and health access, food access varies across the region. This section addresses types and value of crops, seafood, land cover, meat, dairy and other
Availability of Biomass Feedstocks in the Appalachian Region
 Availability of Biomass Feedstocks in the Appalachian Region Appalachian Woody Biomass to Ethanol Conference Bob Perlack Oak Ridge National Laboratory September 5, 2007 Managed by UT-Battelle Quick review
Estimating Groundwater Recharge within Wisconsin s Central Sands
 Estimating Groundwater Recharge within Wisconsin s Central Sands Adam Freihoefer and Robert Smail Wisconsin Department of Natural Resources [study objective] Identify a defensible approach to quantify
SPACE MONITORING of SPRING CROPS in KAZAKHSTAN
 SPACE MONITORING of SPRING CROPS in KAZAKHSTAN N. Muratova, U. Sultangazin, A. Terekhov Space Research Institute, Shevchenko str., 15, Almaty, 050010, Kazakhstan, E-mail: nmuratova@mail.ru Abstract The
Using Open Data and New Technology To Tackle the Greening of the CAP from a broader perspective
 Using Open Data and New Technology To Tackle the Greening of the CAP from a broader perspective Prague, 21 st of October Marcel Meijer & Jeroen van de Voort Outline Setting the scene Open Data related
Using MODIS Medium-Resolution Remote Sensing Data to Monitor Hydroclimatic Variability
 Using MODIS Medium-Resolution Remote Sensing Data to Monitor Hydroclimatic Variability Past and Future Hydroclimatic Variability: Applications to water Resources Management in the Prairie Provinces, Canmore,
APPENDIX B: POLLUTANT LOADING ANALYSIS. Appendix B: Pollutant Loading Analysis
 APPENDIX B: POLLUTANT LOADING ANALYSIS Appendix B: Pollutant Loading Analysis This page has been intentionally left blank. Appendix B: Pollutant Loading Analysis Appendix B Pollutant Loading Analysis Methodology
National Drought Monitoring in Canada
 National Drought Monitoring in Canada Trevor Hadwen Agriculture and Agri-Food Canada, Agri-Environmental Services Branch (AESB) National Agroclimate Information Service (NAIS) Manitoba, DRI Workshop Winnipeg,
Towards a National Water Modeling System
 Towards a National Water Modeling System Towards a National Water Modeling System Don Cline Chief, Hydrology Laboratory National Weather Service Jerad Bales Chief Scientist for Water U.S. Geological
The GEO Global Agricultural Monitoring Initiative (GEOGLAM): Overview
: Overview") The GEO Global Agricultural Monitoring Initiative (GEOGLAM): Overview Chris Justice (UMD) 1 / 27 GEO the Group on Earth Observations an Intergovernmental Organization with 90 Members and 67 Participating
The GEO Global Agricultural Monitoring Initiative (GEOGLAM): Overview Chris Justice (UMD) 1 / 27 GEO the Group on Earth Observations an Intergovernmental Organization with 90 Members and 67 Participating
Agriculture insurance hotspot: Kazakhstan
 Agriculture insurance hotspot: is one of the largest grain producers and exporters in the world. However, drought frequently endangers large parts of the country and is the number one threat to farmers.
Assessment of Irrigation Potential Utilization in Major Irrigation Project Using Geospatial Data
 Assessment of Irrigation Potential Utilization in Major Irrigation Project Using Geospatial Data Muthyam Shanker Abstract Many irrigation projects were constructed in India post-independence period spending
UTC Assessments. Technology + Planning + Community
 UTC Assessments = Technology + Planning + Community Achieve a common understanding of their scope and effects Begin a dialogue with collaborators to maximize their potential Identify driving initiatives
Energy Inputs for 1 st and 2 nd Generation Ethanol Feedstocks: Modeling Effects of Cultivation Practices and Crop Selection on GHG Emissions
 Energy Inputs for 1 st and 2 nd Generation Ethanol Feedstocks: Modeling Effects of Cultivation Practices and Crop Selection on GHG Emissions Tristram O. West, Laurence M. Eaton, Chad Hellwinckel,* Mark
Hydrological Applications of LST Derived from AVHRR
 Hydrological Applications of LST Derived from AVHRR By Balaji Narasimhan Research Assistant Department of Agricultural Engineering Texas A&M University Outline Introduction All about LST Model Development
Crop Progress. NASS Survey Update!
 Crop Progress ISSN: 00 Released May, 0, by the National Agricultural Statistics Service (NASS), Agricultural Statistics Board, United s Department of Agriculture (USDA). NASS Survey Update! In the first
Global Strategy. Session 1.2: Minimum Set of Core Data Items. Module 1: Sampling in the Context of the Global Minimum Set of Core Data Items
 Global Strategy IMPROVING AGRICULTURAL AND RURAL STATISTICS IN ASIA PACIFIC Module 1: Sampling in the Context of the Global Minimum Set of Core Data Items Session 1.2: Minimum Set of Core Data Items 13
Recent updates to USGS StreamStats application for North Carolina
 J. Curtis Weaver, Hydrologist USGS South Atlantic Water Science Center (Raleigh) Recent updates to USGS StreamStats application for North Carolina U.S. Department of the Interior U.S. Geological Survey
Agricultural monitoring of Russia using Remote Sensing: an overview
 Russian Academy of Sciences Space Research Institute Agricultural monitoring of Russia using Remote Sensing: an overview Savin I., Bartalev S., Loupian E. Some features of R&D at IKI Focus is on national
Valoración ambiental y económica de la infraestructura verde en las ciudades de Estados Unidos y su replicabilidad en Ciudades Chilenas
 Valoración ambiental y económica de la infraestructura verde en las ciudades de Estados Unidos y su replicabilidad en Ciudades Chilenas David J. Nowak USDA Forest Service Northern Research Station Syracuse,
Alix Scarborough, Project Manager. Melissa Keen, GIS Analyst. Matthew Leach, GIS Analyst. Chad Sydow, GIS Analyst
 Alix Scarborough, Project Manager Melissa Keen, GIS Analyst Matthew Leach, GIS Analyst Chad Sydow, GIS Analyst Watershed and Tree Canopy Association in Austin, TX Project Proposal Prepared by Trees in