David Jacob Meltzer m. Supervisor: Dr. Umer Zeeshan Ijaz
|
|
|
- Lawrence Barnett
- 6 years ago
- Views:
Transcription
1 AMPLIpyth: A Python Pipeline for Amplicon Processing David Jacob Meltzer m MSc Bioinformatics, Polyomics and Systems Biology Supervisor: Dr. Umer Zeeshan Ijaz A report submitted in partial fulfillment of the requirements for the MSc Bioinformatics, Polyomics and Systems Biology Degree at the University of Glasgow August
2 Summary Next generation sequencing technologies have revolutionized the way in which microbial communities are analyzed. The massively parallel nature of these technologies allows for rapid and accurate sequencing of the contents of these communities. This combined with the culture- independent 16S and 18S rrna sequence amplification method had dramatically increased the ability to analyze these types of data. Analysis of these metagenomic datasets is complicated by the variety of platforms that generate them and the variety of tools optimized to analyze the resulting data. Currently, there exist analysis pipelines such as QIIME and mothur to process these data. These pipelines, while powerful, have certain limitations that leave room for improvement. In this project we sought to develop a software workflow which could analyze amplicon based metagenomic datasets and give detailed information about the microbial community profile. In addition this program would be optimized for the Illumina sequencing platform and would require minimal user input and upon execution, no user input at all. This was accomplished with the creation of the AMPLIpyth software. AMPLIpyth uses a python wrapper to call server sides programs using subprocesses and generates an HTML output with the pertinent results of the analysis. The program was heavily tested using a fecal sample dataset for Crohn s disease and through the comparison of the results to an existing bash based workflow. 2
3 Acknowledgments I would like to thank my supervisor Dr. Umer Zeeshan Ijaz for his mentorship and all of his assistance throughout this process. I would like to thank Gianna Hayner for her assistance in editing this document. 3
4 Contents 5 Abbreviations and Definitions 6 7 Introduction 8 13 Analysis Product Evaluation Discussion Conclusions/Further Work References 4
5 Abbreviations and Definitions NGS = Next Generation Sequencing BP = Base Pair EEN = Exclusive Enteral Nutrition CD = Crohn s Disease CSV = Comma Separated Value OTU = Operational Taxonomic Unit Amplicon = The product of a PCR Amplification Raw Reads = The sequencing data directly from the sequencer before any processing or analysis 5
6 Introduction Microbial communities are as numerous as they are widespread. These communities are either directly or indirectly involved with every living organism on Earth[1]. In the past, the study of microbial communities was limited by the ability to culture these microbes within a laboratory environment. With less than 1% of prokaryotes able to be laboratory cultured, community studies were incredibly difficult[2]. Next- generation sequencing technologies, also called second- generation technologies, have revolutionized the investigation of these communities and because of this, metagenomics has exploded as a research topic in recent years[3]. Metagenomic investigations enable the profiling of microbial communities without the need to culture them in laboratory environment. This is made possible by next generation sequencing (NGS) that allows for the massively- parallel sequencing of millions of DNA fragments[4]. One of the predominant techniques is the amplification of ribosomal RNA genes such as 16S/18S rrna. These genes are fairly conserved at species level and can be used as a DNA barcoding strategy[5,6]. There are two main approaches for amplicon processing: a reference- based approach and a de novo approach. A reference- based approach uses a well curated database such as SILVA, BERGEYS taxonomy for RDP as a reference point from which sequencing data is assembled against. A de novo approach involves the clustering of reads by aligning them against each other and then binning the reads based on a similarity threshold [7]. Regardless of the approach used, the process is computationally intensive and may require the use of a cohort of software tools, each with their own arguments and complications, and each tailored to a specific 6
7 part of the analysis [8]. Therefore, there exist several analysis pipelines for metagenomic datasets. Of these, two of the most widely used are QIIME and mothur. Both QIIME and mothur are capable of handling large amounts of data in a variety of NGS formats and produce highly accurate analyses [8,9]. These programs are not without their downsides. QIIME can be very difficult to install, requiring a significant amount of dependencies, and both QIIME and mothur require user intervention (command- line interactivity) during their function [10,11]. With this in mind, we sought to create an analysis pipeline that lacked these downsides as well as an optimized workflow informed by recently published work on error profiling for the Illumina platform[12]. Hence, the aim of this project was to construct an automated pipeline for metagenomic analysis that requires minimal human interaction outside the initial set up and has the optimal subprocesses. 7
8 Analysis Approach The program was coded entirely in python version as it is a flexible programming language that interacts easily with the underlying unix based operating systems which most bioinformatic servers will have. The python program is a wrapper around multiple other programs to perform the analysis tasks (described below). These components would need to be called by the program and run from within the code. To do this the python module subprocess was used to run shell commands in the operating system. A sample dataset (described below) was provided and used to test functionality at every step of development. The python package MatPlotLib was used to generate all graphical outputs. Dr. Ijaz s command line tutorial Illumina Amplicons OTU Construction with Noise Removal found at was used to develop the framework for the pipeline. It was also used as part of the testing process as the sample data used in the tutorial is the same as used by the pipeline. This pipeline is optimized for Illumina sequencing. Illumina sequencing is the dominant sequencing technology in the research world and with the recent announcement by Roche discontinuing the 454 platform, the market share of Illumina is set to increase[13]. Unpublished research by D Amore et al determined through benchmarking that the Illumina platform has the highest accuracy and lowest error rates over the other commercially available platforms (D Amore et al, A comprehensive benchmarking study of protocols and sequencing platforms for 16S rrna community profiling, Unpublished). With this in mind, work done previously 8
9 by Schirmer and Ijaz et al was used to inform on the software choices used by this pipeline. Schirmer and Ijaz et al investigated which combination of tools resulted in the best error correction on Illumina generated dat. They determined that using sickle, BayesHammer and PANDAseq for error correction resulted in a 93% decrease in substitution error rates when compared to alternate choices[12]. Programs Used Sickle Sickle is a sequence- trimming program that uses a sliding window, length and phred quality of the sliding window to determine where to trim the sequences. In practice, the quality usually falls off at the end of the reads. Sickle has settings to accommodate both single and paired- end reads and a variety of quality scoring formats[14]. Sickle was used to quality filter the sample reads to prepare them for downstream applications. SPAdes SPAdes is an open- source assembler software that can be used for single and multicellular assemblies and produces excellent assemblies for uncharacterized bacteria. Many environmental bacteria cannot be easily cloned and thus their amplification and subsequent sequencing using current technologies is difficult if not impossible. The SPAdes assembler uses a novel approach to deal with these difficulties and is capable of quickly producing accurate assemblies [15]. The assembly function of the SPAdes assembler was not used in the AMPLIpyth 9
10 program. SPAdes was used only to perform error- correction as it is bundled with BayesHammer which is used for pre- correction of reads before performing assembly [16]. PANDAseq PANDAseq is assembly software used to assemble Illumina paired- end reads. The program takes advantage of the overlap between paired- end reads for short DNA fragments (i.e., 16S/18S variable regions that are small enough for the reads to overlap). As the overlap increases there is a corresponding increase in the ease of correcting incorrectly called bases by using the sequence mate s overlap. PANDAseq algorithmically determines the necessary overlap and performs correction on that region, systematically going through the entire provided sequence [17]. PANDAseq was used here in its assembler function. UPARSE The UPARSE pipeline functions similar to the BLAST algorithm however the UPARSE not only allows for alignment against a reference database similar to BLAST, but also allows clustering of reads, and the removal of chimeras (de novo as well as reference based approach). It is substantially faster than contemporary alignment tools as the search algorithm is heuristic in nature [7]. UPARSE pipeline was used here to perform several analyses in the pipeline (UPARSE or USEARCH is also used in QIIME and mothur). These are described in the Product section below. 10
11 Mafft The mafft program performs multiple sequence alignments[18,19]. In AMPLIpyth, mafft takes the sequences in FASTA format and then generates a multiple sequence alignment of these sequences. This alignment was used later by FastTree to generate a phylogenetic tree. FastTree FastTree program is a program for generating phylogenies. Many phylogeny generating programs use a distance matrix to store relationships however as the size of the matrix increases so does the computational requirements. The FastTree program stores sequence profiles of internal nodes in the tree [20]. This allows for a decrease in the computational requirements in large trees. FastTree was used here to generate a phylogeny of the identified OTUs. Ribosomal Database Project (RDP) Classifier The RDP Classifier is a naïve Bayesian classifier that is well suited to give the taxonomy of the sequences at different levels (Phylum, Class, Order, Family, and Genus)[21]. In the AMPLIpyth program the RDP Classifier was used to identify the taxonomies that each of the identified OTUs belong to. 11
12 Python Program Development All python programming was performed using the PyCharm Professional Edition Integrated Development Environment (IDE). This IDE is specifically designed for python coding and provides a variety of tools and plugins to analyze and optimize code[22]. Code was locally produced in PyCharm and tested on Dr. Ijaz s bioinformatics server. Sample Data A dataset of twenty- four fecal samples was provided by Dr. Ijaz. The fecal samples had been processed as part of a separate study in which Dr. Ijaz was an investigator. In this study Quince et al sought to investigate the differences in gut flora between healthy children and children with CD. The children with CD were put on the EEN program and their feces sampled at five time points referred to by the letters A through E: A) before or within 6 days of starting EEN, B) 16 days after staring EEN, C) 32 days after starting EEN, D) 54 days after starting EEN and E) 63 days after the end the EEN program. The E group was to ascertain if the CD children s flora had returned to their pre- EEN levels. These samples were then compare to the healthy children, referenced as group H (Quince, Loman and Ijaz et al. Extensive modulation of the fecal metagenome in children with Crohn s disease during exclusive enteral nutrition. Submitted for Publishing). The samples from group E were those used in testing AMPLIpyth. The files are available on the attached CD. 12
13 Sample Processing The fecal samples had been processed per standard protocols and bacterial DNA was isolated and purified using the chaotropic method. 16S rrna sequencing of the V4 region was performed on the MiSeq (Illumina) platform using bp paired- end reads. The V4 region was amplified using fusion Golay adaptors barcoded on the reverse strand. The forward 16S rrna primer sequence 515f (GTGNCAGCMGCCGCGGTAA) was used. The reverse primers, barcodes and adaptors were identical to those described previously. Amplicons were purified with AMPure XP DNA purification beads (Beckman Coulter, Danvers, MA, USA) according to the manufacturer s instructions, and eluted in 25 μl of Elution Buffer (Qiagen, 19086, UK). Subsequently, amplicons were quantified with use of KAPA SYBR FAST qpcr Kit (Kapa biosystems, KK4824, UK), diluted to 40 pm and spiked- in with 40 pm of genomic DNA to avoid base- calling issues due to low base diversity (Method barrowed with permission of Dr. Ijaz from Quince, Loman and Ijaz et al. Extensive modulation of the fecal metagenome in children with Crohn s disease during exclusive enteral nutrition. Submitted for Publishing). 13
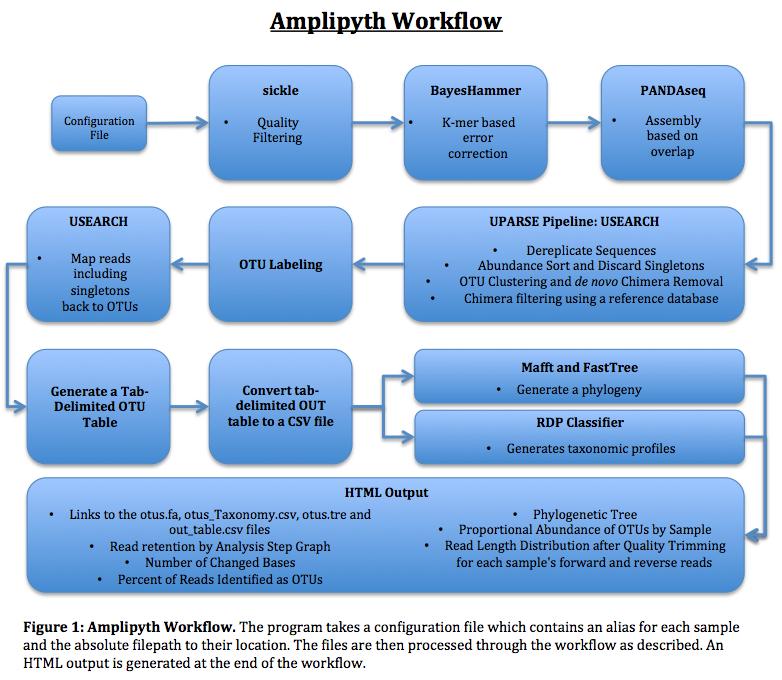
14 Product Program overview An amplicon- processing pipeline was successfully produced using python. This pipeline named, AMPLIpyth, is presented in figure 1. 14
15 15
![Program Design Running AMPLIpyth requires three arguments: python [AMPLIpyth Version] c [Configuration File] o [Analysis Output Directory] t [OTU Output Directory].](/docs-images/75/72709901/images/16-0.jpg "The program requires the user to produce a configuration file which includes all of the files to be analyzed and the required arguments for the programs involved in the analysis.")
16 Program Design Running AMPLIpyth requires three arguments: python [AMPLIpyth Version] c [Configuration File] o [Analysis Output Directory] t [OTU Output Directory]. The program requires the user to produce a configuration file which includes all of the files to be analyzed and the required arguments for the programs involved in the analysis. This configuration file has a required format shown in figure 2. The pipeline requires no user input after it has been initiated. 16
17 The pipeline begins by checking to ensure that the programs sickle, USEARCH, PANDAseq, fastqc, SPAdes, mafft and FastTree are found on the system. The program generates the analysis output directory provided by user in the arguments. The python module ConfigParser then parses in the specified configuration file. This configuration file contains an alias for each file found in the name value. This name value is then used to make a single directory for each of the sample pairs. These directories are referred to as the main directory for each sample henceforth. Within each directory a directory named Raw is created. This raw directory will contain the raw reads. The raw reads are then copied from their location, given as the absolute path, found in the value value in the configuration file, to the Raw directory of the appropriate directory. Quality filtering is then performed using sickle. Briefly, each read has a corresponding quality score. This quality score indicates the probability that the base was called correctly during sequencing. The equation below describes this (Equation 1) [23] Equation 1: The formula for determining quality score. The quality score used to determine trimmed reads is provided in the settings section of the configuration file. Likewise the quality score system is specified here as well. The quality score value is not variable and it is advised that the user examine the quality information of the reads before analysis to select the appropriate score. Sickle quality filtering generates files with the suffix 17
18 _trim.fastq as well as the singlet file suffixed singlet.fastq. These files are then used to produce a read length distribution graph for the forward and reverse trimmed reads. These files are originally placed into the main directory where the program itself is found but are moved into a collected outputs folder at a later step. The trimmed forward and reverse FASTQ files are then passed to SPAdes which calls the BayesHammer program and performs error correction. The SPAdes program takes no input from the configuration file and performs no assembly. The SPAdes assembly function is not required for this program to function. The SPAdes program, through BayesHammer, generates an output directory named corrected within each main directory. Within this corrected directory are the error- corrected forward, reverse and unpaired FASTQ files. SPAdes produces a log, spades.log, which is deposited in the main directory. This log contains information as to the error correction performed by BayesHammer. This information is later used in downstream statistics. Due to an issue with the BayesHammer program, identifying information concerning the directionality of the reads is stripped from the reads (i.e., tags to tell whether the read is a forward or a reverse reads) during BayesHammer error correction. Without identifying information, downstream analysis with PANDAseq is impossible. To correct for this a function was written to write a new file with the correct information and overwrite the incorrect file. The corrected forward and reverse reads are then processed with PANDAseq which overlaps the paired end reads. The arguments used by PANDAseq 18
19 are found in the settings section of the configuration file. PANDAseq outputs an overlap file located in the main directory for each sample. Before the program can run UPARSE the overlap.fasta files for each sample need to have a UPARSE formatted barcode labels for each read. This is accomplished through a function that adds this required barcode to each read and outputs the appropriate FASTA file. At this point in the program, analysis within the Analysis Output Directory is complete. The program next generates the OTU Output Directory. All further analysis takes place within this directory. In preparation for UPARSE analysis the overlap.fasta files from each sample are then multiplexed into a single multiplexed.fasta file, linearized and dereplicated. These three steps are the most time consuming and computationally intensive of the entire program taking an average of six minutes. The UPARSE program is then used to perform a series of functions within the AMPLIpyth pipeline: abundance sorting, the discarding of singletons, OTU clustering and de novo chimera removal. UPARSE is then used to remove chimeras using a reference database. The sequences are then labeled with the fasta_number.py python script created by Robert Edgar This generates the otus.fa file. UPARSE is then used to map the singletons back to the OTUs. Another of Robert Edgar s python scripts, uc2otutab.py, is then used to generate a tab- delimited OTU table. This table is then converted to a CSV file for further analysis. Mafft is then used to perform multisequence alignment on the representative OTU 19
20 sequences. FastTree is then used to generate a phylogenetic tree. The program will then display to the user the statistics involved in the OTU construction step: total reads, total reads dereplicated, total reads dereplicated and singletons removed, OTUs after de novo chimera removal, OTUs after database assisted chimera removal and the final OTUs after matching. This concludes the analytical portion of the pipeline AMPLIpyth produces a minimum of seven outputs: a read retention by step graph, a changed bases graph, the percent of reads in OTUs graph, a stacked bar graph showing the proportion of the total OTUs comprising the twenty most common and all others, the phylogeny and a length distribution graphs for the forward and reverse reads. These output are provided in an HTML output with download links to the otus.fa, otus_taxonomy.csv, otus.tre and otu_table.csv. The number of outputs will vary according to the samples as a length distribution graph is produced for each samples forward and reverse reads. Design Considerations The use of a configuration file is ideal because it allows for the user to prepare multiple different analysis sets and process them without making any changes to AMPLIpyth itself. This also allows for jobs to run concurrently assuming that there is sufficient space and processing power. The configuration file also allows for an additional degree of reproducibility as it can be provided, run with the pipeline and yield the same result. 20
21 The separation of the output directory and the OTU output is necessitated by the program design. By keeping the analysis directory populated only by sample data ensures that the code needed to process the data remains relatively small. Additional functions and coding would have been required to accommodate the additional contents resulting in negative impacts on the computational requirements and time requirements. The program is strictly divided between an analysis section and a visualization section, the exception to this being the read length distribution graphs. It was advantageous programmatically to have the read length distribution graphs generated after quality filtering but before SPAdes. This prevented the need for complicated functions to go back and access each of the folders individually to generate the outputs. Certain design choices were used to ensure that the graphical outputs conveyed the most information possible with the least amount of clutter. The Read Retention by Analysis Step graph does not provide the specific numbers of the reads lost at each step but as a proportion of the whole. This was done to allow the user to visualize all samples at once while still being able to gather meaningful information from it. This choice was not carried over to the Changed Bases graph. It was decided that understanding the actual number of changed bases was important to the interpretation of the data. Visualizing the data in this method does not detract from the readability of the graph as it would have done in the Read Retention by Analysis Step graph. 21
22 The Abundance Chart which displays the twenty most abundant OTUs with the rest grouped into an Other_Otus category was designed to provide a substantial amount of detail and is tied for the most important output with the phylogeny above it. Personal communication with Dr. Ijaz led to the decision to display the twenty most abundant OTUs as opposed to another amount. This amount is arbitrary and is not readily editable for the user however as this is open- source software a knowledgeable user would be able to edit the code to what ever they would like. Future iterations of the program will add this as a user specifiable option in the configuration file. 22
23 Evaluation Testing The sample dataset, described previously, was used to test the program at all steps of development as well as its computational and time requirements. This sample set, representing a modest amount of data takes between sixteen and sixty minutes to run depending on server load. Program stability was determined through thorough testing. Unexpected termination of the program was found to occur when the user profile exceeded its memory allotment. It is therefore recommended that the user ensure they have sufficient storage space before running AMPLIpyth. Computational walls were never encountered during testing. Two separate configuration files were used for the testing process. As noted above, the absolute paths for each of the files was given as well as an alias. This alias was the sample number followed by the abbreviation _R1 or _R2. These corresponded to whether the read was the forward (R1) or the reverse (R2). The first configuration file contained all of the sample files while the second contained only five sample files. The results of this second configuration file could not be compared as described below and as such it was only used to ensure that changes to the pipeline did not result in unexpected program failure. As described previously, the program requires certain parameters to be provided within the configuration file. For both the full and abridged sample files the configuration parameters used for sickle were a quality score of twenty and a quality score format of Sanger. For the PANDAseq configuration inputs the, arguments passed to the subprocess were pandaseq f 23
24 [forward_fastq_file] r [reverse_fastq_file] B -F d [bfsrk] o [20] > [overlap_fastq_file]. Briefly, the f and r arguments are the forward and reverse FASTQ files that PANDAseq requires. The B, -F and d arguments allow PANDAseq to ignore missing barcodes or tags, ensure that the output is in FASTQ format and limiting the output to the user respectively. The bfsrk value details what kinds of information are displayed to the user. The o argument takes the overlap threshold. Finally, the last item is the name of the output file. These values are passed to the function in which PANDAseq is called. The specification default, was set for the forward, reverse and threads arguments. Default needs to be specified as part of the settings string. It cannot be left blank or the program will not function. The program searches for the value default and if detected, removes the argument that it is attached to from the PANDAseq call in the subprocess. The program is capable of accommodating all arguments for PANDAseq. For the remaining PANDAseq options an overlap of 20 bases was specified and for n bases, the eliminate n option, was specified as no. Setting the eliminate n option to no is also a value that the program searches for. The no value causes the program to remove the N argument from the PANDAseq call in the subprocess. To ensure that the program was functioning correctly the results of the sample dataset analysis were compared to the results of the tutorial analysis described previously. This tutorial allowed for the direct comparison of the results of the pipeline to the results of an established pipeline. Practically, as each part of 24
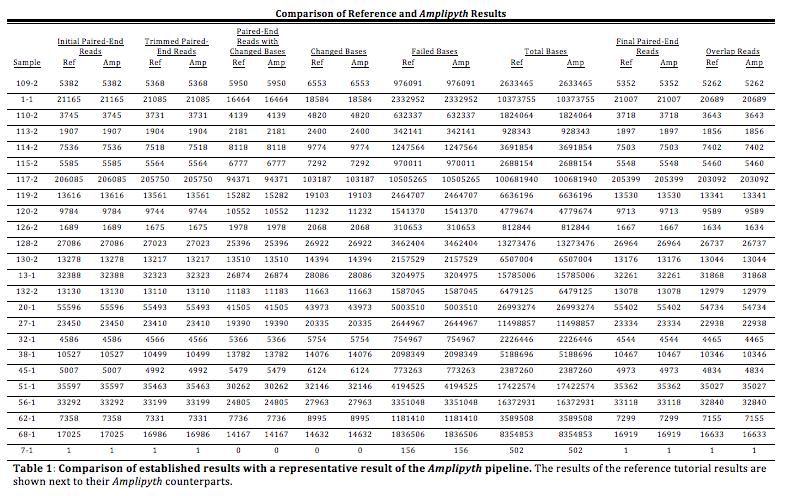
25 the AMPLIpyth pipeline was coded, its corresponding tutorial section was run on the command line and the results compared. The completed pipeline had a 1 to 1 result when compared to the tutorial outputs indicating the pipeline was functioning correctly. The tutorial however only allowed for the testing of the analytical section of the pipeline. Testing the graphical outputs required separate verification steps that consisted of adding code (now removed) to ensure that the contents of the graphs were the correct translations of the results of the pipeline. Testing Results To determine the stability of the AMPLIpyth program and the reproducibility of its results, the program was run 50 times. The sample dataset of 24 samples (48 FASTQ files) was successfully processed by AMPLIpyth each time. The average run length of these tests was 17 minutes. The metadata was mined for the initial reads, trimmed paired- end reads, paired- end reads with changed bases, changed bases, failed bases, total bases, final paired- end reads and the number of overlap reads using a script written by Dr. Ijaz and available at This data mining resulted in identical results between tests and when compared to the tutorial data. Table 1 is an example comparison of the tutorial result with a pipeline output. 25
26 26
27 During each test, AMPLIpyth correctly identified the 498 distinct OTUs identified in the reference tutorial. To ensure that the results were identical, the otu_table.csv file was examined after each test. The otu_table.csv contains a list of the identified OTUs along with the number of reads from each sample that were identified as parts of that OTU. Each otu_table.csv file was compared to the reference tutorial otu_table.csv file to ensure a match. The otu_table.csv file is available in the HTML output folder provided with this report. Upon the completion of the pipeline an HTML output was successfully generated containing a read retention by step graph, a changed bases graph, the percent of reads in OTUs graph, a stacked bar graph showing the proportion of the total OTUs comprising the twenty most common and all others, the phylogeny and the length distribution graphs for the forward and reverse reads. A HTML sample output is available on the attached CD. Below is a walkthrough of a set of representative results. The HTML output begins with the links to pertinent files (Figure 3). It then displays the Read Retention by Analysis Step graph. During each step of the pipeline a number of reads are lost. Based on the sample analysis, the largest loss in reads occurs in the overlapping step. A representative sample of these types of graph is displayed in figure 4. 27
28 Figure 3: The AMPLIpyth HTML output. This output is generated upon the completion of the program and contains links to important files and outputs useful for analysis. 28
29 Figure 4: Read Retention by Analysis Step Graph. This graph displays the proportional read retention by analysis step of the course of the pipeline. The sample alias is displayed in the key on the upper right corner. The x- axis gives the pipeline step and the y- axis gives the proportion of the paired- end reads lost. This graph is followed by a changed bases graph. This graph gives information on the number of bases changed during the data analysis for each of the samples. As stated previously, this graph is not proportional (Figure 5). 29
30 Figure 5: The Changed Bases Graph. This graph provides the user with information how many changed bases occurred during the analysis. Following this is a graph that gives the total amount of reads from each sample that were identified as belonging to one of the identified OTUs (Figure 6). This graph s data is presented as percentages. As with the other graphs it is possible to go to the source file, in this case out_tabe.csv, and determine the actual numbers. 30

31 Figure 6: The Percent of Reads in OTUs Graph. This graph provides the user with information on what percentage of the reads were identified as part of an OTU. Well over 90% of reads were identified as mapping to OTUs. This appeared to be an error at first but discussion with Dr. Ijaz determined that this was not an uncommon result. The next figure is the phylogenetic tree generated from the identified OTU data (figure 7). 31
32 Phylogenetic Tree Figure 7: Phylogenetic Tree. The phylogenetic tree is generated using the OTU data. It shows the relationships between the identified OTUs. The phylogenetic tree was by far the largest file to be output by the AMPLIpyth program. The output image has the resolution required to examine the phylogenetic relationships however this is not readily observable on the HTML output. The next output displays the proportional abundance of the twenty most common OTUs identified within the entire study, for each of the samples. As previously stated, any OTU not specified in this list was lumped into an Other_Otus category (figure 8). 32

33 Figure 8: Proportional Abundance of the Twenty Most Common OTUs. The twenty most common OTUs identified by the study were graphed against the remained of the OTUs clustered into a single Other_Otus category. The final output or outputs depending on the number of samples are the read distribution by length graphs. The graphs give quantitative information on the lengths of the reads after quality trimming. Two graphs are generated for pair- end reads: one for the forward read and one for the reverse read. For the sample data set of 24 samples in the test data, 48 read length distribution graphs were produced. A representative pair is shown in figure 9. 33
34 Representative Read Length Distribution Graphs Figure 9. Representative Read Length Distribution Graphs. These graphs show the distribution of lengths observed after quality trimming. The graphs provide valuable information on what effect quality trimming has had on the overall length of the reads. In this sample data, the majority of the reads were of high enough quality to not require trimming. This is evidenced by the majority of the reads being 250 bp. 34
35 Discussion The goal of this project was to construct an automated pipeline for metagenomic analysis that required minimal human interaction outside the initial setup. This was successfully accomplished with the creation of the AMPLIpyth program. This python based program uses a configuration file to specify the files for analysis and settings, desired by the user, for the dependent tools. The configuration file is given as part of three required arguments passed to the program by the user. Once the program is initiated, no further input is required from the user. Extensive testing was done to ensure program stability and reproducibility of results. In all testing program failure was only observed twice, both a function of hitting available space walls. Results were absolutely consistent both between tests and compared to an external reference. The program successfully output he desired HTML page. Sample data testing was covered previously, however it is important to note that what was observed here may not be observed with other data sets. The largest percentage of read loss occurred during the overlapping step but it is entirely possible that this could occur at any other step. Likewise the percentage of reads mapped to OTUs could be lower or higher. When using the sample data to evaluate this program it is vital to remember that it was used to show the program s functionality not to display the results of an experiment. The use of the python module ConfigParser and a configuration file meant that the settings for the pipeline tools would need to be contained within the configuration file. Initially a loop was implemented that went through each of the name:value pairs in the settings sections and passed those arguments to the 35
36 appropriate functions. It became evident early on that there was an issue which resulted in the order of the settings not being observed by the program and the wrong settings were being called at the wrong time. To circumvent this, a single name settings had a value given as a string that contained all of the settings separated by underscores. This solution, while not ideal, worked and was kept during the development of the program. A cursory examination of the source code will reveal hardcoding in several areas. As with any program, user input had to be balanced with ease of use. Many aspects of this program could have had user input but did not necessarily require it. In these areas hard coding was deferred to as the overall goal of the project was to develop a program that required minimal intervention. The read length distribution graphs incorrectly display some of their data through the overlap of the bars on the histogram. To clarify, the data they display is not incorrect; rather the incrementation on the x- axis is not providing sufficient space to allow for all of the bars to be displayed where they should be resulting in overlap. This issue was unable to be resolved in the current iteration of the program however it will be fixed in future releases. 36
37 Conclusions/Future Work The AMPLIpyth program is a ready- to- use solution for metagenomic analysis. It uses tools that are widely available and well documented. It can be easily incorporated into existing workflows without the need to substantially change other procedures. The program design was the benefit of substantial research performed previously by Dr. Ijaz and his collaborators. This led to a good value for money situation by which the efficacy of design could be assured. This however is a double- edged sword. The program design while backed by empirical research, is optimized for Illumina sequencing technology. For the foreseeable future this will suffice however with recent advances in third generation sequencing technology, it is very likely that the pipeline will have to be expanded to include these new technologies and the tools for analyzing their data. The current program is only designed to use a single core which, while not a problem for the sample dataset, would result in a problem for much larger datasets. As such the next iteration of the program will include the capability to take advantage of multiple cores. The configuration file is an integral part of the program functionality. Currently the settings are passed in the form of a string for reasons discussed previously. This is not ideal since programmatically it is more appropriate for each setting to be passed as a name:value pair. Future iterations of the program will have this implemented. Future iterations of AMPLIpyth will contain changes to the HTML outputs. A proportionality graph for the changed bases data will be added. It is possible that 37
38 with some datasets the differences in read count will be so great that the resolution on a purely quantitative graph would suffer. A second proportional graph will provide additional context. The current version of AMPLIpyth outputs a significant amount of text to the user. This is a result of the normal course of function for each of the tools being called. Future iterations of the program will have a verbose function added so that the user may suppress these outputs. 38
39 References 1 Deutschbauer, A. M., Chivian, D. and Arkin, A. P. (2006) Genomics for environmental microbiology. Curr. Opin. Biotechnol. 17, Schloss, P. D. and Handelsman, J. (2005) Metagenomics for studying unculturable microorganisms: cutting the Gordian knot. Genome Biol. 6, Simon, C. and Daniel, R. (2011) Metagenomic analyses: Past and future trends. Appl. Environ. Microbiol. 77, Mardis, E. R. (2008) Next- generation DNA sequencing methods. Annu. Rev. Genomics Hum. Genet. 9, Handelsman, J. (2004) Metagenomics : Application of Genomics to Uncultured Microorganisms Metagenomics : Application of Genomics to Uncultured Microorganisms. Microbiol. Mol. Biol. Rev. 68, Bik, H. M., Porazinska, D. L., Creer, S., Caporaso, J. G., Knight, R. and Thomas, W. K. (2012) Sequencing our way towards understanding global eukaryotic biodiversity. Trends Ecol. Evol., Elsevier Ltd 27, Edgar, R. C. (2010) Search and clustering orders of magnitude faster than BLAST. Bioinformatics 26, Schloss, P. D., Westcott, S. L., Ryabin, T., Hall, J. R., Hartmann, M., Hollister, E. B., Lesniewski, R. a., Oakley, B. B., Parks, D. H., Robinson, C. J., et al. (2009) Introducing mothur: Open- source, platform- independent, community- supported software for describing and comparing microbial communities. Appl. Environ. Microbiol. 75, Caporaso, J. G., Kuczynski, J., Stombaugh, J., Bittinger, K., Bushman, F. D., Costello, E. K., Fierer, N., Peña, A. G., Goodrich, J. K., Gordon, J. I., et al. (2010) QIIME allows analysis of high- throughput community sequencing data Intensity normalization improves color calling in SOLiD sequencing. Nat. Publ. Gr., Nature Publishing Group 7, QIIME Development Team. (2015) QIIME.org. 11 Schloss, P. and Deparment of Microbiology & Immunology at The University of Michigan. (2015) mothur.org. 12 Schirmer, M., Ijaz, U. Z., D Amore, R., Hall, N., Sloan, W. T. and Quince, C. (2015) Insight into biases and sequencing errors for amplicon sequencing with the Illumina MiSeq platform. Nucleic Acids Res
40 13 Thayer, A. M. (2014, August) Next- Gen Sequencing Is A Numbers Game. Chem. Eng. News. 14 Joshi, N. and Fass, J. (2011) Sickle: A sliding- window, adaptive, quality- based trimming tool for FastQ files. 15 Bankevich, A., Nurk, S., Antipov, D., Gurevich, A. a., Dvorkin, M., Kulikov, A. S., Lesin, V. M., Nikolenko, S. I., Pham, S., Prjibelski, A. D., et al. (2012) SPAdes: A New Genome Assembly Algorithm and Its Applications to Single- Cell Sequencing. J. Comput. Biol. 19, Nikolenko, S. I., Korobeynikov, A. I. and Alekseyev, M. a. (2013) BayesHammer: Bayesian clustering for error correction in single- cell sequencing. BMC Genomics, BioMed Central Ltd 14 Suppl 1, S7. 17 Masella, A. P., Bartram, A. K., Truszkowski, J. M., Brown, D. G. and Neufeld, J. D. (2012) PANDAseq: paired- end assembler for illumina sequences. BMC Bioinformatics, BioMed Central Ltd 13, Katoh, K., Misawa, K., Kuma, K. and Miyata, T. (2002) MAFFT: a novel method for rapid multiple sequence alignment based on fast Fourier transform. Nucleic Acids Res. 30, Katoh, K. and Standley, D. M. (2013) MAFFT multiple sequence alignment software version 7: Improvements in performance and usability. Mol. Biol. Evol. 30, Price, M. N., Dehal, P. S. and Arkin, A. P. (2009) Fasttree: Computing large minimum evolution trees with profiles instead of a distance matrix. Mol. Biol. Evol. 26, Wang, Q., Garrity, G. M., Tiedje, J. M. and Cole, J. R. (2007) Naïve Bayesian classifier for rapid assignment of rrna sequences into the new bacterial taxonomy. Appl. Environ. Microbiol. 73, JetBrains s.r.o. (2015) PyCharm Professional Edition, JetBrains s.r.o. 23 Ewing, B. and Green, P. (1998) Base- calling of automated sequencer traces using phred. II. Error probabilities. Genome Res. 8,
CBC Data Therapy. Metagenomics Discussion
 CBC Data Therapy Metagenomics Discussion General Workflow Microbial sample Generate Metaomic data Process data (QC, etc.) Analysis Marker Genes Extract DNA Amplify with targeted primers Filter errors,
Robert Edgar. Independent scientist
 Robert Edgar Independent scientist robert@drive5.com www.drive5.com Reads FASTQ format Millions of reads Many Gb USEARCH commands "UPARSE pipeline" OTU sequences FASTA format >Otu1 GATTAGCTCATTCGTA >Otu2
mothur tutorial STAMPS, 2013 Kevin R. Theis Department of Zoology BEACON Center for the Study of Evolution in Action Michigan State University
 mothur tutorial STAMPS, 2013 Kevin R. Theis Department of Zoology BEACON Center for the Study of Evolution in Action Michigan State University mothur Mission to develop a single piece of open-source, expandable
dbcamplicons pipeline Amplicons
 dbcamplicons pipeline Amplicons Matthew L. Settles Genome Center Bioinformatics Core University of California, Davis settles@ucdavis.edu; bioinformatics.core@ucdavis.edu Microbial community analysis Goal:
Introduction to taxonomic analysis of metagenomic amplicon and shotgun data with QIIME. Peter Sterk EBI Metagenomics Course 2014
 Introduction to taxonomic analysis of metagenomic amplicon and shotgun data with QIIME Peter Sterk EBI Metagenomics Course 2014 1 Taxonomic analysis using next-generation sequencing Objective we want to
dbcamplicons pipeline Amplicons
 dbcamplicons pipeline Amplicons Matthew L. Settles Genome Center Bioinformatics Core University of California, Davis settles@ucdavis.edu; bioinformatics.core@ucdavis.edu Microbial community analysis Goal:
Microbiomes and metabolomes
 Microbiomes and metabolomes Michael Inouye Baker Heart and Diabetes Institute Univ of Melbourne / Monash Univ Summer Institute in Statistical Genetics 2017 Integrative Genomics Module Seattle @minouye271
Lecture 7. Next-generation sequencing technologies
 Lecture 7 Next-generation sequencing technologies Next-generation sequencing technologies General principles of short-read NGS Construct a library of fragments Generate clonal template populations Massively
mothur Workshop for Amplicon Analysis Michigan State University, 2013
 mothur Workshop for Amplicon Analysis Michigan State University, 2013 Tracy Teal MMG / ICER tkteal@msu.edu Kevin Theis Zoology / BEACON theiskev@msu.edu mothur Mission to develop a single piece of open-source,
I AM NOT A METAGENOMIC EXPERT. I am merely the MESSENGER. Blaise T.F. Alako, PhD EBI Ambassador
 I AM NOT A METAGENOMIC EXPERT I am merely the MESSENGER Blaise T.F. Alako, PhD EBI Ambassador blaise@ebi.ac.uk Hubert Denise Alex Mitchell Peter Sterk Sarah Hunter http://www.ebi.ac.uk/metagenomics Blaise
Microbiome: Metagenomics 4/4/2018
 Microbiome: Metagenomics 4/4/2018 metagenomics is an extension of many things you have already learned! Genomics used to be computationally difficult, and now that s metagenomics! Still developing tools/algorithms
Introduction: Methods:
 Eason 1 Introduction: Next Generation Sequencing (NGS) is a term that applies to many new sequencing technologies. The drastic increase in speed and cost of these novel methods are changing the world of
A step towards understanding Polycyclic Aromatic Hydrocarbons degradation by microbial communities
 7th Annual Conference on the Advances in Land Contamination Assessment and Remediation A step towards understanding Polycyclic Aromatic Hydrocarbons degradation by microbial communities Kevin Bayle Ph.D.
Infectious Disease Omics
 Infectious Disease Omics Metagenomics Ernest Diez Benavente LSHTM ernest.diezbenavente@lshtm.ac.uk Course outline What is metagenomics? In situ, culture-free genomic characterization of the taxonomic and
Parts of a standard FastQC report
 FastQC FastQC, written by Simon Andrews of Babraham Bioinformatics, is a very popular tool used to provide an overview of basic quality control metrics for raw next generation sequencing data. There are
Introduction to Bioinformatics analysis of Metabarcoding data
 Introduction to Bioinformatics analysis of Metabarcoding data Theoretical part Alvaro Sebastián Yagüe Experimental design Sampling Sample processing Sequencing Sequence processing Experimental design Sampling
Carl Woese. Used 16S rrna to developed a method to Identify any bacterium, and discovered a novel domain of life
 METAGENOMICS Carl Woese Used 16S rrna to developed a method to Identify any bacterium, and discovered a novel domain of life His amazing discovery, coupled with his solitary behaviour, made many contemporary
Conducting Microbiome study, a How to guide
 Conducting Microbiome study, a How to guide Sam Zhu Supervisor: Professor Margaret IP Joint Graduate Seminar Department of Microbiology 15 December 2015 Why study Microbiome? ü Essential component, e.g.
A FRAMEWORK FOR ANALYSIS OF METAGENOMIC SEQUENCING DATA
 A FRAMEWORK FOR ANALYSIS OF METAGENOMIC SEQUENCING DATA A. MURAT EREN Department of Computer Science, University of New Orleans, 2000 Lakeshore Drive, New Orleans, LA 70148, USA Email: aeren@uno.edu MICHAEL
An introduction into 16S rrna gene sequencing analysis. Stefan Boers
 An introduction into 16S rrna gene sequencing analysis Stefan Boers Microbiome, microbiota or metagenomics? Microbiome The entire habitat, including the microorganisms, their genomes (i.e., genes) and
SMRT Analysis Barcoding Overview (v6.0.0)
") SMRT Analysis Barcoding Overview (v6.0.0) Introduction This document applies to PacBio RS II and Sequel Systems using SMRT Link v6.0.0. Note: For information on earlier versions of SMRT Link, see the document
SMRT Analysis Barcoding Overview (v6.0.0) Introduction This document applies to PacBio RS II and Sequel Systems using SMRT Link v6.0.0. Note: For information on earlier versions of SMRT Link, see the document
Carl Woese. Used 16S rrna to develop a method to Identify any bacterium, and discovered a novel domain of life
 METAGENOMICS Carl Woese Used 16S rrna to develop a method to Identify any bacterium, and discovered a novel domain of life His amazing discovery, coupled with his solitary behaviour, made many contemporary
Introduction to OTU Clustering. Susan Huse August 4, 2016
 Introduction to OTU Clustering Susan Huse August 4, 2016 What is an OTU? Operational Taxonomic Units a.k.a. phylotypes a.k.a. clusters aggregations of reads based only on sequence similarity, independent
What is metagenomics?
 Metagenomics What is metagenomics? Term first used in 1998 by Jo Handelsman "the application of modern genomics techniques to the study of communities of microbial organisms directly in their natural environments,
Bioinformatic Suggestions on MiSeq-Based Microbial Community S
 J. Microbiol. Biotechnol. (2015), 25(6), 765 770 http://dx.doi.org/10.4014/jmb.1409.09057 Review Research Article jmb Bioinformatic Suggestions on MiSeq-Based Microbial Community S Analysis Tatsuya Unno*
scgem Workflow Experimental Design Single cell DNA methylation primer design
 scgem Workflow Experimental Design Single cell DNA methylation primer design The scgem DNA methylation assay uses qpcr to measure digestion of target loci by the methylation sensitive restriction endonuclease
COMPARING MICROBIAL COMMUNITY RESULTS FROM DIFFERENT SEQUENCING TECHNOLOGIES
 COMPARING MICROBIAL COMMUNITY RESULTS FROM DIFFERENT SEQUENCING TECHNOLOGIES Tyler Bradley * Jacob R. Price * Christopher M. Sales * * Department of Civil, Architectural, and Environmental Engineering,
Practical Bioinformatics for Life Scientists. Week 14, Lecture 27. István Albert Bioinformatics Consulting Center Penn State
 Practical Bioinformatics for Life Scientists Week 14, Lecture 27 István Albert Bioinformatics Consulting Center Penn State No homework this week Project to be given out next Thursday (Dec 1 st ) Due following
Diversity Profiling Service: Sample preparation guide
 Diversity Profiling Service: Sample preparation guide CONTENTS 1 Overview: Microbial Diversity Profiling at AGRF... 2 2 Submission types to the Microbial Diversity Profiling Service... 3 2.1 Diversity
Next Gen Sequencing. Expansion of sequencing technology. Contents
 Next Gen Sequencing Contents 1 Expansion of sequencing technology 2 The Next Generation of Sequencing: High-Throughput Technologies 3 High Throughput Sequencing Applied to Genome Sequencing (TEDed CC BY-NC-ND
Diversity Profiling Service: Sample preparation guide
 Diversity Profiling Service: Sample preparation guide CONTENTS 1 Overview: Microbial Diversity Profiling at AGRF... 2 2 Submission types to the Microbial Diversity Profiling Service... 3 2.1 Diversity
Fungal ITS Bioinformatics Efforts in Alaska
 Fungal ITS Bioinformatics Efforts in Alaska D. Lee Taylor ltaylor@iab.alaska.edu Institute of Arctic Biology University of Alaska Fairbanks Shawn Houston Minnesota Supercomputing Institute University of
HMP Data Set Documentation
 HMP Data Set Documentation Introduction This document provides detail about files available via the DACC website. The goal of the HMP consortium is to make the metagenomics sequence data generated by the
Supplementary Figure 1 Schematic view of phasing approach. A sequence-based schematic view of the serial compartmentalization approach.
 Supplementary Figure 1 Schematic view of phasing approach. A sequence-based schematic view of the serial compartmentalization approach. First, barcoded primer sequences are attached to the bead surface
Chapter 7. Motif finding (week 11) Chapter 8. Sequence binning (week 11)
 Chapter 8. Sequence binning (week 11)") Course organization Introduction ( Week 1) Part I: Algorithms for Sequence Analysis (Week 1-11) Chapter 1-3, Models and theories» Probability theory and Statistics (Week 2)» Algorithm complexity analysis
Course organization Introduction ( Week 1) Part I: Algorithms for Sequence Analysis (Week 1-11) Chapter 1-3, Models and theories» Probability theory and Statistics (Week 2)» Algorithm complexity analysis
Quality Filtering of Illumina Sequences. Susan Huse Brown University August 6, 2015
 Quality Filtering of Illumina Sequences Susan Huse Brown University August 6, 2015 Illumina FASTQ Files File naming: NA10831_ATCACG_L002_R1_001.fastq.gz FA1_S1_L001_R1_001.fastq.gz Sample_Barcode/Index_Lane_Read#_Set#.fastq.gz
Joint RuminOmics/Rumen Microbial Genomics Network Workshop
 Joint RuminOmics/Rumen Microbial Genomics Network Workshop Microbiome analysis - Amplicon sequencing Dr. Sinéad Waters Animal and Bioscience Research Department, Teagasc Grange, Ireland Prof. Leluo Guan
Next-generation sequencing and quality control: An introduction 2016
 Next-generation sequencing and quality control: An introduction 2016 s.schmeier@massey.ac.nz http://sschmeier.com/bioinf-workshop/ Overview Typical workflow of a genomics experiment Genome versus transcriptome
1 Abstract. 2 Introduction. 3 Requirements. Most Wanted Taxa from the Human Microbiome The Broad Institute
 1 Abstract 2 Introduction The human body is home to an enormous number and diversity of microbes. These microbes, our microbiome, are increasingly thought to be required for normal human development, physiology,
SANBio BIOINFORMATICS TRAINING COURSE THE MICROBIOME: ANALYSIS OF NGS DATA CBIO-PIPELINE SAMSON, KM
 SANBio BIOINFORMATICS TRAINING COURSE THE MICROBIOME: ANALYSIS OF NGS DATA CBIO-PIPELINE SAMSON, KM 10/23/2017 Microbiome : Analysis of NGS Data 1 Outline Background Wet Lab! Raw reads Quality Assessment
TECH NOTE Ligation-Free ChIP-Seq Library Preparation
 TECH NOTE Ligation-Free ChIP-Seq Library Preparation The DNA SMART ChIP-Seq Kit Ligation-free template switching technology: Minimize sample handling in a single-tube workflow >> Simplified protocol with
 choose MBL-REGISTER user: dm00834 password: dm00834 http://register.mbl.edu/ stamps.mbl.edu this uses the username and password on your STAMPS name badge Strategies for Analysis of Microbial Population
NEXT GENERATION SEQUENCING. Farhat Habib
 NEXT GENERATION SEQUENCING HISTORY HISTORY Sanger Dominant for last ~30 years 1000bp longest read Based on primers so not good for repetitive or SNPs sites HISTORY Sanger Dominant for last ~30 years 1000bp
APPLICATION NOTE. Abstract. Introduction
 From minuscule amounts to magnificent results: reliable ChIP-seq data from 1, cells with the True MicroChIP and the MicroPlex Library Preparation kits Abstract Diagenode has developed groundbreaking solutions
Bellerophon; a program to detect chimeric sequences in multiple sequence
 Revised ms: BIOINF-03-0817 Bellerophon; a program to detect chimeric sequences in multiple sequence alignments. Thomas Huber 1 *, Geoffrey Faulkner 1 and Philip Hugenholtz 2 1 ComBinE group, Advanced Computational
Report on database pre-processing
 Multiscale Immune System SImulator for the Onset of Type 2 Diabetes integrating genetic, metabolic and nutritional data Work Package 2 Deliverable 2.3 Report on database pre-processing FP7-600803 [D2.3
Getting of the representative sequences from the clusters (consensus/most abundant) *(MAFFT) Identification of OTUs *(BLAST)
 *(MAFFT) Identification of OTUs *(BLAST)") Illumina pair-end data (R1 & R2 FASTQ) FASTA FASTQ TEXT joining of pair-end data *(fastq-join) v2.0 Quality filtering/sequence trimming/removing of ambiguous bases Grouping sequences by BARCODE motives
Illumina pair-end data (R1 & R2 FASTQ) FASTA FASTQ TEXT joining of pair-end data *(fastq-join) v2.0 Quality filtering/sequence trimming/removing of ambiguous bases Grouping sequences by BARCODE motives
Bioinformatics for Microbial Biology
 Bioinformatics for Microbial Biology Chaochun Wei ( 韦朝春 ) ccwei@sjtu.edu.cn http://cbb.sjtu.edu.cn/~ccwei Fall 2013 1 Outline Part I: Visualization tools for microbial genomes Tools: Gbrowser Part II:
Introductie en Toepassingen van Next-Generation Sequencing in de Klinische Virologie. Sander van Boheemen Medical Microbiology
 Introductie en Toepassingen van Next-Generation Sequencing in de Klinische Virologie Sander van Boheemen Medical Microbiology Next-generation sequencing Next-generation sequencing (NGS), also known as
Applications of Next Generation Sequencing in Metagenomics Studies
 Applications of Next Generation Sequencing in Metagenomics Studies Francesca Rizzo, PhD Genomix4life Laboratory of Molecular Medicine and Genomics Department of Medicine and Surgery University of Salerno
CBC Data Therapy. Metatranscriptomics Discussion
 CBC Data Therapy Metatranscriptomics Discussion Metatranscriptomics Extract RNA, subtract rrna Sequence cdna QC Gene expression, function Institute for Systems Genomics: Computational Biology Core bioinformatics.uconn.edu
Sequencing technologies. Jose Blanca COMAV institute bioinf.comav.upv.es
 Sequencing technologies Jose Blanca COMAV institute bioinf.comav.upv.es Outline Sequencing technologies: Sanger 2nd generation sequencing: 3er generation sequencing: 454 Illumina SOLiD Ion Torrent PacBio
GENOMICS WORKFLOW SOLUTIONS THAT GO WHERE THE SCIENCE LEADS. Genomics Solutions Portfolio
 GENOMICS WORKFLOW SOLUTIONS THAT GO WHERE THE SCIENCE LEADS Genomics Solutions Portfolio WORKFLOW SOLUTIONS FROM EXTRACTION TO ANALYSIS Application-based answers for every step of your workflow Scientists
Experimental Design Microbial Sequencing
 Experimental Design Microbial Sequencing Matthew L. Settles Genome Center Bioinformatics Core University of California, Davis settles@ucdavis.edu; bioinformatics.core@ucdavis.edu General rules for preparing
NEXTFLEX 16S V4 Amplicon-Seq Kit (For Illumina Platforms) Catalog #NOVA (Kit contains 8 reactions) Bioo Scientific Corp V18.
 Catalog #NOVA (Kit contains 8 reactions) Bioo Scientific Corp V18.") NEXTFLEX 16S V4 Amplicon-Seq Kit 2.0-4 (For Illumina Platforms) Catalog #NOVA-4203-01 (Kit contains 8 reactions) Bioo Scientific Corp. 2018 V18.07 This product is for research use only. Not for use in
NEXTFLEX 16S V4 Amplicon-Seq Kit 2.0-4 (For Illumina Platforms) Catalog #NOVA-4203-01 (Kit contains 8 reactions) Bioo Scientific Corp. 2018 V18.07 This product is for research use only. Not for use in
Getting of the representative sequences from the clusters (consensus/most abundant) *(MAFFT) Identification of OTUs *(BLAST)
 *(MAFFT) Identification of OTUs *(BLAST)") Illumina pair-end data (R1 & R2 FASTQ) FASTA FASTQ TEXT joining of pair-end data *(fastq-join) v2.0 Quality filtering/sequence trimming/removing of ambiguous bases Grouping sequences by BARCODE motives
Illumina pair-end data (R1 & R2 FASTQ) FASTA FASTQ TEXT joining of pair-end data *(fastq-join) v2.0 Quality filtering/sequence trimming/removing of ambiguous bases Grouping sequences by BARCODE motives
Outline General NGS background and terms 11/14/2016 CONFLICT OF INTEREST. HLA region targeted enrichment. NGS library preparation methodologies
 Eric T. Weimer, PhD, D(ABMLI) Assistant Professor, Pathology & Laboratory Medicine, UNC School of Medicine Director, Molecular Immunology Associate Director, Clinical Flow Cytometry, HLA, and Immunology
MB311 Molecular Microbiology Laboratory. Spring 2017: Tuesday/Thursday 9:00-11:50 am; Nash 304
 MB311 Molecular Microbiology Laboratory Spring 2017: Tuesday/Thursday 9:00-11:50 am; Nash 304 Instructor: Dr. Walt Ream reaml@science.oregonstate.edu ALS1081 737-1791 Office Hours: by appointment. Teaching
TECH NOTE Pushing the Limit: A Complete Solution for Generating Stranded RNA Seq Libraries from Picogram Inputs of Total Mammalian RNA
 TECH NOTE Pushing the Limit: A Complete Solution for Generating Stranded RNA Seq Libraries from Picogram Inputs of Total Mammalian RNA Stranded, Illumina ready library construction in
Tutorial. Whole Metagenome Functional Analysis (beta) Sample to Insight. November 21, 2017
 Sample to Insight. November 21, 2017") Whole Metagenome Functional Analysis (beta) November 21, 2017 Sample to Insight QIAGEN Aarhus Silkeborgvej 2 Prismet 8000 Aarhus C Denmark Telephone: +45 70 22 32 44 www.qiagenbioinformatics.com AdvancedGenomicsSupport@qiagen.com
Whole Metagenome Functional Analysis (beta) November 21, 2017 Sample to Insight QIAGEN Aarhus Silkeborgvej 2 Prismet 8000 Aarhus C Denmark Telephone: +45 70 22 32 44 www.qiagenbioinformatics.com AdvancedGenomicsSupport@qiagen.com
Automated size selection of NEBNext Small RNA libraries with the Sage Pippin Prep
 Automated size selection of NEBNext Small RNA libraries with the Sage Pippin Prep DNA CLONING DNA AMPLIFICATION & PCR EPIGENETICS RNA ANALYSIS LIBRARY PREP FOR NEXT GEN SEQUENCING PROTEIN EXPRESSION &
MicroSEQ Rapid Microbial Identification System
 MicroSEQ Rapid Microbial Identification System Giving you complete control over microbial identification using the gold-standard genotypic method The MicroSEQ ID microbial identification system, based
Comparison of ExoSAP-IT and ExoSAP-IT Express reagents to alternative PCR cleanup methods
 WHITE PAPER ExoSAP-IT PCR cleanup reagents Comparison of ExoSAP-IT and ExoSAP-IT Express reagents to alternative PCR cleanup methods Abstract Here we present superior workflow advantages of enzymatic PCR
Next Generation Sequencing. Tobias Österlund
 Next Generation Sequencing Tobias Österlund tobiaso@chalmers.se NGS part of the course Week 4 Friday 13/2 15.15-17.00 NGS lecture 1: Introduction to NGS, alignment, assembly Week 6 Thursday 26/2 08.00-09.45
Exercices: Metagenomics. Find Rapidly OTU with Galaxy Solution
 Exercices: Metagenomics Find Rapidly OTU with Galaxy Solution F R É D É R I C E S C U D I É * a n d L U C A S A U E R *, M A R I A B E R N A R D, L A U R E N T C A U Q U I L, K AT I A V I D A L, S A R
solid S Y S T E M s e q u e n c i n g See the Difference Discover the Quality Genome
 solid S Y S T E M s e q u e n c i n g See the Difference Discover the Quality Genome See the Difference With a commitment to your peace of mind, Life Technologies provides a portfolio of robust and scalable
Nature Methods Optimal enzymes for amplifying sequencing libraries
 Nature Methods Optimal enzymes for amplifying sequencing libraries Michael A Quail, Thomas D Otto, Yong Gu, Simon R Harris, Thomas F Skelly, Jacqueline A McQuillan, Harold P Swerdlow & Samuel O Oyola Supplementary
A Methodology Study for Metagenomics using Next Generation Sequencers
 A Methodology Study for Metagenomics using Next Generation Sequencers Presenter: Sushmita Singh An ABRF 2011-12 DSRG Study Definitions?! Metagenomics: Metagenomics is the study of metagenomes, genetic
BIOO LIFE SCIENCE PRODUCTS. NEXTflex TM 16S V4 Amplicon-Seq Kit 4 (Illumina Compatible) BIOO Scientific Corp V13.01
 BIOO Scientific Corp V13.01") BIOO LIFE SCIENCE PRODUCTS NEXTflex TM 16S V4 Amplicon-Seq Kit 4 (Illumina Compatible) Catalog #: 4201-01 (16 reactions) BIOO Scientific Corp. 2013 V13.01 TABLE OF CONTENTS GENERAL INFORMATION... 1 Product
BIOO LIFE SCIENCE PRODUCTS NEXTflex TM 16S V4 Amplicon-Seq Kit 4 (Illumina Compatible) Catalog #: 4201-01 (16 reactions) BIOO Scientific Corp. 2013 V13.01 TABLE OF CONTENTS GENERAL INFORMATION... 1 Product
Read Quality Assessment & Improvement. UCD Genome Center Bioinformatics Core Tuesday 14 June 2016
 Read Quality Assessment & Improvement UCD Genome Center Bioinformatics Core Tuesday 14 June 2016 QA&I should be interactive Error modes Each technology has unique error modes, depending on the physico-chemical
NGS part 2: applications. Tobias Österlund
 NGS part 2: applications Tobias Österlund tobiaso@chalmers.se NGS part of the course Week 4 Friday 13/2 15.15-17.00 NGS lecture 1: Introduction to NGS, alignment, assembly Week 6 Thursday 26/2 08.00-09.45
Sequencing techniques
 Sequencing techniques Workshop on Whole Genome Sequencing and Analysis, 2-4 Oct. 2017 Learning objective: After this lecture, you should be able to account for different techniques for whole genome sequencing
MicroSEQ Rapid Microbial Identifi cation System
 APPLICATION NOTE MicroSEQ Rapid Microbial Identifi cation System MicroSEQ Rapid Microbial Identification System Giving you complete control over microbial identifi cation using the gold-standard genotypic
Sequencing technologies. Jose Blanca COMAV institute bioinf.comav.upv.es
 Sequencing technologies Jose Blanca COMAV institute bioinf.comav.upv.es Outline Sequencing technologies: Sanger 2nd generation sequencing: 3er generation sequencing: 454 Illumina SOLiD Ion Torrent PacBio
Enabling reproducible data analysis for metagenomics. eresearch Africa Conference 2017 Gerrit Botha CBIO H3ABioNet 3 May 2017
 Enabling reproducible data analysis for metagenomics eresearch Africa Conference 2017 Gerrit Botha CBIO H3ABioNet 3 May 2017 Outline 16S rrna analysis Current CBIO 16S rrna analysis setup H3ABioNet hackathon
Introduction to RNA-Seq. David Wood Winter School in Mathematics and Computational Biology July 1, 2013
 Introduction to RNA-Seq David Wood Winter School in Mathematics and Computational Biology July 1, 2013 Abundance RNA is... Diverse Dynamic Central DNA rrna Epigenetics trna RNA mrna Time Protein Abundance
Sequencing technologies. Jose Blanca COMAV institute bioinf.comav.upv.es
 Sequencing technologies Jose Blanca COMAV institute bioinf.comav.upv.es Outline Sequencing technologies: Sanger 2nd generation sequencing: 3er generation sequencing: 454 Illumina SOLiD Ion Torrent PacBio
Spectral Counting Approaches and PEAKS
 Spectral Counting Approaches and PEAKS INBRE Proteomics Workshop, April 5, 2017 Boris Zybailov Department of Biochemistry and Molecular Biology University of Arkansas for Medical Sciences 1. Introduction
DNA concentration and purity were initially measured by NanoDrop 2000 and verified on Qubit 2.0 Fluorometer.
 DNA Preparation and QC Extraction DNA was extracted from whole blood or flash frozen post-mortem tissue using a DNA mini kit (QIAmp #51104 and QIAmp#51404, respectively) following the manufacturer s recommendations.
Microbial sequencing solutions
 Microbial sequencing solutions Scalable, simple, fast TARGETED GENOME Sequencing f every lab, every budget, every application Ion Trent semiconduct sequencing Ion Trent technology has pioneered an entirely
NGS Sample QC with the Agilent 2200 TapeStation. Rainer Nitsche Application Engineer Agilent Technologies, Inc.
 NGS Sample QC with the Agilent 2200 TapeStation Rainer Nitsche Application Engineer Agilent Technologies, Inc. The Agilent 2100 Bioanalyzer First commercially available Lab-on-a-Chip product Introduced
Microbiomics I August 24th, Introduction. Robert Kraaij, PhD Erasmus MC, Internal Medicine
 Microbiomics I August 24th, 2017 Introduction Robert Kraaij, PhD Erasmus MC, Internal Medicine r.kraaij@erasmusmc.nl Welcome to Microbiomics I Infection & Immunity MSc students Only first day no practicals
Metagenomics Computational Genomics
 Metagenomics 02-710 Computational Genomics Metagenomics Investigation of the microbes that inhabit oceans, soils, and the human body, etc. with sequencing technologies Cooperative interactions between
QIAseq Targeted Panel Analysis Plugin USER MANUAL
 QIAseq Targeted Panel Analysis Plugin USER MANUAL User manual for QIAseq Targeted Panel Analysis 1.1 Windows, macos and Linux June 18, 2018 This software is for research purposes only. QIAGEN Aarhus Silkeborgvej
ST 591: Introduction to Quantitative Genomics Syllabus
 General Information Instructor: Thomas Sharpton Email: thomas.sharpton@oregonstate.edu Office: 530 Nash Hall Phone: (541) 737-8623 Office Hours: TBD Teaching Assistand: TBD Course credits: 3 Class meetings:
Advisors: Prof. Louis T. Oliphant Computer Science Department, Hiram College.
 Author: Sulochana Bramhacharya Affiliation: Hiram College, Hiram OH. Address: P.O.B 1257 Hiram, OH 44234 Email: bramhacharyas1@my.hiram.edu ACM number: 8983027 Category: Undergraduate research Advisors:
MicroSEQ TM ID Rapid Microbial Identification System:
 MicroSEQ TM ID Rapid Microbial Identification System: the complete solution for reliable genotypic microbial identification 1 The world leader in serving science Rapid molecular methods for pharmaceutical
Ultrasequencing: methods and applications of the new generation sequencing platforms
 Ultrasequencing: methods and applications of the new generation sequencing platforms Nuria Tubío Santamaría Course: Genomics Universitat Autònoma de Barcelona 1 Introduction Clasical methods of sequencing:
Deakin Research Online
 Deakin Research Online This is the published version: Church, Philip, Goscinski, Andrzej, Wong, Adam and Lefevre, Christophe 2011, Simplifying gene expression microarray comparative analysis., in BIOCOM
Molecular methods to characterize the microbiota in the mouse tissues
 Molecular methods to characterize the microbiota in the mouse tissues Olivier Bouchez, GeT-PlaGe, INRA Toulouse @GeT_Genotoul Who are we? Genomic and transcriptomic core facility spreads on 5 sites GeT
Transcriptome Assembly, Functional Annotation (and a few other related thoughts)
") Transcriptome Assembly, Functional Annotation (and a few other related thoughts) Monica Britton, Ph.D. Sr. Bioinformatics Analyst June 23, 2017 Differential Gene Expression Generalized Workflow File Types
Transcriptome Assembly, Functional Annotation (and a few other related thoughts) Monica Britton, Ph.D. Sr. Bioinformatics Analyst June 23, 2017 Differential Gene Expression Generalized Workflow File Types
Data Basics. Josef K Vogt Slides by: Simon Rasmussen Next Generation Sequencing Analysis
 Data Basics Josef K Vogt Slides by: Simon Rasmussen 2017 Generalized NGS analysis Sample prep & Sequencing Data size Main data reductive steps SNPs, genes, regions Application Assembly: Compare Raw Pre-
GPU-Meta-Storms: Computing the similarities among massive microbial communities using GPU
 GPU-Meta-Storms: Computing the similarities among massive microbial communities using GPU Xiaoquan Su $, Xuetao Wang $, JianXu, Kang Ning* Shandong Key Laboratory of Energy Genetics, CAS Key Laboratory
Integrated NGS Sample Preparation Solutions for Limiting Amounts of RNA and DNA. March 2, Steven R. Kain, Ph.D. ABRF 2013
 Integrated NGS Sample Preparation Solutions for Limiting Amounts of RNA and DNA March 2, 2013 Steven R. Kain, Ph.D. ABRF 2013 NuGEN s Core Technologies Selective Sequence Priming Nucleic Acid Amplification
GENOMICS WORKFLOW SOLUTIONS THAT GO WHERE THE SCIENCE LEADS. Genomics Solutions Portfolio
 GENOMICS WORKFLOW SOLUTIONS THAT GO WHERE THE SCIENCE LEADS Genomics Solutions Portfolio WORKFLOW SOLUTIONS FROM EXTRACTION TO ANALYSIS Application-based answers for every step of your workflow Scientists
Introduc)on to QIIME on the IPython Notebook
on to QIIME on the IPython Notebook") Strategies and Techniques for Analyzing Microbial Population Structures Introduc)on to QIIME on the IPython Notebook Rob Knight Adam Robbins- Pianka Will Van Treuren Yoshiki Vázquez- Baeza ( @yosmark )
Strategies and Techniques for Analyzing Microbial Population Structures Introduc)on to QIIME on the IPython Notebook Rob Knight Adam Robbins- Pianka Will Van Treuren Yoshiki Vázquez- Baeza ( @yosmark )
Assembly of Ariolimax dolichophallus using SOAPdenovo2
 Assembly of Ariolimax dolichophallus using SOAPdenovo2 Charles Markello, Thomas Matthew, and Nedda Saremi Image taken from Banana Slug Genome Project, S. Weber SOAPdenovo Assembly Tool Short Oligonucleotide
DATA FORMATS AND QUALITY CONTROL
 HTS Summer School 12-16th September 2016 DATA FORMATS AND QUALITY CONTROL Romina Petersen, University of Cambridge (rp520@medschl.cam.ac.uk) Luigi Grassi, University of Cambridge (lg490@medschl.cam.ac.uk)
ChIP-seq and RNA-seq. Farhat Habib
 ChIP-seq and RNA-seq Farhat Habib fhabib@iiserpune.ac.in Biological Goals Learn how genomes encode the diverse patterns of gene expression that define each cell type and state. Protein-DNA interactions
Shifts in Diversity and Function of Sediment Bacterial Community in the Hengshi River upon Acid Mine Drainage Pollution
 Shifts in Diversity and Function of Sediment Bacterial Community in the Hengshi River upon Acid Mine Drainage Pollution Song Tang song.tang@usask.ca SETAC Orlando Nov 8, 2016 Mining Activities Mining The