Simulating the Effects of Enclosure Retrofits on Post-War High-Rise Apartment Buildings in Cold Climates
|
|
|
- Rhoda Griffin
- 5 years ago
- Views:
Transcription
1 Simulating the Effects of Enclosure Retrofits on Post-War High-Rise Apartment Buildings in Cold Climates by Matthew Charbonneau A thesis presented to the University of Waterloo in fulfillment of the thesis requirement for the degree of Master of Applied Science in Civil Engineering Waterloo, Ontario, Canada, 2011 Matthew Charbonneau 2011
2 AUTHOR'S DECLARATION I hereby declare that I am the sole author of this thesis. This is a true copy of the thesis, including any required final revisions, as accepted by my examiners. I understand that my thesis may be made electronically available to the public. Matthew Charbonneau ii
3 Abstract A large portion of the existing building stock in North America is comprised of post-world War II high-rise apartment buildings, particularly in the Greater Golden Horseshoe in Ontario. They are home to a large portion of the Canadian population. These buildings are nearly 50 years old and reaching the end of their useful lifespan. Significant deterioration has lead to life safety concerns, poor standards of living, and aesthetic degradation. They also consume a significant amount of energy resulting in contributing to Canada s high per capita greenhouse gas emissions. This thesis investigates the impact of various retrofit strategies on the energy consumption, durability, and occupant comfort of the towers. The building enclosure is the primary focus. The impacts were analyzed using three approaches. Whole building energy consumption was simulated by adapting a spreadsheet based Building Energy and Loads Analysis (BELA) model, originally intended for office buildings. Heat flow and temperatures across the enclosures were modeled using a two-dimensional finite element model (Therm 5.2). A single, theoretical building dubbed the, Archetype, was developed to define the characteristics of a typical tower using details extracted from four sets of drawings for towers built in Toronto during the late 1960s. Various quantities and configurations of thermal insulation were added to the Archetype and the resulting effective thermal resistances were modeled. Adding insulation to the interior significantly reduces the effectiveness of any added thermal resistance. Insulating on the exterior allows the insulation around the balconies to reach 80% of its rated value, even without insulating the balconies. Energy efficiency measures (EEMs) including retrofitting the walls, windows, appliances, or HVAC equipment were simulated and it was found that each on its own did not have a major impact on annual energy consumption. Packages of EEMs were created and simulated. It was found that a basic and high-performance whole building retrofit packages would save approximately 40% and 55% of the annual energy consumption, respectively, based on the Archetype. An analysis and discussion of the enclosure retrofit impacts on freeze-thaw potential, interior surface and interstitial condensation, occupants thermal comfort, and passive thermal comfort was completed. An interior versus exterior enclosure retrofit comparison summary illustrated that an exterior enclosure retrofit has significant benefits relative to an interior retrofit including ease of construction, greater durability, and improved comfort. The difference in annual energy reduction between an interior and exterior enclosure retrofit was small. iii
4 Acknowledgements I would like to thank Dr. John Straube for his willingness to share his vast knowledge even beyond the scope of my research. I appreciated his push to help me become a better building engineer and his patience and support to ensure my success. I would also like to thank my colleagues and friends from the Building Engineering Group; Rob Lepage, Brittany Hanam, Nick Bronsema, Peter Mensinga, and Emily Vance. Their technical help, shared work experiences, and care were greatly appreciated. Thanks is owed to Building Science Corporation for the building science experience, shared knowledge, and support from Christopher Schumacher, Aaron Grin, Jonathan Smegal, Alex Lukachko, Paul Schumacher, and Ed Reeves. Thanks are also owed to my always supportive family through all my educational endeavors. Thanks Dad, Mom, Dan, Melinda, Patricia, and Brad. Thanks to all the Charbonneaus and Waddens for the many enjoyable and distracting vacations together. Finally, thanks to my incredibly supportive Linda my wife and colleague. iv
5 Table of Contents AUTHOR'S DECLARATION... ii Abstract... iii Acknowledgements... iv Table of Contents... v List of Figures... ix List of Tables... xiii Chapter 1 - Introduction Background Living Conditions of Tower Tenants Physical Deterioration Canada s Energy Use Canada s Impact on Global Warming The Need for Retrofit Objective Scope Approach Chapter 2 Towers History of the Towers Apartment Tower Construction Planned Communities Population of Towers Location of Towers Archetype Archetype Dimensions Units in Archetype Archetype Unit Size Archetype Typical Floor Area Composition Archetype Perimeter Composition and Window to Wall Ratio Archetype Wall Types Archetype Enclosure Composition Archetype s Mechanical System and Equipment v
6 2.4.9 Summary of Archetype Chapter 3 Hygrothermal and Air Leakage Analysis of Towers Heat Transfer Analysis Therm Approach Archetype Enclosure Thermal Resistances Archetype s Condensation Potential Air Leakage Wind Pressures Stack Effect Mechanical Ventilation Indoor Air Quality of Towers Archetype Air Leakage Characteristics Air Leakage Models Heat, Air, and Moisture Analysis Summary Chapter 4 Energy Modeling High-Rise MURBs Building Energy and Loads Analysis (BELA) BELA Inputs BELA Schedules BELA Weather Data BELA Load Calculations BELA Ventilation BELA Load Results BELA System Results BELA MURB High-Rise Edition Exterior Convection Coefficient and Thermal Mass MURB Units and Occupancy Domestic Hot Water Miscellaneous Electrical Loads Air Leakage Model Ventilation System Space Conditioning Analysis vi
7 4.3 Simulated Energy Use of the Archetype Simulated Annual Energy Consumption of the Archetype Comparison to Measured Average Annual Energy Consumption of Towers Archetype Loads Analysis Chapter 5 Energy and Durability Impacts of Tower Retrofits Function of the Enclosure Enclosure Control Layers Enclosure Retrofit Details Effective Thermal Resistances Retrofit Retrofit Retrofit Retrofit Summary of Effective Thermal Resistances Energy Efficiency Measures Window Retrofit Wall and Roof Retrofit HVAC Retrofit Appliance and Lighting Retrofit Air Leakage Reduction Consequences Reduced Domestic Hot Water Usage Energy Efficiency Measures Summary Energy Efficiency Measure Retrofit Packages Annual Energy Consumption Peak Energy Consumption Impact and Shift in Reduced Greenhouse Gas Emissions Durability Wall Section Temperature Profiles Surface Condensation Potential Thermal Comfort Operative Temperature Passive Comfort during Electrical or Mechanical Failures vii
8 5.8 Interior versus Exterior Enclosure Retrofit Comparison Summary Chapter 6 Conclusions and Recommendations Conclusions Recommendations References Appendix A - Inventory and Location of Apartment Towers in the GGH (Stewart, G. and Thorne, J., 2010) Appendix B Building Drawings (TCHC, 2010) Appendix C - BELA Screenshots (Hanam, 2010) Appendix D - Effect of Varying Towers Balcony Geometry on Overall R-Value Appendix E - Retrofit Results for Electrically Heated Archetype Appendix F - Retrofit Packages Results for Electrically Heated Archetype viii
9 List of Figures Figure 1-1: Post-War Concrete Framed High-Rise Apartment Tower... 1 Figure 1-2: Percentage of Toronto High-Rise Tenants Who Earn Less than the Poverty Line... 2 Figure 1-3: Peeling Paint and Spalling Concrete on Post-War Apartment Tower (TCHC, 2010)... 4 Figure 1-4: Spalling Concrete on Top Outer Edge of Cantilevered Balcony (CMHC, ND)... 5 Figure 1-5: Exposed Steel Reinforcing and Steel Guard Rail in a Concrete Balcony... 6 Figure 1-6: Balcony Failure... 7 Figure 1-7: Corrosion of Steel Door and Window Frame of Enclosure Entrance (TCHC, 2010)... 8 Figure 1-8: Efflorescence below Windows on Brick Enclosure... 9 Figure 1-9: Efflorescence on Brick Surface Figure 1-10: Deteriorated Flashing and Steel Shelf Angle (CMHC, 2006) Figure 1-11: Deteriorating Plaster Ceiling in Bathroom (TCHC, 2010) Figure 1-12: Wind Scouring at Corner of Stone Roof (TCHC, 2010) Figure 1-13: Rainwater Stains below Window Corners (TCHC, 2010) Figure 1-14: Peeling Paint and Cracking in Balcony Soffit (TCHC, 2010) Figure 1-15: Deteriorating Plumbing Riser (TCHC, 2010) Figure 1-16: Freeze-Thaw Deterioration Figure 1-17: Brick Staining at Grade Figure 1-18: Canadian Energy Use in 2005 by Sector (NRCan, 2008) Figure 1-19: Canadian Residential Energy End-Use Percentages in 2005 (NRCan, 2008) Figure 1-20: Canadian Residential Space Heating Trends Figure 1-21: Atmosphere CO 2 Concentrations over the Last 1000 Years (MacKay, 2009) Figure 1-22: Change in Temperature, Sea Level, and Northern Hemisphere Snow Cover (IPCC, 2007) Figure 1-23: Greenhouse Gas Pollution per Average Person of Each Country (MacKay, 2009) Figure 2-1: Le Corbusier's Ville Contemporaine (Blake, P., 1976) Figure 2-2: Post-War Rise in MURB Construction (Kesik, T. And Saleff, I., 2009) Figure 2-3: Tower Construction (Kesik, T. And Saleff, I., 2009) Figure 2-4: Flying Formwork in Action Figure 2-5: Post-War MURBs in the GTA (Kesik, T. And Saleff, I., 2009) Figure 2-6: Percentage of Apartment Towers in Greater Golden Horseshoe (Stewart, G. and Thorne, J., 2010) ix
10 Figure 2-7: GTA High-Rise MURBs Constructed between 1946 and Figure 2-8: Wall Section Figure 2-9: Window Wall Section Figure 2-10: Balcony Wall Section Figure 2-11: Balcony Window Wall Section Figure 2-12: Balcony Door Section Figure 2-13: Archetype Roof Section Figure 2-14: Cold Water and Domestic Hot Water Basic System Layout Figure 2-15: Hydronic Heating Flow Chart Figure 2-16: Archetype Rendering Figure 2-17: Archetype Rendering Close up Figure 2-18: Archetype's Opaque Wall Section Figure 3-1: Thermographic Image of Protruding Balcony Slabs Figure 3-2: Thermographic Image of Penetrating Floor Slabs (Kesik, T. And Saleff, I., 2009) Figure 3-3: Thermographic Image of Windows and Walls Behind Baseboard Heaters Figure 3-4: Finite Element Mesh Figure 3-5: AutoCAD Enclosure Section Used in Therm Figure 3-6: Temperature Distribution Figure 3-7: Window Frame Temperature Distribution Figure 3-8: Psychrometric Chart (Straube and Burnett, 2005) Figure 3-9: Potential Condensation Locations Figure 3-10: Tower Wind Pressures at 0 and Figure 3-11: Stack Effect Figure 3-12: Corridor Pressurization System (Lstiburek, 2006) Figure 3-13: Individual Unit Exhaust System (Diamond, R.C. et al, 1999) Figure 3-14: Actual Air Flows in Ventilation System (CMHC, 2007) Figure 3-15: Common Overcladding around Upper Portion of Tower Figure 3-16: 1977 and 1982 Tower's Overall Air Leakage Characteristics Figure 3-17: 1977 and 1982 Tower's Exterior Wall Air Leakage Characteristics Figure 3-18: Overall Air Leakage Values for Post-War Apartment Buildings Figure 3-19: Natural ACH for Various Models over One Year Figure 3-20: Window Adjusted Natural ACH for Various Models over One Year x
11 Figure 4-1: BELA Model Structure (Hanam, 2010) Figure 4-2: BELA MURB High-Rise Edition Inputs for Units Figure 4-3: Daily Occupancy Schedule (Hendron, R. And Engebrecht, C., 2010) Figure 4-4: BELA MURB High-Rise Edition DHW Calculations Figure 4-5: Average Daily DHW Consumption for Canada in litres per hour (Knight, I. et al., 2007)96 Figure 4-6: Average Hot Water Consumption "CEA Typical" Household (Barakat, S., 1984) Figure 4-7: Domestic Hot Water Consumption Figure 4-8: BELA MURB High-Rise Edition DHW Latent Load Calculations Figure 4-9: BELA MURB High-Rise Edition Miscellaneous Electrical Load Calculations Figure 4-10: Miscellaneous Electrical Loads Daily Usage (Hendron, R. And Engebrecht, C., 2010) Figure 4-11: BELA MURB High-Rise Edition Air Leakage Characteristics Inputs Figure 4-12: Correction Factor of Air Infiltration Rates Due to Wind Approaching at Various Directions (Shaw, C. and Tamura, G., 1977) Figure 4-13: BELA MURB High-Rise Edition Central Exhaust Ventilation Flow Chart Figure 4-14: BELA MURB High-Rise Edition Individual Exhaust Ventilation Flow Chart Figure 4-15: BELA MURB High-Rise Edition Ventilation Inputs Figure 4-16: BELA MURB High-Rise Edition System Inputs Figure 4-17: Monthly Energy Intensity Demands for the Hydronically-Heated Archetype Figure 4-18: Monthly Energy Intensity Demands for the Electrically-Heated Archetype Figure 4-19: Monthly Energy Density Bar Graph for the Hydronically-Heated Archetype Figure 4-20: Monthly Energy Density Bar Graph for the Electrically-Heated Archetype Figure 4-21: Energy Demand Percentages for the Hydronically-Heated Archetype Figure 4-22: Energy Demand Percentages for the Electrically-Heated Archetype Figure 4-23: Archetype's January Heating Loads Figure 4-24: Archetype's Monthly Load Intensity Figure 5-1: Conceptual Building Enclosure with its Functional Layers Figure 5-2: Archetype Section Detail Figure 5-3: Interior Enclosure Retrofit Figure 5-4: Exterior Enclosure Retrofit Figure 5-5: Balcony Door Retrofit Figure 5-6: Balcony Wall Retrofit xi
12 Figure 5-7: Balcony Window Wall Retrofit Figure 5-8: Wall Retrofit Figure 5-9: Window Wall Retrofit Figure 5-10: Balcony Door Retrofit Figure 5-11: Balcony Wall Retrofit Figure 5-12: Balcony Window Wall Retrofit Figure 5-13: Wall Retrofit Figure 5-14: Window Wall Retrofit Figure 5-15: Balcony Door Retrofit Figure 5-16: Balcony Wall Retrofit Figure 5-17: Balcony Window Wall Retrofit Figure 5-18: Balcony Door Retrofit Figure 5-19: Balcony Wall Retrofit Figure 5-20: Balcony Window Wall Retrofit Figure 5-21: Annual Energy Distribution and Savings of Retrofit Package A on the Archetype Figure 5-22: Annual Energy Distribution and Savings of Retrofit Package B on the Archetype Figure 5-23: Annual Energy Distribution and Savings of Retrofit Package C on the Archetype Figure 5-24: Retrofit Package Comparison Relative to the Archetype Figure 5-25: Peak Energy Consumption for the Electrically-Heated Archetype Figure 5-26: Peak Energy Consumption for the Hydronically-Heated Archetype Figure 5-27: Existing Wall Section Winter Temperature Profiles Figure 5-28: Interior R10 Retrofit Wall Section Winter Temperature Profiles Figure 5-29: Exterior R10 Retrofit Wall Section Winter Temperature Profiles Figure 5-30: Mean Radiant Temperature View Angles xii
13 List of Tables Table 2-1: Apartment Tower Location and Stock in GGH Table 2-2: Buildings Dimensions Table 2-3: Number of Units in Buildings Table 2-4: Buildings Unit Sizes Table 2-5: Typical Floor Area Percentages Table 2-6: Building Perimeter Compositions and Window to Wall Ratios Table 2-7: Existing Opaque Wall Material Characteristics Table 2-8: Existing Window Thermal Characteristics Table 2-9: Domestic Hot Water Equipment Table 2-10: Hydronic Heating Equipment Specifications Table 2-11 Mechanical Ventilation Specifications Table 2-12: Mechanical Design Ventilation Rates Table 2-13: Archetype Characteristic Summary Table 3-1: Archetype Opaque Wall Thermal Resistance Table 3-2: Archetype Window Thermal Resistance Table 3-3: Condensation Potential Table 3-4: Indoor Air Quality Investigation Summary Table 3-5: 1977 and 1982 High-Rise Apartment Tower s Measured Air Leakage Values Table 3-6: 1991 and 1960 Apartment Building's Air Leakage Rates Table 3-7: Model Comparisons Table 3-8: Average and Maximum Natural ACH for Various Models Table 3-9: Impact of Window Operation on NLR 75 for Building # Table 3-10: Seasonally Adjusted Overall Average Flow Coefficients Table 3-11: Adjusted Average and Maximum Natural ACH for Various Models Table 3-12: Archetype's Enclosure Thermal Resistances Table 4-1: Weighting Factors for Thermally Lighweight Construction (Hanam, 2010) Table 4-2: Weighting Factors for Thermally Massive Construction (Hanam, 2010) Table 4-3: Per Capita Hot Water Use (DeOreo, W. and Mayer, P., 1999) Table 4-4: Net Heat Gain from Water Use (Barakat, S., 1984) Table 4-5: Latent Load Calculations Table 4-6: Annual Energy Consumption of Four Types of Apartment Towers (CMHC, 2005) xiii
14 Table 5-1: Effective Thermal Resistances of Opaque Wall Sections for Retrofit Table 5-2: Effective Thermal Resistances of Opaque Wall Sections for Retrofit Table 5-3: Effective Thermal Resistances of Opaque Wall Sections for Retrofit Table 5-4: Effective Thermal Resistances of Opaque Wall Sections for Retrofit Table 5-5: Approximate Thicknesses of Insulation Table 5-6: Effective Thermal Resistances Table 5-7: Window Retrofit Characteristics Table 5-8: Window Retrofit Scenarios Table 5-9: Opaque Wall Retrofit Scenarios Table 5-10: Roof Retrofit Scenarios Table 5-11: HVAC Retrofit Packages Table 5-12: Appliance Retrofit Unit Energy Consumption Table 5-13: Lighting Retrofit Values Table 5-14: Air Leakage Reduction Scenarios Table 5-15: Faucet and Showerhead Retrofit Table 5-16: Energy Efficiency Measures Description Summary Table 5-17: Energy Efficiency Measures Results Table 5-18: Retrofit Package Summary Table 5-19: Retrofit Condensation Potential Table 5-20: MRT and Operative Temperatures for the Balcony Window Wall Section Table 5-21: MRT and Operative Temperatures for the Balcony Wall Section Table 5-22: General Interior versus Exterior Retrofit Comparison xiv
 and over 1000 were built in the City of Toronto. Only New York City has more with approximately 5500.")
15 Chapter 1 - Introduction 1.1 Background During the post World War II boom, a significant number of concrete framed high-rise apartment towers were built all over North America. Close to 2000 of these towers were built in the Greater Golden Horseshoe (GGH) and over 1000 were built in the City of Toronto. Only New York City has more with approximately Figure 1-1 illustrates two of these towers seen from Highway 401 in Toronto, Ontario. Figure 1-1: Post-War Concrete Framed High-Rise Apartment Tower The towers illustrated in Figure 1-1, along with all the other apartment towers of this era, are approximately 50 years old and reaching the end of their service life. They are showing signs of physical deterioration and need repairs. They also need modernization to improve the tenant s living conditions and to reduce energy use and greenhouse gas production. The current living conditions and state of physical deterioration of these towers along with Canadian greenhouse gas emissions and energy use will be discussed below. 1

16 1.1.1 Living Conditions of Tower Tenants Today these apartments house an increasingly poor population. Figure 1-2 from the Globe and Mail s article, Toronto Increasingly Becoming a City of Vertical Poverty (Paperny, A., 2011), illustrates the increase in percentage of Toronto high-rise tenants earning less than Statistics Canada s lowincome cut-off. Figure 1-2: Percentage of Toronto High-Rise Tenants Who Earn Less than the Poverty Line Figure 1-2 illustrates that the average person living in Toronto`s high-rise apartments today have less income than they did in the past. With financially poorer tenants, landlords and property management companies can charge less rent and hence have less money available for capital costs to repair and improve these high-rise apartment towers. This results in continued deterioration and thus poorer living conditions. Tenants of these apartments are forced to accept poor living conditions. For example, the author of one newspaper article (Melanson, T., 2011) toured a building and apartment unit and described the situation; dead cockroaches and rat holes were found along the hallway walls. The family did not sleep in the bedroom because it was quarantined for a couple months due to mould problems. A sewer pipe had burst above their unit leaking through the drywall into their bedroom and bathroom. The window frames leak enough that during rain showers a bucket is used to collect the penetrating water. The oven is used as a heating source during colder periods when the heat loss is excessive and/or deteriorated heating system can t provide enough comfort. These conditions described in the above article are a result of significant deterioration that includes corroded piping, failure of the window frame seal, poor thermal insulation, minimal air control, and 2
17 failing ventilation systems. Examples of physical deterioration in these towers are discussed in the next section Physical Deterioration Building condition assessments by many different observers of these towers have documented numerous physical deteriorations. These assessments are often completed by visual inspections with findings and recommendations based on observations and measurements. Building condition assessments are often intended as the basis for short-term remedial action and capital expenditure planning. The recommendations of the assessments are usually repairs that require regular annual maintenance. Rarely are recommendations for retrofit made 1. If significant capital expenditure is recommended for repair, the opportunity for retrofit should be assessed. Examples of common problems include: Peeling paint Spalling concrete Corrosion of reinforcement and balcony guards Balcony Failures Corrosion of window and door frames Efflorescence Subflorescence Deteriorating flashings Deteriorating shelf angles Deteriorating plaster ceilings Scouring of stone roof Staining of brick Cracking in balcony soffit Deteriorating plumbing riser Freeze-thaw 1 Repair involves restoring the building to its original working order. Retrofit involves improving the building to current or newer working order. 3

18 Peeling Paint and Spalling Concrete Figure 1-3: Peeling Paint and Spalling Concrete on Post-War Apartment Tower (TCHC, 2010) The exposed paint on the enclosures concrete panel surface illustrated in Figure 1-3 is peeling likely due to exposure to ultra-violet radiation, rain, temperature fluctuations, and trapped moisture. Repairs such as repainting will likely lead to the same problem. Figure 1-3 also illustrates spalling concrete on the exposed slab edge. The cantilevered reinforced concrete balconies of these towers also have significant spalling and other deterioration problems. Spalling on the top of the balcony surface is illustrated in Figure

19 Figure 1-4: Spalling Concrete on Top Outer Edge of Cantilevered Balcony (CMHC, ND) Figure 1-4 illustrates concrete spalling on the outer edge of the top side of a cantilevered balcony. Carbonation and chloride diffusion in the reinforced concrete leads to spalling. Carbonation is the process of carbon dioxide in the ambient air penetrating the concrete and reacting with the hydroxides. This process significantly lowers the alkalinity (ph) of the concrete which reduces steel reinforcement protection from corrosion. (Kosmatka et al., 2002) Chloride diffusion is the process of chloride ions, from sodium chloride (salt), penetrating the concrete and reacting with the protective oxide film around the steel reinforcement. This process also reduces the steels protection from corrosion. (Kosmatka et al., 2002) When the steel reinforcement has lost its protective oxide film an electric cell is formed along the steel. The hydroxide ions that are formed combine with the iron from the steel resulting in iron hydroxide. The iron hydroxide combines with oxygen forming iron oxide (rust). This process results in an increase in the steel reinforcement s diameter where sections of iron oxide have built up. This circumferential increase causes tangential stress in the surrounding concrete resulting in cracks. This allows further penetration of chlorides and carbon dioxide, thus accelerating the process. Eventually sections of concrete separate and either fall off or are brushed away by wind or other mechanical processes. The loss of concrete from the section decreases its overall strength which may eventually result in failure. 5
 Figure 1-5 illustrates extensive spalling of the concrete surrounding the steel reinforcement such that it")
20 Corrosion of Reinforcement and Balcony Guards Figure 1-5 illustrates corrosion around the steel reinforcement and steel guard rail of a balcony. Figure 1-5: Exposed Steel Reinforcing and Steel Guard Rail in a Concrete Balcony (CMHC, ND) Figure 1-5 illustrates extensive spalling of the concrete surrounding the steel reinforcement such that it is visible and fully exposed. The corroded steel guard rail is no longer embedded in the concrete, and hence has lost all its structural integrity. The cost to repair this problem is significant, and a complete retrofit should be considered. 6

21 Balcony Failures Figure 1-6 illustrates a balcony failure. This is an extreme result of corrosion over time caused by poor water management. Figure 1-6: Balcony Failure Water made its way to the reinforcing steel resulting in corrosion. Cracks in the concrete allowed water to reach the steel, which corroded, expanded, and hence cracked more, allowing more water penetration. The cycle continued until the loads exceeded the capacity leading to the failure. Proper roof, parapet, and/or balcony overcladding would have protected the reinforced concrete from water penetration. 7
 Build up of moisture that condensed on the window and frame of this door along with lack of corrosion resistant")
22 Corrosion of Window and Door Frames Figure 1-7 illustrates corrosion in the steel window frame of a post-war apartment tower s enclosure entrance. Figure 1-7: Corrosion of Steel Door and Window Frame of Enclosure Entrance (TCHC, 2010) Build up of moisture that condensed on the window and frame of this door along with lack of corrosion resistant materials likely lead to this corrosion. Repair is not usually an option and hence replacement is usually necessary. Better thermal performance of the door and glazing would avoid condensation and the resulting damage. 8

23 Efflorescence and Subflorescence Figure 1-8 illustrates efflorescence often seen on the brick surface of the enclosure of the post-war apartment towers. Figure 1-8: Efflorescence below Windows on Brick Enclosure The white stains below the windows in Figure 1-8 are likely a result of rain water that has not drained off the edge of the window sills but ran along the underside or condensation of indoor air escaping through leaky windows and frames. The concentration of water runs into the wall or down the enclosures surface soaking into the brick. The drying of the brick initiates efflorescence. Efflorescence is caused by salt residue that is dissolved in liquid water carried within the brick towards the exterior surface where the water evaporates leaving the salt behind. Subflorescence is similar except the salts do not reach the surface. The salts build up just below the surface which can result in spalling of the brick because of pressures that build when salt re-crystallization occurs within pores. A closer view of the salts from efflorescence on the brick surface of one of the towers is illustrated in Figure


24 Figure 1-9: Efflorescence on Brick Surface Deteriorating Flashing and Shelf Angle Figure 1-10 illustrates deteriorated flashing and corroded steel shelf angle. Figure 1-10: Deteriorated Flashing and Steel Shelf Angle (CMHC, 2006) 10

25 The deteriorated flashing and corroded steel shelf angle illustrated in Figure 1-10 are a result of poor material choice and inadequate water and vapour control. The vertical load of the brick veneer is no longer taken by the shelf angle and is accumulating on the brick veneer below. This can be detrimental to the structural integrity and it can be especially problematic on these high-rise towers because the greater height has more potential for catastrophic failure. This deterioration can be attributed to a number of reasons. Copper-fabric is sensitive to long-term exposure of moisture and should not have been used as a flashing material. Blocked or an inadequate number of weep holes reduces the ability for this wall to drain. Lack of ventilation holes below the shelf angles reduces the drying potential. Wind and stack effect causing larger pressure differences along with inadequate air barriers result in significant vapour infiltration which condenses on the back side of the brick before running down the brick. Deteriorating Plaster Ceiling Figure 1-11 illustrates a deteriorating plaster ceiling in the bathroom of a post-war apartment tower unit. Figure 1-11: Deteriorating Plaster Ceiling in Bathroom (TCHC, 2010) The deterioration is likely caused by the repeated wetting from the shower s water vapour condensing on the underside of the ceiling. A properly functioning bathroom exhaust fan that is able to remove air and thus the air s water vapour from the bathroom to the exterior will reduce the bathroom s 11

26 interior relative humidity. This will reduce the condensation on the ceiling and thus the problem of premature deterioration of the ceiling plaster. Scouring of Stone Roof Figure 1-12 illustrates wind scouring at the corner of the stone roof of a post-war apartment tower. Figure 1-12: Wind Scouring at Corner of Stone Roof (TCHC, 2010) The significant wind pressures along the edges of the roofs of these high-rise apartments can cause scouring of stones illustrated in Figure 1-12 exposing the fabric beneath increasing the roofs susceptibility to penetration. A repair would replace the stones and a retrofit may provide scouring protection such as a parapet or patio slabs at the perimeter. 12
 The function of window sills and flashings is to encourage water to drain away from the face of the enclosure.")
27 Staining of Brick Figure 1-13 illustrates rainwater stains at the lower corners of the windows on the exterior of a postwar apartment tower. Figure 1-13: Rainwater Stains below Window Corners (TCHC, 2010) The function of window sills and flashings is to encourage water to drain away from the face of the enclosure. The window sills in Figure 1-13 collect water at the corners and drain it along the surface of the enclosure. This results in the dark water marks below the corners of the windows which is unsightly and can cause efflorescence or subflorescence. Saturated brick will allow water to penetrate by gravity pressures at poorly bonded brick head joints. Pressure differences across the enclosure can also draw the water into the enclosure and the building s interior resulting in numerous problems. Installing jamb deflectors on the edge of the window sills directs the collected rainwater away from the enclosure. 13
 The balcony soffit illustrated in Figure 1-14 can have small gaps between it and the brick facade below.")
28 Cracking in Balcony Soffit Figure 1-14 illustrates peeling paint and cracking in the soffit of the protruding concrete balconies typical in post-war apartment towers. Figure 1-14: Peeling Paint and Cracking in Balcony Soffit (TCHC, 2010) The balcony soffit illustrated in Figure 1-14 can have small gaps between it and the brick facade below. These gaps allow the movement of warm moist interior air to exfiltrate which can then condense on the cooler balcony soffit. The shaded underside of the balcony can stay wet for long periods of time resulting in peeled paint and cracking. A second cause of soffit deterioration is rainwater that runs down the edge of the balcony. It can move along the soffit due to water s surface tension resulting in peeling paint and cracking. This balcony soffit has a keyed edge which breaks the movement of water along the soffit reducing the second cause of soffit wetting. 14
 A common problem in the towers is deteriorating plumbing risers illustrated in Figure 1-15 which leak into the adjacent units.")
29 Deteriorating Plumbing Riser Figure 1-15 illustrates a deteriorating plumbing riser in one of these towers. Figure 1-15: Deteriorating Plumbing Riser (TCHC, 2010) A common problem in the towers is deteriorating plumbing risers illustrated in Figure 1-15 which leak into the adjacent units. Replacing the plumbing risers is a significant renovation and thus any retrofit options should be considered carefully. The Tower Renewal Guidelines (2009) is a publication that introduces the opportunity of retrofitting post-war apartment towers and their sites in the Greater Toronto Area. It was created by Ted Kesik and Ivan Saleff of Daniels Faculty of Architecture, Landscape, and Design from the University of Toronto with support from the City of Toronto, the Toronto Atmospheric Fund, and Canada Mortgage and Housing Corporation. This document provides a history of the towers, condition assessment, site strategies, retrofit strategies, and cost-benefit analysis. The condition assessment in the Tower Renewal Guidelines (2009) also describes some of the observed signs of deterioration; the performance problems were noted during field observations. Buildings that had a glazed exterior finish had the glazing pushed off and efflorescence occurring. Failed sealant between the masonry veneer and concrete frame was also a common observation. 15

30 Freeze-Thaw The most significant brick deterioration was found under the window sills and at the slab edges. Inadequate or missing flashings and air leakage can result in a buildup of moisture at these locations. The buildup of moisture is likely to exceed the critical degree of saturation resulting in freeze-thaw spalling as well as deterioration of the mortar joint. Although water within the pores of the masonry expands by 9% during its phase change, the mechanism of freeze-thaw is believed to initiate by the moisture within the solid matrix. Freeze-thaw within the solid matrix of a material is not fully understood, a few of the theories include closed container, ice lensing, hydraulic pressure, and disequilibrium discussed in Mensinga (2009). The moisture content level at which damage is significant in a specific brick or concrete block is known as the critical degree of saturation. An example of freeze-thaw deterioration is illustrated in Figure Figure 1-16: Freeze-Thaw Deterioration Figure 1-16 illustrates that freeze-thaw can deteriorate the face of the brick completely off. It can cause large vertical cracks which could lead to sections of brick falling off the sides of buildings, which is a life safety concern. 16

31 Deterioration at Grade Another common observation was the deterioration of the concrete and brick where it meets the grade. Where drainage around the building perimeter is not adequate and brick is near the grade, the buildup of snow and rain water can stain the brick, illustrated in Figure Figure 1-17: Brick Staining at Grade These signs of constant wetting can result in brick deterioration. Brick in contact with the grade can wick water up which can also result in freeze-thaw spalling and efflorescence. Overall, the concrete frame is structurally adequate in most of these towers apart from the protruding balcony slabs. The non-load bearing masonry veneer is deteriorating much faster. The necessity to repair the masonry veneer provides the opportunity to improve the enclosure and the building as a whole. Retrofitting the enclosure can include the addition of air, vapour, water, and thermal control layers, discussed in Section 5.1, to improve durability and comfort while reducing energy use. The energy used in Canadian apartments is discussed in the following Section Canada s Energy Use Figure 1-18 illustrates energy use in Canada by sector for
 used approximately the same proportion as buildings with 38")

32 Figure 1-18: Canadian Energy Use in 2005 by Sector (NRCan, 2008) According to government studies (NRCan, 2008), buildings consumed approximately one third of Canada s energy in The other two sectors (industrial and transportation) used approximately the same proportion as buildings with 38% and 30% respectively Canada s Residential Space Heating Trends A majority of the 31% of energy that buildings consume is for residential buildings. Seventeen percent of all the energy Canada uses goes into its residences. The end-use of Canada s residential energy is illustrated in Figure Figure 1-19: Canadian Residential Energy End-Use Percentages in 2005 (NRCan, 2008) Figure 1-19 illustrates that by far the most significant percentage (60%) goes into heating Canadian residences which means that more than 10% of all of Canada s energy goes directly towards heating its residential buildings. This indicates that a significant percentage of Canada s energy conservation focus should be directed towards heat loss in residential buildings. Figure 1-20 illustrates the slow decline in energy used to heat residential spaces over the past 20 years for three types of residences. 18
33 Figure 1-20: Canadian Residential Space Heating Trends Figure 1-20 illustrates that the average Canadian single detached residence uses a significant amount more energy for space heating than a single attached or apartment residence. However, single family space heating use is decreasing by approximately 2.9kWh/m 2 every year while the average apartment is only decreasing by approximately 1.6kWh/m 2 every year, almost half the rate. This is disconcerting because the ratio of enclosure area to floor area for a single detached residence is approximately 4 times that of the average apartment. Even though this trend will not necessarily continue it does illustrate the opportunity to significantly reduce the space heating energy used by apartments if their enclosures were built to the same standards as single family homes. Reducing the energy consumption of apartments in Canada contributes to the reduction in Canada s greenhouse gas emissions. The greenhouse gas emitted in Canada and its impact on global warming are discussed in the following section Canada s Impact on Global Warming The concentration of CO 2 in the atmosphere has increased significantly over the last couple centuries. Figure 1-21 illustrates this rapid increase. 19
34 Figure 1-21: Atmosphere CO 2 Concentrations over the Last 1000 Years (MacKay, 2009) David MacKay singled out the year 1769 because that was the year that James Watt patented his steam engine which was more efficient than the first practical steam engine invented 70 years prior. The burning of fossil fuels emits CO 2 and from this graph appears to have significantly increased the concentration of CO 2 over the past couple hundred years. According to the Intergovernmental Panel on Climate Change (IPCC, 2007) the increase in greenhouse gases from human activity has begun to significantly change the climate. Three indications of climate change are illustrated in Figure

35 Figure 1-22: Change in Temperature, Sea Level, and Northern Hemisphere Snow Cover (IPCC, 2007) Figure 1-22 illustrates an increase in the global average surface temperature and sea level and a decrease in the northern hemisphere snow cover. These indications of global warming over the past century align with the increase in CO 2 concentrations over the past couple centuries, previously illustrated in Figure The intent of this section isn t to debate global warming but to show that the burning of fossil fuels used for energy consumed by existing buildings connects to it. David MacKay breaks down the greenhouse gas pollution by average person in each country illustrated in Figure

36 Figure 1-23: Greenhouse Gas Pollution per Average Person of Each Country (MacKay, 2009) Figure 1-23 illustrates the relative greenhouse gas emissions Canadians emit compared to the rest of the world. United Arab Emirates, Kuwait, Australia, and the United States of America are the only countries who emit more greenhouse gases on a per person basis. The average person in the world only emits approximately 5½ equivalent tons of CO 2 per year, approximately one quarter of the average Canadian. Since greenhouse gas pollution is primarily related to Canada s energy production, it makes not only financial sense to reduce energy use but provides an opportunity to reduce the global warming potential The Need for Retrofit Wikipedia (2011) defines retrofit projects as, to replace or add equipment to existing power plants to improve their energy efficiency, increase their output and extend their lifespan, while decreasing 22
37 emissions. Thus, a building enclosure retrofit could be described as the replacement or addition of enclosure materials to the existing building to improve its energy efficiency, increase the occupants living conditions and extend the building s service life while decreasing its environment impact. The need to retrofit the numerous concrete framed high-rise apartment towers in the Greater Toronto Area (GTA) built during the post-war boom ( ) has been identified in many published documents including the Mayor s Tower Renewal- Opportunities Book (2008). The Mayor s Tower Renewal was initiated by former Toronto Mayor David Miller to promote the opportunity to retrofit over 1000 towers and their sites in the city of Toronto. Tower Renewal Guideline- for the Comprehensive Retrofit of Multi-Unit Residential Buildings in Cold Climates (2009) was developed by Ted Kesik and Ivan Saleff of the University of Toronto to provide overall guidance retrofitting the towers and their sites. Tower Renewal has grown to include cities such as St. Catherines, Brantford, Kitchener, Waterloo, Barrie, and Peterborough as described in the report Tower Neighbourhood Renewal in the Greater Golden Horseshoe (2010). This entire tower renewal area is referred to as the Greater Golden Horseshoe (GGH). This report states that there are almost 2000 high-rise (greater than 7 stories) apartment towers in the GGH. 1.2 Objective The goal of the research reported in this thesis is to provide policy makers, code officials, architects, and building engineers insight on the effects of various wall enclosure retrofit options for post-war high-rise apartment towers in the context of total building energy use. The three primary effects of the enclosure retrofit options are: (1) the impacts on durability, (2) improved occupant comfort, and (3) the reduction in building energy use and greenhouse gas emissions. Properly designed and executed enclosure retrofits should extend the economic and useful life of this significant building stock. 1.3 Scope The scope of this thesis is limited to a general investigation of the effects of wall enclosure retrofits. The effects investigated include the impacts on: Durability to rain and moisture penetration, condensation potential, and deterioration due to freeze-thaw cracking. Occupant comfort based on mean radiant temperature and passive control Annual energy consumption and greenhouse gas emissions 23
38 A general overall interior versus exterior enclosure retrofit comparison is included. The costs of these retrofits will not be discussed in any detail because costs are highly variable and difficult to ascertain. 1.4 Approach The thesis begins by describing high-rise apartment towers built during the post-war boom and developing an Archetype building. Energy and air flows through the existing enclosure components are modeled. The miscellaneous electrical loads (MEL) and ventilation conditioning energy are approximated for these towers. The MEL, ventilation, enclosure s thermal resistances, and natural air leakage are incorporated into an open source whole building energy and loads analysis model. The restructured model analyzes the towers existing loads and compares the values to reported measured energy data of existing post-war high-rise apartment towers. Various enclosure retrofit options are described and their heat transfer characteristics and geometries are simulated. The impacts on durability and comfort are discussed based on the results. Energy efficiency measures are described and analyzed to complement the enclosure retrofits. Retrofit packages are created and simulated in the restructured building energy and loads analysis model. The results are compared to illustrate potential overall building retrofit annual energy reductions. Finally, the reduction in greenhouse gas emissions is briefly discussed. 24

39 Chapter 2 Towers This chapter describes the history and construction technology of the buildings being studied. Ranges of statistics are used to describe these towers. 2.1 History of the Towers During the 1960s, the demographic bulge known as the baby boomers began to enter the real estate market. Inevitably, there was an increase in demand for residences. Developers, architects, engineers, and contractors began to produce many new, quickly built, and attractive residential units in the form of high-rise apartment towers. These residential apartment towers were commonly situated in parklike settings. The idea of clusters of towers separated by large expanses of green space arguably came from Le Corbusier. His 1922 diagram of Ville Contemporaine was a scheme for a large metropolis. A drawing of the view into the Ville Contemporaine is illustrated in Figure 2-1. Figure 2-1: Le Corbusier's Ville Contemporaine (Blake, P., 1976) Peter Blake (1976) describes the scheme illustrated in Figure 2-1, The center of Corbu s (Le Corbusier s) Ville Contemporaine was to be a group of skyscrapers, cruciform in plan, fifty or sixty stories in height, and spaced very far apart to permit the development of generous park spaces between them. The post World War II cluster of apartment towers has this similar scheme and was often referred as tower-in-the-park. The construction of these apartment tower clusters significantly increased the residential housing stock. Figure 2-2 illustrates the significant rise in multi-unit residential building (MURB) construction throughout the 1960 s and 1970 s. 25
 Figure 2-2 illustrates that in 1968 nearly 30,000 residential units were built, which can be compared to the 16,000 condominium units built in 2005 in the then much more populous GTA (Kesik,")
 For most towers the construction of a site-cast reinforced concrete frame was followed by the brick and block exterior walls constructed on top of the outer perimeter of the concrete floor")
40 Figure 2-2: Post-War Rise in MURB Construction (Kesik, T. And Saleff, I., 2009) Figure 2-2 illustrates that in 1968 nearly 30,000 residential units were built, which can be compared to the 16,000 condominium units built in 2005 in the then much more populous GTA (Kesik, T. and Saleff, I., 2009) Apartment Tower Construction Figure 2-3 illustrates a common sight throughout the GTA during the 1960 s. Figure 2-3: Tower Construction (Kesik, T. And Saleff, I., 2009) For most towers the construction of a site-cast reinforced concrete frame was followed by the brick and block exterior walls constructed on top of the outer perimeter of the concrete floor slabs. In the early 1960 s, apartment buildings used a hybrid structural system of steel and reinforced concrete. Balconies were not common and single-glazed, steel frame windows were used. During the mid s the implementation of flying forms (see the following figure) shifted the reinforced concrete 26

41 frame to the dominant type for both mid-rise and high-rise MURBs. At this time, balconies became much more common. Additional Portland cement was added to the concrete mix so that the strength at which formwork could be removed was reached sooner. The use of flying forms and increased cement content caused the average MURB to go from a range of 6 to 8 storeys to towers ranging from 20 to 30 storeys. Another reason for the increase in these towers was the economical decision to simplify the floor plans and use symmetry. The dimensions were standardized to correspond with Canadian lumber and plywood sizes to minimize cutting and waste. Figure 2-4: Flying Formwork in Action Figure 2-4 illustrates a flying form being flown from under a newly cast concrete floor slab. This technology allowed the concrete forms to be reused and easily moved between levels making the construction of concrete framed residential towers more efficient Planned Communities Figure 2-5 illustrates a cluster of apartment towers in the City of Toronto. 27

42 Figure 2-5: Post-War MURBs in the GTA (Kesik, T. And Saleff, I., 2009) Figure 2-5 illustrates several of these towers designed around a planned community. These communities provided another option to suburban single family houses sprawling outward. Many included industry, shopping, mixed-housing types, schools, and plenty of green space. The figure also illustrates the similarity in building size and geometry. 2.2 Population of Towers The report, Tower Neighbourhood Renewal in the Greater Golden Horseshoe (2010) describes the quantity, location, and significance of these towers in the Greater Golden Horseshoe (GGH). Nearly 2000 high-rise (greater than 7 storeys) apartment towers were built in the GGH during the post-war boom. (Stewart, G. and Thorne, J., 2010) These towers house approximately 1,000,000 people in the GGH. Figure 2-6 illustrates the percentage of GGH housing stock. 28
 Figure 2-6 illustrates the approximately 380,000 high-rise apartment tower units representing 13% of the nearly 3,000,000 GGH housing units.")
43 Figure 2-6: Percentage of Apartment Towers in Greater Golden Horseshoe (Stewart, G. and Thorne, J., 2010) Figure 2-6 illustrates the approximately 380,000 high-rise apartment tower units representing 13% of the nearly 3,000,000 GGH housing units. Statistics Canada considers high-rise as greater than four stories which represent approximately 500,000 high-rise apartment tower units or 17%. Based on Statistics Canada s high-rise criteria, there are more than 3000 high-rise apartment towers in the GGH. The number of high-rise MURBs built during the post World War II boom is significantly larger than any other period in the history of the GTA. The following figure illustrates the GTA s high-rise MURB construction over the last seven decades. 29
 apartment towers were constructed during the 1960s.")
44 Number of GTA High-Rise Buildings Apartments Condos Date of Construction Figure 2-7: GTA High-Rise MURBs Constructed between 1946 and 2007 Figure 2-7 illustrates that over 600 GTA high-rise (defined as greater than 4 stories) apartment towers were constructed during the 1960s. The combination of high-rise apartment towers and condominium towers built during the 1970s is approximately 350 while no other decade exceeds a total of 300 towers. 2.3 Location of Towers Table 2-1 from the Tower Neighbourhood Renewal in the Greater Golden Horseshoe (Stewart, G. and Thorne, J., 2010) illustrates the number of apartment towers from Toronto to the outer ring of the GGH. Table 2-1: Apartment Tower Location and Stock in GGH Table 2-1 illustrates that a majority, approximately two-thirds, of the apartment towers are located in the City of Toronto. Appendix A illustrates a map of the GGH with each county, region, and major city separately labeled with their respective number of towers, tower units, and tower site area. 30
45 2.4 Archetype In this thesis the term Archetype will be subsequently used as a general description of the nearly 2000 concrete framed high-rise (greater than 7 storeys) apartment towers in the GGH. Using this single theoretical building has the advantage that it encompasses the common characteristics of the 2000 towers. Using this Archetype simplifies the analysis and takes advantage of average values for the towers characteristics. Construction drawings for four different high-rise apartment towers owned and operated by the Toronto Community Housing Corporation (TCHC) were used for most of the geometrical characterizing. The four buildings are defined here as buildings one through four. These buildings were constructed in the GTA in 1967, 1968, 1962, and 1968, respectively. The drawings used for analysis include plans, elevations, sections, exterior wall section details, domestic hot water schematics, ventilation schematics, exhaust fan schedules, supply unit schedules, and pump schedules. Selected drawings are included in Appendix B for buildings 1, 2, 3, and 4 (TCHC, 2010). Buildings 3 and 4 are actually two identical towers connected to form V and Z shaped configurations, respectively. The Archetype was intended to describe a single, rectangular tower, so only the characteristics of one side of buildings 3 and 4 were considered. The common characteristics that describe the Archetype are the towers dimensions, number and size of the different unit types, floor area composition, wall types and dimensions, wall composition, roof composition, perimeter composition of the various wall types, window to wall ratio, air leakage parameters, and ventilation system. Some of the common characteristics include a reinforced concrete frame, exposed slab edges, protruding concrete balconies, aluminum window frames, double glazing, brick and block walls, minimal interior insulation, symmetrical rectangular layouts, smaller window to wall ratios, leakier enclosures, and dysfunctional ventilation systems. All these characteristics used to define the Archetype will be described in detail below Archetype Dimensions The construction drawings of the four different apartment towers were reviewed and each building s dimensions were summarized and averaged in Table
46 Table 2-2: Buildings Dimensions The four different apartments range from 12 to 29 stories with an average of 19 stories. The Archetype will be assumed to be 20 stories. The average width is 15m and average length is 66m. Since buildings 1 and 2 stand alone and have greater lengths, an average length of 70m for the stand alone Archetype will be used. The floor to floor height is consistently 2.64m (8-8 ) which will be used for the Archetype. The average floor area ranges from approximately 11,000m 2 to 28,000m 2 with an average of 20,000m 2 (210,000ft 2 ). These values include all rooms and corridors within the building enclosure. All buildings have the same basic cross section; a single corridor flanked on both sides by apartment units Units in Archetype Table 2-3 illustrates the quantity of each type of apartment unit in the four TCHC buildings examined. The averages were calculated and used to determine the scheme of apartment types in the Archetype. Stories Tower Width Tower Length Floor Area per Storey # m ft m ft m ft m 2 Sq ft m 2 Sq ft m ft Building ,111 11,956 23, , Building ,329 14,300 15, , Building ,695 10, , Building ,241 27, , Average ,026 11,048 19, , Stories Floor to Floor Height Table 2-3: Number of Units in Buildings Bachelor Units One Bedroom Units Two Bedroom Units Three Bedroom Units Total Floor Area Total Units Typical Units per Storey # # # # # # # Building Building Building Building Average Perimeter 32
47 The most common unit has two bedrooms with the majority of the other units having one bedroom. Since Buildings 1 and 2 are longer, they have more units per storey, the units in the Archetype will be based on 14 units per storey for the typical floors 2 through 20. The first floor of the towers is different because it contains the lobby and often other building amenities. The first floor configuration also varies considerably. The configuration of units for the Archetype will be the same for all floors and will contain 8 two bedroom units, 4 one bedroom units, and 2 bachelor units. Three bedroom units are uncommon, so they will not be considered in the Archetype Archetype Unit Size Table 2-4 illustrates the size of each type of apartment unit on the typical floors in the four TCHC buildings examined. A weighted average was calculated and used to determine the sizes used for each type of apartment in the Archetype. Table 2-4: Buildings Unit Sizes Bachelor Unit One Bedroom Unit Two Bedroom Unit Three Bedroom Unit ft 2 m 2 ft 2 m 2 ft 2 m 2 ft 2 m 2 Building Building Building Building Weighted Average The areas illustrated in Table 2-4 are the average finished floor and partition wall areas for each type of apartment unit. The weighted average was based on the number of each type for each building. The average size of the bachelor and one bedroom units do not vary significantly between buildings. The Archetype will use 34m 2 (366ft 2 ) and 52m 2 (560ft 2 ) for the bachelor and one bedroom units, respectively. The average size of the two bedroom units in Building 2 are significantly larger than in the other buildings so the Archetype will use a 70m 2 (753ft 2 ) two bedroom unit Archetype Typical Floor Area Composition Table 2-5 illustrates the percentages of areas including units, corridor, stairwell, elevator, garbage chute, electrical room, ventilation shaft, and all walls on the typical floors in the four TCHC buildings 33
48 examined. The average percentage of total floor area was calculated for each type of area to determine the relative sizes of each in the Archetype. Table 2-5: Typical Floor Area Percentages Units Corridor Stairwell Elevator Other Walls Building 1 81% 8% 1.7% 1.4% 0.3% 8% Building 2 82% 7% 1.6% 0.7% 0.4% 8% Building 3 74% 10% 2.0% 1.3% 0.7% 16% Building 4 77% 9% 1.4% 1.8% 0.7% 10% Average 79% 9% 1.7% 1.3% 0.6% 10% The other areas are comprised of the garbage chutes, electrical rooms, and ventilation shafts. The percentage of each area is relatively consistent for all four buildings. The percentage of building area designated for the units in the Archetype will be 80% before they are sub-divided into the different types of units. 10% of the Archetype s building area will be designated as common space and will include the corridors, stairwells, elevators, garbage chutes, and electrical rooms. 10% of the Archetype s building area will be designated as walls, both interior and exterior Archetype Perimeter Composition and Window to Wall Ratio The lengths of each of the five previously defined exterior wall types were measured along the perimeter of each of the buildings and the percentage of each relative to the entire perimeter were calculated and provided in the following table. The window to wall ratios (WWR) were also calculated and provided in Table 2-6. Table 2-6: Building Perimeter Compositions and Window to Wall Ratios Wall Window/Wall Balcony Wall Balcony Window Balcony Door WWR Building 1 33% 16% 17% 25% 8% 31% Building 2 19% 14% 6% 51% 9% 45% Building 3 58% 23% 6% 0% 12% 23% Building 4 39% 17% 15% 22% 7% 28% Average 37% 18% 11% 25% 9% 32% Buildings 1 and 4 were very close in percentages and also have the composition of exterior walls commonly seen in most of the towers. Weighting these percentages slightly higher, the Archetype perimeter composition is approximately 35% wall, 25% balcony window, 15% window wall, 15% balcony wall, and 10% balcony door. The window to wall ratios ranged from 23% to 45% for these 34
49 four buildings. The WWR of 45% for building 2 is atypically high, thus a WWR slightly lower than the 32% average will be used for the Archetype. For simplicity, 30% will be used for the Archetype Archetype Wall Types The opaque wall section of the four buildings consists from interior to exterior of the following: Gypsum board or plaster One or two inches of EPS insulation or a radiant barrier on airspace Sometimes parging or vapour barrier Four inch concrete block or backup brick Four inch brick facing with no drainage gap The most common characteristics were used to define the Archetype. The Archetype enclosure can be divided into five different wall sections: two exterior wall sections and three balcony wall sections. All five wall sections are illustrated below. 35
50 Figure 2-8: Wall Section Figure 2-8 illustrates the Archetype wall section. It has exposed concrete slab edges with the typical opaque wall section constructed on a 76mm (3 ) concrete curb on the edge of the concrete slab. The concrete curb and 19mm (¾ ) thick parquet flooring is the same in all wall sections. 36
51 Figure 2-9: Window Wall Section Figure 2-9 illustrates the Archetype window wall section. It has a 1.53m (5 ) double-glazed window with an aluminum frame. The window header is 254mm (10 ) of opaque wall. The interior window sill has a terrazzo stool. There is 610mm (2 ) of wall below the punched window. 37
52 Figure 2-10: Balcony Wall Section Figure 2-10 illustrates the Archetype balcony wall section. The depths of the balconies vary from approximately 1.12m (3-8 ) to over 1.83m (6 ) with 1.53m (5 ) being the most common. The protruding concrete slabs are usually tapered on top to drain rainwater away from the enclosure and tapered on the bottom since a thick section is not structurally required towards the end of the slab. 38
53 Figure 2-11: Balcony Window Wall Section Figure 2-11 illustrates the Archetype balcony window wall section. It has the same characteristics as the punched window wall section with the addition of the 1.53m (5 ) cantilevered concrete balcony. 39
54 Figure 2-12: Balcony Door Section Figure 2-12 illustrates the Archetype balcony door section. It has a 2.13m (7 ) double glazed, aluminum framed balcony door. Since the towers balcony doors are either sliding or hinged, the Archetype will generalize door as one component and the difference in door width between the sliding and hinged will be accounted for in the perimeter composition. The door has the same header as the window; 254mm (10 ) Archetype Enclosure Composition The enclosure of the Archetype was separated into opaque wall, windows, and roof. The opaque wall and window were analyzed and combined in Section 3.1 using the five wall types previously described. 40
55 Opaque Wall Composition The thicknesses and composition of the wall sections for all wall types are identical. They consist of 102mm (4 ) of brick, 102mm (4 ) of concrete block, 25mm (1 ) of extruded polystyrene (EPS) insulation, and 16mm (5/8 ) of gypsum plaster lath. The thicknesses and thermal conductivities for each of these materials are provided in Table 2-7. Table 2-7: Existing Opaque Wall Material Characteristics Thickness Conductivity Material (inches) (mm) (W/mk) Gypsum Plaster Lath 5/ EPS Insulation Marble 3/ Concrete Block Dry Brick Wet Brick 0.87 Dry Reinforced Concrete 6 ½ Wet Reinforced Concrete 2.0 Parquet Flooring 3/ The thermal conductivity values were calculated as averages from WUFI 4.1, Therm 5.2, and The Engineering Tool Box (2010). According to Suleiman (2006), soft brick s thermal conductivity increases by 65% when saturated with water. Based on this research, a wet brick thermal conductivity of 0.87 W/m k was calculated. The window stool is typically terrazzo which is pieces of marble molded into one piece. The thermal conductivity of marble is 1.75 W/m k (Elert G., 2010) and was used for the terrazzo Archetype Windows The Archetype s existing windows are double glazed with aluminum frames with no thermal break. The glazing was assumed to be 3.2 mm thick, and the window is operable. The thermal characteristics of the window for the centre of glass, edge of glass, and frame are illustrated in Table
56 Type Double Glazed Table 2-8: Existing Window Thermal Characteristics Area U-Value (w/ films) U-Value (w/o films) R-Value (w/o films) (W/m 2 k) (W/m 2 k) (hr ft 2 F/btu) Centre of Glass Edge of Glass Frame The thermal conductivity values in Table 2-8 were taken from Chapter 15 of the ASHRAE Handbook of Fundamentals (2009). These values include film resistances based on the winter conditions with an outdoor air temperature of -18 C, with 6.7 m/s outdoor air velocity and zero solar flux. Thermal conductivities without films were calculated by subtracting an assumed interior film resistance of 8.3 W/m 2 k and exterior film resistance of 29 W/m 2 k. Edge of glass effects are assumed to extend over the 63.5 mm band around the perimeter of each glazing unit Archetype Roof Composition The roof of the towers is commonly a built up roof illustrated in Table 3-7. Figure 2-13: Archetype Roof Section The built up roof is constructed from inside to outside of a 165mm (6 ½ ) concrete slab, vapour retarder, 51mm (2 ) of EPS insulation, four ply felt, and gravel. The insulation levels in the roofs vary from 38mm (1½ ) to 79mm (3 1/8 ) of insulation, 51mm (2 ) will be used for the Archetype Archetype s Mechanical System and Equipment The mechanical systems and equipment for the four buildings will be examined and defined for the Archetype based on the average data. The mechanical systems and equipment include the cold water and domestic hot water, the heating, and the ventilation. 42

57 Cold Water and Domestic Hot Water Systems All four buildings have a similar cold water (CW) and domestic hot water (DHW) system. The basic flow chart of the CW and DHW system is illustrated in Figure The basic system flow chart does not include standby pumps, valves, pressure gauges, temperature gauges, bypass lines, and pressure relief valves. Figure 2-14: Cold Water and Domestic Hot Water Basic System Layout Figure 2-14 illustrates that the building s water inlet separates and is used for fire suppression, cold water and hot water for the lower levels, mid-levels, and upper levels of the buildings. The cold water and hot water lines are illustrated in blue and red, respectively. The main pumps which require energy are the primary recirculation, CW booster, DHW booster, lower level DHW recirculation, and midlevel recirculation pumps, illustrated in green. The DHW heating units are the boiler and reheat for the lower levels, mid-levels, and upper levels, illustrated in red. 43
58 Domestic Hot Water Equipment The equipment used for the DHW system is illustrated in Table 2-9. Table 2-9: Domestic Hot Water Equipment Boiler CW Booster Pump DHW Booster Pump Primary Recirculation Pump Type Power Flow Pressure Power Flow Pressure Power Flow Pressure Power (kw) (l/s) (kpa) (kw) (l/s) (kpa) (kw) (l/s) (kpa) (kw) Building 1 Electric Building 2 Gas 373 Building 3 Oil Building 4 Electric Table 2-9 illustrates the capacity specifications for the boiler, CW booster pump, DHW booster pump, and primary recirculation pump for each building. The missing data is due to the unreadable, older drawings Heating System The two common forms of heating in the towers are electric baseboard heaters and hydronic convection units. Buildings one and four use electric baseboard heaters along the perimeter. Using electric baseboard heaters is a simple heating approach and will be modeled by the Archetype as one of two heating options. The second heating option the Archetype will model is hydronic convection heating. Buildings two and three use a hydronic convection heating system. They require boilers to heat water along with pumps and piping to distribute the hot water to every convection unit. Buildings two and three use the same general hydronic flow illustrated in Figure
59 Figure 2-15: Hydronic Heating Flow Chart Figure 2-15 illustrates the cycling of water which transfers the heat added from the boiler to the convection units. The three convection units represent the many convection units throughout the building Hydronic Heating Equipment The specifications for the hydronic heating equipment in Buildings one and two are illustrated in Table Table 2-10: Hydronic Heating Equipment Specifications Boiler Hydronic Circulation Pump Type Output (kw) Output (W/m 2 ) Flow Capacity (l/s) Head (m) Power (kw) Building 2 Gas Building 3 Gas Average Gas Table 2-10 illustrates that gas boilers are common for hydronic heating. Buildings two and three have a smaller floor area than the Archetype so the boiler outputs were converted to intensity in W/m 2. 45
60 Using the Archetype s floor area of 21,000m 2 and the average boiler output intensity of 15W/m 2 results in a boiler output of 315kW. The Archetype will use an 11 C (20 F) temperature drop and a design heating head of 16m for calculating the hydronic pump demand Archetype`s Mechanical Ventilation Equipment The ventilation exhaust and supply fans specifications for all four buildings are illustrated in Table Table 2-11 Mechanical Ventilation Specifications Exhaust Fan Capacities Supply Fan Capacities l/s kw W/l/s l/s kw W/l/s Building Building Building Building Average Table 2-11 illustrates the exhaust fan flow capacity which is the combination of washroom and/or kitchen exhaust fans, electrical room exhaust fans, garbage room exhaust fans, and/or janitors room exhaust fans. The supply fan flow rate capacities are approximately balanced with the exhaust fan capacities for buildings one and three. Building four s supply capacity is slightly less than the exhaust capacity and building two s supply capacity is approximately one-third the exhaust capacity. The occupants control the exhaust fans on a suite by suite basis and the building owner controls the supply. The occupant controlled exhaust fans run intermittently usually during the use of the shower, toilet, and stove. The building owners usually operate the supply fan continuously or shut it off only during the night, say from 11pm to 5am. Since the exhaust fans operate significantly less than the supply fans and the capacities are similar, theoretically the building is pressurized. This is not always the case because of the addition of stack effect, wind effect, and numerous uncontrolled air leakage paths resulting to a more complex air flow system discussed in Section 3.2. The exhaust fans power in Table 2-11 was summed and divided by the total exhaust capacity resulting in average energy consumption per ventilation flow rate. The same approach was used with the supply fans. The average values are 0.75 W/l/s and 1.03 W/l/s for exhaust and supply fans, respectively. The Archetype will use 0.75 W/l/s for the exhaust fans, but a slightly higher value of 46
61 1.25 W/l/s for the supply fans in order to discount the unusually low energy consumption rate of building two. The mechanical ventilation rates for all four buildings are illustrated in the Table Table 2-12: Mechanical Design Ventilation Rates Supply Capacity Maximum Occupancy Design Ventilation Rate l/s # of people l/s per person cfm per person Building Building Building Building Average Table 2-12 illustrates the maximum occupancy which does not include vacancies and uses these values to calculate the design ventilation rate. The design ventilation rate is based on the supply capacity from the make-up air unit. The four buildings are designed to provide a significant range of ventilation rates with an average of 18 l/s (38 cfm) per person. The Archetype will use a slightly lower value of 15 l/s per person since building three has an unusually large rate. ASHRAE Standard 62.1 (2007) recommends an average minimum ventilation rate of 14 l/s (29 cfm) per person for the four buildings using Equation 1 and dividing it by the maximum occupancy. Where V bz = Breathing zone outdoor air flow (l/s) R p = Outdoor airflow rate required per person (l/s per person) P z = Zone population (# of people) R a = Outdoor airflow rate required per unit area (l/s per m 2 ) A z = Zone floor area (m 2 ) The breathing zone outdoor air flow is calculated for each zone; bachelor unit, one bedroom unit, two bedroom unit, three bedroom unit, and common areas and then combined. The outdoor airflow rate required per person and per unit area for a residential dwelling unit are 2.5 l/s and 0.3 l/s/m 2. Recommendations at the time were actually lower than the current ASHRAE standard and well lower than the four buildings considered. McGuinness, W. and Stein, B. (1971) recommend an apartment ventilation rate of 12 l/s (25 cfm) per person and a minimum ventilation rate of 6 l/s (13 cfm) per person based on the maximum occupancy numbers for the average of the four buildings. (1) 47
62 2.4.9 Summary of Archetype The characteristics of the Archetype apartment building are presented in Table 2-13 based on the analysis of the four buildings in the previous sections. Table 2-13: Archetype Characteristic Summary Stories 20 Width 15 m Length 70 m Floor to floor height 2.64 m Units per storey 14 Two bedroom units per storey 8 One bedroom units per storey 4 Bachelor units per storey 2 Two bedroom finished floor area 70 m 2 One bedroom finished floor area 52 m 2 Bachelor finished floor area 34 m 2 Wall percentage of building perimeter 35% Balcony window percentage of building perimeter 25% Window wall percentage of building perimeter 15% Balcony wall percentage of building perimeter 15% Balcony door percentage of building perimeter 10% Window to wall ratio 30% Hydronic convection heating unit temperature drop 11 C Hydronic heating pump head 16 m Ventilation Capacity 15 l/s/person Exhaust fan power rate 0.75 W/l/s Supply fan power rate 1.25 W/l/s The building dimensions presented in Table 2-13 are also illustrated in Figure 2-16 and Figure 2-17 along with other dimensions used for the Archetype to achieve the required building perimeter percentages and window to wall ratio. 48


63 Figure 2-16: Archetype Rendering Figure 2-17: Archetype Rendering Close up 49
64 The opaque wall section used in the Archetype is illustrated in Figure Figure 2-18: Archetype's Opaque Wall Section The opaque wall section used in the Archetype consists from interior to exterior: 16mm (5/8 ) Gypsum Plaster 25mm (1 ) EPS Insulation 102mm (4 ) Concrete Block 102mm (4 ) Brick (without an air gap) 50
65 Chapter 3 Hygrothermal and Air Leakage Analysis of Towers Chapter 3 analyzes the heat, air, and moisture on or through the towers enclosure in order to effectively simulate existing annual energy consumption of towers. Analysis was also completed to identify the existing enclosure conditions of the towers in order to have basis for applying enclosure retrofits and identifying the impacts. The heat transfer across the enclosure was analyzed using the Archetype s wall sections in a twodimensional, steady-state heat transfer analysis program. The heat transfer analysis was used to calculate effective thermal resistance values for the Archetype. The heat transfer analysis was also used to calculate interior surface temperatures used for determining condensation potential. The towers air leakage was also analyzed. Wind pressures, stack effect, and mechanical ventilation effects on the towers were discussed. The air leakage characteristics of the towers are analyzed and a value for the Archetype was estimated for modeling the Archetype s air leakage. Three infiltration models were analyzed in order to choose an appropriate model for BELA MURB High-Rise Edition. 3.1 Heat Transfer Analysis A significant concern with the towers is the thermal bridging of the concrete floor slabs exposed to the exterior and the protruding concrete floor slabs used for balconies which are very common in the towers. In buildings, thermal bridging occurs where a more conductive material passes through the less conductive materials in an enclosures assembly. Thermal bridging in the towers is evident in the following infrared thermographic images illustrated in Figure 3-2, Figure 3-2, and Figure 3-3. These images were taken during the winter. They illustrate the location and degree of heat loss. 51

66 Figure 3-1: Thermographic Image of Protruding Balcony Slabs Figure 3-1 illustrates a tower with continuous protruding balconies around its perimeter. The warmest surface is indicated in red where the underside of the concrete balcony slab meets the top of the exterior wall surface. Heat loss is significant at this location and gradually decreases towards the outer edge of the balcony. 52
 The orange lines in Figure 3-2 run along the exterior edges of the penetrating concrete floor slabs in this 1960s apartment building.")

67 Figure 3-2: Thermographic Image of Penetrating Floor Slabs (Kesik, T. And Saleff, I., 2009) The orange lines in Figure 3-2 run along the exterior edges of the penetrating concrete floor slabs in this 1960s apartment building. This surface colouring indicates an exterior surface temperature of approximately -4 C while the outdoor temperature is approximately -12 C. This large temperature difference demonstrates a significant amount of heat loss. Figure 3-3 also illustrates the heat loss through the enclosure. Figure 3-3: Thermographic Image of Windows and Walls Behind Baseboard Heaters (Kesik, T. And Saleff, I., 2009) 53

68 The rectangular yellowish white colouring indicates an exterior surface temperature of approximately 7 C when the air temperature is approximately 0 C. These areas of significant heat loss are behind the baseboard heaters which are a common form of heating in these apartment towers. The heat losses out the upper edges of the window are also significant. In order to simulate the heat loss through these thermal bridges, multi-dimensional models must be used Therm 5.2 The computer program chosen for analyzing the effective thermal resistances of the opaque wall sections was Therm 5.2 created by Lawrence Berkeley National Laboratory (LBNL, 2003). This program will be used on the wall sections before and after the various enclosure retrofits. This program uses finite element analysis to perform two-dimensional steady-state heat transfer calculations which is ideal for this research application. This program also has the capacity to import basic AutoCAD drawings for easily laying out geometry. It also has the capacity to create materials and change thermal conductivity values. This is ideal because the properties of the materials in the program s library will be adjusted to match the values assumed for the existing materials in the Archetype s enclosure sections. This program also allows the user to adjust the mesh size to provide the necessary precision while minimizing computation time. This is ideal for running many simulations for the various retrofit options. The mesh control parameters in Therm can be adjusted to change the calculation tolerances and mesh size. A Maximum Percent Error Energy Norm parameter of 2% was required to provide consistent results. A Quad Tree Mesh parameter of 9 provided an adequately tight mesh illustrated in Figure 3-4. Figure 3-4: Finite Element Mesh 54
69 The finite element mesh in Therm is illustrated in Figure 3-4 for the intersection of the Archetype s wall, interior concrete floor slab and exterior concrete slab balcony Approach The sections were drawn in AutoCAD 2007 and imported to Therm. An example of one of the AutoCAD section drawings used in Therm is illustrated in Figure 3-5. Figure 3-5: AutoCAD Enclosure Section Used in Therm In order to effectively model the heat loss through the thermal bridging of the concrete floor slab, the enclosure sections were cut 152mm (6 ) from the top and bottom of the concrete slab. At this point the heat transfer through the wall sections is assumed to be in one dimension so an adiabatic surface edge was used. The exterior boundary condition was set as -20 C with a convection film coefficient of 15W/m 2 k to represent a cold winter condition. An exterior radiation enclosure with a temperature of -20 C was created to represent the radiation heat transfer from the building s surroundings. The 55

70 convective interior boundary conditions were divided into three sections: ceiling, wall, and floor with convection surface temperatures set as 22 C, 21 C, and 20 C, respectively. The convection film coefficient for all interior surfaces was set to 5W/m 2 k. An interior radiation enclosure with a temperature of 21 C was created to model the radiation heat transfer from the interior surfaces. The top and bottom of the wall section along with the inside end of the floor slab were set as an adiabatic condition. The temperature distribution through the Archetype s balcony window wall section modeled with these conditions is illustrated in Figure 3-6. Figure 3-6: Temperature Distribution The colour legend shown in Figure 3-6 illustrates the distribution of temperatures across the section. The various colours near the interior surface indicate the different interior surface temperatures. The coldest temperatures occur where the window frame meets the terrazzo stool (bottom edge of the window frame). A more detailed cross section was used for the window frame illustrated in Figure

71 Figure 3-7: Window Frame Temperature Distribution The temperature of -7 C in Figure 3-7 illustrates the coldest surface temperature which occurs on the interior surface of the aluminum window frame. A more detailed window frame cross section was used to more accurately determine the coldest surface temperatures which were used to determine the condensation potential discussed in Section Archetype Enclosure Thermal Resistances Therm 5.2 was used to simulate the heat transfer across all parts of the above grade enclosure and calculate their thermal resistances. The enclosure sections include the opaque wall sections and windows in the five wall types described in Section The heat transfer across the roof was also simulated to calculate its thermal resistance Archetype s Opaque Wall Thermal Resistance An overall opaque wall thermal resistance was calculated for the Archetype using Table
72 Table 3-1: Archetype Opaque Wall Thermal Resistance Section U-Value R-Value R-Value Opaque Wall (W/m 2 k) (W/m 2 k) (hr ft 2 F/btu) Percentage Wall % Window Wall % Balcony Door % Balcony Wall % Balcony Window % Overall % Table 3-1 illustrates the thermal conductivities calculated for the five different wall types converted to thermal resistances. The thermal resistance of the balcony door section is the lowest because the protruding concrete floor slab accounts for the majority of the opaque wall in that section. The opaque wall percentage is the percentage of overall opaque wall area of each type. They were calculated using the Archetype s perimeter composition previously estimated in Section The percentages were used to calculate an area weighted average thermal resistance of 0.89 m 2 k/w (5.08 hr ft 2 F/btu) for the Archetype s overall opaque wall Archetype s Window Thermal Resistance An overall window thermal resistance was calculated for the Archetype similarly to the opaque wall using Table 3-2. Table 3-2: Archetype Window Thermal Resistance Section U-Value R-Value R-Value Window (W/m 2 k) (m 2 k/w) (hr ft 2 F/btu) Percentage Window Wall % Balcony Door % Balcony Window % Overall % Table 3-2 illustrates that the windows thermal resistances are very similar for all wall sections. The thermal conductances of the window include centre of glass, edge of glass, and frame. The window characteristics previously assumed in Section were modeled as 102 mm (4 inch) thick layer with the same thermal properties as the window. The window percentages were used to calculate an overall area weighted average window thermal resistance of 0.32 m 2 k/w (1.83 hr ft 2 F/btu) for the Archetype. 58
. 3.1.4 Archetype s Condensation Potential Condensation occurs when a surface is at or below the dew point temperature of the surrounding air.")
73 Archetype s Roof Thermal Resistance A thermal conductivity of 0.58 W/m 2 k was calculated using Therm 5.2 for the Archetype s roof section previously described in Section This results in a thermal resistance of approximately 1.73 m 2 k/w (9.8 hr ft 2 F/Btu) Archetype s Condensation Potential Condensation occurs when a surface is at or below the dew point temperature of the surrounding air. This relationship is best described by the psychometric chart (Figure 3-8). Figure 3-8: Psychrometric Chart (Straube and Burnett, 2005) As an example, if a building component is surrounded by air that is 20 C with a relative humidity (RH) of 50%, the dew point temperature would be approximately 10 C. As shown on Figure 3-8 this is determined by first finding the intersection of the vertical line corresponding to 20 C and the curved RH line corresponding to 50%. (This shows that the interior air has a vapour pressure of approximately 1200Pa) Second, the intersection of the horizontal vapour pressure and the curved saturation line representing 100% RH represents the dew point. Third, the dew point temperature is the vertical temperature gridline crossing this point. Relating an enclosure s coldest surface 59
74 temperatures to the surrounding air s expected temperature and relative humidity provides insight into the potential for surface condensation. The condensation potential locations that are of concern for the Archetype s wall sections are shown on the balcony window wall section illustrated in Figure 3-9. Figure 3-9: Potential Condensation Locations Points A, C, E, and G are edge locations where the coldest temperatures are likely to be experienced. Points B, D, and F are surface locations where the average temperatures will be determined. Table 3-3 presents all these temperatures for several exterior temperature scenarios for both types of windows common in the towers. 60
75 Temperatures ( C) and Relative Humidity (%) Table 3-3: Condensation Potential Exterior Temperature ( C) Interior Temperature ( C) A 7 40% 10 49% 12 56% B 17 78% 18 83% 19 88% C -7 15% 0 25% 3 30% D 8 43% 11 53% 13 60% E -7 15% 0 25% 3 30% F 17 78% 18 83% 19 88% G 12 56% 14 64% 15 69% Lowest Temp ( C) & RH -7 15% 0 25% 3 30% The relative humidity (RH) values in Table 3-3 represent the dew points for the interior surface temperatures and interior air temperature. The double glazed, aluminum framed window provides little thermal resistance. The lowest interior surface temperatures occur at C and E which is where the header and sill meet the window frame. Condensation can occur around the window with an indoor RH greater than 15% during the coldest periods (-20 C) and with an indoor RH greater than 25% during the cold periods (-10 C). Since the surface temperatures are below the freezing point of water, frost will form along these surfaces. Fogging of the double glazed window should only occur at approximately 40% RH on the coldest days so long as the double glazed seal is not broken. The buildup of moisture caused by condensation should be avoided for a number of reasons. Condensation on window glazing reduces the purpose of a window: providing natural light inside and providing occupants views of the outside. The buildup of moisture can lead to mould growth in many locations either on the enclosures interior surface or interstitially. The buildup of moisture can corrode steel window frames or cause painted surfaces to flake off. Increasing the interior surface temperatures or reducing the interior RH will reduce condensation potential. The towers lose a significant amount of the interior vapour due to air leakage. The large amount of air leakage keeps the RH during colder periods low which reduces condensation potential. Air leakage should be reduced for a number of reasons including uncomfortable drafts and wasted heating and cooling energy. Reducing the air leakage will increase interior RH, resulting in a greater condensation potential and increased amounts of built up moisture. If retrofitting these towers reduces air leakage, the interior surface temperatures at the condensation surfaces of concern also need to be increased so that the retrofit does not have these negative consequences. The effects of various retrofits on the interior surface temperatures will be discussed in Chapter 5. 61
76 3.2 Air Leakage Air leakage is the uncontrolled movement of air into (infiltration) and out of (exfiltration) the enclosed space of a building. It is important to minimize air leakage to save energy and ensure comfort. However, ventilation must always be provided to ensure healthy indoor air. Modern and efficient buildings strictly control air leakage and provide guaranteed and reliable fresh air. This is described by the mantra, Build tight, ventilate right. The driving forces of air leakage are pressure differences caused by wind, stack effect, and mechanical ventilation systems. The amount of air leakage depends on these driving forces and the leakiness of the building enclosure. Wind has a significant impact on the towers because of their height and exposure. Stack effect (buoyancy) also has a significant impact on the towers because of its height but also because of the ability for air to move vertically within the building enclosure. This is modeled with the aid of using the thermal draft coefficient which is described in this chapter. The towers mechanical ventilation systems do not always have as large an impact on driving air leakage but will be discussed primarily because of their impact on energy and indoor air quality. The towers enclosure is significantly leaky which allows these driving forces to create significant amounts of air leakage Wind Pressures When the wind hits a building its velocity slows and this is a loss of kinetic energy. The loss of kinetic energy is a gain in potential energy which is in the form of pressures. The pressure acting at any point is affected by the building s height and shape, direction of wind, and surrounding topography. In structural engineering, only the largest wind pressures around a building that occur in extreme wind events are used for structural loading and overestimating is more important than accuracy. In building energy modeling, accuracy is more important and wind pressures are required every hour (assuming an hourly energy model). These pressures are either negative or positive with magnitudes ranging from 4 to 10Pa for sheltered buildings close to the ground and from 10 to 50Pa for taller, unobstructed buildings such as the towers (Straube, 2005). Figure 3-10 illustrates general wind pressures around a tower as a result of a given wind acting at 0 and 45 to the long side of the building. 62


77 Figure 3-10: Tower Wind Pressures at 0 and 45 Figure 3-10 illustrates positive pressures in green and negative pressures in red. The largest positive wind pressures occur at approximately four fifths of the height of the building. All other driving forces aside, positive pressures cause infiltration and negative pressures cause exfiltration. Changing wind directions and velocities can lead to fluctuating infiltrations and exfiltrations. Increasing the air tightness of the enclosure can reduce the fluctuating infiltration and exfiltration effects caused by the wind Stack Effect Stack effect involves buoyancy which is the force associated with different fluid densities, warm air and cold air in this case of buildings. Figure 3-11 illustrates the stack effect in the general high-rise shape of the towers. 63

78 Figure 3-11: Stack Effect Figure 3-11 represents a heated high-rise apartment tower during a cold period. The blue is cold outdoor air which is denser than the warm indoor air illustrated in red. Buoyancy forces the pocket of warm indoor air upwards while it is surrounded by the cold outdoor air. This creates positive pressures on the inside of the upper portion of the building and negative pressures on the inside of the lower portion of the building. Since the building enclosure is covered in unintentional and intentional openings, the pressures potential energy is converted into kinetic energy or air flows illustrated by arrows in Figure The pressure and air flow effect caused by temperature differences and building height is called stack effect. This same process also occurs in chimneys which is why it is also known as chimney effect Mechanical Ventilation A common component in the mechanical ventilation system of the high-rise apartment towers was the corridor pressurization system. This system is illustrated in Figure

79 Figure 3-12: Corridor Pressurization System (Lstiburek, 2006) Figure 3-12 illustrates the outside air entering a corridor outside air supply called a makeup air handling unit (MAHU) where the air is conditioned and pressurized with a fan into a vertical shaft extending from the top of the bottom storey of the building. A vent releases air into the corridors at every floor, so that every corridor is supplied or pressurized, with fresh conditioned air. This air is intended to flow under the entry doors of each unit to provide ventilation. Stale air is to be exhausted from the bathrooms. There are two common types of exhaust systems used by the towers. The first system is illustrated in Figure 3-12 where the bathroom exhaust is connected to a central vertical exhaust duct with an additional exhaust fan on the rooftop running constantly. In the second type of 65
80 exhaust system, illustrated in Figure 3-13, the bathroom exhaust is connected horizontally to the exterior with no additional fans. Figure 3-13: Individual Unit Exhaust System (Diamond, R.C. et al, 1999) Figure 3-13 illustrates the apartment`s bathroom exhaust fan connected to a horizontal duct leading directly to the exterior. It has no additional fans that operate for constant ventilation. The intended ventilation design is for the pressurized central vertical supply shaft to pressurize the corridor which will pressurize the unit such that ventilation air will passively exhaust through the horizontal bathroom exhaust duct. When the bathroom fan operates, a higher rate of exhaust will occur. The CMHC`s report Ventilation Systems for Multi-Unit Residential Buildings: Performance Requirements and Alternative Approaches states, Research by CMHC and others has shown that conventional corridor air supply and bathroom-kitchen exhaust systems do not, and cannot, ventilate individual apartments. The report goes on to state that these approaches consume a significant amount of energy, can be noisy, consume internal floor area and serve as possible conduits for pests and smoke during fire emergencies. (CMHC, 2003) Figure 3-14 illustrates how a corridor pressurization ventilation system actually functions. 66

81 Figure 3-14: Actual Air Flows in Ventilation System (CMHC, 2007) Figure 3-14 illustrates the influence stack effect has on the air flows in the ventilation system. Stack effect causes the lower units to be negatively pressurized and the upper units to be pressurized. The ventilation air from the roof top corridor pressurization supply often is not delivered to the lower units. Although this was the designed source of ventilation, the actual ventilation comes from air 67
82 surrounding the lower parts of the building infiltrating into the lower units. This air often passes by sources of contamination including surrounding garbage dumpsters, underground parking exhaust fumes, smoking sections, and idling delivery vehicles. The building s upper units are often overheated because of the rising warm air. The central exhaust can flow backwards in the upper levels and the individual exhaust can flow backwards in the lower levels because of the stack effect. All of this results in poor indoor air quality (IAQ). Most of the air that is delivered to the corridors does not flow under the unit entrance doors for two reasons. The first is that many tenants often block the undercut of their entrance door to stop noise and odours entering from the corridor. The second reason is because elevator and other vertical shafts allow large amounts of air to flow more directly upward in the building due to stack effect. The openings in the corridors and pathways are often more conducive for corridor supply air to flow out the elevators and other vertical shafts than through the undercuts of unit entrance doors. Stack effect also causes the warm air that has gathered moisture from all the units below to be forced out the exterior enclosure. The warm, moist air often reaches surface dew point temperatures within the enclosure resulting in condensation and the buildup of liquid moisture on surfaces below this dew point. This has lead to numerous deterioration problems that focus on the upper sections of the enclosure and is why many towers have been quickly and cheaply over clad along the top only. Figure 3-15 illustrates this common repair with the towers. 68

83 Figure 3-15: Common Overcladding around Upper Portion of Tower Figure 3-15 illustrates the overcladding in red EIFS around the upper five stories of this apartment tower. The overcladding reduces heat loss, reduces air leakage, and prevents further deterioration of the masonry from exfiltration and rain penetration. More common retrofits only apply metal cladding which is about half the cost but has significantly fewer benefits Indoor Air Quality of Towers A Canadian Mortgage Housing Corporation (1991) field investigation survey was conducted on two nearly identical 13 storey towers constructed in 1973 and The survey measured the air movement and IAQ. The majority of air leakage was through the corridor doors and enclosure walls. The major leakage paths between floors and walls were the service line penetrations. It was also found that only 21 and 25% of the supplied air exhausted through the designated bathroom exhaust vents. The IAQ tests are summarized in Table
84 Table 3-4: Indoor Air Quality Investigation Summary Mean Temperature Mean Relative Humidity Mean CO 2 Level Mean CO Level Particulate Concentration ( C) (%) (ppm) (ppm) (µg/m 3 ) Max Average Tower* Min Max , Tower Average ,009 Min Average ,052 Canadian Exposure Guidelines *Retrofitted with: exterior thermal fusible membrane, 125mm of exterior semi-rigid fibreglass insulation, aluminum siding, and new PVC windows. The temperature, relative humidity, carbon dioxide (CO 2 ) level, carbon monoxide (CO) level, and particulate concentration were measured for seven units in each of the two towers and the results are illustrated in Table 3-4. The maximum, minimum, and averages were calculated for each building along with the overall averages. It was found that the winter air temperatures were set high for comfort, likely because of a low mean radiant temperature. The occupants complained of a dry environment; the overall average relative humidity was 22%. The mean carbon dioxide levels were all below the recommended 1,000ppm. The mean carbon monoxide levels were all below the recommended 11ppm but one unit reached 7ppm. Particulate concentration is comprised of a variety of substances including cotton, wool, dyes, food particles, hairs, dead skin cells, and decomposed materials. The measured concentrations in both towers were found to exceed the Canadian Exposure Guidelines of 40µg/m 3. The 1970 tower greatly exceeded this value with an average approximately 450 times the suggested maximum. Generally lower CO 2 and CO levels along with significantly lower particulate levels are likely because the 1973 tower s retrofits increased the overall air tightness. Formaldehyde concentrations were also measured for a couple of the units and were found to be well below the level deemed acceptable by workplace health officials Archetype Air Leakage Characteristics A report by the Canadian Mortgage Housing Corporation (CMHC, 1996) summarized the measured exterior wall leakage rates for several buildings. It was found that there was a large variation, ranging from 0.68 to 10.9 l/s * m 50 Pa. These results included a wide range of enclosure types. An air 70
85 leakage rate of 2.15 l/s * m 50 Pa was reported for a building tested using the whole building method. This building was retrofitted for energy reasons and its air tightness was reduced to 1.76 l/s * m 50 Pa. Another Canadian research report (Shaw, C.Y., Gasparetto, S., and Reardon, J.T., 1990) provided measured air leakage results for two buildings constructed in a manner similar to the Archetype. Both were concrete framed, used double wythe brick masonry for infill, and insulated on the inside. The first building is 14 stories and constructed in 1977 while the second building is 17 stories and constructed in The air leakage test was conducted by depressurizing the entire apartment with a large fan at the ground level to induce a pressure difference across the enclosure. The results of the air leakage measurements in the two high-rise apartment towers are illustrated in Table 3-5. Table 3-5: 1977 and 1982 High-Rise Apartment Tower s Measured Air Leakage Values 1977 Apartment Tower 1982 Apartment Tower Ground Level Pressure Difference 74 Pa 75 Pa Top Level Pressure Difference 32 Pa 25 Pa Mean Pressure Difference 53 Pa 50 Pa Air Leakage at Average Pressure Difference 2.25 L/s * m L/s * m 2 Table 3-5 illustrates that the pressure differences decreased higher in the building, this is due to the vertical air flow resistance. The air leakage values of 2.25 and 3.39L/s m 2 correspond to the mean pressure difference of approximately 50 Pa. The overall air leakage values for varying mean pressure differences are presented in Figure 3-16 and Figure
86 Figure 3-16: 1977 and 1982 Tower's Overall Air Leakage Characteristics (Shaw, C.Y., Gasparetto, S., and Reardon, J.T., 1990) Figure 3-16 illustrates the overall air leakage per unit area of exterior wall for both the storey building (D) and storey building (V) before retrofit and after an unknown retrofit. 72
87 Figure 3-17: 1977 and 1982 Tower's Exterior Wall Air Leakage Characteristics (Shaw, C.Y., Gasparetto, S., and Reardon, J.T., 1990) Figure 3-17 illustrates the exterior wall air leakage per unit area of exterior wall for a unit in both the 14 storey (Building D) and 17 storey (Building V) buildings before retrofit and after an unknown retrofit. According to this report, the visual inspection suggests most of the air loss is through the elevator shafts. A study conducted by the Canada Mortgage and Housing Corporation (CMHC, 1991) measured the overall air leakage in two Montreal apartment buildings. One of the buildings was a 1960 apartment building similar to the towers. It has balconies, two central fuel-fired boilers, hydronic heating to individual units, and original balcony doors and windows. The measured air leakage rates for both the 1991 and 1960 apartment buildings at three different pressure differences are illustrated in Table
88 Table 3-6: 1991 and 1960 Apartment Building's Air Leakage Rates Pressure Differential Leakage Rate (L/s * m 2 ) 1991 Apartment 1960 Apartment 25 Pa Pa Pa Table 3-6 illustrates that the apartment constructed in 1960 has approximately twice the air leakage as the 1991 apartment building. Since the enclosure construction of the 1960 building is similar to the towers, its air leakage values were used when setting the values for the Archetype. Another report by the Canada Mortgage Housing Corporation (CMHC, 2001) summarized air leakage testing results based on a Normalized Leakage Rate at 75 Pa (NLR 75 ). Twelve Canadian MURBs were tested based on air leakage of the whole building with total enclosure area used to calculate a mean NLR 75 of 3.19 L/s * m 2. Three Canadian MURB buildings were tested based on air leakage of the whole building with an alternate enclosure area used to calculate a mean NLR 75 of 4.00 L/s * m 2. Six Canadian MURBs were tested based on individual floors or suites with their corresponding enclosure area used to calculate a mean NLR 75 of 3.23 L/s * m 2. Based on these 19 MURBs, an overall air leakage mean of 3.32 L/s * m 75Pa. was calculated. This report also concluded that the existing MURB stock in Canada far exceeds (30 to 40 times) the upper limit of what is now considered desirable-established as 0.10 L/s * m 2 (for indoor relative humidity levels between 27% and 55%) in the appendices of the 1995 National Building Code. A study by the Lawrence Berkley National Laboratory (LBNL, 2006) summarized measured data for 25 apartment buildings from different studies. The measured air leakage rates had an average of 4.8 l/s m 2 and a median of 4.0 l/s m 2 at a 50 Pa pressure difference with a standard deviation of 1.7. They estimated that apartment buildings are one and a half to two times leakier than single-family homes. The American Society of Heating, Refrigerating and Air-Conditioning Engineers (Bohac, D.L. et al., 2007) conducted an air leakage study on various buildings including a 1982 eleven storey brick clad concrete frame building in Minnesota, USA with a corridor supply ventilation system with characteristics similar to the towers. The total air leakage of the individual units was between 177 l/s (376cfm) to 452 l/s (958cfm) with a 50 Pa pressure difference. The median was 214 l/s 50 Pa. Approximately 25% of that air leakage is between the adjacent units. Unfortunately the area of exterior wall per individual unit was not provided. Using typical unit dimensions, an approximated 74
89 exterior wall leakage rate of 5 l/s * m 2 magnitude as the previous 50 Pa. was calculated which is in the same order of Based on the limited overall air leakage test data for post-war apartment towers Figure 3-18 was created to determine an appropriate estimate for the Archetype. Figure 3-18: Overall Air Leakage Values for Post-War Apartment Buildings Figure 3-18 was calculated based on data from the four most representative buildings using Equation 2. (2) Where Q is the overall air leakage in l/s * m 2, C is the flow coefficient, ΔP is the pressure difference across the enclosure, and n is the pressure exponent. Montreal illustrated on Figure 3-18 represents the 1960 apartment building which was classified as a high-rise. 17 Storey and 14 Storey represent the 1982 and 1977 apartment buildings, respectively. 19 Different MURBs represents the average of the various high-rise apartment buildings that the CMHC had overall air leakage test data. The average was calculated based on the average flow coefficient and average pressure exponent and illustrated in Figure 3-18 as a solid line. The flow rates per unit area of enclosure wall (l/s m 2 ) for the Montreal, 17 Storey, and 14 Storey were collected from the data for 25 Pa, 50 Pa, and 75 Pa pressure differences. The flow coefficients and pressure exponents were calculated for all three buildings. The 19 Different MURBs only had data for 75
90 an average flow rate at a 75 Pa pressure difference, so the flow coefficient was calculated assuming a pressure exponent of 0.65 which is a common value used for air leakage in buildings. An average flow coefficient of l/s m 2 and an average pressure exponent of were calculated for the average building. This results in a leakage rate of 4.6 l/s m 2 at 75 Pa which will be used for the Archetype. Using the average pressure exponent of 0.682, the range of air leakage rates would be from 2.9 l/s m 2 to 6.1 l/s m 2 at 75 Pa. The lack of measured air leakage data for older high-rise apartments is evident. However, based on this limited data, the estimated air leakage parameters can provide for a reasonable estimate of infiltrating air, heating/cooling loads, and whole building energy use Air Leakage Models Since the towers experience a lot of air leakage because of their air leakage characteristics and the significant pressure differences across the enclosure due to stack effect and wind, it is important that the model used to estimate infiltration flow rates accounts for these factors accurately. The air leakage models considered for the towers accounted for stack effect and wind in some form. A comparison of the models was completed to determine which model was best suited for the towers. Three models were compared for modeling air leakage in the Archetype. The first is AIM-2 by Iain Walker of Lawrence Berkeley National Laboratory (LBL) and David Wilson of the University of Alberta (1998). The second is the LBL model developed in 1980 which was explained and compared to measured data by M.H. Sherman and M.P. Modera (1986). The third is C.Y. Shaw and G.T. Tamura s model for tall buildings (1977). The models will be referred to, respectively, as AIM-2, LBL, and Shaw and Tamura models in this thesis. The equations for these models were set up in Microsoft Excel then inputs were entered and the results analyzed and compared. The LBL model considers the leakage of the enclosure to act like a perfect orifice since its only input for air leakage is an equivalent leakage area. Shaw and Tamura and AIM-2 models are derived from a power law pressure-flow relationship which has been proven to be more accurate than an orifice flow assumption (Walker, I.S. and Wilson, D.J., 1998). This relationship was given in Equation 2. All three models separate natural infiltration into the two driving forces, wind and stack effect, and then combine them uniquely. The pressure-flow relationships are calculated for both wind and stack effect with corresponding wind and stack factors. These factors account for each model s various 76
91 considerations. The formulation of each models infiltration rates for both wind and stack effect are described below Modeling Wind Effect The air flow rates across the enclosure due to wind depend on the angle and velocity of the approaching wind. It causes various pressure differences around the enclosure; negative pressure differences pull air from inside to outside the building and positive pressure differences cause the reverse. All three models are derived from Equation 3 to convert wind velocity to pressure differences. (3) Where ΔP w is the pressure difference due to wind effects, ρ is air density, and V is wind velocity Modeling Stack Effect The infiltration rates across the enclosure due to stack depend on the difference of inside temperature to outside temperature, gravity, air density, and building height. AIM-2 and LBL models use Equation 4 which is based on buoyancy to estimate the pressure differences. (4) Where ΔPs is the pressure difference due to stack effects, ρ is air density, g is gravity, h is building height, ΔT is the temperature difference between inside and outside, and Tin is the temperature inside. Shaw and Tamura s model uses the same equation except the gravity term is replaced by 0.52/T o, where T o is the outside temperature Infiltration Model Comparison Each of the three models account for a different mix of variables. Table 3-7 summarizes some the more significant factors for each model. 77
92 Table 3-7: Model Comparisons Consideration AIM-2 Shaw and Tamura LBL Building Height Yes Yes Yes Meteorological Station Height Yes Yes Yes Local and Meteorological Station Terrain Yes No Yes Flue Yes No No Thermal Draft No Yes No Fixed Neutral Pressure Plane Yes Yes Yes Wind Angle No Yes No The three models combine air flow rate due to stack and wind differently. The LBL model combines the two using a simple squared sum given by Equation 5. The AIM-2 model is similar to the LBL model except it uses a power law flow exponent relationship. It is given in Equation 6. Q w and Q s in Equations 5 and 6 represent air flow rate due to wind and stack, respectively. The Shaw and Tamura model uses an empirical approach based on redefining the wind and stack air flow rates as a larger and a smaller flow. It is given in Equation 7. (5) (6) (7) Q larger and Q smaller in Equation 7 are the respective larger and smaller values of Q w and Q s. The three models were set up in Microsoft Excel and the natural infiltration was calculated for each model every hour of a representative year for the Archetype. The infiltration rates calculated were converted to air changes per hour (ACH) and the number of hours in a year for different ACH values were graphed and illustrated in Figure
93 Hours ACH for Various Models over One Year AIM-2 Shaw and Tamura LBL ACH Figure 3-19: Natural ACH for Various Models over One Year Figure 3-19 illustrates the differences in the estimated ACH for each model. The LBL model shows significantly more hours at higher rates than the other models. The Shaw and Tamura model has a wider spread with very few hours. The average and maximum ACH values were calculated for comparison between models. The results are illustrated in Table 3-8. Table 3-8: Average and Maximum Natural ACH for Various Models LBL Shaw and Tamura AIM-2 Average ACH Maximum ACH The average values for all models are within 20% of 0.5 ACH under natural conditions without mechanical ventilation. The maximum values indicate that the Shaw and Tamura model estimates can have significantly larger ACH; approximately 4 times that of the other models. This is because during windier conditions, the Shaw and Tamura model estimates significantly larger infiltration rates. Since this model was the only one developed for high-rise buildings, it is the only model that captures the larger wind impacts on infiltration rates of high-rise buildings. During the hours with significant interior and exterior temperature differences, when stack effect is more prevalent, all three models estimate similar infiltration rates. 79
94 Overall, the results indicate a large variation between estimated maximum natural air leakage rates but relatively little difference between averages. The larger maximum values the Shaw and Tamura model estimated likely indicate that the AIM-2 and LBL models cannot accurately estimate the worst case natural air leakage rate for certain circumstances. As expected the ventilation provided by natural infiltration is highly variable but often sufficient in a leaky building such as the Archetype Effect of Open Windows on Air Leakage Models These estimates have significant limitations that include window operation. The air leakage characteristics that these results are based on assume all windows are closed. Proskiw and Phillips (2006) studied the impact of window operation on a seventeen storey 1970s apartment in Winnipeg, Manitoba, Canada (referred to as Building #2 in their study). Their results, shown in Table 3-9 provide significant insight to the effect of window openings on natural infiltration. Table 3-9: Impact of Window Operation on NLR 75 for Building #2 Outdoor Temperature ( C) (Proskiw, G. and Phillips, B., 2006) Percent Open Window Area % % % 10.3 Typical Range of NLR 75 Values for Canadian MURB s Increase in NLR 75 2 (l/s m 2 ) 1.18 to 6.37 Table 3-9 illustrates that for a summer, spring/fall, and winter day 9, 7, and 2% of windows were open, respectively. It was also noted that even during a cold winter night of -40 C some windows were seen open. The significance shown in the table is that increases in overall leakage rate were calculated as approximately 2, 6, and 8 times that of a building with closed windows, depending on season. Based on the insight from this study, the air leakage was increased for all models based on Table NLR 75 stands for Normalized Leakage Rate at 75 Pa of pressure difference. 80
95 Hours From Table 3-10: Seasonally Adjusted Overall Average Flow Coefficients To Overall Air Leakage Rate at 75 Pa per m 2 of Wall Increase by Factor Adjusted Overall Air Leakage Rate at 75 Pa per m 2 of Wall Winter December February 4.6 l/s l/s Spring March May 4.6 l/s l/s Summer June August 4.6 l/s l/s Fall September November 4.6 l/s l/s The results after adjusting for approximate increases in overall average flow coefficients due to window operation for each model are presented in Figure AIM-2 Shaw and Tamura LBL ACH Figure 3-20: Window Adjusted Natural ACH for Various Models over One Year Figure 3-20 illustrates that the Shaw and Tamura model continues to estimate larger ACH under certain circumstances and it also keeps a consistent shape unlike AIM-2 and LBL models. The adjusted average ACH and maximum ACH for the models are illustrated in Table
96 Table 3-11: Adjusted Average and Maximum Natural ACH for Various Models LBL Shaw and Tamura AIM-2 Average ACH Maximum ACH Table 3-11 illustrates that the average estimated natural air leakage with window openings approximated ranges from approximately two to three ACH. This table also illustrates that the Shaw and Tamura model will estimate the worst case natural air leakage to approximately four times that of the other models. The adjusted average and maximum natural ACH values over the course of the year increased to approximately six times the original ACH when window openings were considered and estimated within the calculations. 3.3 Heat, Air, and Moisture Analysis Summary It is evident from thermographic images illustrated in Figure 3-1 through Figure 3-3 that significant heat is lost from the enclosure of the towers and hence they have poor thermal control. Twodimensional, steady-state heat transfer analysis was completed on all five wall sections and combined using a weighted area average. The overall enclosure thermal resistances used for the Archetype are illustrated in Table Table 3-12: Archetype's Enclosure Thermal Resistances Enclosure U-Value R-Value R-Value (W/m 2 k) (m 2 k/w) (hr ft 2 F/btu) Opaque Wall Window Roof Table 3-12 illustrates the three main enclosures and their thermal resistances in metric and imperial units. These values were used in simulating the Archetype s annual energy consumption. They were the basis for which retrofits were applied and modeled. The interior surface temperatures of the balcony window wall section were modeled for various exterior temperatures and the potential for frost and condensation was analyzed. There is significant condensation potential on the towers aluminum frames. The interior surface temperatures and dewpoint RH values for the Archetype presented in Table 3-3 were used to compare with the retrofit values presented in Chapter 5. Previous studies of the towers air leakage characteristics were researched and a value of 4.6 l/s/m 2 at 75 Pa for the Archetype was assumed based on the limited findings. A range from 2.9 to 6.1 l/s m 2 at 82
97 75 Pa was estimated. An analysis of three air leakage models was completed and the Shaw and Tamura model was chosen for the Archetype. It was chosen because it accounts for thermal draft which is a significant factor in high-rise MURBs relative to townhouses and single-family houses. The Shaw and Tamura model also accounts for wind angle which is provided in a representative year s weather file and can decrease estimated infiltration rates by as much as one half. The results of comparing the models also indicated that the Shaw and Tamura model was the only one to capture the higher infiltration rates. It was also the only model intended for high-rise buildings. The effects of open windows on air leakage models was analyzed and found that it can affect the air leakage estimates, however considering open windows would be too complex for the model and was not accounted for BELA MURB High-Rise Editions. 83

98 Chapter 4 Energy Modeling High-Rise MURBs The purpose of modeling the energy consumption of the towers is to determine the effects of retrofits on its energy use. This is achieved by simulating the energy use before and after retrofit adjustments and comparing the differences in consumption. In order to effectively model the energy use of high-rise MURBs a significant amount of information is needed. This information includes weather data, enclosure thermal characteristics, an air leakage model, heat transfer physics, a domestic hot water use schedule, the number and size of different units, energy consumption of miscellaneous electrical loads, an understanding of the ventilation system, and heating or cooling efficiencies. Most of this information is available from previous research, architectural drawings, or separate calculations. Annual energy consumption of high-rise MURBs varies from under 100kWh/m 2 to over 500kWh/m 2. The annual energy consumption of the towers is expected to be in the higher half of the range, estimated around 350kWh/m Building Energy and Loads Analysis (BELA) The energy model chosen to simulate the Archetype s energy demands (loads) was Building Energy and Loads Analysis (BELA). BELA is a Microsoft Excel spreadsheet based program developed by Brittany Hanam (2010). This single zone building energy modeling program has a transparent, open architecture that allows it to be adapted to specific building modeling applications. The existing structure of the model is illustrated in Figure 4-1. Figure 4-1: BELA Model Structure (Hanam, 2010) 84
99 Figure 4-1 illustrates that the model has three general steps: inputs, loads, and systems. In the first step, inputs, the characteristics of the building are entered along with the boundary conditions such as hourly weather for a typical meteorological year, schedules defining when equipment is operated, and occupancy occurs. In the second step, loads, the amount of heating and cooling required is calculated based on the inputs. BELA s load calculation includes solar radiation on vertical building enclosure surfaces, but is limited to walls facing the four cardinal directions. BELA assumes the interior temperatures vary over the year in the form of a sine curve with the summer and winter indoor temperature set points being the maximum and minimum of the curve, respectively. The load calculations also include interior relative humidity, conduction through the four cardinal walls, roof, foundation, windows, and doors, solar heat gain, infiltration, and internal gains. The rate of sensible heat loss and gain along with the latent loading rate are calculated and combined for an overall rate of heating or cooling every hour. The rate of heating and cooling for ventilation is calculated every hour separately. The total heating, cooling, and net loads are calculated and presented in kilowatt hours for each month and the year. The final step, systems, defines the heating and cooling systems and calculates the energy use. A separate sheet is used to customize each type of heating and cooling system. Each system s parameters are defined and the energy use every hour is calculated based on the hourly loads from the previous step. The system results summarizes the energy used by space distribution, heating, and cooling, ventilation distribution, heating, and cooling, lights, and plug loads for each month and the year in kilowatt hours per square metre of floor space for each system. The space conditioning systems are also compared and the total predicted building energy consumption for each system is totaled. BELA was chosen to model the Archetype s energy and loads primarily because of its simplicity and adaptability. The Archetype is a high-rise MURB and needs to be modeled as such. In order to obtain accurate energy and load results all major factors that influence energy use in this unique set of buildings needs to be accounted in the model; this includes stack effect, wind effects, domestic hot water, and miscellaneous electrical loads for a combination of units. BELA is mostly based on fundamental physics not empirical correlations which makes it easier to add the energy influencing factors specific for high-rise MURBs. Another reason for selecting BELA was because it decouples loads from mechanical design which mirrors the normal process of design. To be useful and accurate 85
100 for assessing the impact of enclosure retrofits, an extension and customization of BELA was implemented. This is called BELA MURB High-Rise Edition and is described below BELA Inputs BELA was originally used to simulate a single zone office. The following inputs are based on but not limited to the energy influencing factors required for an office. The inputs section of BELA starts with a general information section which remains the same for most building energy models. The next section is the enclosure inputs including a single air leakage parameter, enclosure thermal resistance values, solar heat gain coefficients, and solar absorptance values. The final section is the internal gains inputs which include lights, plug loads, and occupant loads. Internal gains will be significantly different for the MURB edition since MURBs internal gains are based on the number and type of unit. BELA s inputs section is illustrated in Appendix B BELA Schedules BELA has another sheet for schedules that allows the user to enter daily and weekly schedules for lighting, plug loads, and occupancy in terms of percentage of full operation. These are illustrated in Appendix C. Office building schedules are different and more predictable than residential schedules so this section will be significantly adjusted. The weekly schedule is less significant in residential energy use and may not be used BELA Weather Data BELA uses hourly weather data for a single year; two types of files are the Canadian Weather for Energy Calculations (CWEC) and the Typical Meteorological Year (TMY). The office-based BELA uses the CWEC file for Toronto International Airport. The information in these files includes dry bulb temperature, dew point temperature, relative humidity, atmospheric pressure, global horizontal radiation, wind direction, and wind speed. The global horizontal radiation is converted to vertical radiation for the four cardinal directions based on an Excel function developed by Nick Bronsema (2009). No changes were necessary BELA Load Calculations Only a few changes were made in the load calculation methodology. Weather parameters were calculated based on the weather input data using psychrometric equations. The saturated vapour pressure, vapour pressure, air density, vapour density, total air density, and mass concentration of 86
101 vapour in air were all calculated and used as the boundary conditions in BELA. An average convection coefficient of 17 W/m 2 k was used in BELA even though it was understood that in reality surface film coefficients vary with wind speed, solar radiation, and surface roughness. (Hanam, 2010) The surface temperatures and conduction heat transfer rates were calculated for each hour for the four cardinal walls, roof, foundation, doors, and windows. The thermal mass was calculated by using a weighting factor method on the conduction, solar heat gain, occupancy, equipment, and lighting. Since BELA was originally used for a lightweight office building the weighting factors are for lightweight enclosures and only consider the previous hour. Weighting factors generated by equest (Hanam, 2010) were used and illustrated in Table 4-1. Table 4-1: Weighting Factors for Thermally Lighweight Construction (Hanam, 2010) Loads V 0 V 1 W 1 Conduction Solar Heat Gain People & Equipment General Lighting Task Lighting Table 4-1 illustrates weighting factors used with the current and previous hour s instantaneous gains/losses. The weighting factor relationship is presented in Equation 8 from Chapter 19 of the Handbook of Fundamentals (ASHRAE, 2009). (8) Where q θ = Instantaneous heat gains or losses at hour θ q θ-1 = Instantaneous heat gains or losses at hour θ-1 Q θ = Heating or cooling load at hour θ Q θ-1 = Heating or cooling load at hour θ-1 V o, V 1, and W 1 = Weighting factors For thermally massive buildings the weighting factor method uses different factors and considers the previous two hours. The load calculations in BELA also calculate the solar heat gain, infiltration, and internal gains for people, lighting, and plug loads. The loads are combined such that a total heating load and total cooling load is produced. 87
102 4.1.5 BELA Ventilation Ventilation calculations in BELA for the office building used both a required rate per person and per floor area along with a minimum rate and it was assumed that the ventilation system would meet these requirements. The use of energy recovery ventilators (ERV) and heat recovery ventilators (HRV) were assumed. Parameters for a single fan with a maximum flow capacity and maximum power along with fan and motor efficiencies were used to calculate fan energy based on either an on/off or variable speed design. Significant changes were made BELA Load Results The load results in BELA are presented in three tables: heating, cooling, and net loads, for every month and yearly total. The office-based BELA divided heating loads into conduction, infiltration, and ventilation. The cooling loads were divided into conduction, infiltration, window solar heat gain, occupants, lights, plug loads, and ventilation. BELA produces five plots illustrating January heating loads, August cooling loads, monthly load intensity, net monthly load intensity, and total annual loads. Examples of office-based BELA load result plots are presented in Appendix D BELA System Results One advantage of BELA is its ability to be as detailed with the system design and control as desired and to create as many different system designs as required. The office-based BELA included two systems for heating and cooling: radiant panels and fan coil units, and included details such as heating and cooling design flows and head losses. Two examples of office related system inputs are presented in Appendix E. BELA s system results are presented in a table for each system comprised of monthly energy consumption in kwh/m 2 for each energy source. The energy sources used in the office based BELA are: space distribution, space heating, space cooling, ventilation distribution, ventilation heating, ventilation cooling, lights, and plug loads. Another table compares the systems by illustrating the yearly energy consumption for each energy source along a comparison of total yearly energy consumption. The system results are also presented in charts. The office based BELA uses five charts for the two systems it compares (radiant versus fan coil): radiant energy density, fan coil energy density, energy source pie charts for radiant and fan coil, and a systems comparison. These five plots are illustrated in Appendix F. 88
103 4.2 BELA MURB High-Rise Edition Changes needed to be made to BELA because the original version was intended for new office buildings. High-rise MURBs energy consumption is affected in several different ways including: a significant increase in hot water use, the operation is dependent on units, different operation schedules, often a different type of enclosure, and the ventilation and space conditioning systems are usually quite different. The BELA MURB High-Rise Edition has seven significant changes listed below. 1. Exterior Convection Coefficient and Thermal Mass in Section MURB Units and Occupancy in Section Domestic Hot Water in Section Miscellaneous Electrical Loads in Section Air Leakage in Section Ventilation in Section Space Conditioning in Section The first significant change is actually two smaller changes; the exterior convection coefficient and thermal mass. Since high-rise buildings are more susceptible to wind it was decided to make the convection coefficient depend on wind speed. Thermally massive construction was incorporated along with a parameter capable of adjusting the degree of thermal mass. This was chosen because BELA MURB High-Rise Edition was intended to be used with thermally massive Archetype-type MURBs. The second change was incorporating the many individual apartment suites and a common area for calculating internal gains. Since MURBs are defined by the number and type of units, it was important to differentiate among them. Occupancy was also defined by the number and type of units and the daily schedule for occupancy was adjusted. The third change was incorporating domestic hot water (DHW) which is a significant part of the total energy use in MURBs; both the latent and sensible DHW loads in each type of unit were considered. The daily schedules were also adjusted to be used with DHW calculations. 89
104 The fourth change was transforming plug loads and lighting loads into miscellaneous electrical loads and specifying each major electrical load typical in a MURB for each type of unit. The daily schedule was changed to generalize usage of all MEL. The weekly schedules were not used. The fifth change was incorporating a more detailed analysis of infiltration by including the effects of both stack effect and wind. Stack effect and wind are significant factors in high-rise buildings. The sixth change was creating a new ventilation model to account for the operation of bathroom exhaust fans, kitchen exhaust fans, electrical room exhaust fans, garbage room exhaust fans, make up air units, and system ventilation inefficiencies. The seventh change was creating a basic system for calculating energy consumption of space heating, space cooling, ventilation heating, ventilation cooling, ventilation distribution, and DHW heating. Each of these seven changes is described in detail below. A significant reference used in the development of BELA MURB High-Rise Edition was the Building America House Simulation Protocol by Robert Hendron and Cheryn Engebrecht of the National Renewable Energy Laboratory (2010). It was developed specifically to support inputs for hourly building energy simulation tools, which is the intent of BELA. This reference was useful for a number of reasons; it considers pre-retrofit specifications for simulating existing homes which is the same intention for the Archetype s energy use. This document provides simulation data for MURBs which is less common than data for single family homes. This document covers a lot of the requirements of BELA including electricity loads for each appliance on a number of bedrooms basis, both sensible and latent heat gains, DHW usage based on number of bedrooms for each end use, an equation for water main temperature, and an equation for occupancy based on number of bedrooms for multi-family dwellings. It also includes hourly schedules which are useful in BELA Exterior Convection Coefficient and Thermal Mass The exterior convection coefficient was calculated based on an empirical correlation with wind speed presented in Equation 9 (LBL, 1982). (9) Where h c = surface film coefficient, W/m 2 C V w = wind speed, m/s 90
105 The coefficients in Equation 9 are for brick and rough plaster (LBL, 1982). This equation is used in DOE-2 calculations. The yearly average convection coefficient based on a typical meteorological year for Toronto International airport was found to be 33 W/m 2 C. The original BELA used the weighting factor method to account for thermal mass. This method was also used for the MURB high-rise edition except it was extended to consider thermally massive construction more typical of the Archetype style buildings. The effects of thermal mass for thermally massive construction are calculated by considering the instantaneous gains or losses from the previous two hours. The heating or cooling load is calculated using Equation 10 from Chapter 19 of the Handbook of Fundamentals (ASHRAE, 2009). (10) Where q θ = Instantaneous heat gains or losses at hour θ q θ-1 = Instantaneous heat gains or losses at hour θ-1 q θ-2 = Instantaneous heat gains or losses at hour θ-2 Q θ = Heating or cooling load at hour θ Q θ-1 = Heating or cooling load at hour θ-1 Q θ-2 = Heating or cooling load at hour θ-2 V o, V 1, V 2, W 1, and W 2 = Weighting factors from Table 4-2 Table 4-2: Weighting Factors for Thermally Massive Construction (Hanam, 2010) Loads V 0 V 1 V 2 W 1 W 2 Conduction Solar Heat Gain People & Equipment General Lighting Task Lighting Table 4-2 illustrates the empirical coefficients used to manipulate loads to account for thermal mass effects in thermally massive construction. The parameter percentage of heavy construction in the MURB High-Rise Edition allows the user to enter 100% if the building is thermally massive and 0% 91
106 if the building is lightweight. The user can also enter a percentage in between and the model will linearly interpolate between the two approaches to account for varying levels of thermal mass MURB Units and Occupancy A new section of inputs was added to describe the number and size of units as well as the occupancy and common area per floor. A screen shot of these inputs is illustrated in Figure 4-2. Units, Common Areas, and Occupants per Floor 3 Bedroom Units 0 Occupants per 3 Bedroom Unit 3.05 Finished Floor Area/Unit 89 m 2 Occupants per 2 Bedroom Unit Bedroom Units 8 Occupants per 1 Bedroom Unit 1.40 Finished Floor Area/Unit 70 m 2 Occupants per Bachelor Unit Bedroom Units 4 Occupants Finished Floor Area/Unit 52 m 2 Bachelor Units 2 Total Units 14 Finished Floor Area/Unit 34 m 2 Total Bedrooms 20 Occupancy Percentage 90% Approx. FFA of Units 836 m 2 Common Area 105 m 2 Approx. FFA 941 m 2 Figure 4-2: BELA MURB High-Rise Edition Inputs for Units Figure 4-2 illustrates the input cells highlighted in yellow. They include the number of bachelor, one, two, and three bedroom units per floor. The corresponding finished floor areas per unit are also entered. The input for occupancy percentage allows the user to account for vacancies and different types of occupancy. The common area input accounts for hallways, electrical rooms, stairwells, and garbage rooms. This model considers all floors to be the same; in reality the first floor and penthouse are usually different. These two floors represent a small portion of a high-rise MURB and generally are not dramatically different in terms of energy consumption than a typical floor. Therefore, this should not make a significant difference on the whole building s energy consumption; however the user of the model should be aware of this. The highlighted blue cells in Figure 4-2 are calculated values based on the inputs. They consist of occupants per unit type. These values are calculated based on Equation 11 of Hendron and Engebrecht (2010). Where N occ = Number of occupants 92 (11)
107 N br = Number of bedrooms Equation 11 was used for modeling number of occupants in a multi-family dwelling during nonvacation periods. A bachelor unit was assumed to have one occupant. The numbers of occupants illustrated in blue have also been multiplied by the occupancy percentage. The occupants cell presents the number of occupants per floor. The approximate finished floor area (FFA) of the units per floor and entire floor are also calculated. The wall area percentage is calculated based on the building width and length inputs to ensure that the FFA inputs make sense; a reasonable wall area percentage for a building like the Archetype is approximately 10%. The daily occupancy schedule used for MURBs is illustrated in Figure 4-3 Figure 4-3: Daily Occupancy Schedule (Hendron, R. And Engebrecht, C., 2010) Figure 4-3 illustrates that from the hours of 10pm through 7am 100% of the occupancy is modeled as being in the building. During the hours of 10am through 4pm approximately 77% of the occupancy is vacant. Overall 16.5 hours/day/person are spent in the building. These values are generalized for all day types and family types. The values from this chart have been approximated and entered into the daily occupancy schedule. The peak residential internal gains from occupancy are 64.5 watts per person of sensible heat and 48.1 watts per person of latent load (Hendron, R. and Engebrecht, C., 2010) Domestic Hot Water The DHW usages per capita for each of the primary DHW household uses are illustrated in Table

108 Table 4-3: Per Capita Hot Water Use (DeOreo, W. and Mayer, P., 1999) Category Per Capita Hot Water Use (l/day) Bath 15.9 Clothes Washer 14.8 Dishwasher 3.4 Faucet 32.6 Leak 4.5 Shower 23.8 Toilet 0.0 Other 0.04 Total 95.0 Table 4-3 illustrates the hot water use for seven significant household water use categories. The data is based on 10 households over 14 days with an average number of residents of 2.6. BELA MURB High-Rise Edition uses these values in calculating the DHW used by each type of unit based on the assumed number of occupants. The DHW calculations for each type of unit in BELA MURB High- Rise Edition are illustrated in Figure 4-4. Figure 4-4: BELA MURB High-Rise Edition DHW Calculations Figure 4-4 is a screen shot illustrating the total DHW consumption in l/day/unit for each type of unit. Each of the primary DHW uses is shown in its own row. The amount of DHW use was calculated on a per capita basis and thus different for each unit type. The total DHW use was calculated by 94
109 multiplying each unit total by the number of that specific unit type in the building being simulated and combining them which results in a total building DHW usage in l/day DHW Heating Load The total building s DHW use in l/day illustrated in Figure 4-4 was used to calculate the energy required to heat the DHW: (11) Where Q DHW,Heat = Energy required to heat the DHW in kw/hr Q DHW = DHW flow rate in l/hr C p = Specific heat capacity of water in J/kg k ρ = Density of water in kg/l T tank = Temperature of DHW tank in k T inlet = Temperature of inlet water in k η = DHW heating efficiency in % This equation was developed from first principles. The 3600 value converts seconds into hours and the 1000 converts J/s into kw J/kg k and kg/l were used for the specific heat capacity and density of water, respectively. The DHW tank temperature is an input; 60 C is a common temperature. The water inlet temperature was calculated using Equation 12 (Hendron, R. and Engebrecht, C., 2010). (12) Where T inlet = Inlet temperature to DHW tank ( F) T avg = Annual average ambient air temperature ( F) Offset = 6 F Ratio = (T avg -44) T max = Maximum difference between monthly average ambient temperature ( F) (eg. T avg,july - T avg,january ) 95
110 0.986 = Degrees per day (360 /365days) Day# = Day of the year (1 to 365) Lag = (T avg -44) Equation 12 estimates the inlet temperature by using the average ambient air temperature over the year, coldest month (January), and warmest month (July). The values are then distributed over the year using a sine wave. The DHW heating efficiency parameter is used to account for the overall efficiency of the DHW heating system; 70% is a common efficiency but this can be changed in BELA. The DHW flow rate in Equation 11 was calculated by multiplying the total building s DHW use in l/day by the hourly percentage of DHW in the daily schedule section. The hourly percentage of daily DHW use was obtained from Figure 4-5 and Figure 4-6. Figure 4-5: Average Daily DHW Consumption for Canada in litres per hour (Knight, I. et al., 2007) Figure 4-5 illustrates the average DHW consumption for an average Canadian household over an average day. The hourly values were approximated from the chart and used to calculate the percentage of daily DHW consumption every hour. 96
111 Figure 4-6: Average Hot Water Consumption "CEA Typical" Household (Barakat, S., 1984) Figure 4-6 illustrates the average DHW consumption in a Canadian Electrical Association (CEA) typical household. The data was obtained from a survey for the CEA. The daily average hourly values were approximated from the chart and used to calculate the percentage of daily DHW consumption every hour. The hourly percentages of daily DHW usage for the two sources are plotted along with the average of the two in Figure
112 Figure 4-7: Domestic Hot Water Consumption Figure 4-7 illustrates that the peak hourly DHW use occurs at 8am and varies between 10% and 20% for the two sources. The study by Knight (2007) indicates a more abrupt use of DHW compared to the study by Barakat (1984). In reality, the hourly DHW use can vary dramatically. The distribution of DHW use throughout the day is less important than the accurate quantity of DHW use in terms of whole building energy modeling. The average of the two sources was used for the DHW hourly schedule in BELA MURB High-Rise Edition Internal Gains from Domestic Hot Water The use of DHW creates both a sensible and latent heat gain in buildings. The sensible heat gain from typical water consumption in a household is minimal. According to Barakat (1984), In most cases these gains can be neglected, particularly in locations where the average cold water supply temperature is low (less than about 10 C), which is typical of most locations in Canada and northern United States. Barakat measured the water inlet temperature, hot water tank temperature, and drain temperature in an experimental household. The data was used with Equation 13 from Barakat (1984) to calculate the net heat gain from water usage. Although the experimental household was a single family home with two-stories, three bedrooms, and a full basement, the percentage of sensible heat gain data was assumed to be similar to MURBs. The services considered in the experiment were: bathroom sink, kitchen sink, shower, bath, toilet, dishwasher, and washing machine. 98
113 (13) Where Q f = Net heat gain ρ = Water density C p = Specific heat capacity of water V h = Volume of DHW T h = Temperature of DHW in tank V c = Volume of cold water T c = Temperature of cold water T d = Temperature of drain water The results Barakat obtained from the experiment using Equation 13 are summarized in Table 4-4. Use Profile Spring (T c = 3 C) Table 4-4: Net Heat Gain from Water Use (Barakat, S., 1984) Hot Water Consumption, l/day Hot Water Energy Content, MJ 99 Net Heat Gain, MJ Percentage Gain, % Light % Heavy % Very Heavy % CEA % Fall (T c = 13 C) Light % Heavy % Very Heavy % CEA % Table 4-4 illustrates the energy used to heat the specific volume of DHW in the experimental household for four levels of DHW users. The light, heavy, and very heavy water users use an average of approximately 220, 320, and 510 l/day of DHW, respectively. Barakat also found that heat losses also occurred because of the cold toilet water gaining heat before being flushed. Under certain circumstances the heat gains were overcome by these heat losses illustrated by negative net heat gains and negative percentage gains in Table 4-4. This table also illustrates the significance of the season;
114 during the colder ground temperatures the percentage gain is smaller than during the warmer ground temperatures. The average percentage gain for the light, heavy, and very heavy water users during the coldest inlet water temperature of 3 C is approximately 1%. During the warmest inlet water temperature of 13 C the average is approximately 8%. The percentage of sensible heat gain was linearly interpolated between 1% and 8% based on the cold water inlet temperature. The monthly ground temperature four metres below grade was used as the cold water inlet temperature previously assumed in Equation 12. The latent load calculations are illustrated in Table 4-5 (Hendron, R. and Engebrecht, C., 2010). Table 4-5: Latent Load Calculations Latent Source (Hendron, R. and Engebrecht, C., 2010) Shower (Btu/day) Sinks (Btu/day) Dishwasher (kwh/yr) Electric Range (kwh/yr) BELA Formula (kwh/day) Other (kwh/yr) Table 4-5 illustrates the four major sources of DHW latent load plus an other source accounting for all minor sources. The Building America House Simulation Protocols (Hendron, R. and Engebrecht, C., 2010) provides various formulas for the different latent sources. These formulas were adjusted to produce a load in kilowatt hours per day. The calculations are based on the number of bedrooms so each type of unit was calculated separately. The BELA MURB High-Rise Edition DHW latent load outputs are illustrated in Figure


115 Figure 4-8: BELA MURB High-Rise Edition DHW Latent Load Calculations Figure 4-8 illustrates a range of daily DHW latent loads from 1.3 to 2.3 kwh for the different unit types. The DHW schedule previously created for DHW heating load was also used to convert the total building s DHW latent load to kilowatts for every hour of the day Miscellaneous Electrical Loads The values for the miscellaneous electrical loads from BELA MURB High-Rise Edition are illustrated in Figure 4-9. Figure 4-9: BELA MURB High-Rise Edition Miscellaneous Electrical Load Calculations Figure 4-9 illustrates the five primary appliance electrical loads in MURBs along with lighting and other sources. The sensible load fractions used to convert the MEL energy to sensible loads are also illustrated in this figure (Hendron, R. and Engebrecht, C., 2010). The latent loads from all these sources are accounted for within the DHW calculations described in Section
116 Appliances It is assumed that all four types of units have one refrigerator, clothes washer, clothes dryer, dishwasher, and range. The annual energy use of each of the five major appliances was taken from the 2008 Canadian stock of electric appliances in the Residential Appliance Unit Energy Consumption (NRCan, 2011) Lighting There is a significant difference in energy of various types of lighting technologies from incandescent to compact fluorescent. According to the Comprehensive Energy Use Database, (NRCan, 2011) apartment buildings in 2008 used 7.8 petajoules of energy for lighting and comprised 355 million m 2 of floor space resulting in a lighting intensity of approximately 6.1 kwh/year/m 2. According to Annex 42 of the International Energy Agency (Knight, I., 2007) the average Canadian household uses 14.4 kwh/year/m 2. Using T12 fixtures in the common areas and incandescent fixtures in the suites results in a lighting capacity of approximately 10.1 W/m 2 (Enermodal, 2005). If the common area lighting operates continuously and the units lighting operates 5.6 hours per day according to ASHRAE 90.1 reported by Enermodal (2005), the overall lighting intensity would be approximately 27.5 kwh/year/m 2. The average of 6.1, 14.4, and 27.5 kwh/year/m 2 is 16 kwh/year/m 2 which was used for modeling the Archetype. This is an input and hence can be changed if more information is available Other Electrical Loads Other electrical loads include all minor appliances including televisions, laptops, alarm clocks, and coffee makers. Since these electrical loads are more likely to stay current, they were estimated based on current data. Equation 14 was used to estimate the other loads within each of the unit types (Hendron, R. And Engebrecht, C., 2010). (14) Where N br = Number of bedrooms FFA = Finished floor area (ft 2 ) The elevator s electrical load is also considered in other electrical loads under the common area in Figure 4-9. An elevator uses approximately 1900 kwh/year (Hendron, R. And Engebrecht, C., 2010). The elevator load was calculated by multiplying the number of elevators input by 1900 kwh/year and dividing out the number of stories to produce an electrical load in kwh/year/storey. The sensible load 102

117 from the elevator was assumed to be negligible since the location of the elevator motor usually provides little effect on the internal heat gain. This should be refined in future work as elevator usage will depend on the size of each floor as well as the number of floors Miscellaneous Electrical Loads Schedule The daily schedule for the MEL was calculated based on Figure Figure 4-10: Miscellaneous Electrical Loads Daily Usage (Hendron, R. And Engebrecht, C., 2010) The fractions at each hour were estimated from Figure 4-10 and used in the schedule for MEL in BELA MURB High-Rise Edition. The fractions are based on total daily usage which was previously calculated Air Leakage Model The expanded air leakage model in BELA MURB High-Rise Edition requires more inputs because the type of building is different. High-rise MURBs are more affected by stack effect and wind pressures. These inputs are illustrated in Figure
118 AIR LEAKAGE CHARACTERISTICS Overall Average Flow Coefficient (OAFC) l/s-pa n -m2 wall Overall Average Pressure Exponent Pressure Difference Coefficient (Windward) 0.96 Gradient Height of Meteorological Station 173 m Anemometer height of Meteorol. Station 30 m Gradient Height of Building Site 173 m Thermal Draft Coefficient 0.63 Normalized Neutral Pressure Plane 0.7 Figure 4-11: BELA MURB High-Rise Edition Air Leakage Characteristics Inputs Figure 4-11 illustrates the two primary building air leakage characteristics: Overall Average Flow Coefficient in l/s Pa n per m 2 of enclosure wall and Overall Average Pressure Exponent. These two values, l/s Pa n m 2 and were approximated for the Archetype in Section The windward mean pressure difference coefficient of 0.96 is for wind acting normal to the long wall. (Shaw, C. and Tamura, G., 1977) All other wind angles are accounted for using empirical factors described in Section The gradient height of the meteorological station, anemometer height of meteorological station, and gradient height of building site are inputs used to adjust the weather file s wind speeds to wind speeds around the building. The thermal draft coefficient (TDC) accounts for the vertical air flow reduction where one indicates the complete freedom for air to move vertically. A TDC range of 0.63 to 0.82 was measured for three high-rise commercial buildings ranging from 17 to 44 stories (Tamura, G. and Wilson, A., 1967). Since residential buildings generally have more restriction to vertical air movement than commercial buildings, the 0.63 value was used. Figure 4-11 list a value of 0.7 for the normalized neutral pressure plane (NPP). Stack effect in buildings causes pressure differences across the enclosure to increase or decrease approximately linearly from top to bottom. The NPP location is the height at which that pressure difference becomes zero. The normalized NPP is the NPP location divided by the building height. A normalized NPP of 0.7 was used based on Proskiw and Phillips research (2006). These inputs are used for either the infiltration calculations based on wind effect or stack effect Implementing Wind Effect Infiltration The infiltration rate due to wind effect in BELA High-Rise Edition was calculated using Equation 15. (Shaw, C. and Tamura, G., 1977) 104
119 (15) Where Q w = infiltration rate due to wind (m 3 /s) C = overall average flow coefficient (m 3 /s/pa n /m 2 ) A = area of enclosure wall (m 2 ) ΔP w = pressure difference across the enclosure due to wind (Pa) n = overall average pressure exponent α w = wind angle correction factor The pressure difference across the enclosure due to wind was calculated using Equation 16. This equation was created using the formulas in Shaw and Tamura s report (1977). (16) Where ρ tot = total of the air density and vapour density (kg/m 3 ) C pm = mean pressure difference coefficient v w = wind speed at anemometer height (m/s) G s = gradient height of the meteorological station (m) Z s = anemometer height at the meteorological station (m) H = height of building (m) G = gradient height at the building site (m) The wind angle correction factor was estimated from Figure 4-12 (Shaw, C. and Tamura, G., 1977). 105
120 Figure 4-12: Correction Factor of Air Infiltration Rates Due to Wind Approaching at Various Directions (Shaw, C. and Tamura, G., 1977) Figure 4-12 illustrates that when the wind is acting perpendicular to the long side of the building, theta equal to zero, the correction factor is one which causes the largest wind induced infiltration. The other angles of approaching wind produce different pressures resulting in lower rates of infiltration. This chart was created using a wind tunnel and a scaled rectangular building model with a length to width ratio of 2:1. The Archetype has a length to width ratio of approximately 5:1. Shaw and Tamura tested 1:1, 1.5:1, and 2:1, the differences between the last two are less than the differences between the first two. Since this was the case, correction factor differences between 2:1 and 5:1 ratios was assumed to be small. The correction factor was estimated from Figure 4-12 for every 10 degrees of wind direction. The hourly wind directions provided by the weather files are from 0 to 360 degrees, so they were converted to approaching angles of 0 degrees for wind perpendicular to the long side up to 90 degrees for wind parallel to the long side of the building. The approaching angles were also divided into ten degree increments to match up with the ten degree increments estimated from Figure Implementing Stack Effect Infiltration The infiltration rate due to stack effect in BELA High-Rise Edition was calculated using Equation 17. (Shaw, C. and Tamura, G., 1977) (17) 106
121 Where Q s = infiltration rate due to stack effect (m 3 /s) C = overall average flow coefficient (m 3 /s/pa n /m 2 ) S = perimeter of building (m) γ = thermal draft coefficient p atm = atmospheric pressure (Pa) ΔT = indoor to outdoor temperature difference (K) T i = indoor temperature (K) T o = outdoor temperature (K) n = overall average pressure exponent β = thermal draft coefficient H = building height (m) The infiltration rates due to stack effect and wind effect are calculated and combined every hour. Equation 6 previously described in Section was used to combine them. 107
122 4.2.6 Ventilation System The ventilation system for BELA MURB High-Rise Edition considers a corridor pressurization system. The ventilation system could have either a central exhaust or individual exhaust illustrated in Figure 4-13 and Figure 4-14, respectively. This is the most common method of ventilating MURBs even today. Figure 4-13: BELA MURB High-Rise Edition Central Exhaust Ventilation Flow Chart 108
123 Figure 4-14: BELA MURB High-Rise Edition Individual Exhaust Ventilation Flow Chart Figure 4-13 and Figure 4-14 illustrate the ventilation air flow systems and all there components. A make up air unit has a fan (illustrated in green) that forces ventilation air through a heating and/or cooling system (illustrated in red) before being distributed to all the corridors in the building. The pressurized corridor s air is driven to a number of locations by the pressure differences and openings to each of the locations including: suites, elevators, stairwells, and garbage chute. The operation of the bathroom and kitchen fans (illustrated in dark blue) depressurizes the unit drawing ventilation air into the unit. The operation of the garbage chute and electrical room fans function the same way. The operation of a central exhaust fan (illustrated in orange) in Figure 4-13 can provide a continuous depressurization in the units, garbage chute and electrical rooms to drive the ventilation process. The loss of ventilation air through the elevator shaft and stairwells short circuits the ventilation system 109
124 causing the actual ventilation to be far less than the design ventilation. However, the energy in supplying, heating, and cooling that lost air is still consumed and accounted for in the model. Energy is consumed by ventilation in the form of heating and cooling of the air, and the energy to operate the supply and exhaust fans. The heating, cooling, and supply distribution loads specifically require the calculation of the make-up air flow capacity. BELA MURB High-Rise Edition assumes the exhaust capacity is the same as the supply capacity since this is true for most towers and hence the Archetype so the exhaust distribution load also uses the make-up air flow capacity. The model calculates the make-up air flow capacity by multiplying the design ventilation rate in units of l/s per person by the maximum occupancy of the building. The ventilation heating and cooling loads were calculated based on the original BELA calculations (Hanam, 2010). The make-up air flow capacity was multiplied by the make-up air units operating schedule and used to calculate the sensible load and latent load. The sensible load and latent load were multiplied by the heat recovery ventilator (HRV) and enthalpy recovery ventilator (ERV) efficiencies, respectively. They were then used to calculate the ventilation heating and cooling loads. The ventilation supply and exhaust distribution loads were calculated using Equation 18. All fans are assumed to operate as either fully on or off. The operation of the make-up air supply fan and exhaust fans are governed by their respective schedules. (18) Where ϵ fan = Fan load (kw) q = Air flow (l/s) ω = Maximum design fan power rating (kw/l/s) The air flow was calculated by multiplying the make-up air flow capacity by the make-up air unit fan or the exhaust fans schedules. The maximum design fan power ratings are different for the make-up air unit and the exhaust fans. The inputs used to model the Archetype s ventilation loads in BELA MURB High-Rise Edition are illustrated in Figure

125 Figure 4-15: BELA MURB High-Rise Edition Ventilation Inputs Figure 4-15 illustrates the inputs for ventilation supply capacity, maximum fan power ratings, and recovery ventilator efficiencies. Most towers and hence the archetype do not have either an HRV or ERV. In order to model this, the HRV and ERV efficiencies were set to zero. An HRV or ERV would be ideal for the towers with central exhaust since they are usually in the same mechanical penthouse as the make-up air unit. HRV and ERV systems would require a major retrofit for the towers that exhaust out of each suite Space Conditioning Analysis In order to calculate overall energy consumption for the building, the heating and cooling system must be considered. Since the intent of BELA MURB High-Rise Edition is not for the design or analysis of the mechanical systems, a general approach was used to consider the heating and cooling systems. The inputs for the systems are illustrated in Figure ELECTRIC BASEBOARD HEATING, WINDOW A/C COOLING, AND GAS BOILER DHW HEATING Unit Heating Efficiency 100% MUAU Heating Efficiency 70% Unit Window A/C COP 3 MUAU A/C COP 3.5 Percentage of Units with Window A/C 50% DHW Heating Efficiency 70% Figure 4-16: BELA MURB High-Rise Edition System Inputs Figure 4-16 illustrates the inputs for efficiencies (or coefficients of performance (COP)) for electric baseboard heating, window air conditioner (A/C) cooling, and gas boiler for DHW heating. These are very commonly used systems and hence are the systems assumed in the Archetype. The percentage of units with window A/C accounts for the fact that many unit owners choose not to install cooling. The energy demands are separated into: space heating, space cooling, ventilation distribution, ventilation heating, ventilation cooling, miscellaneous electrical loads, and domestic hot water. The space heating is calculated by dividing the space heating load by the unit heating efficiency. Electric baseboard heating is 100% efficient because all the electricity put through the heating coils enters the 111
126 unit as heat. The space cooling demand is calculated by dividing the space cooling load by the unit window A/C COP and multiplying by the percentage of units with window A/C. Three is a reasonable COP for modern window A/C units and 50% was chosen as a mid-range estimate (the percentage of units with window A/C varies significantly). The sensible load fraction of the window A/C units was not considered. The ventilation distribution energy demand was described previously in Section The ventilation heating demand was calculated by dividing the ventilation heating load by the make-up air unit heating efficiency. A gas furnace with an efficiency of 70% was chosen as a reasonable estimate for the Archetype. The ventilation cooling demand was calculated by dividing the ventilation cooling load by the make-up air unit A/C COP. A COP of 3.5 was assumed since a large centralized A/C unit or cooling tower would likely be more efficient than the window A/C units. The MEL energy demand was calculated by multiplying the MEL energy previously calculated in Section by the MEL schedule previously described in Section The DHW energy demand was previously calculated in Section using the DHW heating efficiency of 70% which is reasonable for a centralized gas boiler. The total energy demand was calculated by combining all seven energy demands. All of these energy demands for the Archetype are presented in Section Simulated Energy Use of the Archetype Using the BELA MURB High Edition developed, and the assumptions described for the hydronicallyand electrically-heated Archetypes, the energy usages were calculated. The results are presented below and analyzed Simulated Annual Energy Consumption of the Archetype The monthly energy density for the hydronically- and electrically-heated Archetypes for all the demands and the totals are illustrated in Figure 4-17 and Figure


127 Figure 4-17: Monthly Energy Intensity Demands for the Hydronically-Heated Archetype Figure 4-18: Monthly Energy Intensity Demands for the Electrically-Heated Archetype Figure 4-17 and Figure 4-18 illustrate a total estimated energy intensity of approximately 390kWh/m 2 and 350kWh/m 2 for the hydronically- and electrically-heated Archetypes, respectively. The most significant demand is space heating with 161 and 129kWh/m 2 for the hydronically- and electricallyheated Archetypes, respectively. BELA MURB High-Rise Edition also outputs the monthly energy density in the form of bar graphs illustrated in Figure 4-19 and Figure
128 Figure 4-19: Monthly Energy Density Bar Graph for the Hydronically-Heated Archetype Figure 4-20: Monthly Energy Density Bar Graph for the Electrically-Heated Archetype Figure 4-19 and Figure 4-20 illustrate the seasonal change in energy intensity demand. January consumes the most energy with an intensity of 53 and 47kWh/m 2 for the hydronically- and 114

129 electrically-heated Archetypes, respectively. The January energy intensities are more than three times July and August indicating the significant heating load during colder months. The DHW and MEL demands remain consistent throughout the year. The space heating and ventilation heating demands are significant and seasonally influenced. These demands are also presented in percentage form illustrated in Figure 4-21 and Figure Figure 4-21: Energy Demand Percentages for the Hydronically-Heated Archetype 115

130 Figure 4-22: Energy Demand Percentages for the Electrically-Heated Archetype Figure 4-21 and Figure 4-22 illustrate that space and ventilation heating accounts for approximately 60% of the overall annual energy demand for both the hydronically- and electrically-heated Archetypes. DHW and MEL each account for approximately 20% of the annual energy demand. The space cooling and ventilation distribution energy demands are relatively small. The ventilation cooling and space distribution energy demands are almost negligible Comparison to Measured Average Annual Energy Consumption of Towers Natural gas and electricity consumption data were recorded from 34 MURBs mostly from the GTA. The 34 MURBs were separated into four different classifications illustrated in Table
131 Table 4-6: Annual Energy Consumption of Four Types of Apartment Towers (CMHC, 2005) Group Central A/C No Yes No No Heating Source Electric Natural Gas Natural Gas Natural Gas In-suite electricity included Yes Yes Yes No Sample Size Annual Natural Gas Consumption (ekwh/m 2 ) Annual Electricity Consumption (kwh/m 2 ) Total Annual Energy Consumption (ekwh/m 2 ) Table 4-6 illustrates that group one is the most common to the modeled electrically-heated Archetype. Group one has no central A/C, electric baseboard heating, and in-suite electricity or MEL is included. This set of three buildings has an average annual energy consumption of 340 ekwh/m 2 which is close to the 350 kwh/m 2 estimated for the Archetype. The remaining 31 buildings are heated by central gas fired boilers connected to in-suite baseboard convectors or fan-coils (i.e. similar to the hydronicallyheated Archetype). Their measured consumption ranged from 281 to 581 ekwh/m 2 with an average of approximately 400 ekwh/m 2 which is close to the 390 kwh/m 2 calculated for the hydronically-heated Archetype by BELA. All the buildings domestic hot water was heated by centralized gas-fired boilers similar to the modeled Archetypes. Overall, it was found that for the gas heated buildings, approximately half of the annual average energy went to space heating, and a quarter went to both electricity and domestic hot water results similar to the modeled Archetypes. (CMHC, 2005) The Canada Mortgage and Housing Corporation s HiSTAR database contains 81 MURBs with their physical and operational characteristics and recorded energy consumption. 46 of these buildings were built during the 1970s. The average annual utility energy for 22 Ontario MURBs between 10,000 and 20,000 m 2 (the modeled Archetypes have approximately 20,000 m 2 ) is 310 ekwh/m 2 (Enermodal, 2005). Twenty-six buildings built between the years 1961 and 1980 were monitored for average annual energy consumption. These buildings were found to use 317 ekwh/m 2 (CMHC, 2001). According to page 107 of the Tower Renewal Guidelines the average 1960`s and 1970`s high-rise apartment in a Toronto climate uses approximately ekwh/m 2 (Kesik and Saleff, 2009). The annual energy consumption averages reported by these three studies combine for an average annual energy consumption of approximately 317 ekwh/m 2. This is approximately 15% less than the 117

132 modeled Archetypes; however the characteristics of the Archetype were generally chosen to have slightly more energy consuming characteristics. Overall, the reported existing annual energy uses of the towers were close to the simulated annual energy use of the Archetype. Thus, the inputs for the Archetype characteristics were assumed to satisfactorily represent the towers. The BELA MURB High-Rise Edition model was also assumed to satisfactorily simulate the towers. Based on these results, confidence is attained in simulating and analyzing pre- and post-retrofit effects on energy consumption as discussed in the following chapter Archetype Loads Analysis According to the results of Section 4.3.1, space and ventilation heating comprise approximately 60% of the annual energy demand while cooling comprises less than 2%. An analysis of the heating loads during the coldest month was completed because of the significant heating energy consumption. The Archetype s January heating loads are illustrated in Figure Figure 4-23: Archetype's January Heating Loads Figure 4-23 illustrates that the cold weather heating loads are approximately split 1:2:2 for ventilation, infiltration, and conduction. Reducing ventilation or recovering ventilation heat, air tightening the enclosure, and insulating are apparent solutions to significantly reducing the heating load of the towers. The Archetype s monthly load density is illustrated in Figure
133 Figure 4-24: Archetype's Monthly Load Intensity Figure 4-24 illustrates a consistent heat gain of approximately 7kWh/m 2 comprised of DHW, MEL, occupants, and solar heat gain through windows. The heat loss is significantly seasonal with a range from approximately 2kWh/m 2 during the summer to over 30kWh/m 2 during the winter. 119
134 Chapter 5 Energy and Durability Impacts of Tower Retrofits This chapter discusses the primary effects of retrofitting the enclosure of the towers. The effects analyzed, simulated, and/or discussed include: Air, vapour, heat, and moisture control Enclosure retrofit details such as material options Effective thermal resistances for various enclosure retrofit options Energy efficiency measures to compliment the enclosure retrofits Durability impacts including interstitial and surface condensation potential Comfort impacts such as mean radiant temperature and passive control Interior versus exterior enclosure retrofit comparison Potential annual energy reduction General impact on the reduction of greenhouse gas emissions The Archetype, Therm, and BELA MURB High-Rise Edition described in the previous chapters were used in the majority of the simulated effects of the enclosure retrofits. This chapter will first describe the functions of the enclosure and then proceed to investigate retrofitting impacts. 5.1 Function of the Enclosure The enclosure separates the interior from the exterior and provides the finished look of a building. Since the enclosure is more often seen than the superstructure, owners, occupants, and the public put more emphasize on the visual appeal of the enclosure. Aside from appearance, the enclosures operation influences comfort, energy efficiency, durability, and occupant satisfaction. Three subcategories of the enclosures physical separation requirement are: 1. Support The enclosure must accommodate the structural loads imposed on it from wind, gravity, snow, etc. and transfer them to the superstructure. 2. Control The enclosure must block or regulate the flow of mass and energy between interior and exterior including rain, vapour, heat, sound, etc. 120
135 3. Finish The enclosures interior and exterior surfaces must interface with the interior and exterior environments in order to meet the requirements of aesthetics, abuse, ease of cleaning, etc. The enclosure can also be used as a distribution channel for distributing services such as cables, ducts, piping, etc. The support and control layers are required to be continuous and present everywhere. The lack of continuity is the cause of the vast majority of enclosure performance problems. The support function is critical because without it, all the other functions would be useless. Assuming it is functioning adequately, the next most important function is control. The most common required enclosure control functions include rain, air, heat, vapour, fire, sound, light, insects, particulates, and access. All of these control functions must be continuous throughout the building enclosure in order to physically perform. In terms of durability, the order of importance is generally considered to be: rain control, airflow control, thermal control, and vapour control. The finish function which does not have to be continuous is often referred to as cladding or interior finishes even though cladding sometimes includes control functions. Although support and finish functions are referenced throughout this thesis, the primary focus of the analysis of enclosure retrofits on the towers is the control function. As such, the following section will discuss the control functions and the layers relating to the towers enclosure in more detail Enclosure Control Layers As previously discussed, the control layer must control water, air, heat, and vapour. A conceptual building enclosure with its control function divided into its four primary layers is presented in Figure

136 Figure 5-1: Conceptual Building Enclosure with its Functional Layers In addition to functioning as a finish, the exterior finish layer can provide sun protection to the underlying layers and contributes to rain and fire control. Figure 5-1 illustrates the exterior finish layer not in direct contact with the layers behind it allowing it to also provide a ventilated air gap for drying. This successful design approach, developed and popularized by Canadian researchers (Hutcheon, N., 1964), also provides a continuous thermal control layer on the exterior side of the continuous water, air, and vapour control layers resulting in a durable and high performance cold climate enclosure. The existing control layers for the towers are generalized for the Archetype and illustrated in Figure

137 Figure 5-2: Archetype Section Detail The Archetype, like almost all of the towers, has poorly defined and discontinuous air, rain, water, and thermal control layers. The four inch brick-facing and masonry block functions as part of a mass rain control system and is relied upon to control water, air, and vapour. In some cases parging on the interior acted as the air control layer. The one inch of interior insulation controls heat. The mass storage system is less successful than a drained system because the storage capacity can often be overwhelmed, leading to leaks, and moisture absorbed in the masonry can lead to freeze thaw damage. The towers interior insulation adds to this problem by keeping the masonry colder. The effects on durability will be discussed in Section 5.6. The concrete block also provides lateral support to transfer wind loads to the primary structure. Two general approaches that can be used to provide dedicated control layers to the towers enclosure are from the interior or exterior of the existing enclosure. A general interior enclosure retrofit is illustrated in Figure
138 Figure 5-3: Interior Enclosure Retrofit Figure 5-3 illustrates the addition of insulation on the inside of the existing gypsum plaster to provide the desired level of thermal resistance. The addition of an air control and a vapour control layer on the inside of the new insulation results in these control layers functioning more effectively on the correct side of the thermal control layer. The air, vapour, and thermal layers still remain discontinuous. Also, the rain control still functions as a mass system. The existing brick and block would continue to function as the lateral support. A general exterior enclosure retrofit is illustrated in Figure

139 Figure 5-4: Exterior Enclosure Retrofit Figure 5-4 illustrates the addition of continuous air, moisture, and vapour control layers on the exterior of the existing brick face. The addition of continuous insulation on the exterior of the air, moisture, and vapour control layers results in the layers functioning more effectively in the correct order. The addition of a drainage plane and drainage gap and exterior finish layer over a ventilated air space converts the existing mass system to a drained and ventilated system. The air and water control layer installed on the exterior can be continuous resulting in a more air and water tight assembly. The vapour and moisture control layer installed on the exterior and the addition of the rainscreen protects the brick, block, and concrete slab edge from moisture and associated damages and unsightly efflorescence. The function of the brick and block would be reduced to just lateral support. The thermal control layer installed on the exterior can also be continuous eliminating thermal bridging through the concrete slab. The exterior thermal control layer reduces the temperatures that the brick and concrete experiences which can eliminate the potential for freeze-thaw damage to occur. The additional exterior thermal control layer improves the overall thermal resistance of the enclosure effectively. The new cladding provides the opportunity for new exterior finish possibilities. The exterior enclosure retrofit reduces the significance of the interior insulation and thus the existing interior finish and insulation could be removed if desired. 125
140 5.1.2 Enclosure Retrofit Details Both the interior and exterior enclosure retrofit approaches are quite flexible. Many different materials can be used to meet the architectural, budget, and performance needs of a range of projects. For example, the following materials that could be used for the air control layer for interior or exterior retrofit options include: Liquid-applied polymeric or asphalt-based membranes (also water and vapour) Closed cell spray foams (also vapour and thermal) Some open-cell spray foam (also thermal) Taped and sealed polyethylene-fiber or spun-bonded polyolefin membranes (also rain) Self-adhered membranes (also vapour and rain) Material choices for the vapour control layer for interior or exterior retrofit could include: Foil-face materials Polyethylene facers Closed cell spray foams Some open-cell spray foams Material choices for the thermal control layer for the interior of exterior retrofit could include: Extruded polystyrene (XPS) Expanded polystyrene (EPS) Open- or closed-cell spray foams Rockwool Polyisocyanurate (PIC) Since the materials used for the interior retrofit do not have to withstand exterior weather conditions, there are more options available. Some additional material choices for the interior retrofit could include: Taped and sealed gypsum board (air control) 126
141 Taped and sealed Polyethylene sheets (air and vapour control) Vapour retarding paint (vapour control) Fibreglass batt (thermal control) Blown-in cellulose or fibreglass (thermal control) The exterior retrofit option requires a new cladding. A lightweight cladding would generally be desirable to reduce the loads on the existing structure, simplify and lighten the new connection of the cladding back to the existing wall, and for ease of installation. The cladding should ideally be impact resistant especially near grade. The cladding must also meet code requirements for combustibility and flame spread. Some material choices include: Galvanized steel sheet Aluminum sheet Fibre-cement board High pressure laminates Glass Thin brick or stone faced sheets Polycarbonate An important consideration in the cladding design is to ensure continuity of the control layers where the structural connection between the cladding and support is made. The attachment mechanisms for the cladding must meet the following requirements: Strength to support insulation and all cladding loads Minimal cross sectional area or low thermal conductivity to avoid thermal bridging Moisture and temperature resistant material Preferably simple and quick installation 127
142 5.2 Effective Thermal Resistances The configuration of insulation applied to an enclosure can have different impacts on the effective thermal resistance. Effective thermal resistance is defined as the area of enclosure divided by the heat flow for a unit temperature difference. This definition means that all two and three dimensional geometrical effects are considered. However, air leakage and thermal mass, while sometimes important, are not considered in this thesis. Since the protruding concrete balcony slabs are significant thermal bridges, the different configurations are primarily focused around them. First an analysis on the effects of various existing towers balcony geometries was completed. Heat transfer modeling using Therm 5.2 was completed on balconies ranging from 1.12m (3-4 ) to 2.29m (7-6 ) in extension length with slab thickness ranging from 165mm (6 1/2 ) to 203mm (8 ). The range of effective thermal resistances due to varying geometry were 5%, 6%, and 8% for no overcladding, 76mm (3 ) of continuous exterior XPS insulation around the balcony and walls, and 76mm (3 ) of exterior XPS insulation over just the walls, respectively. The results indicated that the largest range in thermal resistance based on various towers balcony geometries was approximately 8% or about half an R-Value. The results are illustrated in Appendix D. Since the effect of balcony geometry was relatively insignificant, the rest of the modeling was based on the Archetype s 1.52m (5 ) balcony extension with 165mm (6 ½ ) thick concrete slab. Four different configurations of insulating the Archetype`s enclosure were analyzed. The percentage of each wall section present in the Archetype (see Chapter 2) was assumed when calculated. Effective thermal resistance was then calculated by area weighting the results of the two dimensional Therm analysis as described in Section 3.1. The effective thermal resistances were calculated for the addition of 0.88 (R5), 1.76 (R10), and 3.52 m 2 k/w (R20) to the existing wall sections for the four different configurations Retrofit 1 The first configuration was insulated on the interior and designated as Retrofit 1 illustrated in Figure 5-5 through Figure 5-9 for all five wall conditions. The new insulation is illustrated in magenta. 128
143 Figure 5-5: Balcony Door Retrofit 1 Figure 5-7: Balcony Window Wall Retrofit 1 Figure 5-6: Balcony Wall Retrofit 1 Figure 5-8: Wall Retrofit 1 129
144 Figure 5-9: Window Wall Retrofit 1 The opaque wall thermal resistances for the five enclosure conditions for Retrofit 1 were calculated and summarized in Table 5-1. Table 5-1: Effective Thermal Resistances of Opaque Wall Sections for Retrofit 1 Opaque Wall Additional R5 Additional R10 Additional R20 Sections (m 2 k/w) (hr ft 2 F/btu) (m 2 k/w) (hr ft 2 F/btu) (m 2 k/w) (hr ft 2 F/btu) Wall Window Wall Balcony Door Balcony Wall Balcony Window Wall Overall Retrofit 2 The second configuration was insulated on the exterior and designated as Retrofit 2 illustrated in Figure 5-10 through Figure 5-14 for all five wall conditions. The new insulation is also illustrated in magenta. 130
145 Figure 5-10: Balcony Door Retrofit 2 Figure 5-12: Balcony Window Wall Retrofit 2 Figure 5-11: Balcony Wall Retrofit 2 Figure 5-13: Wall Retrofit 2 131
146 Figure 5-14: Window Wall Retrofit 2 The opaque wall thermal resistances for the five enclosure conditions for Retrofit 2 were calculated and summarized in Table 5-2. Table 5-2: Effective Thermal Resistances of Opaque Wall Sections for Retrofit 2 Opaque Wall R5 Retrofit R10 Retrofit R20 Retrofit Sections (m 2 k/w) (hr ft 2 F/btu) (m 2 k/w) (hr ft 2 F/btu) (m 2 k/w) (hr ft 2 F/btu) Wall Window Wall Balcony Door Balcony Wall Balcony Window Wall Overall Retrofit 3 The third configuration was also insulated on the exterior with the addition of insulation on the underside of the balconies and designated as Retrofit 3. The wall and window wall sections are the same as Retrofit 2 illustrated in Figure 5-13 and Figure The balcony sections for Retrofit 3 are illustrated in Figure 5-15 through Figure The new insulation is also illustrated in magenta. 132
147 Figure 5-15: Balcony Door Retrofit 3 Figure 5-16: Balcony Wall Retrofit 3 Figure 5-17: Balcony Window Wall Retrofit 3 133
148 The opaque wall thermal resistances for the five enclosure conditions for Retrofit 3 were calculated and summarized in Table 5-3. The values for the wall and window wall are the same as in Retrofit 2. Table 5-3: Effective Thermal Resistances of Opaque Wall Sections for Retrofit 3 Opaque Wall R5 Retrofit R10 Retrofit R20 Retrofit Sections (m 2 k/w) (hr ft 2 F/btu) (m 2 k/w) (hr ft 2 F/btu) (m 2 k/w) (hr ft 2 F/btu) Wall Window Wall Balcony Door Balcony Wall Balcony Window Wall Overall Retrofit 4 The fourth configuration was also insulated on the exterior with the addition of insulation all around the balconies. This was designated as Retrofit 4. The wall and window wall sections are the same as Retrofit 2 illustrated in Figure 5-13 and Figure The balcony sections for Retrofit 4 are illustrated in Figure 5-18 through Figure The new insulation is also illustrated in magenta. Figure 5-18: Balcony Door Retrofit 4 Figure 5-19: Balcony Wall Retrofit 4 134
149 Figure 5-20: Balcony Window Wall Retrofit 4 The opaque wall thermal resistances for the five enclosure conditions for Retrofit 4 were calculated and summarized in Table 5-4. The values for the wall and window wall are the same as in Retrofit 2. Table 5-4: Effective Thermal Resistances of Opaque Wall Sections for Retrofit 4 Opaque Wall R5 Retrofit R10 Retrofit R20 Retrofit Sections (m 2 k/w) (hr ft 2 F/btu) (m 2 k/w) (hr ft 2 F/btu) (m 2 k/w) (hr ft 2 F/btu) Wall Window Wall Balcony Door Balcony Wall Balcony Window Wall Overall Summary of Effective Thermal Resistances The effective thermal resistances for all four retrofits are presented in Table 5-6, for exterior insulation values of R5, R10, and R20. Approximate insulation thicknesses to achieve these three thermal resistance values are illustrated in Table 5-5 for three levels of typical insulation materials. 135
150 Table 5-5: Approximate Thicknesses of Insulation R4/inch R5/inch R6/inch Rockwool/Expanded Polystyrene Extruded Polystyrene Polyisocyanurate/Closed -Cell Spray Foam R5 1 1/4 1 5/6 R10 2 1/ /3 R /3 Table 5-6: Effective Thermal Resistances Archetype Additional R5 Additional R10 Additional R20 m 2 k/w 0.89 hr ft 2 F/btu 5.1 Retrofit 1 Retrofit 2 Retrofit 3 Retrofit 4 Interior Exterior (No Balconies) Exterior (Underside of Balconies) Exterior (Around Balconies) m 2 k/w hr ft 2 F/btu Effective R- Value Added m 2 k/w hr ft 2 F/btu Effective R- Value Added m 2 k/w hr ft 2 F/btu Effective R- Value Added Table 5-6 illustrates that insulating the interior significantly reduces the effective thermal resistance added. The addition of R20 insulation to the interior results in an overall increase of approximately R5. The more insulation added the less effective that insulation becomes. Overall, adding interior insulation is approximately 25 to 40% effective. Adding insulation to the exterior walls only is approximately 75% to 80% effective; continuing the insulation along the underside of the balconies adds little value. Adding exterior insulation to the exterior walls and the around the protruding concrete balcony slab is approximately 90 to 100% effective. 5.3 Energy Efficiency Measures Energy efficiency measures (EEMs) are individual ways to reduce energy. The general categories of EEMs for the towers include the heating, ventilation, and air conditioning (HVAC) equipment, walls, 136
151 roof, windows, lights, appliances, and DHW usage. Each of these were described and analyzed on the Archetype Window Retrofit A window retrofit is common and often effective in a number of ways. It can reduce air infiltration which leads to less uncomfortable drafts and reduced energy consumption, better insulation value and the resulting warmer surface temperatures reduce condensation potential. Three potential window retrofit options and their characteristics are illustrated in Table 5-7. Glazing Separation Table 5-7: Window Retrofit Characteristics Gap Fill Number of Panes Low-E Coating Frame Archetype 6.4mm Air 2 None Aluminum, no thermal break Retrofit mm Air 2 Yes (0.2) Vinyl/Wood Retrofit mm Argon 2 Yes (0.1) Vinyl/Fibreglass Retrofit mm Argon 3 Yes(0.1) Vinyl/Fibreglass The Archetype was assumed to have the lowest performance double-glazed, aluminum-framed window and it was used as the base case for comparison. Retrofit 1 reduces the solar heat gain with a modest low emissivity (low-e) coating and reduces the significant thermal bridging at the frame with vinyl or wood replacing the non-thermally broken aluminum. Retrofit 2 assumes best-in-class doubleglazed window performance and Retrofit 3 is a high-performance triple-glazed window. The effects on overall window thermal resistance and the solar heat gain coefficients (SHGC) are illustrated in Table 5-8. Table 5-8: Window Retrofit Scenarios Overall Window R-Value SHGC (m 2 k/w) (hr ft 2 F/btu) Improvement to Archetype Archetype Retrofit % 0.55 Retrofit % 0.51 Retrofit % 0.34 Table 5-8 illustrates that each of the three window retrofits increases the overall window thermal resistance (including surface films) by approximately 50%, 100%, and 250%, respectively. 137
152 5.3.2 Wall and Roof Retrofit Five of the wall retrofits analyzed in Section 5.2 were selected as retrofit EEMs. The retrofits effective thermal resistance percentage improvements compared to the Archetype were also calculated. The selected sections and percentage improvements are illustrated in Table 5-9. Table 5-9: Opaque Wall Retrofit Scenarios Overall Opaque Wall R-Value (m 2 k/w) (hr ft 2 F/btu) Improvement of Archetype Archetype Retrofit 1 R % Retrofit 1 R % Retrofit 2 R % Retrofit 2 R % Retrofit 4 R % Table 5-9 illustrates that the interior retrofit improvements are approximately 70% and 100% for an additional 1.76 (R10) and 3.52 m 2 k/w (R20), respectively. An overcladding to the exterior walls results in approximately 150% and nearly 300% for the same respective insulation levels. Complete overcladding including around the balconies with 3.52 m 2 k/w (R20) results in approximately 350% improvement to the Archetype s wall thermal resistance. Three roof retrofits were analyzed. Retrofits 1, 2, and 3 represent additional overcladding insulation of 1.76 (R10), 3.52 (R20), and 7.04 m 2 k/w (R40), respectively. The thermal resistances and percentage improvement to the Archetype are illustrated in Table Table 5-10: Roof Retrofit Scenarios Overall Roof R-Value (m 2 k/w) (hr ft 2 F/btu) Improvement to Archetype Archetype Retrofit % Retrofit % Retrofit % Table 5-10 illustrates that retrofits 1, 2, and 3 improve the Archetype s roof thermal resistance by approximately 100%, 200%, and 425%, respectively. 138
153 5.3.3 HVAC Retrofit Replacing the older, less efficient HVAC equipment can be a quick and simple retrofit. It generally has little effect on the occupants, can happen quickly, and can often reduce maintenance of older, malfunctioning equipment. The efficiencies assumed for the Archetype along with two HVAC retrofit packages are illustrated in Table Table 5-11: HVAC Retrofit Packages Archetype Retrofit 1 Retrofit 2 Efficiencies Efficiencies Efficiencies HRV 0% 55% 80% Hydronic Boiler 80% 92% 95% Window A/C COP MUAU Heating 70% 84% 95% MUAU Cooling COP DHW Boiler 70% 82% 97% A heat recovery ventilator (HRV) is generally not installed in the towers. Window A/C technology has generally not achieved coefficient of performance (COP) beyond 3.5. Centralized cooling units are able to achieve COPs of 4 and 4.5 for a good and best performing unit, respectively. The highest performing non-condensing furnace is approximately 84% and a realistic high performing condensing furnace achieves an efficiency of approximately 95%. The same is true for boilers with approximately 82% and 97% efficiencies for non-condensing and condensing, respectively Appliance and Lighting Retrofit Two appliance retrofit scenarios are illustrated in Table
154 Table 5-12: Appliance Retrofit Unit Energy Consumption Archetype Retrofit 1 Retrofit 2 (kwh/yr) (kwh/yr) (kwh/yr) Refrigerator Clothes Washer* Clothes Dryer Dishwasher* Range Total *Does not include hot water heating energy Retrofit 1 illustrated in Table 5-12 was based on new 2008 Energy Star appliance replacements. Retrofit 2 was based on high performance appliance replacements. Two lighting retrofit scenarios are illustrated in Table Table 5-13: Lighting Retrofit Values Archetype Retrofit 1 Retrofit 2 Lighting (kwh/m 2 /yr) Equivalent Continuous Lighting (W/m 2 ) Lighting retrofit 1, illustrated in Table 5-13, was calculated from Equation 19. (Hendron, R. and Engebrecht, C, 2010) Where Interior Lighting is yearly energy consumption calculated in kwh/yr and FFA is finished floor area calculated in m 2. Retrofit 2 was assumed for a high-performance lighting upgrade that would include light emitting diodes (LED) Air Leakage Reduction Consequences Since the window, wall, and roof retrofits presented in Sections and would likely result in reduced air leakage, various air leakage reductions need to be considered with these three EEMs. Four air leakage scenarios and their associated percent reduction relative to the Archetype are illustrated in Table (19) 140
155 Table 5-14: Air Leakage Reduction Scenarios Air Leakage Rate (l/s m 75 Pa) Percentage in Air Leakage Reduction relative to Archetype Archetype 4.58 Scenario % Scenario % Scenario % Scenario % Table 5-14 illustrates scenarios 1 through 4 correspond to 10%, 20%, 30%, and 40% air leakage reductions, respectively. The range of air leakage rates for these scenarios is from 4.12 to 2.75 l/s m 2 at a 75Pa pressure difference. Reducing the air leakage can have significant energy saving benefits illustrated in Table If air leakage provides the ventilation to a unit then significantly reducing air leakage can result in insufficient ventilation. Insufficient ventilation can result in health consequences that are termed sick building syndrome. Sick building syndrome was first defined in the late 1970 s following reduced ventilation requirements for buildings intended to save energy. Far too often the result was sick occupants. Since the enclosure of the towers is approximately one and a half to two times as leaky as single-family homes (see Section 3.2.5) reducing the air leakage by up to 40% is unlikely to cause sick building syndrome. However, access to ventilation air either through the original design described in Section 3.2.3, an opened window, or a retrofitted ventilation system needs to be ensured when air tightening Reduced Domestic Hot Water Usage The most common and effective way to reduce DHW is to replace faucets and showerheads with low flow fixtures. Reducing the DHW consumption results in reduced DHW heating loads. Two faucet and showerhead retrofit scenarios are illustrated in Table
156 Table 5-15: Faucet and Showerhead Retrofit Faucets Showerheads Reduction relative (l/day/person) (l/day/person) to Archetype Archetype Retrofit % Retrofit % Table 5-15 illustrates that retrofit 1 and 2 were assumed to reduce the hot water consumption by 30% and 50%, respectively. The resulting faucet hot water consumption for the retrofits was approximately 23 and 16 l/day per person. The resulting range of showerhead hot water consumption for the retrofits was approximately 17 and 12 l/day per person, respectively Energy Efficiency Measures Summary All of the EEMs described from Section through are summarized in Table
157 Table 5-16: Energy Efficiency Measures Description Summary Description Windows Retrofit 1 Basic double glazed replacement Retrofit 2 High performance double glazed replacement Retrofit 3 High performance triple glazed replacement Walls Retrofit 1 (R10) Additional R10 interior insulation Retrofit 1 (R20) Additional R20 interior insulation Retrofit 2 (R10) Additional R10 exterior wall insulation Retrofit 2 (R20) Additional R20 exterior wall insulation Retrofit 4 (R20) Additional R20 exterior wall and complete balcony insulation Roof Retrofit 1 Additional R10 exterior insulation Retrofit 2 Additional R20 exterior insulation Retrofit 3 Additional R40 exterior insulation HVAC Retrofit 1 Non-condensing boilers and furnace replacement. Basic HRV, window A/C, and central A/C. Retrofit 2 Condensing boilers and furnace replacement. High performance HRV, window A/C, and central A/C. Appliances Retrofit 1 Basic refrigerator, washer, dryer, dishwasher, and range upgrade. Retrofit 2 High performance refrigerator, washer, dryer, dishwasher, and range upgrade. Lighting Retrofit 1 Basic CFL upgrade Retrofit 2 High performance LED upgrade Air Leakage Retrofit 1 10% Air leakage reduction Retrofit 2 20% Air leakage reduction Retrofit 3 30% Air leakage reduction Retrofit 4 40% Air leakage reduction DHW Retrofit 1 30% reduction in showerhead and faucet flow Retrofit 2 50% reduction in showerhead and faucet flow The EEMs illustrated in Table 5-16 were modeled in BELA MURB High-Rise Edition. The energy consumed, energy saved relative to the hydronically-heated Archetype, and corresponding percent reduction for each of the EEMs are illustrated in Table The results relative to the electricallyheated Archetype are illustrated in Appendix E. 143
158 Table 5-17: Energy Efficiency Measures Results Energy Consumed Energy Saved Percent kwh/yr/m 2 kwh/yr/m 2 Reduction Archetype 384 Windows Retrofit % Retrofit % Retrofit % Walls Retrofit 1 (R10) % Retrofit 1 (R20) % Retrofit 2 (R10) % Retrofit 2 (R20) % Retrofit 4 (R20) % Roof Retrofit % Retrofit % Retrofit % HVAC Retrofit % Retrofit % Appliances Retrofit % Retrofit % Lighting Retrofit % Retrofit % Air Leakage Retrofit % Retrofit % Retrofit % Retrofit % DHW Retrofit % Retrofit % Based on the results illustrated in Table 5-17, retrofitting individual parts of the towers cannot significantly reduce the annual energy consumption. Individual retrofits may have significant effects on comfort, maintenance, durability, or aesthetics, but alone have little effect on energy. If there is an intention to reduce the high annual energy consumption of the towers, a whole building retrofit approach is required. Retrofit packages were created, simulated, and the results were discussed in Section Energy Efficiency Measure Retrofit Packages Three retrofit packages were created based on Section 5.3. The first package is an interior enclosure retrofit with moderate upgrades and was designated as Package A. The second package is an exterior enclosure retrofit with moderate upgrades designated as Package B. The third package is a high- 144
159 performance upgrade designated as Package C. The three packages and the selection of EEMs based on Table 5-16 are summarized in Table Table 5-18: Retrofit Package Summary EEM Package A Package B Package C Windows Retrofit 2 Retrofit 2 Retrofit 3 Walls Retrofit 1 R20 Retrofit 2 R20 Retrofit 4 R20 Roof Retrofit 2 Retrofit 2 Retrofit 3 HVAC Retrofit 1 Retrofit 1 Retrofit 2 Appliances Retrofit 1 Retrofit 1 Retrofit 2 Lighting Retrofit 1 Retrofit 1 Retrofit 2 Air Leakage Retrofit 2 Retrofit 3 Retrofit 4 DHW Retrofit 1 Retrofit 1 Retrofit 2 Table 5-18 illustrates that Package A and B are very similar with modest retrofit options. The only differences are the walls and air leakage. Interior R20 insulation and a corresponding 20% air leakage reduction were assumed for Package A. Exterior R20 insulation on the opaque wall sections only and a corresponding 30% air leakage reduction was assumed for Package B. Package C has exterior R20 insulation on the opaque wall sections including around the balconies and a corresponding 40% air leakage reduction along with all the other high performance retrofit options. Package C was intended to illustrate the highest performing level of retrofit with current technologies Annual Energy Consumption The annual energy consumptions for the Packages were simulated in BELA MURB High-Rise Edition on the hydronically-heated Archetype and the results are presented below. The packages were also simulated on the electrically-heated Archetype and the results were provided in Appendix F. Retrofit Package A, B, and C simulated annual energy distribution and savings relative to the Archetype are illustrated in Figure 5-21 through Figure 5-23, respectively. 145


160 Figure 5-21: Annual Energy Distribution and Savings of Retrofit Package A on the Archetype Figure 5-22: Annual Energy Distribution and Savings of Retrofit Package B on the Archetype Figure 5-23: Annual Energy Distribution and Savings of Retrofit Package C on the Archetype 146
161 Figure 5-21 and Figure 5-22 illustrate that Package A and B each reduces the Archetype s annual energy consumption by approximately 40% with Package B saving 4% more. Package B reduces the space heating demand to approximately the same demand as the MEL. Package C presented in Figure 5-23 illustrates that the largest reduction in annual energy consumption of the Archetype is over 50%. A comparison of all three packages, a new MURB, and a low-energy MURB are presented in Figure Figure 5-24: Retrofit Package Comparison Relative to the Archetype Figure 5-24 illustrates Packages A, B, and C reduce the annual energy consumption to approximately 240, 230, and 180 kwh/m 2, respectively. Therefore, an interior retrofit (Package A) reduces the annual energy consumption of the Archetype by almost the same amount as the exterior retrofit (Package B). Although there may only be a small savings in annual energy consumption for an exterior enclosure retrofit, the numerous non-energy-related benefits and consequences must be considered when comparing an exterior and interior enclosure retrofit, as illustrated in Table All three retrofit packages can reduce the annual energy consumption below a typical new MURB. The high-performance retrofit package cannot surpass the annual energy consumption of a new lowenergy MURB. 147
162 5.4.2 Peak Energy Consumption The reduction in peak energy consumption is also important, particularly for power plants. The peak electricity consumptions for the retrofit packages on the electrically-heated Archetype are illustrated in Figure Figure 5-25: Peak Energy Consumption for the Electrically-Heated Archetype The Archetype has a peak electricity consumption of approximately 140 W/m 2, this occurs in January during the cold conditions of winter. Retrofit Packages A and B reduce the peak electricity consumption by approximately one-third and Package C reduces the peak by approximately half. The peak gas and electricity consumptions for the retrofit packages on the hydronically-heated Archetype are illustrated in Figure
163 Figure 5-26: Peak Energy Consumption for the Hydronically-Heated Archetype The peak electricity consumption for the hydronically-heated Archetype is approximately 80% less than the electrically-heated Archetype and occurs in August during the warm conditions of summer. Applying the retrofit packages to the hydronically-heated Archetype has little effect on the peak electricity consumption. The peak natural gas consumption has approximately the same rate of energy consumption as the electricity consumption in the electrically-heated Archetype. 5.5 Impact and Shift in Reduced Greenhouse Gas Emissions The energy saved by retrofitting the towers with a retrofit package similar to those described above will reduce the amount of energy used by around 40-55%. Any reduction in energy use results in a reduced amount of greenhouse gases (GHG) emitted in the production of that energy. According to Stewart and Thorne (2010), there are approximately 500,000 units in the 3000 overfour-storey towers in the GGH. Based on simulating the 280 units in the 20 storey Archetype, the average unit uses approximately 27,700 kwh per year of energy. Therefore the 3000 towers consume approximately TWh per year (500,000 units times 27,700 kwh/yr) of energy. This is site energy and is divided primarily between electricity and natural gas with corresponding greenhouse gas emissions. If the 3000 towers reduced their annual energy consumption by 40% (Package A) the GGH would save approximately 5,540 GWh per year of equivalent site energy. In terms of understanding this quantity of energy, 1000 two megawatt wind towers (each assumed to produce 149

164 5,300 MWh per year assuming a 30% capacity factor) produce nearly the equivalent in electrical energy. The energy use and GHG emissions of transportation represents a significant portion of Canada s usage and emissions. Improving the living conditions of these urban apartment towers will improve perceptions of urban living. This can lead to a shift in percentage of Canadians living in suburban areas to urban areas which would likely reduce the average commute and general travel by car. This same shift is also likely to decrease the number of trips by cars and increase the number of public transportation trips. Public transportation trips use significantly less energy per capita and emit significantly less GHG than car travel. An increase in the demand for public transportation would likely increase the incentive to construct more public transportation systems thus increasing the shift from car travel to lower energy using and GHG emitting public transportation. 5.6 Durability Wall Section Temperature Profiles The temperatures across the Archetype s existing wall section were calculated for two winter conditions and presented in Figure Figure 5-27: Existing Wall Section Winter Temperature Profiles Figure 5-27 illustrates that during an average winter and cold winter condition the brick experiences temperatures below zero. With the warmer temperatures in the summer or periods of direct solar radiation, the concrete block and brick experiences freeze-thaw temperature swings. When the brick 150

165 retains water during freeze-thaw temperature swings the potential for freeze-thaw deterioration is significant. The interior surface of the concrete block experiences temperatures of approximately 2 C to -8 C during typical winter temperatures of -5 C to -20 C. Condensation will form on the concrete block if air with an RH greater than 28% reaches that surface during a typical winter day (-5 C). Frost will form on the concrete block if air with an RH greater than 13% reaches that surface during a typical cold winter day (-20 C). The temperatures across the wall section with an interior R10 retrofit were calculated for the same two winter conditions and presented in Figure Figure 5-28: Interior R10 Retrofit Wall Section Winter Temperature Profiles Figure 5-28 illustrates that applying insulation to the interior decreases the temperatures experienced by the concrete block and brick during the winter. Frost can accumulate during a typical winter day (- 5 C) on the interior side of the concrete block if interior air with an RH greater than 21% passes around the discontinuous air control layer. The temperatures across the wall section with an exterior R10 retrofit were calculated for the same two winter conditions and presented in Figure

166 Figure 5-29: Exterior R10 Retrofit Wall Section Winter Temperature Profiles Figure 5-29 illustrates that applying the insulation to the exterior of the brick decreases the range of temperatures the brick and concrete block experiences. An exterior R10 retrofit ensures the brick does not experience temperatures below approximately 5 C. This would protect the brick from potential freeze-thaw deterioration. The interior concrete block surface would remain above approximately 9 C, eliminating frost potential and limiting condensation to occur only when the interior air has an RH greater than approximately 50% Surface Condensation Potential Insulating the towers enclosure has the potential to reduce surface temperatures which reduces the potential for interior surface condensation. An analysis of the interior surface temperatures for the four enclosure retrofits on the balcony window wall section was completed using Therm. The approach was the same as described in Section The potential condensation locations have the same designations, illustrated in Figure 3-9, previously used for the Archetype in Section Window Retrofit 2 (high performance double-glazed) and R10 insulation were used with all four enclosure retrofits. The effectiveness of reducing the potential surface condensation for the retrofits is illustrated in Table
167 Table 5-19: Retrofit Condensation Potential Archetype Retrofit 1 Retrofit 2 Retrofit 3 Retrofit 4 A 7 C 40% 7 C 40% 10 C 49% 11 C 53% 14 C 64% B 17 C 78% 19 C 88% 18 C 83% 18 C 83% 19 C 88% C -7 C 15% 6 C 38% 9 C 46% 9 C 46% 10 C 49% D 8 C 43% 14 C 64% 14 C 64% 14 C 64% 15 C 69% E -7 C 15% 6 C 38% 11 C 53% 11 C 53% 12 C 56% F 17 C 78% 19 C 88% 19 C 88% 19 C 88% 19 C 88% G 12 C 56% 12 C 56% 14 C 64% 14 C 64% 17 C 78% Lowest 0 C 25% 6 C 38% 9 C 46% 9 C 46% 10 C 49% Table 5-19 illustrates that all four retrofits increase the lowest interior surface temperature from -7 C to at least 6 C. This is primarily because of the window frame improvement. The Archetype has a poorly performing aluminum window frame and the enclosure retrofits include a high performance frame with the window retrofit used. This reduces the largest potential for interior surface condensation in the Archetype. The second largest interior surface condensation potential occurs where the concrete slab ceiling meets the top of the interior finish (A). This edge could experience condensation if the interior air s RH is greater than 40%. The interior retrofit (1) does not significantly increase this surface temperature. The exterior wall retrofit increases the surface temperature such that the interior RH would have to exceed 50% for condensation to occur here. Adding insulating all around the balconies increases the surface temperature such that the interior RH would have to exceed 60% for condensation to occur here. 5.7 Thermal Comfort Operative Temperature The thermal comfort of an occupant is dependent on three factors: dry bulb air temperature, humidity, and mean radiant temperature (MRT). The HVAC equipment primarily controls the first two factors and the enclosure primarily controls the MRT. The MRT is basically the area weighted average temperature of all the objects surrounding the occupant. The view angles of the surrounding surfaces are used to calculate the MRT. The view angles for an occupant standing one metre from the balcony window wall enclosure section are illustrated in Figure The interior floor, wall, and ceiling were assumed to have surface temperatures of 20, 21, and 22 C, respectively. 153
168 Figure 5-30: Mean Radiant Temperature View Angles Figure 5-30 illustrates that standing near the exterior wall; approximately half of the occupant s MRT is affected by the enclosure. The 1.52m (5 ) window accounts for a significant percentage of that. On the interior side of the occupant the slightly warmer ceiling and slightly cooler floor average out to the interior wall s surface temperatures because their respective view angles are the same. If the temperature and humidity are at comfortable levels, but the surrounding wall surfaces are cold, the occupant will feel cold on account of the radiant heat loss to the wall. The operative temperature can provide a measure of the comfort of an occupant in a building s space. It is calculated by taking the weighted average of the MRT and the ambient air temperature using the linear radiative and convective heat transfer coefficients, respectively. ASHRAE (2009) calculates the operative temperature using Equation 20. (20) Where t o = operative temperature, ( C) h r = linear radiative heat transfer coefficient, W/(m 2 K) h c = convective heat transfer coefficient, W/(m 2 K) 154
169 t r = mean radiant temperature, ( C) t a = ambient air temperature, ( C) For calm indoor conditions, h r and h c are approximately equal, which simplifies the calculation of the operative temperature to the average of the MRT and ambient air temperature. The simplified, linear form for calculating MRT according to ASHRAE (2009) is illustrated in Equation 21. Where t r = mean radiant temperature, ( C) t n = surface temperature of surface n, ( C) F p-n = angle factor between a person and surface n. The surface temperatures were obtained from the same Therm model used to calculate the condensation potential in Section The angle factors were calculated based on Figure The Archetype, enclosure Retrofit 2, and enclosure Retrofit 4 were modeled. The retrofits include Window Retrofit 2 (high-performance double-glazed). The enclosure sections were modeled with an exterior temperature of -20 C and additional retrofit insulation equivalent to R10. The surface temperatures, calculated MRT, and calculated operative temperature are illustrated in Table 5-20 and Table 5-21 for the balcony window wall section and balcony wall section, respectively. Table 5-20: MRT and Operative Temperatures for the Balcony Window Wall Section Archetype Retrofit 2 Retrofit 4 View Angle Temp. ( C) Temp. ( C) Temp. ( C) Ceiling* Headwall Window Kneewall Floor* Reverse MRT Operative *Average within 1m of wall (21) 155
170 Table 5-21: MRT and Operative Temperatures for the Balcony Wall Section Archetype Retrofit 2 Retrofit 4 View Angle Temp. ( C) Temp. ( C) Temp. ( C) Ceiling* Wall Floor* Reverse MRT Operative *Average within 1m of wall Table 5-20 illustrates that the window replacement approximately doubles its surface temperature which significantly contributes to the nearly one degree improvement in operative temperature for Retrofit 2. Both tables illustrate that choosing to insulate around the balconies (Retrofit 4 versus Retrofit 2) improves the operative temperature by approximately 1% Passive Comfort during Electrical or Mechanical Failures During cold periods, the poor enclosure thermal resistance of the towers results in many poor performance issues previously described. These problems assumed a functioning heating system. If the heating equipment fails during cold periods the poor thermal resistance puts the towers at another disadvantage, a lack of passive comfort. During the winter of 2011 a power outage at a Toronto apartment tower forced approximately 1000 occupants to seek warmer shelter (Globe and Mail, 2011). If the towers enclosure had more thermal resistance, the rate of heat loss would be reduced and the internal gains from occupants, thermal mass, and maybe candles could have possibly maintained a temperature comfortable enough for the occupants to remain in the towers until the heating equipment was fixed. 5.8 Interior versus Exterior Enclosure Retrofit Comparison One of the main differences between the enclosure retrofits is the interior option (Retrofit 1) versus the exterior option (Retrofits 2, 3, and 4). The differences are summarized in Table 5-22 for a number of criteria and include criteria previously discussed throughout Chapter
171 Table 5-22: General Interior versus Exterior Retrofit Comparison Criteria Interior Retrofit Exterior Retrofit Control Layers (Section 5.1.1) Discontinuous Continuous Rainscreen Opportunity No Yes Moisture Tolerant Materials (Section Not required Required 5.1.2) Effective Thermal Resistance (Section 5.2.5) Significant reduction in effective value 2 to 4 times more effective than interior Annual Energy Consumption (Section 5.3.7) Uses more energy Saves approximately 10 kwh/m 2 /year or 3% more than interior Brick Durability (Section 5.6.1) Less durable Significantly more durable Condensation Potential (Section 5.6.2) Potential Significantly Improved improvement Aesthetics (Curb Appeal) No opportunity for improvement Opportunity for improvement Economies of scale Good Better Construction interference to occupants Significant Minimal Construction displacement of tenants Yes No Construction scaffolding required No Yes Construction weather sensitive No Yes Finished Floor Area Reduced Unaffected or potentially increased Table 5-22 illustrates a significant overall advantage for the exterior retrofit. The small number of disadvantages includes the constructions sensitivity to weather, the requirement for scaffolding, and exterior insulation materials can t be susceptible to weather. 5.9 Summary Retrofitting the enclosure can provide better definition and performance of air, vapour, heat, and moisture control. Choosing a rainscreen exterior enclosure retrofit can result in a significantly more durable wall, extending the buildings expected useful life by protecting the masonry and concrete structure. Insulating on the interior can significantly reduce the effective thermal resistance. Insulating around the balconies adds only minimal effective thermal resistance. Reducing the conductive heat loss through the enclosure by overcladding the towers is not likely to reduce the annual energy consumption beyond 8%, but the resulting reduction in air leakage could be upwards of 10%. A packaged retrofit of the towers is significantly more effective in reducing annual energy consumption. A 40% reduction in annual energy consumption is very reasonable and a 60% reduction 157
172 could be approached with the latest technologies, excluding any on-site power generation. The benefits of exterior enclosure retrofits are significant in many other ways including: improved occupant comfort, reduced interstitial and surface condensation potential, minimal disruption, and opportunities for improved aesthetics. 158
173 Chapter 6 Conclusions and Recommendations 6.1 Conclusions Studies have shown that there are a large number of post-world War II high-rise apartment towers in North America and especially in parts of Canada. The Greater Golden Horseshoe, in Ontario, has approximately 3000 greater than four stories that are home to approximately 1,000,000 people. Significant deterioration exists in these towers including life safety concerns that need to be addressed immediately. The deterioration presents two main options: demolish and construct a new building or retrofit. A retrofit can extend the lifespan of the towers, improve comfort, improve durability, reduce energy and associated greenhouse gas emissions. Residential space heating accounts for a significant percentage of Canada s energy use. The space heating reduction rate for apartments is less than that of single family detached and attached residences. The significant number of towers that require retrofits presents an opportunity to also reduce apartment space heating loads at a rate similar to the other residential types. These towers usually have fourteen units per storey comprised of mostly two bedroom units, followed by one bedroom, then bachelor units. The average sizes of these units are approximately 70m 2 (750ft 2 ), 50m 2 (550ft 2 ), and 35m 2 (375ft 2 ), respectively. Half of the average tower s perimeter consists of a balcony wall section, although this varies significantly. They have approximately 30% window to wall ratio and the typical rectangular plan dimension are 15m (50ft) wide by 70m (230ft) long. The towers floor to floor height is consistently 2.64m (8-8 ). The windows are generally double-glazed with aluminum frames. The opaque wall and roof sections have effective thermal resistance of approximately 0.9W/m 2 k (R5) and 1.7W/m 2 k (R10), respectively. The towers air leakage varies significantly around 4.6l/s m 2 at 75Pa and their height and lack of compartmentalization makes them susceptible to significant stack effect and wind pressures. The predicted annual energy consumption of the towers is approximately 390kWh/m 2 and 350kWh/m 2 for the hydronically- and electrically-heated variants. This can of course vary significantly. The energy consumption is approximately divided into: 40% space heating, 20% ventilation heating, 20% domestic hot water use, and 20% electrical loads such as appliances and lighting. The space cooling, hydronic space heating distribution, and ventilation cooling and distribution energy are a small contribution to overall energy use. The winter space heating loads are comprised of approximately 40% conduction, 40% infiltration, and 20% ventilation. 159
174 Because of thermal bridging, adding insulation to the enclosure results in an additional effective thermal resistance less than the amount added. Insulating the interior of the enclosure walls is 25 to 40% effective. Insulating only the vertical parts of exterior walls is 75 to 80% effective; continuing this insulation along the underside of the protruding concrete balcony slab has little effect. Insulating the exterior including around the tops and bottoms of balconies allows the overall insulation value to reach 90 to 100% of its rated thermal resistance. Individual Energy Efficiency Measures (EEMs) have little effect on the overall annual energy consumption of the average tower, however a tower that has a specific unusual deficiency could significantly reduce its annual energy consumption for an EEM that addresses the lacking condition. The estimated total annual energy reductions on the average tower for the following EEMs are: 20-40% for HVAC equipment replacement 4-8% for replacing windows (excludes air leakage reduction) 4-8% for insulating the enclosure walls (excludes air leakage reduction) 5-10% for air sealing/air leakage reduction consequences (varies significantly) 3-6% for installing low flow fixtures 1-2% for improving appliances 1% for retrofitting lighting with energy efficient bulbs As only 60% of the pre-retrofit energy consumption is heating and cooling retrofits of enclosures and mechanical systems can only reduce total energy consumption by about 40%. Appliances, lighting, and DHW must be part of any more aggressive reduction strategies. A retrofit package using a number of mid-range EEMs could save approximately 40% for both interior and the slightly better performing exterior option. A retrofit package using high performance EEMs could save the annual energy consumption of the average tower by more than 50%. If an existing tower consumes significantly more energy for certain purpose, targeted EEMs could result in larger savings. Enclosure retrofits have many more significant benefits, especially exterior enclosure retrofits. The interior retrofit and existing condition allow the brick to experience an annual 60 C temperature range and cold weather temperatures well below freezing. An exterior 1.76W/m 2 k (R10) retrofit can reduce the annual range of temperatures experienced by the brick to 35 C and maintain the bricks 160
175 temperature over 5 C, eliminating the potential for freeze-thaw deterioration. With the addition of a high performance double-glazed, fiberglass-framed window replacement, the maximum interior relative humidity can increase from 25% to 50% before the potential of surface condensation. This retrofit can also improve the occupant s thermal comfort by increasing the operative temperature by one degree Celsius. Adding thermal insulation also increases the passive thermal control; providing occupants adequate thermal comfort during a mechanical heating failure. The benefits of an exterior enclosure retrofit that cannot be achieved by an interior enclosure retrofit include providing continuous control layers to manage water, vapour, air, and heat effectively, improving rain water management, eliminating the risk of freeze-thaw, improvement of aesthetics or curb appeal, avoidance of tenant displacement, and maintenance of the finished floor area. The exterior enclosure retrofit reduces heat loss, annual energy consumption, condensation potential, and occupant interference more than an interior retrofit. The limited disadvantages include required construction scaffolding, weather sensitive construction, and the need for moisture tolerant insulation materials. 6.2 Recommendations Since the feasibility of the retrofit options depends on current economics, a cost estimate should be completed for implementing the retrofit packages on the buildings under consideration. Cost estimates for the buildings under consideration for all the retrofit packages would provide decision makers with the means to determine the most energy savings for a given expenditure. This could then be compared to other policy decisions such as implementing stricter codes for new buildings, subsidizing renewable energy, or supporting programs to retrofit existing buildings. More testing of overall air leakage characteristics in the towers would provide more confidence in the average overall air leakage characteristics. More accurate air leakage values would add to the accuracy in estimating the effects of existing air leakage and associated retrofits. The adaptation of BELA to be used for simulating conditions within an individual unit could be useful in determining the comfort of an occupant within a suite. It could also be used to estimate energy consumption for a single suite. Monitoring actual energy usage of retrofitted towers would determine the amount that BELA MURB High-Rise Edition under or overestimates the energy consumption. Measured energy usage results would also confirm the impact of retrofitting other towers. 161
176 References ASHRAE, Standard 62.1: Ventilation for Acceptable Indoor Air Quality. Atlanta: American Society of Heating, Refrigerating, and Air Conditioning Engineers, Inc., ASHRAE, ASHRAE Handbook Fundamentals. Atlanta: American Society of Heating, Refrigerating, and Air Conditioning Engineers, Inc., Barakat, S., Net Energy Contribution of Domestic Water Use to House Heating Requirements, Division of Building Research, National Research Council of Canada, Ottawa, March Blake, P., The Master Builders: Le Corbusier, Mies Van Der Rohe, Frank Lloyd Wright, Norton & Company, New York, 1976 Bohac, D.L., Fitzgerald, J.E., and Grimsrud, D., Hewett, M.J., Measured Change in Multifamily Unit Air Leakage and Airflow Due to Air Sealing and Ventilation Treatments. American Society of Heating, Refrigerating and Air-Conditioning Engineers, Bronsema, N. Solar Equations. University of Waterloo, Waterloo ON, CMHC, Air Tightness, Air Movement and Indoor Air Quality in British Columbia High-Rise Apartment Buildings, Technical Series , Canada Mortgage and Housing Corporation, Ottawa ON, CMHC, Air Tightness, Air Movement and Indoor Air Quality in Quebec High-Rise Apartment Buildings, Technical Series , Canada Mortgage and Housing Corporation, Ottawa ON, CMHC, Air Tightness, Air Movement, and Indoor Air Quality in High Rise Buildings, Technical Series , Canada Mortgage and Housing Corporation, Ottawa ON, CMHC, Air Leakage Characteristics, Test Methods and Specifications for Large Buildings, Technical Series , Canada Mortgage and Housing Corporation, Ottawa ON, 2001 (revised 2007). CMHC, Analysis of the Annual Energy and Water Consumption of Apartment Buildings in the CMHC HiSTAR Database, Technical Series , Canada Mortgage and Housing Corporation, Ottawa ON,
177 CMHC, Ventilation Systems for Multi-Unit Residential Buildings: Performance Requirements and Alternative Approaches, Technical Series , Canada Mortgage and Housing Corporation, Ottawa ON, CMHC, Energy and Water Consumption Load Profiles in Multi-Unit Residential Buildings, Technical Series , Canada Mortgage and Housing Corporation, Ottawa ON, December CMHC, Brick Cladding Repairs Ottawa, Ontario, Better Buildings Case Study Number 61, Canada Mortgage and Housing Corporation, Ottawa ON, September CMHC, Air Leakage Control Manual for Existing Multi-Unit Residential Buildings, Canada Mortgage and Housing Corporation, Ottawa ON, December CMHC, Repair of Deteriorated Balcony Slabs. Better Buildings - Case Study Number 11, Canada Mortgage and Housing Corporation, Ottawa ON, No Date. DeOreo, W. and Mayer, P., The End Uses of Hot Water in Single Family Homes from Flow Trace Analysis, Aquacraft Incorporated, Water Engineering and Management, 1999 Diamond, R.C., Feustel, H.E., and Matson, N.E. Energy-Efficient Ventilation for Apartment Buildings U.S. Department of Energy Rebuild America Guide, 1999 Elert G., The Physics HyperTextbook, October 24, 2010 Enermodal, Monitored Performance of an Innovative Multi-Unit Residential Building, Enermodal Engineering Limited, Kitchener ON, September 2002 Enermodal, Green House Gas Emission Reduction Potential within the Multi-Unit Residential Buildings of the HiSTAR Database, Enermodal Engineering Limited, Kitchener ON, March 2005 The Engineering Tool Box, October 17, Globe and Mail, Power outage forces about 1,000 out of Toronto apartment building overnight, article , January 20, Hanam, B., Development of an Open Source Hourly Building Energy Modeling Software Tool (Master s thesis). University of Waterloo, Waterloo ON,
178 Hendron, R. And Engebrecht, C., Building America House Simulation Protocol, National Renewable Energy Laboratory, Building America United States Department of Energy, September Hutcheon, N., Principles Applied to an Insulated Masonry Wall. Canadian Building Digest 50, National Research Council Canada, February IPCC, Climate Change 2007: Synthesis Report. Intergovernmental Panel on Climate Change, Valencia, Spain, November Kesik, T. And Saleff, I., Tower Renewal Guidelines: For the Comprehensive Retrofit of Multi-Unit Residential Buildings in Cold Climates, Daniels Faculty of Architecture, Landscape, and Design, University of Toronto, Knight, I., Kreutzer, N., Manning, M., Swinton, M., And Ribberink, H., European and Canadian non-hvac Electric and DHW Load Profiles for Use in Simulating the Performance of Residential Cogeneration Systems, Annex 42 of the International Energy Agency Energy Conservation in Buildings and Community Systems Program, May Kosmatka, Steven H.; Kerkhoff, Beatrix; Panarese, William C.; MacLeod, Norman F.; and McGrath, Richard J., Design and Control of Concrete Mixtures, EB101, 7 th Edition, Cement Association of Canada, Ottawa, Ontario, Canada, 2002, 368 pages. LBNL, THERM Finite Element Simulator Version 5.2, Regents of the University of California, Lawrence Berkley National Laboratories, LBNL, Indoor-Outdoor Air Leakage of Apartments and Commercial Buildings, PIER Final Project Report, CEC , Lawrence Berkley National Laboratories, December LBNL, Energy-Efficient Ventilation for Apartment Buildings, Rebuild America, U.S. Department of Energy, Lawrence Berkley National Laboratories, No Date. Lstiburek, J., Pressures in Buildings. Building Science Digest 109, Building Science Press, BuildingScience.com, October 25, Mackay, D., Sustainable Energy without the hot air, UIT Cambridge Ltd., England, 2009 Melanson, T., Portrait of a beleaguered tenant, Globe and Mail, January, 12, 2011 Mensinga, P., Determining the Critical Degree of Saturation of Brick Using Frost Dilatometry (Master s thesis). University of Waterloo, Waterloo ON,
179 McGuinness, W. and Stein, B., Mechanical and Electrical Equipment for Buildings 5 th Edition, NRCan, Energy Efficiency Trends in Canada 1990 to 2005, Natural Resources Canada, Her Majesty the Queen in Right of Canada, NRCan, Residential Appliance Unit Energy Consumption (UEC), Natural Resources Canada, March 28, NRCan, Comprehensive Energy Use Database, Table 46, Natural Resources Canada, March 28, Paperny, A., Toronto increasingly becoming a city of vertical poverty, Globe and Mail, January 12, Proskiw, G. and Phillips, B., Characterizing Air Pressure/Air Movement Patterns in Multi-Unit Residential Buildings, prepared for Canadian Mortgage and Housing Corporation, RDH, Energy Consumption and Conservation in Mid and High Rise Residential Buildings in British Columbia Report #1: Energy Consumption and Trends, RDH Building Engineering Ltd., Vancouver BC, February 10, Shaw, C.Y., Gasparetto, S., and Reardon, J.T., Methods for Measuring Air Leakage in High-Rise Apartments, Air Change Rate and Airtightness in Buildings, ASTM STP 1067, M. H. Sherman, Ed., American Society for Testing and Materials, Philadelphia, 1990, pp Shaw, C. and Tamura, G., The Calculation of Air Infiltration Rates Caused By Wind and Stack Action for Tall Buildings. ASHRAE Transactions, Volume 83, Part 2, 1977, pp Sherman, M.H. and Modera, M.P., Comparison of Measured and Predicted Infiltration Using the LBL Infiltration Model, Measured Air Leakage of Buildings, ASTM STP 904, H.R. Trechsel and P.L. Lagus, Eds., American Society for Testing and Materials, Philadelphia, 1986, pp Stewart, G. and Thorne, J., Tower Neighbourhood Renewal in the Greater Golden Horseshoe An Analysis of High-Rise Apartment Tower Neighbourhoods Developed in the Post-War Boom ( ), E.R.A. Architects, planningalliance, and the Cities Centre at the University of Toronto, November
180 Straube, J. and Burnett, E., Building Science for Building Enclosures. Building Science Press, Westford MA, 2005 Suleiman, B., Thermal Conductivity of Saturated Samples Using the Hot-Disk Technique. University of Sharjah, UAE, Proceedings of the 4 th WSEAS International Conference, Elounda, Greece, August 21-23, Tamura, G. and Wilson, A., Pressure Differences Caused By Chimney Effect in Three Buildings. ASHRAE Transactions, Volume 73, Part 2, 1967 TCHC, Personal Communication with Colin Shane, Byrne Engineering Inc., Burlington, Ontario, February 12, 2010 Waide, P., High-Rise Refurbishment, The energy-efficient upgrade of multi-story residences in the European Union, International Energy Agency, November 2006 Wikipedia, Retrofitting, March 7,

181 Appendix A - Inventory and Location of Apartment Towers in the GGH (Stewart, G. and Thorne, J., 2010) 167

182 168
183 Appendix B Building Drawings (TCHC, 2010) 169
184 170

185 171

186 172
187 173

188 174

189 175
190 176

191 177

192 178

193 179
194 180

195 181

196 182

197 183
198 184

199 185

200 186

201 187

202 188

203 189

204 190
205 191

206 192
207 Appendix C - BELA Screenshots (Hanam, 2010) BUILDING INPUTS Yellow cells = user input Blue cells = calculated values GENERAL INFO Location Toronto, ON Number of Stories 2 Length, N-S elevations 61 m Length, E-W elevations 36 m Floor to Floor Height 3.7 m Window to Wall Ratio (WWR), North 30% WWR, South 30% WWR, East 30% WWR, West 30% Indoor Temperature Winter Low 21 C Indoor Temperature Summer High 24 C ENCLOSURE Air leakage 0.4 l/s-m2 wall Wall R-Value 25 hr-ft2-f/btu Roof R-Value 20 hr-ft2-f/btu Foundation R-Value 10 hr-ft2-f/btu Door R-Value 2.0 hr-ft2-f/btu # of Doors 5 Door Height 2.13 m Door Width 1.83 m Total Window U-Value Btu/hr-ft2-F Solar Heat Gain Coefficient (SHGC), North 0.4 SHGC, South 0.4 SHGC, East 0.4 SHGC, West 0.4 Roof Solar Absorptance, α 0.8 Wall Solar Absorptance, α 0.8 INTERNAL GAINS Lights 8.3 W/m2 Plug loads 12.5 W/m2 People - Sensible 73.2 W/pers People - Latent 61.9 W/pers Occupant Density 0.07 people/m2 193
208 DAILY SCHEDULE WEEKLY SCHEDULE (% of Daily) Hour Lighting % Plug Loads % Occupancy % Day Lighting % Plug Loads % Occupancy % 1:00 10% 10% 0% 1 100% 100% 100% 2:00 10% 10% 0% 2 100% 100% 100% 3:00 10% 10% 0% 3 100% 100% 100% 4:00 10% 10% 0% 4 100% 100% 100% 5:00 10% 10% 0% 5 100% 100% 100% 6:00 10% 10% 0% 6 0% 0% 0% 7:00 55% 10% 0% 7 0% 0% 0% 8:00 100% 100% 100% 9:00 100% 100% 100% 10:00 100% 100% 100% 11:00 100% 100% 100% 12:00 100% 100% 100% 13:00 100% 100% 100% 14:00 100% 100% 100% 15:00 100% 100% 100% 16:00 100% 100% 100% 17:00 100% 100% 100% 18:00 55% 10% 10% 19:00 10% 10% 0% 20:00 10% 10% 0% 21:00 10% 10% 0% 22:00 10% 10% 0% 23:00 10% 10% 0% 0:00 10% 10% 0% 194


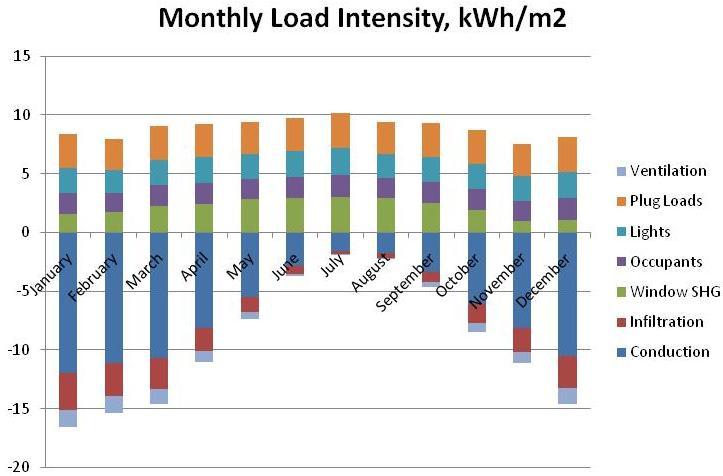
209 195
210 196
211 RADIANT HEATING AND COOLING INPUTS Heating Source Efficiency 85% Cooling Delta T 5 C Heating Delta T 10 C Cooling Source COP 3.5 Max Cooling Pump Power 4.23 kw Max Heating Pump Power 1.03 kw Pump Efficiency 77% Design Cooling Flow 12.1 l/s Design Heating Flow 3.4 l/s Pump Motor Efficiency 87% Design Cooling Head 23.8 m Design Heating Head 20.6 m Total Pump Efficiency 67% Cooling to space at max kw Heating to space at max kw Cooling capacity 57.5 W/m2 Heating capacity 32.5 W/m2 FAN COIL HEATING AND COOLING INPUTS Pumps: Fans: Heating source efficiency 85% Cooling Delta T 15 C # of fan coil units 15 Cooling source COP 3.5 Max Cooling Pump Power 1.41 kw Max Design Fan Flow 50 l/s Pump Efficiency 77% Design Cooling Flow 4.0 l/s Max Design Fan Power kw Pump Motor Efficiency 90% Design Cooling Head 24.7 m Design Fan Pressure 1068 Pa Total Pump Efficiency 69% Cooling to space at max 253 kw Fan Efficiency 60% Heating Delta T 70 C Fan Motor Efficiency 70% Max Heating Pump Power 0.15 kw Total Fan Efficiency 42% Design Heating Flow 0.5 l/s Design Heating Head 21.3 m Heating to space at max 143 kw 197
212 198


213 199
214 Appendix D- Effect of Varying Towers Balcony Geometry on Overall R-Value Balcony Extension Slab Thickness Interior Fibreglass Thickness Exterior Insulation Thickness on Walls Exterior Insulation Thickness Around Balcony Slab U-Factor R-Value Average R-Value (mm) (feet) (mm) (inches) (mm) (inches) (mm) (inches) (mm) (inches) (W/m 2 K) (hrft 2 F/Btu) (hrft 2 F/Btu) / / / / / / / / / / / / / / / / / / Range Percent Difference % 8.1 8% 4.7 5% 200
215 Appendix E- Retrofit Results for Electrically Heated Archetype Energy Consumed Electrically Heated Energy Saved Percent Reduction kwh/yr/m 2 kwh/yr/m 2 Archetype 351 Window Retrofit % Retrofit % Retrofit % Wall Retrofit 1 - R % Retrofit 1 - R % Retrofit 2 - R % Retrofit 2 - R % Retrofit 3 - R % Roof Retrofit % Retrofit % Retrofit % HVAC Retrofit % Retrofit % Appliance Retrofit % Retrofit % Lighting Retrofit % Retrofit % Air Leakage Retrofit % Retrofit % Retrofit % Retrofit % DHW Retrofit % Retrofit % 201


216 Appendix F- Retrofit Packages Results for Electrically Heated Archetype 202
 Thermal Patterns Created By Moisture Accumulation Within Exterior Masonry Walls by A. Colantonio* and G. Desroches ** * Public Works And Government Services Canada, Ottawa, Canada ** Public Works And Government
QUANTITATIVELY EVALUATING THE EFFECTIVENESS OF DIFFERENT DRIP EDGE PROFILES
 QUANTITATIVELY EVALUATING THE EFFECTIVENESS OF DIFFERENT DRIP EDGE PROFILES J. Smegal, A. Lukachko, J. Straube and T. Trainor ABSTRACT Proper rainwater management is one of the key factors ensuring long-term
Assessing the Impact of US Housing. Retrofits. Building Carbon Emissions. Building Energy Use. buildingscience.com
 ! 2008! Retrofits Commercial Institutional Assessing the Impact of US Housing Background:! Total Housing Units in 2001 (millions): Single-Family Homes 73.7 Apartments (all buildings) 26.5 Mobile Homes
2001 Building Failures Study
 Página Web 1 de 5 Technical Series 01-140 2001 Building Failures Study Introduction In Canada, building rehabilitation for roofing and wall system repairs and replacement cost an estimated $7.5 billion
APPENDIX 3C DOMINION HOTEL SPECIFICATIONS
 APPENDIX 3C DOMINION HOTEL SPECIFICATIONS 1. GENERAL 1.1 Refer to Section 2.1 of Schedule 3 [Design and Construction Specifications] regarding compliance with Schedule 3 and this Building Specification.
Before You Start Renovating Your Bathroom
 Before You Start Renovating Your Bathroom Renovating your bathroom is a great way to add value to your home both for your family s daily living and for future resale. Before you decide to go ahead with
The Importance of Slab Edge & Balcony Thermal Bridges
 Exterior Exterior Thermal Break Prepared by Date RDH Building Engineering Ltd. September 24, 2013 Interior 18.6 C Interior 18.6 C Report # 2: Impact of Slab Thermal Breaks on Thermal Comfort and Condensation
ANTICIPATION OF DEGRADATION IN CONCRETE BUILDINGS FACADE AND BALCONY STRUCTURES
 ANTICIPATION OF DEGRADATION IN CONCRETE BUILDINGS FACADE AND BALCONY STRUCTURES A. Köliö (1), J. Lahdensivu (1) (1) Faculty of Built Environment, Tampere Univeristy of Technology, Finland Abstract Reliable
Mark Lawton, P.Eng., FEC. Airtightness in Buildings A Canadian History June 2017
 Mark Lawton, P.Eng., FEC Airtightness in Buildings A Canadian History June 2017 History of What? Understanding Measurement Implementation Air in Buildings Carries moisture to cold surfaces where condensation
Freeze-Thaw Damage and Insulation Projects: A Homeowner s Guide. Trevor Trainor, M.A.Sc.
 Freeze-Thaw Damage and Insulation Projects: A Homeowner s Guide Trevor Trainor, M.A.Sc. Updated: May 2014 buildingsciencelabs.com contact us: info@buildingsciencelabs.com Insulating Masonry Walls: The
This presentation. Functions of the building enclosure. University of Waterloo and Balanced Solutions. Straube Presentation Building Canada
 Hygrothermal Basement Performance, or Why do we get water when we dig holes in the ground? Dr John Straube October, 2004 This presentation What do basements do Examine performance Why problems What solutions
Wall and cladding systems constructed. Coatings and Penetrants for Concrete and Masonry Walls
 Coatings and Penetrants for Concrete and Masonry Walls By Alon Gold, P.Eng., LEED AP, Senior Project Manager, Stephenson Engineering Ltd. & Pravin Pai, P.Eng., Associate, Head of the Building Envelope
Efflorescence in Portland cement plaster finishes Tech Bulletin # 101
 1) What is efflorescence? According to Merriam-Webster s Collegiate Dictionary, Tenth Edition, the verb (vi) to effloresce means a) to change to a powder from loss of water of crystallization and b) to
The contemporary masonry wall. Flashing. Ice dams - bad End dams - good
 The contemporary masonry wall Designed to drain Kept dry with air cavity Expected to leak Uses foam plastic insulation 3 courses = 8 inches (one block course) Through wall flashing Weeps @ 16 o.c. Flashing
THE IMPORTANCE OF BALCONY AND SLAB EDGE THERMAL BRIDGES IN CONCRETE CONSTRUCTION
 THE IMPORTANCE OF BALCONY AND SLAB EDGE THERMAL BRIDGES IN CONCRETE CONSTRUCTION G. Finch, J. Higgins and B. Hanam ABSTRACT Exposed concrete slab edges, balconies, and eyebrows on multistorey buildings
East Lyme Middle School EAST LYME MIDDLE SCHOOL
 Description: N EAST LYME MIDDLE SCHOOL The school consists of a multi story building with lower, main and upper level floors. The typical floor framing for the main and upper levels is wide flange steel
Adhered Veneers and Inward Vapor Drives: Significance, Problems and
 Feature Adhered Veneers and Inward Vapor Drives: Significance, Problems and Solutions By Dr. John Straube, P.Eng., Chris Schumacher, Jonathan Smegal and Marcus Jablonka Adhered veneers, in which masonry
THE IMPACT OF BUILDING ENVELOPE RETROFIT MEASURES ON POSTWAR MURBS IN TORONTO. Sara Damyar. B. Arch Sc, Ryerson University, 2006
 THE IMPACT OF BUILDING ENVELOPE RETROFIT MEASURES ON POSTWAR MURBS IN TORONTO by Sara Damyar B. Arch Sc, Ryerson University, 2006 A Major Research Project presented to Ryerson University in fulfillment
Emperor Penguins and Efficient Buildings. Resisting frigid temps with thermal breaks.
 Emperor Penguins and Efficient Buildings. Resisting frigid temps with thermal breaks. March 2017 Brent Chancellor, PhD, PE Product Engineer Schöck North America Thermal Breaks Prevent Heat Loss Through
Adhered Veneers and Inward Vapor Drives: Significance, Problems and
 Feature Adhered Veneers and Inward Vapor Drives: Significance, Problems and Solutions By Dr. John Straube, P.Eng., Chris Schumacher, Jonathan Smegal and Marcus Jablonka ADHERED VENEERS, IN WHICH MA- SONRY
Exterior Conditions Assessment
 Exterior Conditions Assessment North Elevation The North elevation of the Hall of Waters contains three different façade systems. First is the pitched face limestone, the second is cut stone, and the third
6. Moisture Design. Objectives: 3. Prevent vapor condensation (surface, concealed) 4. Prevent rain penetration
 4. Prevent rain penetration") 6. Moisture Design Objectives: 3. Prevent vapor condensation (surface, concealed) 4. Prevent rain penetration Vapor Condensation More new bldgs are susciptable to vapor condensation because of: 2. 1. 2.
6. Moisture Design Objectives: 3. Prevent vapor condensation (surface, concealed) 4. Prevent rain penetration Vapor Condensation More new bldgs are susciptable to vapor condensation because of: 2. 1. 2.
WeatherSmart Air Barrier Installation Guide
 WeatherSmart Air Barrier Installation Guide 1 The intent of this document is to provide a guide for the installation of WeatherSmart as both a Weather Resistive Barrier (W.R.B.) and an Air Barrier Material
Sloped Roofs vs Walls. Problems. Review Roof Components. University of Waterloo and Balanced Solutions
 Roofs, Cathedral Ceilings, Venting, Non-Vented Dr June, 2005 This presentation Scope: Pitched, Wood, Roofs Performance Problems Vented, cathedral, unvented etc What solutions www.balancedsolutions.com
Water Management & Damage Prevention: A Guide for Homeowners
 Water Management & Damage Prevention: A Guide for Homeowners This article provides homeowners with basic information to make these decisions and take the appropriate actions to keep their homes dry and
TOWN OF HAGUE GUIDELINES FOR PERMIT APPLICATION
 TOWN OF HAGUE GUIDELINES FOR PERMIT APPLICATION Town of Hague Building Inspector: Dale Wagner Home #: 306-225-2265 Cell #: 306-241-4741 Fill all part of the permit application including the date and signature.
APPENDIX 3E HAZELWOOD HOTEL SPECIFICATIONS
 APPENDIX 3E HAZELWOOD HOTEL SPECIFICATIONS 1. GENERAL 1.1 Refer to Section 2.1 of Schedule 3 [Design and Construction Specifications] regarding compliance with Schedule 3 and this Building Specification.
PROCON I N T E R N A T I O N A L, L L C. CONSULTING ARCHITECTS & ENGINEERS CONSTRUCTION TECHNOLOGY
 PROCON P R O F E S S I O N A L C O N S U L T A N T S I N T E R N A T I O N A L, L L C CONSULTING ARCHITECTS & ENGINEERS CONSTRUCTION TECHNOLOGY www.proconweb.com Assessing the Performance of Metal Trim
CCIM Central Canada Chapter. Richard Weldon, P.Eng., LEED AP Carson Dunlop Weldon & Associates Ltd. October 5,
 Minimizing Risk When Purchasing or Leasing CCIM Central Canada Chapter Richard Weldon, P.Eng., LEED AP Carson Dunlop Weldon & Associates Ltd. October 5, 2010 www.cdwengineering.com Who We Are CDW is a
Corrosion of Roof Truss Connector Plates in Farm Buildings S. Beadle, P. Eng.
 Corrosion of Roof Truss Connector Plates in Farm Buildings S. Beadle, P. Eng. Factsheet 16-041 agdex 714 august 2016 (replaces OMAFRA Factsheet 10-071, Corrosion of Roof Truss Gusset Plates in Farm Buildings)
Corrosion of Roof Truss Connector Plates in Farm Buildings S. Beadle, P. Eng.
 Corrosion of Roof Truss Connector Plates in Farm Buildings S. Beadle, P. Eng. FACTSHEET 16-041 AGDEX 714 AUGUST 2016 (replaces OMAFRA Factsheet 10-071, Corrosion of Roof Truss Gusset Plates in Farm Buildings)
Evolution of Wall Design for Controlling Rain Penetration
 Construction Technology Update No. 9 Evolution of Wall Design for Controlling Rain Penetration by G.A. Chown, W.C. Brown and G.F. Poirier The design of walls to control rain penetration has changed considerably
The Importance of Slab Edge & Balcony Thermal Bridges
 Date RDH Building Engineering Ltd. September 24, 2013 The Importance of Edge & Balcony Thermal Bridges Report # 3: Energy Consumption and Cost Savings of Thermal Breaks Prepared by The Importance of Edge
Thermal Control in Buildings by John Straube (updated )
") building science.com 2006 Building Science Press All rights of reproduction in any form reserved. Building Science Digest 011 Thermal Control in Buildings 2006-11-02 by John Straube (updated 2011-12-12)
building science.com 2006 Building Science Press All rights of reproduction in any form reserved. Building Science Digest 011 Thermal Control in Buildings 2006-11-02 by John Straube (updated 2011-12-12)
Welcome to this continuing education seminar. This is the first of two parts of the High- Performance Building series.
 Welcome to this continuing education seminar. This is the first of two parts of the High- Performance Building series. 1 3 6 7 8 An enclosure s basic function is to separate the outside from the inside.
Wall Selection Guide Section 1.1
 Page 1 MASONRY WALL TYPES Masonry is the most enduring of all building materials, as exemplified by the oldest and most revered architecture from around the world. The exceptional structural integrity
U.S. EDITION RESIDENTIAL CONSTRUCTION DETAILS SAMPLE. A visual guide to construction detailing. Emma Walshaw
 RESIDENTIAL CONSTRUCTION DETAILS U.S. EDITION A visual guide to construction detailing Emma Walshaw Contents INTRODUCTION 4 PRINCIPLES OF CONSTRUCTION DETAILING 6 FOUNDATIONS 9 PRINCIPLES OF FOUNDATION
Contents. 1.1 Introduction 1
 Contents PREFACE 1 ANCIENT MASONRY 1 1.1 Introduction 1 1.2 History of Masonry Materials 1 1.2.1 Stone 2 1.2.2 Clay Units 2 1.2.3 Calcium Silicate Units 4 1.2.4 Concrete Masonry Units 4 1.2.5 Mortars 5
2012 Ontario Building Code Requirements for New Construction. Bradford West Gwillimbury Building Division March 5, 2012
 2012 Ontario Building Code Requirements for New Construction Bradford West Gwillimbury Building Division March 5, 2012 1 Ontario Building Code changes Applicable to permits applied for after December 31,
Mondol Fabrics Ltd. Nayapara,kasimpur, Gazipur ( N, E0) 8th March 2014
 8th March 2014") Mondol Fabrics Ltd Nayapara,kasimpur, Gazipur (23.990028N, 90.317336E0) 8th March 2014 1 2 Observations 3 Column Stresses in Toilet Area North of Building Cursory calculations indicate that column size
Mondol Fabrics Ltd Nayapara,kasimpur, Gazipur (23.990028N, 90.317336E0) 8th March 2014 1 2 Observations 3 Column Stresses in Toilet Area North of Building Cursory calculations indicate that column size
Leaving Certificate Revision Notes. Airtightness. Potential air leakage paths (the numbered points in section 2.1 give a description for
 Leaving Certificate Revision Notes Airtightness 6 7 8 8 9 10 5 11 5 12 4 3 1 2 13 12 14 Potential air leakage paths (the numbered points in section 2.1 give a description for Airtightness Introduction
Welcome to this continuing education seminar. This is the second of three parts of the Building Enclosure Fundamentals series.
 Welcome to this continuing education seminar. This is the second of three parts of the Building Enclosure Fundamentals series. 1 3 6 8 There are several reasons why thermal control is very important:
EXTERIOR WALLS. exterior wall systems, cladding w/ masonry. chapters SUBJECT
 SUBJECT EXTERIOR WALLS chapters 19 + 20 exterior wall systems, cladding w/ masonry DATE SPRING 2014 PROFESSOR MONTGOMERY CLADDING W/ MASONRY & PRE CAST CONCRETE CLADDING W/ BRICK MASONRY CLADDING W/ BRICK
Masonry Study. Club House and Jr. Club House Pequot Yacht Club Southport, Connecticut 03-44
 Club House and Jr. Club House Southport, Connecticut 03-44 669 Harbor Road Southport, Connecticut 06890 Architect: Martin A. Benassi, AIA Architect Two Broadway Hamden, CT 06518 Date: Table of Contents
BUILDING ENCLOSURE DESIGN GUIDE WOOD FRAME MULTI-UNIT RESIDENTIAL BUILDINGS. Summary. 1. Introduction
 BUILDING ENCLOSURE DESIGN GUIDE WOOD FRAME MULTI-UNIT RESIDENTIAL BUILDINGS David Ricketts M.Sc., P.Eng. RDH Building Engineering Ltd., 224 West 8 th Avenue, Vancouver, B.C. V5Y 1N5 Summary 1. Introduction
SITE AND BUILDING INSPECTION CHECKLIST
 PARISH BUILDING Page 1 of 6 SITE AND GROUNDS DATE INIT COMMENTS DATE INIT COMMENTS Ramps & Provisions for Handicap Designated parking spaces for Handicap Has soil dropped or heaved Is there standing water
How-to: Commissioning Design Reviews for the Building Envelope
 AABC Commissioning Group AIA Provider Number 50111116 How-to: Commissioning Design Reviews for the Building Envelope Course Number: CXENERGY1625 Stevan Vinci, BECxP, LEED AP, Morrison Hershfield Maurya
SUBJECT: NEW 2000 INTERNATIONAL RESIDENTIAL CODE (IRC) DATE:
 DATE:") IRC CODE UPDATES TO: RESIDENTIAL BUILDING CONTRACTORS FROM: GARY STABER, BUILDING OFFICIAL SUBJECT: NEW 2000 INTERNATIONAL RESIDENTIAL CODE (IRC) DATE: 6/1/2003 INTERNATIONAL RESIDENTIAL CODE (IRC) APPLICABILITY:
IRC CODE UPDATES TO: RESIDENTIAL BUILDING CONTRACTORS FROM: GARY STABER, BUILDING OFFICIAL SUBJECT: NEW 2000 INTERNATIONAL RESIDENTIAL CODE (IRC) DATE: 6/1/2003 INTERNATIONAL RESIDENTIAL CODE (IRC) APPLICABILITY:
INSTALLING WATER-RESISTIVE BARRIERS & FLASHING
 INSTALLING WATER-RESISTIVE BARRIERS & FLASHING IN A TWO-LAYER STUCCO APPLICATION Fortifiber Building Systems Group provides this guide to assist installers by demonstrating a two-layer installation of
STUDY ON WETTING AND DRYING OF CLAY BRICK HAVING SURFACE COATINGS
 10 th Canadian Masonry Symposium, Banff, Alberta, June 8 12, 2005 STUDY ON WETTING AND DRYING OF CLAY BRICK HAVING SURFACE COATINGS P.J. Kelly Senior Product Quality Manager, Hanson Brick ABSTRACT This
airflow in to, out of, and within buildings. These airflows are resisted by the airtightness of building elements including the exterior enclosure and
 Airflow in to, out of, and within buildings is a fundamental factor of indoor air quality, comfort, durability, and energy consumption. Multi-unit residential buildings are uniquely complex in this respect
Fixing Brick. Fort Wayne Performing Arts Center Louis Kahn
 Fixing Brick Fort Wayne Performing Arts Center Louis Kahn Fort Wayne Performing Arts Center Ü Arches and efflourescense The performing arts center was built in the late 1960 s. Like many projects it had
Can you Believe Energy Savings Forecasts
 Can you Believe Energy Savings Forecasts By: Tony Woods Introduction Yes, says TonyWood. Especially when your project includes an upgrade to the building envelope. The relationship between high performance
Building Envelope Systems AE 544 Course Notes
 Building Envelope Systems AE 544 Course Notes By Dr. Ahmad A. Hamid, Ph.D., P.E. Professor Department of Civil, Architectural and Environmental Engineering Drexel University, Philadelphia, PA 251 895 2342
Keene Building Products
 Keene Building Products Keene Building Products is a Registered Provider with The American Institute of Architects Continuing Education Systems. Credit earned on completion of this program will be reported
Of Building Science: From Control Layers to High Performance Enclosures
 Of Building Science: From Control Layers to High Performance Enclosures Energy Design Conference February 24, 2016 Duluth, MN Patrick H. Huelman Cold Climate Housing Coordinator University of Minnesota
2006 Building Science Press All rights of reproduction in any form reserved.
 building science.com 2006 Building Science Press All rights of reproduction in any form reserved. Building Science Digest 011 Thermal Control in Buildings 2006-11-07 by John Straube Abstract: Providing
Weatherproofing Masonry For Northern Climates
 The enduring strength, beauty and performance of a brick wall assembly is critically dependant on three components: design, workmanship and materials. If even one of these factors has not been diligently
Tile on Existing. Viewpoint
 Viewpoint Tile on Existing Exterior Reinforced Concrete BalconieS By Steven C. Turner Exterior reinforced concrete balconies are often covered by tile set in mortar beds with grouted joints. These installations
GREEN BUILDING CONGRESS 2011 NEW DELHI
 DEVELOPING GUIDELINES FOR ENERGY EFFICIENCY IN RESIDENTIAL BUILDINGS IN INDIA Background The Energy Conservation Building Code (ECBC) has addressed the need for energy efficiency to prepare for the growth
COPYRIGHTED MATERIAL. Contents. 1 Making Buildings 3. 3 Wood Foundations and. Preface to the Sixth Edition xi. Sitework 31
 Contents Preface to the Sixth Edition xi 1 Making Buildings 3 Learning to Build 4 Buildings and the Environment 5 The Work of the Design Professional 11 The Work of the Construction Professional 19 Trends
Insulated Metal Panel (IMP) Systems
 Systems") METL-SPAN Joseph Lstiburek, Ph.D., P.Eng. November, 2015 Table of Contents 1. Physics of Building Enclosures... 4 2. Physics of Insulated Metal Panels... 12 3. Joint Design... 19 4. Thermal Bridging...
METL-SPAN Joseph Lstiburek, Ph.D., P.Eng. November, 2015 Table of Contents 1. Physics of Building Enclosures... 4 2. Physics of Insulated Metal Panels... 12 3. Joint Design... 19 4. Thermal Bridging...
Chapter Meeting: Joint Meeting with Boston CSI and ICRI at Granite Links Insulating Load-Bearing Masonry Building January 8, 2014
 Kohta Ueno January 8, 2014 Insulating Load-Bearing Masonry Buildings Overview ICRI/CSI-Insulating Load-bearing Masonry Buildings 2 Mass Walls (Rain Control) Moisture is absorbed/safely stored during rain
Green your Condo Optimize Glass Coatings for Energy Savings
 Green your Condo Optimize Glass Coatings for Energy Savings BY MATT CHARBONNEAU Matt Charbonneau, M.A.Sc., P.Eng. Project Manager, Shareholder mcharbonneau@edisonengineers.ca 289-983-5721 Considering Window
Chapter 4 Test. Directions: Write the correct letter on the blank before each question.
 Chapter 4 Test Name: Date: Directions: Write the correct letter on the blank before each question. Objective 1: Describe the impact of fire on common building materials. 1. Which of the following is the
Overview. Insulating Load-Bearing Masonry Buildings. Learning Objectives
 NESEA is a registered provider with the American Institute of Architects Continuing Education System. Credit earned on completion of this program will be reported to CES Records for AIA members. Certificates
Building Science.com Building Science.com Building Science.com
 Dr John Straube, P.Eng. Associate Professor, University of Waterloo Principal, Building Science Corporation Western Building Tradition Adventures in Building Science Enclosures www.buildingscience.com
Included in our report are our visual observations, recommendations for follow-up evaluation, and conceptual repair recommendations.
 Ms. Pamela J. Irwin Community Management Associates 384 Ralph McGill Blvd Atlanta, GA 30312 Re: Phase I Condition Assessment Central City Condominiums Pool Deck Atlanta, Georgia Walter P Moore Project
Part 1 General information. Chapter 1.4. Cold weather working
 Part 1 General information Chapter CONTENTS SCOPE DESIGN Clause Page There are no specific Design implications This Chapter gives guidance on meeting the Technical Requirements and recommendations for
DESIGN TIPS TECHNICAL BULLETIN #47 FLASHING, WEEP HOLES AND RELATED ANCHORAGE [1 of 8]
![DESIGN TIPS TECHNICAL BULLETIN #47 FLASHING, WEEP HOLES AND RELATED ANCHORAGE [1 of 8]](/thumbs/89/98551889.jpg "DESIGN TIPS TECHNICAL BULLETIN #47 FLASHING, WEEP HOLES AND RELATED ANCHORAGE [1 of 8]") FLASHING, WEEP HOLES AND RELATED ANCHORAGE [1 of 8] Proper flashing and weep holes are essential elements in exterior masonry walls. Together, they provide a means to control moisture in a wall. If not
FLASHING, WEEP HOLES AND RELATED ANCHORAGE [1 of 8] Proper flashing and weep holes are essential elements in exterior masonry walls. Together, they provide a means to control moisture in a wall. If not
Structural Conditions Assessment of Current Lapeer District Schools Administration Building 250 Second Street, Lapeer, Michigan
 November 2, 2015 Melissa A. Malcolm Library Director Lapeer District Library 201 Village West Dr S Lapeer, MI 48446 RE: Structural Conditions Assessment of Current Lapeer District Schools Administration
CHAPTER 3. BUILDING THERMAL LOAD ESTIMATION
 CHAPTER 3. BUILDING THERMAL LOAD ESTIMATION 3.1 Purpose of Thermal Load Estimation 3.2 Heating Load versus Cooling Load 3.3 Critical Conditions for Design 3.4 Manual versus Computer Calculations 3.5 Heating
ACHIEVING HIGH-PERFORMANCE MULTI-UNIT RESIDENTIAL BUILDINGS: THE OPPORTUNITIES
 ACHIEVING HIGH-PERFORMANCE MULTI-UNIT RESIDENTIAL BUILDINGS: THE OPPORTUNITIES CHALLENGES OF MURB PERFORMANCE Energy intensity of multi-unit residential buildings (MURBs) has been marginally increasing
Stone and Masonry Veneer
 Stone and Masonry Veneer R703.7 Stone and masonry veneer, general. Stone and masonry veneer shall be installed in accordance with this chapter, Table R703.4 and Figure R703.7. These veneers installed over
Foundations. Issue. Slab-On-Grade Liquid Water Control (See Figure 2-2) Goals. Guidance
 Goals. Guidance") www.epa.gov/iaq/moisture Foundations Issue Building foundations are vulnerable to moisture problems for a number of reasons, including: Water from rain and from plumbing leaks is drawn by gravity to foundations,
www.epa.gov/iaq/moisture Foundations Issue Building foundations are vulnerable to moisture problems for a number of reasons, including: Water from rain and from plumbing leaks is drawn by gravity to foundations,
Passive House in Canada: Case Studies on a Near EnerPHit Retrofit and Post-Occupancy Research
 Passive House in Canada: Case Studies on a Near EnerPHit Retrofit and Post-Occupancy Research Brittany Coughlin, RDH Building Science Inc. 224 W 8 th Ave, Vancouver, BC Canada Phone: +011 604 873 1181;
Keep your home. FREE from DAMP, CONDENSATION and MOULD
 Keep your home FREE from DAMP, CONDENSATION and MOULD 1 2 This booklet gives some basic information about the different types of dampness that may affect your home. Condensation is probably the biggest
EXECUTIVE SUMMARY INTRODUCTION Terms of Reference Building Description Documents Reviewed SUMMARY OF FIELD DATA 4
 Abbott Place Wood Framed Window Condition Assessment May 30, 2012 TABLE OF CONTENTS EXECUTIVE SUMMARY 1 1.0 INTRODUCTION 2 1.1 Terms of Reference 2 1.2 Building Description 3 1.3 Documents Reviewed 3 2.0
ENERGY EFFICIENT RETROFIT OF A HIGH-RISE MULTIFAMILY BUILDING
 ENERGY EFFICIENT RETROFIT OF A HIGH-RISE MULTIFAMILY BUILDING Brittany Hanam 1, Lorne Ricketts 2, Andrew Pape-Salmon 3 ABSTRACT The National Institute of Building Sciences estimates that over 70% of the
BUILDING CONDITION ASSESSMENT
 BUILDING CONDITION ASSESSMENT 500 MacNab Street North, Hamilton ID. No.: EBE 16-0153 Prepared for Corporation By Effective Building Engineering Ltd.. Final Report: July 2016 Project No. 16-0153 Table of
Controlling Moisture.
 . Controlling Against Moisture Damage For Wall Sheathing...3 Sweaty Vents...4 Controlling Condensation In The Home...4 Controlling Against Moisture Damage For Wall Sheathing Moisture can cause many structural
Toronto Community Housing Executive Summary 2016/2017. BCA Report. Sample House High FCI
 BCA Report Porfolio Development Size Construction TCHC - All Op Units Scattered Units (CHU 20),005 Sq.Ft. 925 Floor Above Grade 2 Divisional Units Page of 43 Description This dwelling unit is a detached
Existing Site Aerial Frederick High School Feasibility Study September 5, 2012
 Existing Site Aerial Building Developmental History 1981 1966 1939 1977 1978 1955 1966 Exterior Roof: Most of existing roof has multi ply built up roofing. Some areas have gravel ballast, others have cap
Carpenter Level 2 Rev. September 2017
 Level 2 A5 Site Layout II Duration: 14 hours 7 hours 7 hours Upon completion of this unit the apprentice will demonstrate knowledge of site layout tools and equipment and their applications and procedures
2003 International Residential Building Code
 2003 International Residential Building Code Section R305 Ceiling Height Habitable rooms, hallways, corridors, bathrooms, toilet rooms, laundry rooms and basements shall have a ceiling height of not less
Administrative Changes
 Revised 11/29/06 Knox County Residential Building Codes Significant Changes From The 1995 CABO One And Two Family Dwelling Code To The 2006 International Residential Code All one and two family dwellings
Public Housing Breaks the Mold
 Public Housing Breaks the Mold Multifamily public and low-income housing have particular problems when it comes to moisture and air pollutants. In this first of a two-part series, we look at one particular
Index. STP779-EB/Jul. 1982
 STP779-EB/Jul. 1982 Index A Absorption of moisture (see Moisture absorption) Adsorption, 191 Capillary versus time, 197 Isotherms For glass fiber, 194, 195 For various materials, 196 Air leakage (exfiltration,
RENTAL INSPECTION CHECKLIST. Helpful Definitions: Egress: the free and unobstructed access to the exterior of a habitable space.
 CITY OF MANASSAS DEPARTMENT OF COMMUNITY DEVELOPMENT DEVELOPMENT SERVICES DIVISION 9027 Center Street, Room 201, Manassas, VA 20110 P.O. Box 560 Manassas, VA 20108 Phone: 703-257-8278 Fax: 703-257-5831
Essentials of Fire Fighting
 Essentials of Fire Fighting 6 th Edition Firefighter I Chapter 4 Building Construction Learning Objective 1 Describe the impact of fire on common building materials. Replace with manual graphic on slide
Engineering Building No W. 32 nd St. Chicago, IL 60616
 CAE 524: Building Enclosure Design Engineering Building No. 1 10 W. 32 nd St. Chicago, IL 60616 November 13, 2013 Performed By: Jay Shetty Firas Putros Gilberto Osornio Table of Contents I) Building and
Building Enclosure Detailing for Balconies
 Building Enclosure Detailing for Balconies COLIN SHANE M.ENG., P.ENG., P.E. PRINCIPAL, SENIOR PROJECT MANAGER RDH BUILDING SCIENCE INC. JUNE 2017 Disclaimer: This presentation was developed by a third
ARTICLE 12 INTERNATIONAL RESIDENTIAL CODE 2012 International Residential Code Modification Summary (Statutory Authority: 1976 Code Section )
") 8-1200. International Residential Code. ARTICLE 12 INTERNATIONAL RESIDENTIAL CODE 2012 International Residential Code Modification Summary (Statutory Authority: 1976 Code Section 6-9-40) NOTE-This article
8-1200. International Residential Code. ARTICLE 12 INTERNATIONAL RESIDENTIAL CODE 2012 International Residential Code Modification Summary (Statutory Authority: 1976 Code Section 6-9-40) NOTE-This article
Building Enclosure Detailing for Balconies
 Building Enclosure Detailing for Balconies COLIN SHANE M.ENG., P.ENG., P.E. ASSOCIATE, SENIOR PROJECT MANAGER RDH BUILDING SCIENCE INC. AUGUST 2016 Disclaimer: This presentation was developed by a third
Overview. Insulating Load-Bearing Masonry Buildings. Mass Walls (Rain Control) Inside or Outside Insulation? 11/17/2017
 Inside or Outside Insulation? 11/17/2017") Kohta Ueno November 16, 2017 Insulating Load-Bearing Masonry Buildings Overview Insulating Load-bearing Masonry Buildings 2 Mass Walls (Rain Control) Moisture is absorbed/safely stored during rain Moisture
Kohta Ueno November 16, 2017 Insulating Load-Bearing Masonry Buildings Overview Insulating Load-bearing Masonry Buildings 2 Mass Walls (Rain Control) Moisture is absorbed/safely stored during rain Moisture
Inspection Report. Prepared for: Gil Turiel. Property Address: 545 Briar Run Court Loganville, GA Date: July 17, 2011
 Inspection Report Prepared for: Gil Turiel Property Address: Loganville, GA 30052 Date: July 17, 2011 Inspector: Charles Mann (770) 594-2222 www.edificeinspections.com Page 1 INSPECTION CONDITIONS CLIENT
carbon-neutral architectural design Pablo La Roche CRC Press Taylor & Francis Croup Boca Raton London NewYork CRC Press is an imprint of the
 carbon-neutral architectural design Pablo La Roche CRC Press Taylor & Francis Croup Boca Raton London NewYork CRC Press is an imprint of the Taylor fit Francis Group, an informs business Contents Preface
A M E R I C A N A R C H I T E C T U R A L M A N U F A C T U R E R S A S S O C I A T I O N
 A M E R I C A N A R C H I T E C T U R A L AAMA 2410-13 Standard Practice for Installation of Windows with an Exterior Flush Fin Over an Existing Window Frame M A N U F A C T U R E R S A S S O C I A T I
Green Remodeling Illustrations GREEN REMODELING ILLUSTRATIONS GREEN BUILDING GUIDELINES FOR HOME REMODELING
 Green Remodeling Illustrations GREEN REMODELING ILLUSTRATIONS GREEN BUILDING GUIDELINES FOR HOME REMODELING WWW.STOPWASTE.ORG New Addition Consider the following green remodeling options in a new addition.
2. The building envelope shall comply with all applicable requirements in Section of ANSI/ASHRAE/USGBC/IES Standard
 5.2 Exterior Wall Systems 5.2.1 General Requirements for All Exterior Wall Systems 1. The design and detailing of exterior wall systems and assemblies will require significant input from U of C FM&D in