NATURAL GAS LIQUIDS (NGLS) IN NORTH AMERICA: AN UPDATE PART I - UPSTREAM
|
|
|
- Ira May
- 6 years ago
- Views:
Transcription


1 Study No. 139 CANADIAN ENERGY RESEARCH INSTITUTE NATURAL GAS LIQUIDS (NGLS) IN NORTH AMERICA: AN UPDATE PART I UPSTREAM Canadian Energy Research Institute Relevant Independent Objective
2
3 NATURAL GAS LIQUIDS (NGLs) IN NORTH AMERICA: AN UPDATE PART I UPSTREAM
4 Natural Gas Liquids (NGLs) in North America: An Update Part I Upstream Copyright Canadian Energy Research Institute, 2014 Sections of this study may be reproduced in magazines and newspapers with acknowledgement to the Canadian Energy Research Institute ISBN Author: Carlos A. Murillo Acknowledgements: The author wishes to acknowledge the support and contributions of Peter Howard and Megan Murphy in the production, reviewing, and editing of this report. Julie Dalzell and Anthony Mersich provided most of the research and material on the United States sections. Staff from RBAC Inc. (Sherman Oaks, California) and RBN Energy LLC (Houston, Texas) provided feedback and data for crossreferencing and due diligence purposes on the United States. Additionally, industry peerreviewers from across the integrated oil and gas, midstream, and consulting segments provided valuable feedback and suggestions that helped make these reports more relevant, independent, and objective in accordance with CERI s mandate. CANADIAN ENERGY RESEARCH INSTITUTE 150, Street NW Calgary, Alberta T2L 2A6 Canada Printed in Canada Front cover photo s courtesy of Pembina Pipeline Corporation, Corporate Update January 2014; and
5 Natural Gas Liquids (NGLs) in North America: An Update Part I Upstream Table of Contents iii LIST OF FIGURES... INTRODUCTION... 1 EXECUTIVE SUMMARY... 3 CANADIAN NATURAL GAS LIQUIDS (NGLs) PRODUCTION ( )... 5 Gas Plant NGL Production... 6 Refinery LPG Production... 8 Oil Sands Upgraders SGL Production UNITED STATES NGL PRODUCTION ( ) Gas Plant NGL Production Refinery LPG Production ANALYSIS: CANADIAN GAS PRODUCERS ADAPTING TO CHANGING NATURAL GAS MARKET DYNAMICS IN NORTH AMERICA Physical Changes: Emerging Supply Sources, Interbasin and Intrabasin GasonGas Competition Economics: Gas Prices, Exchange Rates, Transportation Tolls, Supply Costs Efficiencies and NGL Uplift APPENDIX I WESTERN CANADA SHALE BASINS APPENDIX II US PETROLEUM ADMINISTRATION DEFENSE DISTRICTS AND SHALE BASINS APPENDIX III NORTH AMERICAN NATURAL GAS MARKET INFRASTRUCTURE v
6 iv Canadian Energy Research Institute
7 Natural Gas Liquids (NGLs) in North America: An Update Part I Upstream List of Figures v 1.1 Sources of Natural Gas Liquids (NGLs) in Canada Canadian NGL Production by Source and 2012 % Share of Total Gas Plants NGL Production by Liquid and 2012 % Share of Total Gas Plants NGL Production by Province and 2012 % Share of Total Refined Petroleum Products from Canadian Refineries and 2012 % Share of Total Refinery LPG Production by Liquid and 2012 % Share of Total Refinery LPG Production by Region and 2012 % Share of Total Refining Capacity and Crude Runs in Ontario and Quebec Crude Runs by Type in Western and Atlantic Canada Synthetic Crude Oil Production in Western Canada by Project and Area Upgrader Offgas Production by Project and Area Offgas Supply and Disposition and 2012 % Share of Total SGLs Potential by Area and Type Upgrader Offgas SGL Extraction Estimates and 2012 % Share of Total Shale Plays in the Lower 48 States Average GPM of Shale Plays in the Lower 48 States US NGL Production by Source and 2012 % Share of Total Gas Plant NGL Production by Liquid and 2012 % Share of Total Gas Plant NGL Production by PADD and 2012 % Share of Total PADD I Production, Demand and Net Inflow from Other Regions Refined Petroleum Products and 2012 % Share of Total Refinery LPG Production by Liquid and 2012 % Share of Total Refinery LPG Production by PADD and 2012 % Share of Total Canadian Marketable Natural Gas Supply and Disposition and 2012 % Share of Total Natural Gas Demand in Canada by Sector and by Province and 2012 % Share of Total US Natural Gas Production by Source and by Shale Play US Natural Gas Demand by Sector, Imports and Trade with Canada US Natural Gas Demand by PADD Region, and 2012 % Share of Total / US Shale Gas Basins, Production Areas, and Traditional Natural Gas Flows Canadian/US Border Natural Gas Flows British Columbia Marketable Natural Gas Supply and Disposition and 2012 % Share of Total WCSB Marketable Production and Outflows, by Pipeline, and Alliance Pipeline Receipts by Area Alberta Marketable Natural Gas Supply and Disposition and 2012 % Share of Total HH & AECO Natural Gas Prices, Basis Differentials, and CAN/US Exchange Rate / TCPL Mainline Sample Tolls and Estimated Flows... 43
8 vi Canadian Energy Research Institute 3.11 Multiwell Pad Drilling Illustrations and Supply Cost Efficiencies, Multifrac States Illustration and Supply Cost Efficiencies, and WCSB and North American Halfcycle Gas Economics Energy Prices, Evolving Gas Drilling Patterns in the WCSB, and Liquids Yields and Gas Production in AB by Area WCSB Raw Gas and NGL Production Indices, and Gas Processing Metrics... 49
9 Natural Gas Liquids (NGLs) in North America: An Update 1 Part I Upstream Introduction This report is part of an update to CERI Study No. 130: Natural Gas Liquids (NGLs) in North America: Overview and Outlook to 2035, published in the summer of (the NGLs study). Given the high level of interest from various audiences, CERI has undertaken the task to update its NGLs overview and outlook by incorporating and considering various issues and trends that have developed since Study No. 130 was first published. Furthermore, given the importance of natural gas supply and demand dynamics in the outlook for NGLs, CERI is incorporating four natural gas scenarios developed over the last year and outlined in a recently published CERI report: Study No. 138: North American Natural Gas Pathways. 2 This is the first of five parts (or reports) that make up the NGL update. Parts IIII will focus on a discussion of historical data (2002 to 2012) as well as currently evolving trends that are shaping NGL markets in both Canada and the United States (US). 3 This report (Part I) will provide context in regards to production of NGLs from different sources (upstream), Part II discusses existing and evolving NGL infrastructure and NGL endusers (midstream and downstream), while Part III discusses supply and demand (S/D) balances for each NGL, as well as pricing and economics. These reports will be complemented with a discussion of what CERI believes to be some of the most relevant issues currently transforming NGL markets. The first section of each report will focus on Canada while the second chapter will focus on the US, with a Canadianfocused analysis presented in the final section of each report. Given the increased importance of global energy markets and continued demand increases in the AsiaPacific region, Part IV will discuss NGLs in the global context as well as opportunities and challenges for Canadian NGLs/petrochemicals in global markets and the importance of the AsiaPacific region as a target market. Part V will use the insights from this overview and emerging trends analysis (Parts IIV) in order to develop an outlook for NGLs in North America based on the four natural gas scenarios. A discussion of the outlook methodology will be presented in that report, and each NGL will be discussed in the context of a supply and demand balance outlook based on the different scenarios. Lastly, Part V will include a discussion on what the different outlook scenarios mean for different industries that rely on NGLs in terms of opportunities, challenges, and possible future prospects. The scenariobased approach has been chosen as it allows CERI to consider a range of possibilities in the context of NGLs availability and demand in a longterm timeframe. 1 Available at: 2 Available at: North_American_Natural_Gas_Pathways.pdf 3 With a more indepth focus on Canada
10 2 Canadian Energy Research Institute This is in contrast to a base case scenario (Study No. 130) whereby results were given around a general set of assumptions and where there were possibilities of significant downside or upside revisions on the results given the sensitivity of certain key variables. The scenariobased approach thus allows for a broader examination of possible outcomes. While Study No. 130 was an introduction to NGLs in North America and served the purpose of generating awareness on the importance of NGLs within the context of the energy industry in North America, this report assumes a certain level of understanding of NGL markets and will focus on more specific issues.
11 Natural Gas Liquids (NGLs) in North America: An Update 3 Part I Upstream Executive Summary Canada is one of the world s largest producers of natural gas liquids (NGLs), 4 with output originating primarily at gas processing plants, but also crude oil refineries, oil sands upgrader offgas processing plants, and at the field level as field or wellhead condensate. Between 2002 and 2012, total NGL production levels in Canada fluctuated with peak levels reached at close to 760 thousand barrels per day (kb/d) in 2007, ensued by a declining trend and a trough of 657 kb/d in 2010, a point from which production levels have turned around to reach close to 680 kb/d by While production of NGLs from natural gas plants 5 accounted for 91 percent of total Canadian NGL production in 2012, declining volumes of liquefied petroleum gases (LPG) 6 from refineries, due to a combination of refinery closures and changes in the crude slate, have contributed to overall NGLs declining volumes. Meanwhile, production of synthetic gas liquids (SGLs) 7 from offgas processing plants has increased rapidly, driven by strong oil sands activity and synthetic crude oil production (SCO), not only supporting overall NGL production levels, but also providing an alternative source of NGLs and large potential for further future growth in NGLs extraction volumes. Refineries accounted for 7 percent of Canada s NGL production in 2012 while offgas plants accounted for 2 percent. Gas plants NGL production comes primarily from Western Canadian provinces with almost all extraction occurring in Alberta (AB) (90 percent of gas plants NGLs) and British Columbia (BC) (9 percent), where ethane and propane (combined) accounted for about 2/3 of the gas plant NGL barrel in Given the significance of gas plants NGL production, an understanding of issues affecting natural gas production volumes in these provinces is the foundation of understanding factors that will affect NGLs production in years to come. In the United States (US), overall NGL production levels (from gas plants and refineries combined) were on a flat to declining trend until around 2008 (2,414 kb/d) from which point extraction of NGLs from gas plants accelerated rapidly and led to total NGL production levels of over 3,000 kb/d by Increased production of gas plants NGLs in the US has in turn been the result of rapid increases in natural gas production volumes from unconventional sources (including shale, tight, and coalbed methane formations) led by process innovation around production (such as horizontal drilling and hydraulic fracturing), but also due to underlying commodity pricing conditions that have favoured extraction of NGLrich or wet gas. Production of NGLs from gas plants accounted for 80 percent of total US NGL production in Includes ethane (C2H6), propane (C3H8), butanes (nc4h10 and ic4h10), and pentanes plus/condensate (C5+) 5 Includes field plants, straddle plants, fractionators, and field condensate 6 Propane and butanes 7 Mix of paraffinic (NGLs) and olefinic (ethylene, propylene, butylene, and olefinic condensate) hydrocarbons
12 4 Canadian Energy Research Institute Given the US role as Canada s main trading partner in goods and services, but more importantly, energy commodities; increasing natural gas production volumes unmatched by equivalent demand increases in the US has meant that import requirements continue to decrease. While US demand for gas has increased, primarily in the power generation sector, supply increases have far outpaced demand increases, displacing costly overseas liquefied natural gas (LNG) imports first, followed by Canadian gas in various traditional markets including the US Upper Midwest and US Northeast markets. Furthermore, Eastern Canadian markets which were traditionally served by Western Canada s gas, are increasingly meeting their own needs by acquiring closer USsourced gas. In Canada, gas demand has increased, driven by increases in the power generation and industrial sectors (including oil sands), but demand increases have not been large enough to compensate for increasing US imports and lost US export volumes, leading WCSB producers to scale back on production activities and to look for alternative markets both domestically and abroad (as LNG). These changes in market fundamentals point to a rapidly evolving natural gas market in North America and a reorganization of flow patterns from producing areas to market centers. While various economic factors have also affected WCSB producers including volatile prices, currency exchange rate fluctuations, and increasing transportation tolls (amongst others), supply cost efficiencies and monetization of NGLs have become important components of WCSB producers profitability and competitiveness strategies in the North American market. This has led to a unique situation in the upstream context of Canadian NGLs whereby overall gas production levels have continued to decline while NGL production volumes are recovering, increasing rapidly, and expected to continue to do so over the longterm. Going forward, understanding the demand for Canadian gas across North America and possibly in the global market (as LNG), as well as natural gas prices, the composition of the gas, and the focus of producers on given areas of the WCSB, will help in shaping the expected volumes of NGLs available for extraction in the WCSB. NGL availability will be the foundation for different NGL outlook scenarios that will be presented in Part V of the NGLs study update. But understanding changes in natural gas markets and NGL availability needs to be complemented by an understanding of NGL infrastructure; NGL markets supply, demand, pricing, and economics (market fundamentals), but also an understanding of global NGL markets. These subjects are discussed in Parts II IV of the NGLs update.
13 Natural Gas Liquids (NGLs) in North America: An Update 5 Part I Upstream Canadian Natural Gas Liquids (NGLs) Production ( ) It is important to clarify from the onset that within the Canadian context, the definition of natural gas liquids (NGLs) includes hydrocarbon liquids recovered from the raw natural gas stream at gas processing plants, 8 liquefied petroleum gases (LPGs) from crude oil refining, 9 synthetic gas liquids (SGLs) recovered from oil sands upgrader offgases, and liquids recovered at the wellhead level such as field condensate (as seen on Figure 1.1). These, in turn, include ethane (C 2 H 6, or C 2 ), propane (C 3 H 8, or C 3 ), butanes (normal (nc 4 H 10 ) and isobutane (ic 4 H 10 ), (or C 4s ), as well as pentanes plus 10 (pentanes plus and condensate) (C 5+ ). Figure 1.1: Sources of Natural Gas Liquids (NGLs) in Canada Natural Gas, Crude Oil, and Crude Bitumen Gas Processing Plant Liquids (C 2, C 3, C 4s, C 5+ ) Refinery Liquefied Petroleum Gases (LPGs) (Primarily C 3, C 4s ) Wellhead or Field Condensate (C 5+ ) Upgrader Synthetic Gas Liquids (SGLs) (NGLs/Olefins Mix) Source: CERI Canada is one of the world s largest producers of NGLs, 11 yet between 2002 and 2012 production has fallen from a level of 765 thousand barrels per day (kb/d) to 677 kb/d, or by about 10 percent (88 kb/d net). From the start of the 2002 to 2012 timeframe, production peaked at 765 kb/d followed by a decline trend and a second peak of 757 kb/d by 2007, after which a declining trend ensued. By 2010, a low of about 660 kb/d was observed. Over the last couple of years, that trend has reversed and production is once again increasing. As can be observed in Figure 1.2, the majority of natural gas liquids (around 91 percent in 2012) were produced at natural gas processing plants, 12 while the remaining (nine percent or so) were produced at both refineries and upgraders (in that order) Including field plants, straddle plants, and fractionators but also field condensate 9 Mainly propane and butanes 10 Generally includes pentanes, hexanes, and heptanes 11 See: International Energy Agency (IEA), Natural Gas Liquids, Supply Outlook , April 2010: Oil & Gas Journal (OGJ), Rapid North American shale gas development pushes up global capacities: 12 Includes field condensates, as well as NGLs produced at field plants, straddle plants, and fractionators
14 kb/d 6 Canadian Energy Research Institute Figure 1.2: Canadian NGL Production by Source (kb/d) ( ) and 2012 % Share of Total % 7% 2% Upgraders SGLs Mix Refineries LPGs Gas Plants/ Gas Production NGLs Total NGLs Gas Plants/ Gas Production NGLs Refineries LPGs Upgraders SGLs Mix Source: Data from AER, 14 AESRD, 15 BCMNGD, 16 Statistics Canada, 17 and CERI Estimates. Figures by CERI To understand these trends, it is important to discuss each source of NGL production as well as the respective driving forces behind these trends. Gas Plant NGL Production Production of NGLs from natural gas processing plants depends on a series of factors that are intrinsically tied to trends in natural gas production. These include (but are not limited to) the type of gas reserves being developed and their respective composition, which in turn dictates the amount of liquids available in the gas being produced; the amount (volumes) of gas being produced and processed; the efficiency of gas processing plants to recover the liquids in the raw gas; and the demand and markets for each liquid. These will be further elaborated upon in the analysis section. Figure 1.3 illustrates the production of NGLs from natural gas processing plants. 13 On a percentage basis by NGL, in 2012 ethane accounted for 32% of the total 681 kb/d of NGLs production, followed by propane (31%), pentanes plus (21%), and butanes (16%) 14 Alberta Energy Regulator (AER): Data & Publications, Statistical Reports (ST): ST3: Alberta Energy Resources Industries Monthly Statistics; ST39: Alberta Mineable Oil Sands Plant Statistics Monthly Supplement; ST98: Alberta s Energy Reserves & Supply/Demand Outlook. Available at: 15 Alberta Environment and Sustainable Resource Development (AESRD): Oil Sands Information Portal (OSIP): 16 British Columbia Ministry of Natural Gas Development: Oil and Gas Division, Monthly Statistics: 17 Table : Supply of natural gas liquids and sulphur products from processing plants; Table : Supply and demand for natural gas liquids and liquefied petroleum gases. Available at:
15 kb/d Natural Gas Liquids (NGLs) in North America: An Update 7 Part I Upstream Figure 1.3: Gas Plants NGL Production by Liquid (kb/d) ( ) and 2012 % Share of Total % 30% Pentanes+/ Condensate Butanes Propane Ethane Gas Plants NGLs 12% 23% Ethane Propane Pentanes+/ Condensate Butanes Source: Data from AER, BCMNGD, Statistics Canada, and CERI Estimates. Figures by CERI As can be observed, NGL production from natural gas processing plants follows the same trend that total NGL production exhibits. Given the large share of gas plant production of NGLs (>90 percent), it could be suggested that production from gas plant NGLs is the main driver behind the overall NGL production trend. However, the rate of decline in NGL production from gas plants over the 2002 to 2012 timeframe has been lower than the overall decline (81 kb/d) suggesting it has not been the only cause for the overall NGL production decreasing trend. It can also be observed that light NGLs (C 2 & C 3 ) accounted for 65 percent of the total NGLs produced at gas plants in 2012 compared to 35 percent for the heavier ends (C 4s & C 5+ ). These percentages were consistent through the decade, and are also similar to percentages for overall Canadian NGL production. Figure 1.4 illustrates production of gas plants NGLs by province in the same timeframe, 18 together with their respective shares for As can be observed, Alberta (AB) and British Columbia (BC) together accounted for 99 percent of NGL production from natural gas processing plants. While not readily apparent, one underlying trend in Figure 1.4 is that the main declines in NGL production from gas plants have occurred in AB and Nova Scotia (NS), while BC NGL production volumes remained relatively flat until 2010 at which point they started to increase rapidly. This is consistent with natural gas production trends in these respective areas. 18 Unless otherwise noted, the analysis presented in Parts IIV are discussed in the 2002 to 2012 timeframe
16 kb/d kb/d 8 Canadian Energy Research Institute Figure 1.4: Gas Plants NGL Production by Province (kb/d) ( ) and 2012 % Share of Total Saskatchewan Nova Scotia British Columbia Alberta Gas Plants NGLs 9% 90% 1% 0% Alberta British Columbia Nova Scotia Saskatchewan Source: Data from AER, BCMNGD, Statistics Canada, and CERI Estimates. Figures by CERI The main takeaway in regards to NGL production from gas processing plants is that the overall level of NGL production is largely (but not solely) affected by production of NGLs from gas plants, where ethane and propane are the largest components of the NGL barrel (about 2/3), and whereby regionally, BC and AB account for almost all the production of gas plant NGLs. Refinery LPG Production LPGs are a minor portion of the output from crude oil refineries as seen in Figure 1.5. Figure 1.5: Refined Petroleum Products from Canadian Refineries (kb/d) 19 ( ) and 2012 % Share of Total 2,500 Aviation gasoline (7) 2,250 2,000 1,750 2,051 2,127 2,159 2,096 2,064 2,118 2,031 1,971 2,016 1,911 1,934 Naphtha specialties (6) Stove oil, kerosene (11) Butane & butane mixes (4) Petroleum coke (16) Lubricating oils and greases (17) 4% 2% 1% 4% 1,500 1,250 Propane & propane mixes (3) Other petroleum products (20) Still gas (18) Asphalt (15) 4% 4% 4% 36% 1,000 Aviation turbo fuel Petrochemical feedstocks (5) 7% 750 Light fuel oil (13) Heavy fuel oil (14) 7% 500 Diesel fuel oil (12) 250 Motor gasoline (8) Crude Runs 26% Total RPPs Source: Data from Statistics Canada. 20 Figures by CERI. 19 The difference between crude runs and RPPs production is due to volumetric gains as RPPs tend to be lighter than the crude oil from which they are produced
17 kb/d Natural Gas Liquids (NGLs) in North America: An Update 9 Part I Upstream In 2012, propane and butanes, together, accounted for only three percent of total refined petroleum products (RPPs) from Canadian refineries. Meanwhile, motor gasoline, diesel fuel, as well as heavy and light fuel oils, combined, accounted for 75 percent of total output. Figure 1.5 also illustrates that production of RPPs has decreased from 2,051 kb/d in 2002 to 1,934 kb/d by 2012, or by six percent. While exports of RPPs have increased slightly over the same timeframe, so have imports (at a faster pace than exports), resulting in net exports of RPPs remaining flat to decreasing. Given a flat net export trend and lower overall production, this suggests that implied demand for RPPs in Canada (production + imports exports) has decreased over the last decade. 21 Lower demand for RPPs in turn results in a lower need for crude runs at Canadian refineries. As seen in Figure 1.6, production of LPGs from refineries has declined by 22 percent between 2002 and 2012 (14 kb/d net), suggesting that declines in refinery LPG volumes are partly responsible for overall NGL production volume declines. Figure 1.6: Refinery LPG Production by Liquid (kb/d) ( ) and 2012 % Share of Total % % 10 Butanes Propane Refinery production Propane Butanes Source: Data from Statistics Canada. Figures by CERI Regionally, refinery LPG production is consistent with the distribution of refining capacity in Canada as seen in Figure Table : Refinery supply of crude oil and equivalent. Available at: Table : Supply and disposition of refined petroleum products. Available at: 21 Production has in fact decreased for all RPPs except for diesel fuel oil, heavy fuel oil, and products under the other petroleum products category 22 Refinery capacity will be further discussed in the infrastructure section
18 kb/d 10 Canadian Energy Research Institute Figure 1.7: Refinery LPG Production by Region (kb/d) ( ) and 2012 % Share of Total % 23% SK & BC Quebec Alberta Ontario Atlantic Canada Total Refinery LPGs 6% 17% 18% Atlantic Canada Ontario Alberta Quebec SK & BC Source: Data from Statistics Canada and CERI estimates. Figures by CERI Furthermore, Figure 1.7 shows that on a regional basis, refinery LPGs production has declined in regions like Ontario (ON), Alberta and Quebec (QC); remained steady in British Columbia and Saskatchewan (SK), and increased in Atlantic Canada (NFLD, NS, and NB). CERI has identified at least two factors that are believed to be responsible for this trend. In regards to Ontario and Quebec (Central Canada), refinery closures over the past decade at Oakville and Montreal, respectively, have resulted in less crude being processed in this region. Lower crude runs (see Figure 1.8) have in turn resulted in lower production of RPPs overall, and therefore, lower production of refinery LPGs in these areas of the country. With the future prospect of the Dartmouth, NS 23 and Come by Chance, NFLD 24 refineries possibly closing down over the next few years, this trend could continue to be observed in other areas of the country as well (mainly Atlantic Canada). On the other hand, the construction of a new upgrading refining/complex in AB 25 (and possibly BC 26 ), as well as a gastoliquids (GTL) plant (Sasol), could offset some of those lost LPG volumes on the refining side of NGL production in Canada. 23 Imperial Oil, Media: Imperial Oil to Convert Dartmouth Refinery to Terminal: English/about_media_releases_ aspx 24 September 17, 2013: Calgary Herald: Update: Harvest refinery on block says report. Refining glut makes sale of Come by Chance facility unlikely: analyst. Accessed at: lsa=19d7b103, on September 17, 2013 Given the fate of various refineries in the Atlantic basin over the last few years, it would not be unreasonable to assume that if the refinery fails to find a buyer, it will be shut down and turned into a terminal operation 25 See: North West Upgrading, Investor Presentation, November 2012: 26 See: Kitimat Clean Ltd.:
19 kb/d kb/d Natural Gas Liquids (NGLs) in North America: An Update 11 Part I Upstream Figure 1.8: Refining Capacity and Crude Runs in Ontario (L) & Quebec (R) (kb/d) ( ) PetroCanada Products (Oakville) Closure Shell Canada Products (Montreal) Closure Crude Capacity Crude Runs Crude Capacity Crude Runs Source: Data from Statistics Canada, and CAPP. 27 Figures by CERI Contrary to developments in Central Canada, a series of refinery expansions and modifications over the last decade have resulted in overall refining capacity increases in the Western (BC, AB, and SK) and Atlantic Canada regions. After accounting for closures in Central Canada and expansions as well as modifications/ expansions in Western and Atlantic Canada, overall Canadian refining capacity has actually increased by six percent from about 2,003 kb/d of capacity in 2002 to 2,130 kb/d by Meanwhile, the number of refineries has gone from 21 to 18 during the same timeframe. 28 In both Western and Atlantic Canada, this has resulted in an overall increase in crude runs over the decade. However, this has not resulted in increases in refinery LPGs production in both regions. This suggests that in respect to refinery LPGs production, not only how much crude goes to the refinery matters, but also the type of crude. As seen in Figure 1.9, the crude slate (or diet) of refineries in these areas is rather different. In Western Canada, refineries process a variety of different crudes, yet as can be observed, the share of synthetic and heavy crudes processed has increased over time. 27 Table 0703B: Refinery Crude Oil Capacity Canada; Table 0705A: Refinery Closures Canada. Available at: 28 Refineries closed over the last decade in Canada include those in Oakville, ON (2005); Montreal, QC (2010); and Bowden, AB (2012)(Total Capacity = 215 kb/d)
20 kb/d kb/d 12 Canadian Energy Research Institute Figure 1.9: Crude Runs by Type in Western (L) and Atlantic (R) Canada (kb/d) ( ) Pentanes Plus & Condensates Crude Bitumen Conventional Heavy Conventional Light Synthetic Total crude and equivalent charged Conventional Heavy Conventional Light Total crude and equivalent charged Source: Data from Statistics Canada. Figures by CERI In 2012, these types of crudes (combined) accounted for about 75 percent of the total crudes processed in the region compared to about 55 percent in This matters because both synthetic and heavy crudes have a lower volume percentage of light ends such as propane and butanes 29 (LPGs). Thus, while overall crude runs have increased, refinery LPGs production in the (Western) region have decreased as a function of a change in the crude slate or diet. In Atlantic Canada, crude runs have increased, but the crude slate has also changed from about 90 percent light and 10 percent heavy in 2002, to almost 100 percent light by Therefore, a combination of increased crude runs and a switch to a lighter crude feedstock helps to explain the overall increase in refinery LPGs production in the Atlantic region. This increase, however, has not been large enough to offset decreases across other regions in Canada (both Western and Central Canada). Going forward, considering how RPPs demand could change in Canada, and how crude runs could change across the country based on refining capacity changes (closures, expansions/ modifications, or additions) as well as understanding the possible changes in crude slates, will determine the outlook for refinery LPGs production. Oil Sands Upgraders SGL Production Synthetic gas liquids (SGLs) are a mix of paraffinic 30 and olefinic 31 hydrocarbon liquids that are recovered from offgases produced during the crude bitumen and heavy conventional crude upgrading and refining processes. 29 See: and, CERI s Study No. 130: Natural Gas Liquids (NGLs) on North America: Overview and Outlook to Ethane, propane, butanes, and pentanes plus 31 Ethylene, propylene, butylene, and olefinic condensate
21 kb/d kb/d Natural Gas Liquids (NGLs) in North America: An Update 13 Part I Upstream The upgrading process aims to produce a light synthetic (sweet or sour) crude oil (SCO) similar to conventional light crude. Once extracted, SGLs are further separated into their individual components just like NGL mixes, in order for the products to be transported and marketed. As can be observed in Figure 1.10, production of SCO in Western Canada has more than doubled between 2002 and 2012 (a 126 percent increase). In 2012, the largest share (68 percent) of SCO was produced at the integrated mining and upgrading projects in the Athabasca oil sands area (Suncor, Syncrude, and CNRL). Another 22 percent was produced in the AB Industrial Heartland (Fort Saskatchewan area, AOSP Scotford upgrader), even though the bitumen feedstock for this project comes primarily from mining projects in the Athabasca area. The remaining less than ten percent was produced from insitu projects. 32 Figure 1.10: Synthetic Crude Oil (SCO) Production in Western Canada by Project (L) and Area (R) (kb/d) ( ) 1,200 1, OPTI/ Nexen Long Lake CNRL Horizon Husky Lloydminster Shell Scotford Suncor Base Mine Syncrude Mildred Lake Total SCO Production ,200 1, Athabasca Area (Insitu) Lloydminster Cold Lake Area (Insitu) AB Industrial Heartland Athabasca Area (Mining) Total SCO Production Source: Data from AER, AESRD, and Husky Energy. 33 Figures by CERI Figure 1.11 displays production of offgases 34 by project and by area. A distinction is made in these charts between the total offgases produced from all projects and the total excluding the OPTI/Nexen Long Lake project. The reason for this distinction is that this particular project was purposely designed to fully utilize its offgases for both fuel and steam production for its insitu steam assisted gravity drainage (SAGD) operations in order to reduce natural gas usage. 32 This is a simple generalization as Suncor s upgrader processes insitu volumes while the Scotford upgrader could potentially source feedstock from insitu projects. Furthermore, the majority of the Lloydminster upgrader s feedstock is conventional heavy crude from SK and AB as opposed to crude bitumen 33 Husky Energy, Investor Relations, Annual Reports & Fillings: Information retrieved from Annual Information Forms (AIF) from 2002 to Available at: 34 The term offgases and process gas will be used interchangeably in this section
22 MMcf/d MMcf/d 14 Canadian Energy Research Institute Figure 1.11: Upgrader Offgas Production by Project (L) and Area (R) (MMcf/d) ( ) OPTI/ Nexen Long Lake CNRL Horizon Husky Lloydminster Shell Scotford Suncor Base Mine Syncrude Mildred Lake Total Upgrader OffGas Production Total Excluding OPTI/ Nexen Long Lake AER ST98 (MMcf/d) Athabasca Area (Insitu) Lloydminster Cold Lake Area (Insitu) AB Industrial Heartland Athabasca Area (Mining) Total Upgrader OffGas Production Total Excluding OPTI/ Nexen Long Lake AER ST98 (MMcf/d) Source: Data from AER, ERCB, and CERI Estimates. 35 Figures by CERI This project is therefore using its offgases in a closed loop system and the offgases are not likely available for SGLs extraction. It is important to point out that the Long Lake project only accounted for about three percent of total SCO production in 2012, yet it produced about 30 percent of the total upgrader offgases. Therefore, it is important to consider that the amount of offgases produced by an upgrading operation will largely depend on the technology being used. 36 As an example, CERI estimates that a coking upgrader such as those used in the Suncor, Syncrude, and CNRL operations produce between thousand cubic feet (mcf) of offgases per barrel of SCO produced, while the ratios for hydrocracking (Shell) and OrCrude (OPTI/ Nexen) upgraders are 0.8 and 6.1, respectively. Furthermore, SGLs recovered from offgas produced by coking upgraders (Suncor and CNRL) have a significant olefinic content and require segregation from the paraffinic NGLs produced by gas plants, and refineries; SGLs recovered from hydrocracking upgraders (Shell) 37 tend to contain a low to minimum olefinic content and be primarily composed of NGLs. 35 CERI estimates for the years are based on analysis of SCO, offgas, and SGLs production data from AER ST39 and analysis conducted by CERI and presented in Study No Offgas production as presented in AER ST98 is provided in these charts as a means of reference and to provide validation for CERI s estimates 36 Generally, the upgrading process involves removing carbon (via coking) or adding hydrogen (via hydrocracking). The OPTI Orcrude upgrader uses proprietary technology that combines gasification and hydrocracking processes. 37 Syncrude s upgrading operations include delayed coking (carbon removal) and hydro cracking (hydrogen addition). The proposed Northwest Redwater refinery/upgrader will be a hydro cracking upgrader
23 MMcf/d Natural Gas Liquids (NGLs) in North America: An Update 15 Part I Upstream Figure 1.12 presents the supply of disposition of offgases (process gas) over the 2008 to 2012 period 38 for the integrated mining projects. 39 Supply (or availability) (grey bars) is the sum of upgrader offgas production plus deliveries to the upgraders (either from onsite refineries/ other plants (Shell), as well as from SGLs extraction plants (Suncor and Shell)). Use (or disposition) (red bars) is the sum of offgas flaring, use for upgrading, use for plant fuel, and deliveries to SGLs extraction plants. Figure 1.12: Offgas Supply and Disposition (MMcf/d) ( ) and 2012 % Share of Total % 1% 16% % 20% % 100 (100) Process Gas Flared/ Wasted Process Gas Further Process (Upgrading) Process Gas Deliveries (Leaves the Plant) Process Gas Fuel/ Plant Use Statistical Difference Process Gas Receipts (Enters the Plant) Process Gas Production Total Process Gas Supply Total Process Gas Disposition S D S D S D S D S D Process Gas Production Process Gas Receipts (Enters the Plant) Process Gas Flared/ Wasted Process Gas Further Process (Upgrading) Process Gas Deliveries (Leaves the Plant) Process Gas Fuel/ Plant Use Source: Data from AER. Figures by CERI Given the strong level of activity in the oil sands over the last decade, which has in turn resulted in increasing levels of SCO production and offgases, there has been an increased availability of SGLs in Western Canada. In 2012, close to 80 percent of the process gas or offgas available from the upgraders in question was used for upgrading and plant fuel purposes, while less than 20 percent was sent to offgas SGLs extraction plants. This suggests that a large potential for SGLs extraction from upgraders is currently not being realized. As can be seen in Figure 1.13, CERI estimates SGLs availability has nearly doubled over the past decade from about 57 kb/d in 2002 to over 100 kb/d by These SGLs present the opportunity for a possible alternative source of petrochemical feedstock but could also be directed to other NGL markets. 38 This timeframe has been chosen given data availability limitations. The OPTINexen project is excluded from this analysis as per comments above. The Lloydminster upgrader is not included as data is not available on the production or use of offgases. It is assumed that the majority of the process gas in this upgrader is used for upgrading purposes and plant fuel use as it is the case with the upgraders for which data is available 39 Includes the Suncor, Syncrude, CNRL, and Shell upgraders
24 kb/d kb/d 16 Canadian Energy Research Institute Figure 1.13: SGLs Potential by Area (L) and Type (R) (kb/d) ( ) Lloydminster Cold Lake Area (Insitu) AB Industrial Heartland Athabasca Area (Mining) Estimated SGLs Potential (kb/d) Propane+ Mix Ethane/ Ethylene Mix Estimated SGLs Potential (kb/d) Source: CERI estimates based on various data sources. 40 Figures by CERI Currently, two projects in AB recover this type of liquid hydrocarbon mix from oil sands upgraders offgases. These are the Williams Fort McMurray extraction plant located in the Athabasca (oil sands) area, 41 which started operation in 2002; and the AuxSable Heartland offgas plant located in the Fort Saskatchewan area, 42 which started operating in late Williams also owns and operates a fractionator at Redwater to process olefinic SGLs. On a contractual basis, these plants extract SGLs from the offgas stream and replace the heating value extracted with the equivalent volume of natural gas, making the economics of such projects very attractive in a low natural gas and high NGLs/olefins price environment. 43 Figure 1.14 displays CERI s estimates for SGLs extraction from these operations over the last decade. To put these figures into context, the estimated 13 kb/d of SGLs extracted in 2012 represented about 13 percent of the estimated 108 kb/d of SGLs in the offgas stream, but only two percent of the total NGLs produced in Canada in that year. Going forward, the potential for SGLs extraction from these operations will be dictated by the level of SCO production (and thus overall oil sands activity and upgrading operations) as well as by any modifications/expansions or new builds of SGLs extraction plants. 40 See Study No Processes offgases from Suncor s Base upgrader 42 Processes offgases from Shell s Scotford upgrader 43 Generally reflective of high crude oil to natural price spread
25 kb/d Natural Gas Liquids (NGLs) in North America: An Update 17 Part I Upstream Figure 1.14: Upgrader Offgas SGL Extraction Estimates (kb/d) ( ) and 2012 % Share of Total % 5% 3% Olefinic Condensate Butane/ Butylene Propane/ Propylene Ethane/ Ethylene Total Upgrader OffGas SGLs Ethane/ Ethylene Butane/ Butylene 65% Propane/ Propylene Olefinic Condensate Source: CERI estimates. 44 Figures by CERI Williams has recently completed modifications at their Fort McMurray extraction plant and their Redwater fractionation facility to allow for ethane/ethylene extraction, while they are also currently building a new cryogenic extraction plant that will extract SGLs from CNRL Horizon s upgrader. 45 Williams also recently announced the possibility of building an additional offgas extraction facility at the Syncrude site beyond These developments will increase SGLs extraction in the coming years, increasing the share of SGLs in total NGL production and thus diversifying NGL supplies from the more traditional sources. 44 Total production numbers for are actuals retrieved from AER ST estimates by CERI. Estimates based on data and analysis presented in Figure 9 12 plus information retrieved from Williams. Williams in Canada. Available at: 45 Williams Energy, Investors, Presentations, 2013 TD Securities Calgary Energy Conference Presentation. Available at: pgGlvoY3xfa1u0zTjhcPTN2g%3D, Slide 11
26 18 Canadian Energy Research Institute

27 Natural Gas Liquids (NGLs) in North America: An Update 19 Part I Upstream United States NGL Production ( ) The shale gas revolution in the United States (US) has driven natural gas production beyond historic levels and has fundamentally shifted the dynamics of other energy markets that compete with or are related to natural gas, such as NGLs. US NGL production has been steadily increasing since 2008 surpassing 3,000 kb/d in Hydraulic fracking technologies that were first developed in the Barnett Shale in Texas have been transferred to other shale reservoirs, resulting in a significant increase in shale gas drilling. It is the rich NGL compositions in some of these reservoirs that make their development economically viable, even in depressed gas price environments. This trend of increased production of NGLs is likely to continue given the significant size and number of shale basins in the US. Figure 2.1 illustrates some of the major shale basins in the lower 48 states. Figure 2.1: Shale Plays in the Lower 48 States Source: EIA Energy Information Administration, Lower 48 states shale plays,
. 48 Figure 2.")
28 20 Canadian Energy Research Institute Since NGL prices are typically linked to oil prices, the oilgas price spread has resulted in exploration and production shifting to liquidrich plays such as the Permian, Anadarko, Williston, Eagle Ford and Niobrara. Figure 2.2 shows the average gallons of NGLs produced per thousand cubic feet of gas processed ( gallons per mcf or GPM). 48 Figure 2.2: Average GPM of Shale Plays in the Lower 48 States Source: NPC 49 The GPM can vary widely basin to basin. Lean or dry gas typically has a GPM of between 12, rich gas between 34, and very rich gas greater than The National Petroleum Council (NPC) estimates that the average GPM for the US in 2010 was 1.25, however some plays can have GPMs of over 5, for example the Granite Wash play in the Texas panhandle region has the highest average GPM at 5.3, followed by the Eagle Ford in southern Texas at Of course certain areas within a play will have a higher GPM, for example, some areas of the Marcellus and Utica shales have recorded GPMs of up to GPM = 1 gallon/mcf x (1,000 mcf/1 MMcf) x (1b/42 gallons) = 1 x 1,000 / 42 = 23 bbl/mmcf 49 National Petroleum Council, Paper #113 Natural Gas Liquids (NGLs) Working Document of the NPC North American Resource Development Study, Made Available September 15, In Canada, liquids yields are generally measured in barrels of NGLs per million cubic feet of gas (bbls/mmcf). Lean gas generally has a liquids yield of less than 50 bbls/mmcf, while rich gas is generally up to 100 bbls/mmcf, anything over 100 bbls/mmcf is considered very rich. 51 National Petroleum Council, Paper #113 Natural Gas Liquids (NGLs) Working Document of the NPC North American Resource Development Study, Made Available September 15, John C. Powell, Analysis of the NGL Supply and Utilization Strategies,
29 kb/d Natural Gas Liquids (NGLs) in North America: An Update 21 Part I Upstream Total NGL production in the US has increased 32 percent since 2005; the majority of this increase can be attributed to NGLs from natural gas processing plants, which increased 39 percent over the same period. Natural gas processing plants produced 79 percent of NGLs in the US with refineries producing only 21 percent. Figure 2.3: US NGL Production by Source (kb/d) (200212) and 2012 % Share of Total % Refineries Gas Plant Total NGLs 79% 0 Gas Plant Refineries Source: EIA data. 53 Figures by CERI In 2012, there were more than 500 natural gas processing plants that in total processed about 48 bcf/d of gas to produce about 2.4 million barrels of NGLs per day. 54 The majority of the gas processing plants are located along the Gulf Coast, in the West Texas/Oklahoma area as well as in the Rockies. The rising supply of NGLs has led to challenges in finding markets and building the infrastructure necessary to move product to markets, both domestic and export. For example, much of the increased ethane supply in the Marcellus region is stranded because of the distance from petrochemical markets in the Gulf Coast area as well as the lack of proper extraction capacity. 53 Energy Information Administration data, 54 Energy Information Administration data,

 (20022012) and 2012 % Share of Total 2500 2000 1880 1719 1809 1717 1739 1783 1784 1895 2056 2197 2390 13% 1500 17% 41% 1000 500 0 Pentanes+/Condensate")

30 kb/d kb/d 22 Canadian Energy Research Institute Gas Plant NGL Production Ethane makes up the largest proportion of NGLs from natural gas processing plants, accounting for 41 percent in 2012, closely followed by propane at 30 percent. Ethane and propane also account for the majority of growth in NGLs over the decade. Butanes and Pentanes Plus make up smaller contributions, at 17 and 13 percent, respectively, and have also increased, albeit off a smaller base. Figure 2.4: Gas Plant NGL Production by Liquid (kb/d) ( ) and 2012 % Share of Total % % 41% Pentanes+/Condensate Butanes Propane Ethane Gas Plant NGL Total Ethane Butanes 30% Propane Pentanes+/Condensate Source: EIA data. Figures by CERI Together, PADDs II, III and IV make up 96 percent of gas plant NGL production. The Gulf Coast region of PADD III dominates the US market, accounting for 62 percent of NGLs from gas plants in This is not surprising since it is home to some of the largest and mature plays, such as the Anadarko, Permian, and Eagle Ford. Figure 2.5: Gas Plant NGL Production by PADD (kb/d) ( ) and 2012 % Share of Total % 3% 2% 18% PADD 1 PADD 5 PADD 4 PADD 2 PADD 3 Gas Plant NGL Total 62% PADD 1 PADD 2 PADD 3 PADD 4 PADD 5 Source: EIA data. Figures by CERI
 share of NGL production has increased from 11 percent in 2002 to 16 percent in 2012.")
31 Natural Gas Liquids (NGLs) in North America: An Update 23 Part I Upstream PADDs II and IV have both experienced increases in NGL production, which is consistent with natural gas production increasing in those regions. PADD IV s (Rockies) share of NGL production has increased from 11 percent in 2002 to 16 percent in PADD II s (Midwest) share has increased from 16 percent in 2002 to 18 percent in Historically, PADD I has produced very few NGLs, but this trend is about to change. Development in the wet (liquidsrich) portion of the Marcellus and Utica shale in Pennsylvania, Ohio, and West Virginia, is drastically increasing the amount of natural gas and NGLs that can be produced in the region. Figure 2.6 shows the increase in natural gas production in the northeast US over the past five years and its effect on inflows from other areas. Figure 2.6: PADD I Production, Demand and Net Inflow from Other Regions Source: EIA 55 Along with this surge in natural gas production, comes an increased volume of NGLs. Companies such as MarkWest are investing in gas plant, pipeline, and fractionator infrastructure in order to produce purity NGL products in the region. 56 As investment into NGL infrastructure increases in the region, more and more purity products will be produced and less ethane being produced in the northeastern US will be rejected (not extracted) back into the natural gas stream. Refinery LPG Production In 2012, LPGs produced in refineries accounted for 21 percent of total NGLs produced in the US. Propane and butane together accounted for 17 percent of total refined petroleum products in 2012 from US refineries. Motor gasoline and diesel fuel make up the largest proportion of total output at 63 percent. 55 Energy Information Administration, Today in Energy, Increased Northeast natural gas production reduces net inflow of supply from other areas, 56 MarkWest Operations website,
 in 2005 down to 20 MMb/d in 2012, an 11 percent")

 (20022012) and 2012 % Share of Total 25 20 15 10 21 21 22 22")


32 kb/d MMb/d 24 Canadian Energy Research Institute Production of refined products has declined from a peak of 22 million barrels per day (MMb/d) in 2005 down to 20 MMb/d in 2012, an 11 percent decline over seven years. In contrast, production of LPGs from refineries has remained fairly constant over the decade, with production between 600 and 650 kb/d. Figure 2.7: Refined Petroleum Products (MMb/d) ( ) and 2012 % Share of Total Kerosene Aviation Gasoline Lubricants Asphalt and Road Oil Petroleum Coke Residual Fuel Oil Propane/Propylene Other Petroleum Products Jet Fuel 6% 2% 2%1% 6% 7% 11% 44% 5 Liquefied Petroleum Gases Distillate Fuel Oil Motor Gasoline Total Petroleum Products 19% Source: EIA data. Figures by CERI Propane and butane make up the largest portion of NGLs from refineries, with a very small amount of ethane also being produced. Figure 2.8: Refinery LPG Production by Liquid (kb/d) ( ) and 2012 % Share of Total % 3% Ethane 300 Butanes Propane Refinery production 88% Ethane Propane Butanes Source: EIA data. Figures by CERI
33 kb/d Natural Gas Liquids (NGLs) in North America: An Update 25 Part I Upstream Regionally, refinery LPG production is consistent with the distribution of refining capacity in the US. PADD III accounts for the greatest share of LPG production. It has remained relatively stable at about 400 kb/d since 2002, accounting for about 65 percent of NGLs produced. The regional breakdown of NGLs from refineries has remained fairly stable over the decade, reflecting limited investment and infrastructure into refinery expansions but also consistent crude slates. Figure 2.9: Refinery LPG Production by PADD (kb/d) ( ) and 2012 % Share of Total % 1% 6% % PADD 4 PADD 1 PADD 5 PADD 2 PADD 3 Total Refinery LPGs 65% PADD 1 PADD 2 PADD 3 PADD 4 PADD 5 Source: EIA data. Figures by CERI The outlook for the upstream NGL segment is optimistic, with increases in NGL production across most regions of the country. While most of the NGL action in the US has traditionally centered on the Gulf Coast region, the Midwest, East Coast, and the Rockies are all steadily becoming major players in the NGL market. Given that NGL growth stems from both mature plays with existing infrastructure and newer plays where the infrastructure is still developing, the midstream sector will play an important role in ensuring the continued success of the NGL market in the US.
34 26 Canadian Energy Research Institute
35 Natural Gas Liquids (NGLs) in North America: An Update 27 Part I Upstream Analysis: Canadian Gas Producers Adapting to Changing Natural Gas Market Dynamics in North America There is no question that natural gas markets in North America have changed dramatically over the past decade. Given the high level of interconnection between natural gas production and NGL production, it is important to examine some of the changes that have taken place in the North American context and discuss issues that could affect the future of this market and thus NGL markets. The advent of horizontal drilling and hydraulic fracturing (amongst other components of process innovation) has resulted in a revolution in shale gas production in North America which was unforeseen by many. As natural gas markets tend to be more regional than global (based on transportation and infrastructure constraints), Western Canadian Sedimentary Basin (WCSB) producers are by no means insulated from the changes in market dynamics in North America. This feature describes two broad issues which CERI believes have changed how WCSB producers participate in the North American gas market, and how these changes are in turn leading to changes in NGL production and dynamics. Physical Changes: Emerging Supply Sources, Interbasin and Intrabasin GasonGas Competition In order to understand how changes in natural gas markets in North America are affecting the Canadian natural gas market, the starting point is to understand those changes that have taken place in natural gas supply and demand balances in Canada. Figure 3.1 presents the supply and demand (or disposition) balances for natural gas in Canada. 57 Starting with the supply side (grey bars), a few trends are apparent. First, marketable gas production in Canada has decreased by 19 percent between 2002 and 2012 (or 3,155 million cubic feet a day (MMcf/d) in net). This trend is directly tied to a similar decrease in raw gas production across Canada, combined with increases in reservoir injection, 58 natural gas use at the field level, and net storage receipts, offset with decreases in flaring and venting, gas use at the plant and pipeline level, and lower shrinkage volumes Marketable gas production = Raw gas production (gas uses at the field and plant level + shrinkage + net storage) 58 For applications such as enhanced oil recovery (EOR) or reservoir repressurization 59 Raw gas component removal such as carbon dioxide, hydrogen sulfide, and/or NGLs
36 MMcf/d 28 Canadian Energy Research Institute Figure 3.1: Canadian Marketable Natural Gas Supply and Disposition (MMcf/d) ( ) and 2012 % Share of Total 20,000 18,000 16,000 14,000 12,000 10,000 17,593 17,119 17,411 17,485 17,004 18,190 17,678 16,650 16,977 17,382 16,783 Total Domestic Demand Exports Other Imports (LNG) US Imports 18% 49% 51% 8,000 6,000 4,000 Canadian Marketable Gas Production Marketable Gas Supply in Canada 82% 2,000 S D S D S D S D S D S D S D S D S D S D S D Marketable Gas Disposition in Canada Canadian Marketable Gas Production Total Imports Exports Total Domestic Demand Source: Statistics Canada Data 60 and CERI estimates. Figures by CERI Furthermore, imports, primarily from the US, have increased rapidly by over 2,000 MMcf/d between 2002 (639 MMcf/d) and 2012 (2,867 MMcf/d). Decreased production and increased import trends have in turn resulted in a decrease in marketable gas supply in Canada of four percent (or close to 1,000 MMcf/d) between 2002 and On the demand or disposition side (red bars), a couple of trends are apparent. The main trend indicates that exports (which accounted for 60 percent of disposition in 2002 and 51 percent in 2012) have declined rapidly by close to 2,000 MMcf/d between 2002 and Meanwhile, domestic demand has increased. Figure 3.2 illustrates domestic demand in Canada both by sector (top) and by province (bottom). On a sector by sector basis, the industrial, residential, and power generation sectors (combined) accounted for about threequarters of total domestic demand in These sectors have also grown the fastest over the 2002 to 2012 timeframe. On a provincial basis, AB and ON accounted for almost three quarters of the total natural gas demand in 2012 and have also been the two jurisdictions leading domestic demand growth. Overall, the supply and demand picture for natural gas in Canada in the 2002 to 2012 timeframe has been characterized by lower production levels and lower export volumes, higher import volumes, as well as increased demand across the industrial, power generation, and residential sectors led by increases in AB and ON. 60 Table : Supply and disposition of natural gas. Available at: Table : Supply and demand of primary and secondary energy. Available at:
 and by Province (Bottom) (MMcf/d) (2002 2012) and 2012 % Share of")
 Commercial")


, it is important to put into context how changes in the US gas market")
 and by shale play (bottom) for context.")
 which in 2002 accounted for 73")
37 MMc/d MMcf/d Natural Gas Liquids (NGLs) in North America: An Update 29 Part I Upstream Figure 3.2: Natural Gas Demand in Canada by Sector (Top) and by Province (Bottom) (MMcf/d) ( ) and 2012 % Share of Total 9,000 8,000 7,000 6,000 5,000 4,000 3,000 2,000 1,000 8,415 8,245 7,664 7,621 7,732 7,175 7,305 7,439 7,231 7,207 7,130 Public Administration Agriculture Transportation Other Input Use (RPPs, Steam, NonEnergy) Commercial and Institutional Power Generation Residential Industrial Domestic Demand 15% 18% 1% 7% 3%1% 20% 35% 9,000 8,000 7,000 6,000 5,000 4,000 3,000 2,000 1,000 8,415 8,245 7,175 7,305 7,664 7,621 7,732 7,439 7,231 7,207 7,130 Northwest Territories, Nunavut, and Yukon Atlantic Canada Manitoba Quebec British Columbia Saskatchewan Ontario Alberta Total Canadian Demand 8% 8% 7% 2%2% 34% 0% 39% Source: Statistics Canada Data and CERI estimates. Figures by CERI With the US being Canada s largest trading partner (not only in general terms but also in regards to natural gas and other energy commodities), it is important to put into context how changes in the US gas market are having an effect on Canada. Figure 3.3 displays production of raw natural gas in the US by source (top) and by shale play (bottom) for context. Overall, US raw gas production has increased by 22 percent (or by about 15,000 MMcf/d) from 2002 to By source, production from conventional gas wells (including onshore and offshore) which in 2002 accounted for 73 percent of total production, has decreased by close to 30 percent by 2012 and accounted for only 42 percent of total US gas production in that year.
38 MMcf/d MMcf/d 30 Canadian Energy Research Institute Figure 3.3: US Natural Gas Production by Source (Top) and by Shale Play (Bottom) (MMcf/d) ( ) 90,000 80,000 70,000 66,667 67,823 70,365 69,727 70,753 66,935 69,386 70,061 72,073 76,008 81,622 60,000 50,000 40,000 30,000 20,000 10,000 Shale Gas CBM Oil Wells Gas Wells Total Gas Production Production Exc. Shale Gas 30,000 25,000 20,000 15,000 10,000 5,000 0 Antrim (MI, IN, and OH) 25,692 Bakken (ND) Woodford (OK) 21,273 Other US shale gas Eagle Ford (TX) Fayetteville (AR) 14,541 Barnett (TX) Marcellus (PA and WV) 9,517 Haynesville (LA and TX) Total Shale Gas Production 7,013 4,816 2,699 2,106 1,074 1,227 1,363 Source: Data from EIA 61,62 and CERI estimates. Figures by CERI Production from oil wells, or associated gas, has remained relatively flat over the 2002 to 2012 timeframe (~16,000 MMcf/d) and accounted for about 20 percent of total gas production in 2012 versus 25 percent in Coalbed methane (CBM) production (gas from coal seams) has increased by close to tenfold from about 500 MMcf/d in 2003 to close to 5,000 MMcf/d in US Energy Information Administration (EIA), Natural Gas, Production, Natural Gas Gross Withdrawals and Production. Available at: US EIA, Energy in Brief, What is shale gas and why is it important? Available at: 62 Other shale plays in the US include: Granite Wash (TX, OK), Niobrara (CO, WY, NB, KS), Bossier (TX, LA) and others 63 Overall US conventional production (from gas and oil wells) declined through the decade, yet. areas like the Rockies saw significant growth in production levels earlier in the decade while other regions continued to decline 64 Mainly in Wyoming, Colorado, and New Mexico (US Rockies and northern US gulf coast region)
39 Natural Gas Liquids (NGLs) in North America: An Update 31 Part I Upstream Considering these three sources combined (conventional, associated and CBM, excluding shale gas), US gas production would have continued on a production decline trend and drop by 15 percent (about 10,000 MMcf/d) between 2002 and 2012 (red dots on top chart, Figure 3.3). However, between 2002 and 2012 production of natural gas from shale formations or resource plays in the US, thanks in large part to innovations in drilling and completion techniques as well as economies of scale, increased at an unprecedented pace from just over 1,000 MMcf/d in 2002 to close to 26,000 MMcf/d by 2012, that is, a 25fold increase in 11 years (Figure 3.3, bottom). From the start of the 2002 to 2012 timeframe, shale plays like the Barnett in north central Texas increased production volumes at an accelerated pace, followed by other shale plays including the Fayetteville in Arkansas, the Haynesville in east Texas/west Louisiana, and most recently the Marcellus in Pennsylvania and West Virginia, as well as the Eagle Ford in southern Texas. By 2012, natural gas from shale plays accounted for close to one third (31 percent) of total US raw production, compared to two percent back in In turn, in 2012, six shale plays including the Haynesville, Marcellus, Barnett, Fayetteville, Eagle Ford and Woodford, combined, accounted for over 90 percent of US shale gas production. 65 Meanwhile, the increase in raw gas production ( ) has translated into an increase of 27 percent in marketable (dry) gas production 66 (+>14,000 MMcf/d in net) as represented by the red dots on Figure 3.4 (top chart). However, total gas demand in the US during the same timeframe has only increased by 11 percent (or by close to 7,000 MMcf/d net) from about 64,000 MMcf/d in 2002 to ~70,000 MMcf/d by While demand in the residential, commercial, and industrial sectors (combined) has actually declined by about nine percent (~3,700 MMcf/d lower); 67 demand has increased across the transportation, power generation, and lease, plant, and pipeline sectors (combined) by over 50 percent (~10,500 MMcf/d in net), mainly driven by the power generation sector s net increase of over 9,000 MMcf/d. Thus, while US demand for natural gas increased driven by power generation (now the largest demand component in the US), and also due to increased activity in the lease, plant, and pipeline segments production has far outpaced such demand increases. In that situation the logical outcome is a reduced need for gas coming from outside the US (imports) as seen on Figure 3.4 (bottom). 65 This in turn has important implication in regards to US NGLs production as development around the Marcellus, Eagle Ford, and Bakken areas is either related to wet gas or associated/solution gas sources, both of which have high NGLs contents 66 Marketable (dry) gas production = raw gas production minus the sum of gas used for repressuring (reservoir injection), venting and flaring, as well as component removal (including NGLs and other nonhydrocarbon gases) 67 In 2002, these three demand sources (combined) accounted for 68% of total US gas demand compared to 56% by 2012
, Imports and Trade with Canada (Bottom) (MMcf/d) (20022012) 80,000 70,000 60,000 50,000 40,000 30,000 20,000 10,000 63,088 61,032 61,377 60,314 59,450 63,298")


 which appear to reach a peak by 2007 (of over 12,000 MMcf/d) and then drop rapidly (to less than 9,000 MMcf/d by 2012).")
40 MMcf/d MMcf/d 32 Canadian Energy Research Institute Figure 3.4: US Natural Gas Demand by Sector (Top), Imports and Trade with Canada (Bottom) (MMcf/d) ( ) 80,000 70,000 60,000 50,000 40,000 30,000 20,000 10,000 63,088 61,032 61,377 60,314 59,450 63,298 63,773 62,767 65,138 66,535 69,869 Transportation Lease, Plant, Pipeline Commercial Residential Industrial Power Generation Total Gas Demand 16% 12% 8% 0% 28% 36% Marketable Production 14,000 12,000 10,000 8,000 11,667 11, ,805 9,851 8,675 8,800 11,893 9,157 11,469 12,624 8,901 9,042 10,915 8,303 LNG CAD > US Net CAD > US Total US Imports US > CAD 10,278 10,249 9,503 8,597 6,000 4,000 2,000 7,042 6,962 5,938 5,451 2,567 2,660 1,919 2,024 1,081 1,321 1, Source: Data from EIA, 68 CERI estimates for Figures by CERI Looking back at Figure 3.3, a flat to decreasing production trend was seen in the US until about 2007, after which point, rapid increases in production (led by increases in shale gas production) were the norm. This helps explain the trend in US gas imports (Figure 3.4, bottom) which appear to reach a peak by 2007 (of over 12,000 MMcf/d) and then drop rapidly (to less than 9,000 MMcf/d by 2012). Liquefied natural gas (LNG) imports accounted for between 5 and 15 percent of total US imports from 2002 to 2012, and have gone from a peak of over 2,000 MMcf/d in 2007 to less than 500 MMcf/d by EIA, Natural Gas, Consumption, Natural Gas Consumption by End Use. Available at: EIA, Natural Gas, Imports/Exports. Available at:
41 Natural Gas Liquids (NGLs) in North America: An Update 33 Part I Upstream Canadian imports, which account for the largest share of US imports, declined by 22 percent (over 2,000 MMcf/d) between 2002 and 2012 from over 10,000 MMcf/d to about 8,000 MMcf/d. Meanwhile, US gas exports to Canada have increased from about 500 MMcf/d in 2002 to close to 3,000 MMcf/d by This has resulted in net exports from Canada to the US, declining by 45 percent (4,400 MMcf/d) between 2002 and Figures 3.5 and 3.6 help to further explain and illustrate the ongoing changing dynamics in North American natural gas markets. The top portion of Figure 3.5 illustrates demand for US gas on a regional basis where it can be observed that PADDs I, III, and II combined (East Coast, Gulf Coast, and Midwest, respectively) accounted for over 80 percent of US gas demand in The middle left chart illustrates the location of the various shale plays in the US to place into context where the growth in shale gas has occurred over the last decade. Based on the data presented in Figure 3.3, it has mainly taken place around the US Gulf Coast as well as the east coast areas and to some extent in the US Midwest (OK). In turn, these areas are also some of the largest US natural gas markets. The middle right map of Figure 3.5 illustrates production of marketed gas in the US by state with the largest producing states shown in the darker shades of blue and nonproducing regions in light grey. The arrows represent the directional flows from the producing regions to the demand areas. As can be observed, some of the largest markets for gas such as PADDs I, II, V (west coast), as well as Eastern Canada do not produce enough volumes to be selfsufficient and thus rely on flows from other areas. Meanwhile, producing areas such as PADDs III, IV (Rockies), and the WCSB rely on markets outside their respective regions to market their surplus gas, moving low cost local gas to premium priced markets. The bottom map of Figure 3.5 illustrates the gas transportation infrastructure that was completed over the last few years in the US. These new pipelines provide direct competition to WCSB natural gas in US markets. The Bison, 71 Ruby, and Rockies express (REX) pipelines 72 were built to provide outlets for large increases of conventional, shale gas, and CBM supplies out of the Rockies and lower Midwest areas, mainly in areas like Wyoming, Oklahoma, Colorado, and Utah. These pipelines provided opportunities for US Rockies/US Lower Midwest gas to be sold in the US west coast, as well as across the US Midwest, and all the way to the US East Coast markets. All of which have been traditional markets for Canadian natural gas. 69 US pipeline exports to Mexico have also increased rapidly from about 700 MMcf/d in 2002 to about 1,700 MMcf/d by Total US exports (pipeline + LNG) have more than tripled from about 1,400 MMcf/d in 2002 to over 4,400 MMcf/d by 2012 driven by pipeline export volumes to both Canada and Mexico, respectively is latest data available at the time of writing. Main markets: N. Atlantic, Gulf Coast States, and N. Midwest 71 Rockies gas > Midwest market 72 Rockies & Lower Midwest gas> Midwest (REX), east coast (REX), and west coast (Ruby) markets
 (2011) and % Share of Total (top)/us Shale Gas Basins, Production Areas, and Traditional Natural Gas Flows (middle)/wcsb")


42 34 Canadian Energy Research Institute Figure 3.5: US Natural Gas Demand by PADD Region (MMcf/d) (2011) and % Share of Total (top)/us Shale Gas Basins, Production Areas, and Traditional Natural Gas Flows (middle)/wcsb Competing Infrastructure (bottom) 28% 28% 4% 14% 26% Total: 67,162 MMcf/d PADD I PADD III PADD II PADD V PADD IV Sources: Top left image: EIA, 73 Top right chart data from EIA. 74 Figure by CERI; Middle left image: EIA, 75 Middle right image: EIA. 76 Modified by CERI; Bottom image: CERI with Envision MAPsearch data 73 EIA, Petroleum & Other Liquids, Gasoline and Diesel Fuel Update, PADD Map: 74 EIA, Table C11. Energy Consumption by Source, Ranked by State, 2011: 75 EIA, Drilling Productivity Report: 76 EIA, Rankings: Natural Gas Marketed Production, 2011:
43 Natural Gas Liquids (NGLs) in North America: An Update 35 Part I Upstream More recently, increasing shale gas supplies in the US northeast (Marcellus) has led to lower needs for external flows into this area including flows of WCSB gas which travels all the way across Canada, but also the Rockies (through REX) and US Gulf Coast gas. As this situation has developed, the dynamics of gas flows across the Canadian/US border have changed over the 2002 to 2012 timeframe as seen in Figure 3.6. Flows across the BC export points (Huntingdon (Spectra) and Kingsgate (GTN)) 77 have decreased slightly between 2002 and 2012 (by close to 400 MMcf/d or 13 percent). Meanwhile, flows have been relatively steady across SK (Monchy (Northern Border) and Elmore (Alliance)) with flows decreasing at Monchy until 2009 and then recovering while flows across Elmore exhibited an increasing trend until 2008 and have decreased since. MB flows (at Emerson and Sprague (GLTG/Viking)) have increased over time. Ontario is the main area where the import/export flows have changed quite significantly over the past decade with total exports declining from over 2,000 MMcf/d in 2002 to less than 1,000 MMcf/d by 2012, and imports increasing from just over 500 MMcf/d in 2002 to close to 3,000 MMcf/d by ON exports have basically disappeared at the Niagara Falls (TCPL mainline) border crossing (connection between ON and PADD I, exports to NY have fallen by over 60 percent). Meanwhile, imports to ON have increased rapidly around the Sarnia and Windsor areas (connections between PADD II and ON, Vector system). Exports across New Brunswick have decreased as well but this has to do more with decreases in gas production declines at the Sable Offshore Energy Project (SOEP) in Nova Scotia and lower LNG receipts at the Canaport LNG import facility, than increased gas competition in the US NE market. However, more recently, small volumes of US NE gas have been making their way across New Brunswick. Thus, increased physical competition from US shale gas, CBM, and Rockies gas has displaced far sourced Canadian imports from various regional US markets and has led WCSB producers to scale back on their production activity. With the prospect of expanded shale gas production volumes in the US increasing their presence in traditional markets for Canadian gas, WCSB producers face the possibility of a continuously shrinking market in the US and thus will require new markets in the form of new/increased local demand or geographic diversification via liquefied natural gas (LNG) exports to overseas markets. 78 While overall gas production across the WCSB has decreased as a function of changing flows and interbasin gasongas competition across North America, production trends across the main producing provinces (AB & BC) have been rather different. 77 For a description of the local and export gas transmission system in Canada see the Part II NGLs update report 78 For more on Canadian LNG opportunities see: Global_LNG.pdf
 (20022012) 3,000 2,500 2,000 1,500 Niagara Falls, Ontario Sault Ste.")
44 MMcf/d MMcf/d MMcf/d MMcf/d MMcf/d MMcf/d 36 Canadian Energy Research Institute Figure 3.6: Canadian/US Border Natural Gas Flows (MMcf/d) ( ) 3,000 2,500 2,000 1,500 Niagara Falls, Ontario Sault Ste. Marie, Ontario Imports Iroquois, Ontario Imports Ojibway (Windsor), Ontario Imports St. Clair, Ontario Imports Sarnia, Ontario Imports Courtright, Ontario Imports Ontario Imports 1,234 1,482 1,829 1,941 2,679 2,798 1, , ON IMPORTS 3,500 3,000 2,500 2,000 1,500 1, ,891 2,827 2,654 2,678 2,588 2,533 2,591 2,643 2,710 2,445 2,523 Huntington, British Columbia Kingsgate, United States District V South British Columbia Exports 4,000 BC EXPORTS 3,594 3,654 3,647 3,573 3,507 3,540 3,500 3,303 2,990 3,000 2,500 2,000 1,500 1,000 Elmore, Saskatchewan 1,800 3,546 3,609 3,420 1,600 1,400 1,200 1, Monchy, Saskatchewan Saskatchewan Exports SK EXPORTS 200 MB EXPORTS 1,650 1,421 1,361 1,308 1,337 1,269 1,220 1,155 1,172 1, Sprague, Manitoba Emerson, Manitoba Manitoba Exports 3,000 2,500 2,000 1,500 1, ,343 2,254 2,142 2,198 2,259 1,920 1,980 1,766 1,161 St. Clair, Ontario Exports 909 Chippawa, Ontario Exports 774 Iroquois, Ontario Exports Niagara Falls, Ontario Exports Ontario Exports ON EXPORTS NB EXPORTS Brunswick, New Brunswick St. Stephen, New Brunswick New Brunswick Exports GTN (Kingsgate) vs. Ruby (Rockies gas) Northern Border (Monchy) vs. Bison & REX (Rockies gas) Flows on GLGT/ Viking (Emerson) increasing Rockies/ USMW/ Marcellus Gas Pushes Out Canadian gas = flow reversal Decreased SOEP + USNE gas moving in (does not include Canaport) Sources: Background images from AER 79 with data from NEB. 80 Figures by CERI 79 Alberta Energy Regulator (AER), ST982013, Alberta s Energy Reserves 2012 and Supply/Demand Outlook : 80 NEB, Statistics, Natural Gas Imports, Exports and Liquefied Natural Gas Statistics. Available at:
45 MMcf/d Natural Gas Liquids (NGLs) in North America: An Update 37 Part I Upstream This in turn indicates that not only interbasin gasongas competition is putting pressure on WCSB gas producers but also that within the basin there is increased competition to serve an expanding domestic Canadian market and a shrinking US export market. Figure 3.7 displays the supply and disposition of natural gas in BC in order to give a better perspective of how local production has increased over the 2002 to 2012 timeframe but also to illustrate the amount of BC gas that goes to export markets versus the local market. Figure 3.7: British Columbia Marketable Natural Gas Supply and Disposition (MMcf/d) ( ) and 2012 % Share of Total 4,000 3,500 3,000 2,500 2,000 2,393 2,474 2,621 2,907 2,892 3,092 3,135 3,077 3,169 3,619 3,539 BC Domestic Demand Alliance Exports Spectra Exports (Sumas) TCPL to AB Imports 97% 46% 15% 17% 1,500 1,000 BC Marketable Gas Production Total Marketable Supply 3% 22% 500 S D S D S D S D S D S D S D S D S D S D S D Total Disposition BC Marketable Gas Production Imports BC Domestic Demand Alliance Exports Spectra Exports (Sumas) TCPL to AB Source: Data from BCMNGD. Figures by CERI Starting with the supply side, gross (or raw) BC gas production has increased from about 3,000 MMcf/d in 2002 to about 4,000 MMcf/d by 2012, or by 33 percent. Imports of gas to BC (from AB, the Northwest Territories (NWT), and the Yukon (YK)), and backhauls through Sumas, combined) have fallen from close to 300 MMcf/d in 2002 to about 100 MMcf/d by 2012, with most remaining imports coming primarily from AB. Field and plant disposition has increased from over 400 MMcf/d to over 600 MMcf/d by In 2012, this disposition was primarily made up of plant disposition (73 percent) with the largest uses being acid gas shrinkage, plant fuel, and NGLs shrinkage, in that order. The remaining 23 percent was disposition at the field level (mainly fuel use). After accounting for raw production increases, lower imports, and increased use at the field and plant level, total marketable gas supply in BC (grey bars) 81 has increased by close to 1,200 MMcf/d from about 2,400 MMcf/d in 2002 to over 3,500 MMcf/d in 2012 or by close to 50 percent. 81 Marketable supply = Marketable production + imports. Marketable production = raw gas production (uses at the plant and field level + shrinkage + net storage (withdrawals (+)/injection ()) Disposition = Local demand + Exports. Local demand = industrial, commercial, and residential demand
46 38 Canadian Energy Research Institute On the disposition side (red bars), domestic demand (15 percent of total disposition in 2012), of which the Fortis BC system (lower portion of BC) accounted for 87 percent in 2012, has declined from close to 700 MMcf/d in 2002 to over 500 MMcf/d in 2012, driven mainly by lower usage in the industrial sector. 82 On the export side, deliveries of BC gas to the Alliance system have increased from less than 200 MMcf/d in 2002 to close to 600 MMcf/d in 2012 and accounted for 17 percent of total BC gas disposition. Exports on the Spectra system at the Sumas/Huntingdon (CanadaUS) border crossing have declined slightly from over 900 MMcf/d in 2002 to less than 800 MMcf/d by 2012, and accounted for 22 percent of BC gas disposition in Last but not least, BC gas deliveries to the TCPL system have increased from less than 700 MMcf/d in 2002 to over 1,600 MMcf/d in 2012 (a 129 percent increase) and accounted for 46 percent of total BC gas disposition in 2012 (29 percent in 2002). The main takeaway from this quick discussion is that while we have previously discussed a significant decline trend in WCSB gas production, not all provinces are affected equally. While gas is a fungible commodity and there should not be a difference between gas produced in BC or AB, BC gas producers appear to have gained a competitive edge over the last decade either through supply cost efficiency gains, 83 more prolific wells, increased monetization of NGLs, or a combination of these and other factors (further discussed below). Overall, increased activity in BC has led to higher uses of gas at the field and plant level. Meanwhile, domestic demand has declined, but more BC gas has found a home in the AB and US export markets. As this situation has developed, producers in BC are increasingly relying on export markets and out of province infrastructure to deliver most of their gas. In fact, in 2012, 85 percent of BC s available marketable gas (or 3,000 MMcf/d) was exported to out of province markets, 74 percent of that through AB. Thus, until another viable transportation outlet is developed (such as LNG exports) BC producers benefits from having access to integrated natural transportation networks, most of which originate or pass through AB. The top portion of Figure 3.8 illustrates flows out of the WCSB via the different pipeline systems. 82 One factor affecting this is the closure of the Methanex facility in Kitimat in the mid 2000 s 83 See CERI Study No. 136: Conventional Natural Gas Supply Costs in Western Canada: conventional_natural_gas_supply_cost final_june_2013.pdf
47 MMcf/d MMcf/d Natural Gas Liquids (NGLs) in North America: An Update 39 Part I Upstream Figure 3.8: WCSB Marketable Production and Outflows, by Pipeline (Top), and Alliance Pipeline Receipts by Area (Bottom) (MMcf/d) ( ) 18,000 16,000 14,000 12,000 10,000 8,000 6,000 4,000 2,000 16,793 16,872 16,408 16,348 16,372 15,792 15,836 15,341 14,346 14,567 13,991 13,410 12,443 11,754 11,927 12,004 12,328 12,307 11,405 10,420 10,128 9,651 Spectra/ Northwest > US PADD V TCPL Mainline* > US PADDs I & II (Through ON & QC) TCPL Mainline (South): GLGT/ Viking > US PADD II Alliance > US PADD II GTN > US PADDs IV & V TCPL Mainline*> CAD (East of AB) Northern Border > US PADDs II & IV Total WCSB Outflows WCSB Marketable Gas *CERI Estimates 1,800 1,600 1,551 1,651 1,655 1,674 1,674 1,669 1,693 1,664 1,684 1,635 1,607 1,400 1,200 1, Bantry (North Dakota) Saskatchewan British Columbia Alberta Total Canada Alliance Firm Service Capacity Sources: Data from AER, Alliance Pipeline, 84 BCMNG, NEB, and Statistics Canada. Figures by CERI As can be observed and as discussed earlier, most flows have remained relatively steady to slightly declining except for those on the TCPL mainline, which have continually declined to both Canadian markets east of AB (primarily ON and QC), but more importantly to the US East Coast market (PADD I). CERI estimates that between 2002 and 2012, flows on the TCPL mainline (both to the US and Canadian markets) 85 have declined from close to 7,000 MMcf/d to close to 4,000 MMcf/d (by close to 2,900 MMcf/d), or by 42 percent. 84 Alliance Pipeline, Canadian Informational Postings: 85 Including flows down the GLGT/Viking system but primarily due to the decreasing flows in the northern section of the system
48 MMcf/d 40 Canadian Energy Research Institute While overall total flows out of the WCSB have dropped by 24 percent between 2002 and 2012, this suggest that other pipeline systems have supported (or increased) flows out of the WCSB in order to compensate for those decreasing TCPL mainline volumes. In fact, flows on the GLGT/Viking and Alliance systems have increased over the same timeframe, thus reflecting changing flows in the North American market due to marketing options, interbasin competition, as well as pipeline tolls, and other issues that will be further discussed ahead. The bottom portion of Figure 3.8 displays the flows out of the WCSB (and the Williston basin in ND) on the liquidsrich Alliance system as an example. As can be observed, flows on Alliance have remained relatively steady from 2002 to 2012, although where the gas is being sourced from (receipt points) has changed over time with less gas being sourced from AB and more from BC. Once again, this reflects on the dynamics and changing production patterns that have taken place over the last few years in the WCSB. Figure 3.9 illustrates the supply and disposition of AB natural gas. Figure 3.9: Alberta Marketable Natural Gas Supply and Disposition (MMcf/d) ( ) and 2012 % Share of Total 16,000 14,000 12,000 10,000 8,000 6,000 4,000 2,000 13,405 12,642 12,499 12,740 13,191 13,133 12,656 11,739 10,736 10,563 10,100 S D S D S D S D S D S D S D S D S D S D S D Quebec Exports PADD I Exports PADD IV Exports Manitoba Exports BC Exports Saskatchewan Exports PADD V Exports Ontario Exports PADD II Exports AB Domestic Demand BC Imports AB Marketable Gas Production Total Marketable Supply Total Disposition 84% 16% BC Imports AB Marketable Gas Supply 11% 3% 2% 8% 14% 24% 33% AB Domestic Demand PADD II Exports Ontario Exports PADD V Exports Saskatchewan Exports BC Exports Manitoba Exports PADD IV Exports PADD I Exports Quebec Exports Source: Data from AER. Figures by CERI Starting with the supply side, gross AB production has declined from close to 17,000 MMcf/d in 2002 to just over 12,000 MMcf/d in 2012, or by over 26 percent. Meanwhile, exports from BC to AB have increased rapidly, while disposition at the field and plant level have remained relatively steady at around 4,000 MMcf/d between 2002 and All in all, this translates to marketable gas supply (grey bars) in AB declining by over 3,000 MMcf/d between 2002 (13,405 MMcf/d) and 2012 (10,100 MMcf/d) or by about 25 percent. On the disposition side, the changes are more complex as there are more items on the ledger, yet these changes better help explain Alberta s reduced supply position. Disposition can be then grouped into three main groups including domestic (AB) demand, exports to other provinces, and exports to the US.
49 Natural Gas Liquids (NGLs) in North America: An Update 41 Part I Upstream On the domestic front, gas demand in AB has increased from about 2,100 MMcf/d in 2002 to close to 3,400 MMcf/d in 2012, or by 70 percent. This increase is driven by the industrial sector (which accounted for 80 percent of local demand in 2012) given strong activity in the oil sands sector but also increased gas use for power generation. Residential (12 percent of AB s local demand in 2012) and commercial demand (8 percent) have remained relatively flat with low increases over the 2002 to 2012 timeframe. Local demand accounted for 15 percent of total disposition in 2002 but 33 percent by Alberta exports to other provinces have declined from about 3,800 MMcf/d in 2002 to 2,900 MMcf/d by 2012, or by 24 percent. This trend is mainly driven by a large decrease in exports to ON from 2,400 MMcf/d in 2002 to 1,500 MMcf/d by While exports to SK, MB, and BC have increased over the same timeframe, the volumes lost to ON are too large to be substituted by users in other provinces. As previously discussed, ON is the main region in Canada where a dramatic shift in gas flow direction is occurring as WCSB flows continue to decline and US volumes continue to increasingly penetrate the market. AB gas exports to other provinces accounted for 28 percent of total AB disposition in 2002, 29 percent by Alberta exports to the US have dropped dramatically from about 7,500 MMcf/d in 2002 to about 3,900 MMcf/d by 2012, or by close to 50 percent. Exports to all (connected) PADDs (I, II, IV, and V) have exhibited a continuous decline trend but the most dramatic changes have occurred in regards to exports to PADD II (US Midwest) and PADD I (East Coast). Exports to PADD II have dropped from 3,300 MMcf/d in 2002 to about 2,500 MMcf/d by However, since overall Canadian exports to PADD II through Northern Border (Monchy), Alliance (Elmore), and GLGT/Viking (Emerson) combined, have increased, this indicates that BC gas is not only displacing AB gas in the local market but also in the export market. Meanwhile, AB exports to PADD I have gone from 1,600 MMcf/d in 2002 to less than 200 MMcf/d by 2012 while exports to PADDs V (West Coast) and IV (Rockies) continue on a downward fall. While AB exports to PADDs IV and V have declined faster than total Canadian exports to those regions, it is clear that BC gas is displacing AB gas in export markets. AB exports to the US accounted for 56 percent of total AB disposition in 2002 and 38 percent in In sum, reduced demand for WCSB gas in Central Canada, as well as the US East Coast, Rockies, and West Coast regions has translated into much lower production levels in AB over the 2002 to 2012 time period. This is not necessarily the case for BC gas. Local demand in AB driven by industrial activity has provided upside support for producers, yet the magnitude of volumes lost to export markets are such that they are not easy to replace.
50 42 Canadian Energy Research Institute Above and beyond increased emerging shale gas supplies, as well as inter and intrabasin gasongas competition in North America, WCSB producers have also faced challenges in regards to the economics of gas production. Still, supply cost efficiencies have allowed WCSB producers to remain competitive in the North American market while NGLs have provided an incremental source of revenue. These issues are discussed next. Economics: Gas Prices, Exchange Rates, Transportation Tolls, Supply Costs Efficiencies and NGL Uplift While without a doubt the physical flow changes across the North American gas market are the main indicator of the challenges currently faced by WCSB producers, other (mainly economic) factors serve to further explain production trends over the past decade and serve to get a sense of what is to be expected in the coming years. The first issue is that of natural gas prices, exchange rates, and natural gas transportation tolls. Figure 3.10 displays some trends worth discussing in regards to these economic indicators. In regards to natural gas prices, two price benchmarks are shown in Figure 3.10 (top) including the Henry Hub (HH) market price (blue line) which is the price for the largest trading hub (and most liquid) contract in the United States (traded in the New York Mercantile Exchange (NYMEX)), as well as the price for AECO, 86 traded in AB, and reflective of prices in the WCSB (red line). Both prices are given in Canadian dollars to put them in the Canadian context. All things being equal, the difference between the two prices (basis differential = green bars) at the two different locations (USGC and Western Canada) should be a function of both exchange rates and transportation costs. As seen in Figure 3.10 (red dotted line on top chart) the exchange rate for a US dollar (USD) versus a Canadian dollar (CAD) has dropped considerably since early 2002 from to a steady state of parity (1CAD = 1USD) over the last few years ( ). As the $CAD has appreciated, the difference between HH and AECO has decreased, thus making WCSB gas less competitive in distant markets (more costly, in relative terms). Meanwhile, as eastbound export flows out of WCSB have dropped, the tolls on the main export pipeline (TCPL mainline) have increased rapidly, thus making it more expensive to transport WCSB gas to far distant markets in the eastern and Midwest US as well as eastern Canada as seen on Figure 3.10 (bottom), further making WCSB gas less competitive on export markets. 86 AECO stands for Alberta Energy Company. Other names for AECO include AECOC (contract) and Nova Inventory Transfer (NIT) CAD = 1USD
51 $/GJ MMcf/d January May September January May September January May September January May September January May September January May September January May September January May September January May September January May September January May September January $/GJ CAD/USD Natural Gas Liquids (NGLs) in North America: An Update 43 Part I Upstream Figure 3.10: HH & AECO Natural Gas Prices ($CAD/GJ), Basis Differential, and CAD/US Exchange Rate (Top)/TCPL Mainline Sample Tolls ($/GJ) and Estimated Flows (MMcf/d) ( ) (Bottom) $18.00 $17.00 $16.00 $15.00 $14.00 $13.00 $12.00 $11.00 $10.00 $9.00 $8.00 $7.00 $6.00 $5.00 $4.00 $3.00 $2.00 $1.00 $ Basis Differential AECO ($/GJ) Henry Hub ($/GJ) United States dollar, noon spot rate, average (CAD/USD) Severe winter weather Hurricanes Katrina & Rita High Commodity Prices Global Recession Rapid increases in US shale gas production $3.00 $2.50 $2.00 8,000 7,000 6,000 5,000 $1.50 4,000 $1.00 $0.50 $ 100% LF Empress > Niagara Falls (Via Mainline) 100% LF Empress > St. Clair (Via GLGT) IT Bid Floor Empress > Niagara Falls (Via Mainline) IT Bid Floor Empress > St. Clair (Via GLGT) Estimated TCPL Mainline Flows 3,000 2,000 1,000 Source: Data from ADOE, 88 Bank of Canada, 89 EIA, 90 and TCPL. 91 Figures by CERI As an example, at some point in time over the last couple of years the cost of moving gas from the WCSB to eastern markets has been at or above the price of the commodity itself Alberta Department of Energy (DOE), Our Business, Natural Gas, About Natural Gas, Prices, Alberta Gas Reference Price History. Available at: 89 Bank of Canada, Rates & Statistics, Exchange Rates, Monthly average exchange rates: 10year lookup. Available at: 90 EIA, Natural Gas, Prices, Natural Spot and Future Prices (NYMEX). Available at: 91 TransCanada Pipelines, Customer Express Home, Pipelines, Canadian Mainline, Tolls Archive. Available at: 92 In May 2013, the National Energy Board (NEB) set the mainline s firm transportation toll from Empress to Dawn at $1.42/GJ
52 44 Canadian Energy Research Institute Thus, the difference between the tolls further helps to explain the decreased WCSB export volumes to the US through Niagara Falls (ON PADD I), and the increased US imports through SarniaSt. Clair, 93 as well as the steady flows across the southern section of the TCPL mainline (GLGT/ Viking) versus the northern portion of the system (to ON, QC, and PADD I). Meanwhile, gas prices in North America have been notably volatile over the past decade due to extreme weather events, global economic conditions that affected North American markets, as well as the shift in fundamentals brought on by shale gas abundance (as previously discussed). With all these changes in the market, Canadian producers have felt the pressure to take measures to remain competitive. Since WCSB producers are price takers and marginal suppliers 94 in the North American market, it is beyond their means to affect market prices and thus the onus falls on their cost structure and their ability to increase profitability in order to remain competitive in a shrinking market. In this context, profitability can be improved upon either by reducing overall supply costs or by increasing the revenue stream. In regards to supply cost efficiencies, a recently completed study by CERI for Productivity Alberta in collaboration with the Canadian Society for Unconventional Resources (CSUR; formerly the Canadian Society for Unconventional Gas) and the Petroleum Services Association of Canada (PSAC) 95 highlighted some of the measures WCSB producers are taking in order to reduce their supply cost 96 and remain competitive in the North American landscape. As seen on Figure 3.11, there are some avenues through which WCSB producers can reduce their supply costs. Starting from the top, CERI estimates that drilling multiple wells from a single pad, thus reducing rig downtime and transportation time together with its associated costs, can significantly reduce producers per unit supply costs by up to 30 percent. As seen on the middle illustrations and chart (Figure 3.11), another avenue to reduce supply costs is increasing the number of fracture (frac) stages in a well, thus allowing for incremental production from the wells (up to an optimal number somewhere between 12 and 24 frac stages), yet at some point diminishing returns are reached and costs can increase Most of the gas moving to ON from the US is coming via interconnections on the Vector and ANR pipelines 94 In 2012, US + CAD marketable gas demand was about 75,000 MMcf/d of which about 19% (<14,000 MMcf/d) was produced in Canada 95 CSUG/CERI/PSAC: Technical Study for Productivity Alberta, Improved Productivity in the Development of Unconventional Gas: 96 CERI supply costs = gas price required to cover capital and operating costs, royalties and taxes, and nine percent rate of return on investment. The costs are reflective of dry gas wells drilled in NW AB or PSAC AB2A wells 97 It is important to note that this particular research was carried with a focus on unconventional gas developments in the WCSB such as shale and tight gas and assumes the use of horizontal wells using hydraulic fracturing completions
 (top),")
 (bottom) Sources: Top left")


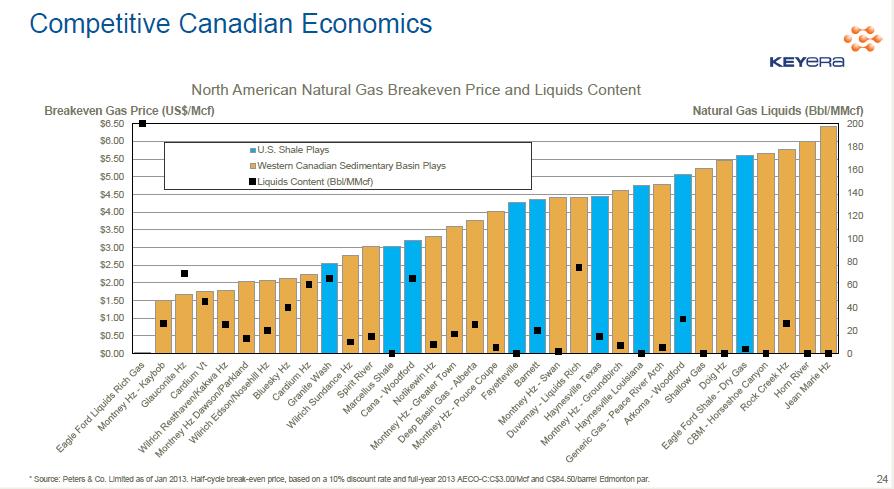
53 Natural Gas Liquids (NGLs) in North America: An Update 45 Part I Upstream Figure 3.11: Multiwell Pad Drilling Illustrations and Supply Cost Efficiencies ($/mcf) (top), Multifrac Stages Illustration and Supply Cost Efficiencies ($/mcf) (middle), and WCSB and North American Halfcycle Gas Economics ($/mcf) (bottom) Sources: Top left chart: NEB; 98 Top center chart: Nexen; 99 Top right chart: CERI; Middle left chart: CERI; Middle right chart: NEB/Bottom chart: Keyera NEB, Energy Reports, Natural Gas, A Primer for Understanding Canadian Shale Gas Energy Briefing Note: 99 Nexen, Shale Gas, How we develop shale gas in Canada: Keyera, Corporate Profile, September 2013, Slide 24: 13%20corporate%20profile_%20sept%2020.pdf
54 46 Canadian Energy Research Institute The bottom chart of Figure 3.11 shows an analysis prepared by investment firm Peters & Co. Ltd. where halfcycle 101 breakeven prices are shown for various basins, shale plays, and formations in both the WCSB and across the US, with Canadian plays highlighted in yellow and US ones in blue. The main point here is to show that on a breakeven price or supply cost basis, several plays and regions across the WCSB are quite competitive at various price levels compared to the largest producing shale plays in the US such as the Marcellus, Fayetteville, Barnett, Haynesville, and the Eagle Ford. Another piece of information provided in that analysis (Figure 3.11, bottom) is the natural gas liquids content or yield 102 of each play (right axis), which as CERI highlighted in Study 130 and 136 (Update), 103 translates into an additional revenue stream to gas producers and allows for a reduction of the overall supply costs on a dry (or marketable) gas basis. Generally, the higher the liquids content in the gas produced, the better the opportunity to monetize these liquids and thus the better the economics of liquidsrich gas development. 104 The top portion of Figure 3.12 (below) illustrates that the price spread between natural gas and crude oil has widened considerably over the last few years. As this spread has widened, there is an increased incentive to extract the NGLs in the raw gas as their prices are generally determined by the spread between natural gas and oil prices. Therefore, a wider price spread leads to better NGL extraction economics. Meanwhile, the alternative value (or opportunity costs) of leaving the NGLs in the gas stream is only the equivalent of their heating value in the natural gas market or the value paid for a gigajoule (GJ) of natural gas, as natural gas is sold on a heating value basis rather than a volumetric basis. Monetizing those liquids makes sense as long as the price of the individual NGL components is higher than that of natural gas plus the costs of extracting and marketing each respective NGL. 105 As gas drilling activity in the WCSB has slowed down significantly due to the trends discussed above, gas well completions have declined from a peak of close to 16,000 wells in 2005 (15,895) to just over 1,000 wells in 2012 (1,109), 106 a 93 percent decline 107 in eight years, yet where those wells are being drilled, matters. The middle portion of Figure 3.12 illustrates this trend. 101 Halfcycle economics generally refer to allin supply costs excluding sunk capital such as land acquisition costs 102 Generally measured in Canada as barrels of NGLs per million cubic foot of gas (bbl/mmcf) or gallons per thousand cubic feet (GPM) in the US 103 CERI Study No. 136 Update, December 2013: Update_ Conventional_Natural_Gas_Supply_Costs.pdf 104 Of course other factors also play a role in the supply costs economics including the costs of drilling at different locations, initial production (IP) rates and estimated ultimate recoveries (EUR), as well as fiscal terms (royalties and taxes) in a given jurisdiction, processing costs, and transportation costs of commodities to enduse markets 105 However, since supply costs vary across regions in the basin, as natural gas prices rise, areas which were previously uneconomic at low prices (generally dry gas areas) become economic. Therefore, in determining NGLs production, not only the crude to gas spread matters but so does the overall gas price level (in economic terms) 106 CAPP Statistical Handbook
 in North America: An Update 47 Part I Upstream Figure 3.")
 AECOC ($/GJ) Price Ceiling ETHANE ($/GJ) (CERI EST.")
 Price Floor 2013 NG Wells Completed in 2008 2010 2011 2013 (JanOct) 80 70 60 50 40 74 56 63 18,000 16,000 14,000 12,000 10,000 8,000 16,228 15,902 15,922 15,868 15,696 15,668 15,057 14,138 13,248")

55 bbl/ MMcf MMcf/d Jan Apr Jul Oct Jan Apr Jul Oct Jan Apr Jul Oct Jan Apr Jul Oct Jan Apr Jul Oct Jan Apr Jul Oct Jan Apr Jul Oct Jan Apr Jul Oct Jan Apr Jul Oct Jan Apr Jul Oct Jan Apr Jul Oct Jan Apr Jul Oct $/GJ Natural Gas Liquids (NGLs) in North America: An Update 47 Part I Upstream Figure 3.12: Energy Prices ($/GJ) Q1 (top), Evolving Gas Drilling Patterns in the WCSB (middle), and Liquids Yields (bbl/mmcf) and Gas Production in AB by Area (MMcf/d), (bottom) $30.00 $25.00 $20.00 $15.00 CRUDE OIL NATURAL GAS SPREAD ($/GJ) AECOC ($/GJ) Price Ceiling ETHANE ($/GJ) (CERI EST.) PROPANE ($/GJ) BUTANES ($/GJ) PENTANES ($/GJ) CERI WCSB COMPOSITE NGL ($/GJ) CANADIAN FURNACE OIL (WHOLESALE RACK PRICE) ($/GJ) $10.00 $5.00 $ $(5.00) Price Floor 2013 NG Wells Completed in (JanOct) ,000 16,000 14,000 12,000 10,000 8,000 16,228 15,902 15,922 15,868 15,696 15,668 15,057 14,138 13,248 12,962 12, Foothills Plains Northern AB Median 6,000 4,000 2,000 Northern Plains Foothills Total AB Sources: Top chart: data from ADOE, 108 EIA, 109 and the Kent Group. 110 Figure by CERI/Middle and Bottom charts by CERI with data from AER 107 The fact that the number of wells has fallen a lot faster than overall production volumes have declined indicates that each new well drilled today has a much higher productivity than they did in the past. That is, a much lower number of wells is required to produce a given level of production today than in the past 108 Monthly Reference Price:
56 48 Canadian Energy Research Institute For simplicity sake, CERI divided AB into three different areas (Foothills/West, Plains/South, and Northern) as shown in the bottom section of Figure In terms of remaining marketable gas reserves (RMG), of the 33,886 billion cubic feet (bcf) (or 33.9 tcf) available in AB as of yearend (YE) 2012, as reported by the AER, percent are located in the Foothills area, followed by 18 percent in the Plains area, and 10 percent in the Northern region. In regards to NGL reserves, of the 2,001 million barrels (MMb) of NGLs, 89 percent are located in the Foothills area, followed by 7 percent in the Northern area, and 4 percent in the Plains area. Thus, the Foothills area contains both the largest reserves of gas but also NGLs. Furthermore, there are more NGLs per molecule of gas in this area as well, as seen in the center chart of the bottom section of Figure As WCSB producers have focused their efforts in this area of the province (and the WCSB) led by attractive NGL prices and extraction economics, production from this area of the province has remained relatively steady through the 2002 to 2012 timeframe (~10,000 MMcf/d). Meanwhile, its share of the province s production has increased from about 65 percent of the total in 2002 to close to 80 percent by As this trend continues, there are more NGLs available for every molecule of natural gas extracted in the WCSB, that is, the gas is getting richer (wetter) in NGLs. Meanwhile, a larger percentage of the produced gas is being processed. Thus, these trends help explain why the decline in NGL production bottomed out around 2010 and has since been on the upswing, all while natural gas production in the WCSB continues on a decline trend (Figure 3.13). 112 It could also be noted that the trend across the WCSB is similar to that seen across the US where producers are moving from developing conventional resources to tight gas and shale gas resources, such as those being targeted in AB and BC. Looking back at Figure 3.12, in 2008, wells (dots on the chart) were being drilled all over the province and the majority of the wells were vertical conventional wells (red dots). As we moved into 2013, fewer wells are being drilled in the WCSB. But these wells are different. The light red/grey dots represent horizontal gas wells while the yellow dots represent slanted or deviated wells. 109 Petroleum and Other Liquids, Prices: Petroleum Price data: AER reserve and composition file 112 Between 2002 and 2012, WCSB raw gas production declined by close to 4,000 MMcf/d or by 19% while NGLs production from gas plants declined by about 70 kb/d or 10% Also note that not all produced gas is processed, and thus, on a bbl of gas plant NGLs/MMcf of processed gas basis the liquids content of the gas would be higher than that one illustrated in the right portion of Figure 22
57 bbl/ MMcf AB Gas Processed/ Gas Produced (%) Natural Gas Liquids (NGLs) in North America: An Update 49 Part I Upstream Figure 3.13: WCSB Raw Gas and NGL Production Indices (2002 = 1) (top), and Gas Processing Metrics (bottom) ( ) WCSB Gas Plant NGLs (2002 = 1) WCSB Gas Production (2002 =1) % 84% 82% 80% WCSB bbl of GP NGLs/ MMcf Gas Produced (LHS) bbl of C2/ MMcf Gas Processed at Empress + Cochrane (LHS) Gas Processed/ Gas Produced (AB) (RHS) 78% 76% 74% Source: Data from AER, BCMNG, and Statistics Canada. Figures by CERI Thus the number of wells has decreased significantly, but the majority of the new wells being drilled are resourceplay type wells drilled horizontally, with longer laterals, targeting deeper formations, with higher initial productivity (IP) rates, 113 but also clustered around a particular area of the WCSB, the liquidsrich area. 113 Usually followed by steep declines to low and sustained levels
58 50 Canadian Energy Research Institute These wells also tend to cost significantly more than traditional conventional wells given their increased length, depth, but also reservoir stimulation requirements. However, as discussed in a recently completed report by CERI, foreign investment in the NE BC region 114 (as well as the NW AB/Foothills region) 115 has helped accelerate resource development. This type of arrangement/ funding model allows local producers to share the risk of development while minimizing the initial cash outlays required for capital intensive playtype gas developments such as shale and tight gas. Going forward, understanding where the gas flows will be heading to (based on CERI s natural gas pathways scenarios and pipeline flow models) as well as where those volumes will be produced, the composition of those volumes, and NGL extraction economics (based on energy prices) will help to determine the outlook for NGLs. How possible LNG exports will affect the gas flows and composition of the gas will also need to be considered. This concludes the discussion of emerging trends and issues around natural gas and NGL production (upstream). Part II will discuss the infrastructure used to connect supply and demand of NGLs in North America. 114 Discussion Paper: Recent Foreign Investment in the Canadian Oil & Gas Industry: 24_Foreign_Investment_in_Cdn_Oil_and_Gas_Industry.pdf 115 Regions from which most of the recent increased and sustained gas production in the WCSB is originating

59 Natural Gas Liquids (NGLs) in North America: An Update 51 Part I Upstream Appendix I Western Canada Shale Basins Source: EIA US Energy Information Administration (EIA), 2013, Technically Recoverable Shale Oil and Shale Gas Resources: As Assessment of 137 Shale Formations in 41 Countries Outside the United States:
 and Shale Basins Source: CERI from PennWell")
60 52 Canadian Energy Research Institute Appendix II US Petroleum Administration Defense Districts (PADDs) and Shale Basins Source: CERI from PennWell MAPSearch

61 Natural Gas Liquids (NGLs) in North America: An Update 53 Part I Upstream Appendix III North American Natural Gas Marketing Infrastructure Source: CERI from PennWell MAPSearch
CONVENTIONAL NATURAL GAS SUPPLY COSTS IN WESTERN CANADA AN UPDATE
 Updated to Include Natural Gas Liquids (NGLs) Study No. 136 Update CANADIAN ENERGY RESEARCH INSTITUTE CONVENTIONAL NATURAL GAS SUPPLY COSTS IN WESTERN CANADA AN UPDATE Canadian Energy Research Institute
North American Midstream Infrastructure Through 2035 A Secure Energy Future. Press Briefing June 28, 2011
 North American Midstream Infrastructure Through 2035 A Secure Energy Future Press Briefing June 28, 2011 Disclaimer This presentation presents views of ICF International and the INGAA Foundation. The presentation
ST98: 2018 ALBERTA S ENERGY RESERVES & SUPPLY/DEMAND OUTLOOK. Executive Summary.
 ST98: 2018 ALBERTA S ENERGY RESERVES & SUPPLY/DEMAND OUTLOOK Executive Summary ST98 www.aer.ca EXECUTIVE SUMMARY The Alberta Energy Regulator (AER) ensures the safe, efficient, orderly, and environmentally
ST98: 2018 ALBERTA S ENERGY RESERVES & SUPPLY/DEMAND OUTLOOK. Executive Summary.
 ST98: 2018 ALBERTA S ENERGY RESERVES & SUPPLY/DEMAND OUTLOOK Executive Summary ST98 www.aer.ca EXECUTIVE SUMMARY The Alberta Energy Regulator (AER) ensures the safe, efficient, orderly, and environmentally
Canada s Energy Future: Energy Supply and Demand Projections to Emerging Fuels and Energy Efficiency Highlights
 Canada s Energy Future: Energy Supply and Demand Projections to 2035 - Emerging Fuels and Energy Efficiency Highlights Canada s Energy Future: Energy Supply and Demand Projections to 2035 Emerging Fuels
Examining the Expansion Potential of the Petrochemical Industry in Canada
 Canadian Energy Research Institute Examining the Expansion Potential of the Petrochemical Industry in Canada Allan Fogwill President and CEO Canadian Energy Research Institute January 2016 1 Canadian Energy
Alberta s Energy Markets: Opportunities and Challenges. Paul Tsounis Alberta Department of Energy Economics and Markets Branch June 2012
 1 Alberta s Energy Markets: Opportunities and Challenges Paul Tsounis Alberta Department of Energy Economics and Markets Branch June 2012 Key Issues of the Day Uncertainties in Europe Greek elections GDP
WESTERN CANADA NATURAL GAS FORECASTS AND IMPACTS ( )
") Study No. 149 July 215 CANADIAN ENERGY RESEARCH INSTITUTE WESTERN CANADA NATURAL GAS FORECASTS AND IMPACTS (215-235) Canadian Energy Research Institute Relevant Independent Objective WESTERN CANADA NATURAL
Study No. 149 July 215 CANADIAN ENERGY RESEARCH INSTITUTE WESTERN CANADA NATURAL GAS FORECASTS AND IMPACTS (215-235) Canadian Energy Research Institute Relevant Independent Objective WESTERN CANADA NATURAL
Williams Offgas Business in the Oil Sands
 Williams Offgas Business in the Oil Sands Presentation to CSGWest, Energy and Public Lands Committee July 22, 2012 By Lorraine Royer, Manager, Government Affairs Williams Energy Canada Williams > Energy
WESTERN CANADA CRUDE OIL FORECASTS AND IMPACTS ( )
") Crude Oil Production (excl Oil Sands) ay Study No. 15 July 215 CANADIAN ENERGY RESEARCH INSTITUTE WESTERN CANADA CRUDE OIL FORECASTS AND IMPACTS (215-235) 1,6, 1,5, 1,4, 1,3, 1,2, 1,1, 1,, 9, 8, 7, 6,
Crude Oil Production (excl Oil Sands) ay Study No. 15 July 215 CANADIAN ENERGY RESEARCH INSTITUTE WESTERN CANADA CRUDE OIL FORECASTS AND IMPACTS (215-235) 1,6, 1,5, 1,4, 1,3, 1,2, 1,1, 1,, 9, 8, 7, 6,
Strathcona County. Living.Refined.
 Strathcona County Living.Refined. Agenda What is Strathcona County? Strathcona County By The Numbers Alberta s Industrial Heartland Association Adding Value to Alberta Future Outlook Opportunities & Challenges
Natural Gas Use in Alberta s Oil Sands Industry. Outline
 Natural Gas Use in Alberta s Oil Sands Industry CERI North American Natural Gas Conference March 1, 2004 1 Outline Oil Sands Industry Overview Bitumen and Synthetic Crude Oil Supply Projections Oil Sands
NORTH AMERICAN NATURAL GASOLINE
 NORTH AMERICAN & NATURAL GASOLINE Condensate Outlook KEY TAKEAWAYS NORTH AMERICAN NATURAL GASOLINE & Condensate Outlook Overview Only Contact BENTEK to subscribe. For more information about BENTEK's industry-leading
Canadian Oil and Gas Industry: What lies ahead
 Canadian Oil and Gas Industry: What lies ahead Presented by Dinara Millington Vice President, Research Canadian Energy Research Institute June 10, 2015 1 Canadian Energy Research Institute Overview Founded
Natural Gas Abundance: The Development of Shale Resource in North America
 Natural Gas Abundance: The Development of Shale Resource in North America EBA Brown Bag Luncheon Bracewell & Giuliani Washington, D.C. February 6, 2013 Bruce B. Henning Vice President, Energy Regulatory
North America Midstream Infrastructure through 2035: Capitalizing on Our Energy Abundance
 North America Midstream Infrastructure through 2035: Capitalizing on Our Energy Abundance Prepared by ICF International for The INGAA Foundation, Inc. Support provided by America s Natural Gas Alliance
UNDERSTANDING NATURAL GAS MARKETS. Mohammad Naserifard MSc student of Oil & Gas Economics at PUT Fall 2015
 UNDERSTANDING NATURAL GAS MARKETS Mohammad Naserifard MSc student of Oil & Gas Economics at PUT Fall 2015 Table of Contents 3 Overview Natural Gas is an Important Source of Energy for the United States.
CANADIAN CRUDE OIL AND NATURAL GAS PRODUCTION, SUPPLY COSTS, ECONOMIC IMPACTS
 Study No. 173 CANADIAN ENERGY RESEARCH INSTITUTE CANADIAN CRUDE OIL AND NATURAL GAS PRODUCTION, SUPPLY COSTS, ECONOMIC IMPACTS AND EMISSIONS OUTLOOK (2018-2038) Canadian Energy Research Institute Relevant
The New Superpower : Emerging Supplies of Gas Liquids from the United States
 The New Superpower : Emerging Supplies of Gas Liquids from the United States Lucian Pugliaresi President Energy Policy Research Foundation, Inc. Washington, DC Energy Policy Research Foundation, Inc. 1031
CERI Commodity Report Natural Gas
 July-August 1 CERI Commodity Report Natural Gas Ethane Availability for Proposed Western Canadian LNG Facilities Dinara Millington In the Canadian context, the main sources of petrochemical feedstock include
2015 Trilateral Energy Outlook Project
 1 Trilateral Energy Outlook Project Introduction Context & Motivation The energy markets of,, and the United States are becoming increasingly interdependent as physical infrastructure continues to be built
Gas and Crude Oil Production Outlook
 Gas and Crude Oil Production Outlook COQA/CCQTA Joint meeting October 3-31, 214 San Francisco, California By John Powell Office of Petroleum, Natural Gas, and Biofuels Analysis U.S. Energy Information
U.S. Ethane Crackers and Ethylene Derivative Capacity Additions
 U.S. Ethane Crackers and Ethylene Derivative Capacity Additions Part 2 The Economics Behind Monetizing Cost-Advantaged U.S. Ethane Reserves by CLAY JONES, TERREL LAROCHE, and CHERYL GINYARD-JONES www.honfleurllc.com
U.S. Shale Gas in Context
 U.S. Shale Gas in Context Overview of U.S. Natural Gas production and trends For National Conference of State Legislatures Natural Gas Policy Institute September 9, 215 Pittsburgh, Pennsylvania By Grant
Alberta s Oil Sands Resources, Production Growth,Products and Markets
 Alberta s Oil Sands Resources, Production Growth,Products and Markets Duke du Plessis. Senior Advisor Alberta Economic Development and Alberta Energy Research Institute Calgary, Alberta, Canada October
Winter U.S. Natural Gas Production and Supply Outlook
 Winter 2012-13 U.S. Natural Gas Production and Supply Outlook Prepared for Natural Gas Supply Association by: ICF International Fairfax, Virginia September, 2012 Introduction This report presents ICF s
June 30, Environment and Climate Change Canada 12th Floor, 351 Saint-Joseph Boulevard Gatineau, Quebec K1A 0H3,
 Alberta Climate Change Office 11 th Floor, South Petroleum Plaza 9915 108 Street Edmonton, Alberta T5K 2G8 Canada www.alberta.ca Environment and Climate Change Canada 12th Floor, 351 Saint-Joseph Boulevard
CERI Commodity Report Natural Gas
 bcf/d CERI Commodity Report Natural Gas October Gas-to-Liquids (GTL): An Option for Monetizing WCSB Natural Gas Current Challenges for WSCB Natural Gas Producers Shale gas production in the United States
Natural Gas Issues and Emerging Trends for the Upcoming Winter and Beyond
 Natural Gas Issues and Emerging Trends for the Upcoming Winter and Beyond 2013 NASEO WINTER ENERGY OUTLOOK CONFERENCE November 1, 2013 Kevin Petak Vice President, ICF International Kevin.Petak@icfi.com
The Canadian Oil Sands in the Context of the Global Energy Demand
 Extended Abstract for 17 th Convocation of the International Council of Academies of Engineering and Technological Sciences (CAETS), Tokyo, Japan, October 2007. The Canadian Oil Sands in the Context of
ENERGY OUTLOOK 2017 FALL/WINTER
 ENERGY OUTLOOK 2017 FALL/WINTER With more than 105 years in the energy industry, BOK Financial is committed to helping you succeed. In this issue of the Energy Outlook, you ll learn more about the current
U.S. Crude Oil, Natural Gas, and NG Liquids Proved Reserves
 1 of 5 3/14/2013 11:37 PM U.S. Crude Oil, Natural Gas, and NG Liquids Proved Reserves With Data for Release Date: August 1, 2012 Next Release Date: March 2013 Previous Issues: Year: Summary Proved reserves
Shale Gas - Transforming Natural Gas Flows and Opportunities. Doug Bloom President, Spectra Energy Transmission West October 18, 2011
 Fort Nelson Gas Plant, British Columbia Shale Gas - Transforming Natural Gas Flows and Opportunities Doug Bloom President, Spectra Energy Transmission West October 18, 2011 Natural Gas Golden Age Natural
Canada s Oil Sands - A World-Scale Hydrocarbon Resource
 Canada s Oil Sands - A World-Scale Hydrocarbon Resource Prepared by: R.B. (Bob) Dunbar, P. Eng. bob.dunbar@strategywest.com February 2009 www.strategywest.com PO Box 76037; Calgary, Alberta T2Y 2Z9; Phone
MEMORANDUM. May 6, Subcommittee on Energy and Power Democratic Members and Staff
 FRED UPTON, MICHIGAN CHAIRMAN HENRY A. WAXMAN, CALIFORNIA RANKING MEMBER ONE HUNDRED THIRTEENTH CONGRESS Congress of the United States House of Representatives COMMITTEE ON ENERGY AND COMMERCE 2125 RAYBURN
Husky Increasing Resiliency with Thermal Momentum and Downstream Integration
 Husky Increasing Resiliency with Thermal Momentum and Downstream Integration Calgary, Alberta (Sept. 22, 2015) Husky Energy is prudently advancing its resilient thermal production portfolio as its fully
Detailing The Future Projections Regarding The Supply And Demand For Condensate In Western Canada
 Detailing The Future Projections Regarding The Supply And Demand For Condensate In Western Canada NGL Marketing & LNG Export Congress - Calgary Presented by John Homan Sr. Marketing and Logistics Representative
Canadian Oil, Gas and LNG Market Review
 Canadian Energy Research Institute Canadian Oil, Gas and LNG Market Review Allan Fogwill Strait of Canso Superport Days 16 Dundee, Nova Scotia July 2016 1 1 Mission Statement Founded in 1975, the Canadian
Annual Energy Outlook 2018 with projections to 2050
 Annual Energy Outlook 218 with projections to 25 February 218 U.S. Energy Information Administration Office of Energy Analysis U.S. Department of Energy Washington, DC 2585 This publication is on the Web
Shale Gas Treatment Challenges and Requirements
 Shale Gas Treatment Challenges and Requirements Hanbing Ding 13 th U.S.-China Oil & Gas Industry Forum September 25, 2013 Xi an, China 2013 UOP LLC. All rights reserved. Honeywell s Businesses $37.6 billion
Rocky Mountain High? A Report on the Niobrara Production Rising, Infrastructure Expansions Under Way
 A RBN Energy Drill Down Report Copyright 2019 RBN Energy Rocky Mountain High? Production Rising, Infrastructure Expansions Under Way Crude oil, natural gas and NGL production in the Niobrara have risen
Summary - The Challenge to European Refining Posed by the Rise of US Unconventionals Scottish Oil Club
 Summary - The Challenge to European Refining Posed by the Rise of US Unconventionals Scottish Oil Club November 2014 About us We are a global leader in commercial intelligence for the energy, metals and
The title of this presentation is NGLs versus LPGs, or Gas Plants vs. Refineries. We talk a lot about NGLs from gas plants and what is happening to
 1 The title of this presentation is NGLs versus LPGs, or Gas Plants vs. Refineries. We talk a lot about NGLs from gas plants and what is happening to those volumes, but usually the refinery side is a footnote.
Natural Gas Outlook and Drivers
 Natural Gas Outlook and Drivers November 2012 33% BENTEK Energy 5% 40% Who We Are Based in Evergreen, CO 120 People 400+ Customers Subsidiary of McGraw-Hill/Platts 22% What We Do Collect, Analyze and Distribute
INDUSTRIAL FORT SASKATCHEWAN S. fortsask.ca/business LOCATION CONNECTIONS GROWTH
 INDUSTRIAL FORT SASKATCHEWAN S L E A D I N Gedge LOCATION CONNECTIONS GROWTH fortsask.ca/business Fort Saskatchewan is a major industrial and commercial centre in northern Alberta. We are the largest urban
Major Challenges for Gas: What Can be Expected for Mexico?
 Major Challenges for Gas: What Can be Expected for Mexico? Gas Future Forum, Mexico, April 3, 2014 BEG/CEE UT, 1 Overall Observations Resources Reserves Deliverability Deliverability is key Sweet spot
Upgrading with a soft touch
 Upgrading with a soft touch Canadian Heavy Oil Conference 4 November 2014 Agenda Heavy Oil Industry the market & its challenges Upgrading in Canada Fractal Systems JetShear Technology Commercializing JetShear
Natural-Gas-Liquid Derivatives
 Natural-Gas-Liquid Derivatives The Energy Tsunami s Next Wave By Clint Follette and Yanyu He The tsunami that yielded abundant unconventional-natural-gas supplies has also generated a glut in the byproducts
Kearl Kearl Oil Sands Project Project Description November 2003
 earl Kearl Oil Sands Project Project Description November 2003 PROPOSED DEVELOPMENT Imperial Oil Resources (Imperial) and ExxonMobil Canada Ltd. (ExxonMobil) are advancing public consultation and other
Electricity and Petroleum Industries:
 September 22 F a c t s h e e t 2 Electricity and Petroleum Industries: 199-2 The Electricity and Petroleum Industries Fact Sheet is comprised of two sectors: the Electricity Generation sector and the Petroleum
ENVIRONMENT AND ENERGY BULLETIN
 ENVIRONMENT AND ENERGY BULLETIN Vol. 3 No. 2 June 2011 Editor: Jock A. Finlayson THE NATURAL GAS STORY Both globally and in North America, natural gas is poised to play a bigger role in meeting the energy
Research Projects as of March 27, 2018
 2017-2018 Research Projects as of March 27, 2018 CARBON MANAGEMENT IMPACTS ON ELECTRICITY MARKETS IN CANADA This project is designed to gain insights into challenges and opportunities carbon management
Cass Business School Presentation 29 January London
 Cass Business School Presentation 29 January 2018 - London Connecting high quality analytics with commercial decision making Commercial Advice Consulting Market Insights Multiclient Products Retainer Agreements
The Market for Petrochemical Feedstocks in a Changing Oil Price Environment A North American Perspective
 The Market for Petrochemical Feedstocks in a Changing Oil Price Environment A North American Perspective Michael Sloan Principal ICF International 2 nd Annual European Petrochemicals Conference Dusseldorf
ECONOMIC IMPACTS AND MARKET CHALLENGES FOR THE METHANE TO DERIVATIVES PETROCHEMICAL SUB-SECTOR
 ECONOMIC IMPACTS AND MARKET CHALLENGES FOR THE METHANE TO DERIVATIVES PETROCHEMICAL SUB-SECTOR Overview Canadian Energy Research Institute Founded in 1975, the Canadian Energy Research Institute (CERI)
The Outlook for the Global LPG Market
 The Outlook for the Global LPG Market International LP Gas Seminar 213 Ken Otto February 28, 212 Dai-Ichi Hotel Tokyo, Japan 212, IHS Inc. No portion of this presentation may be reproduced, reused, or
Bitumen Upgrader Residue Conversion to Incremental Synthetic Fuels Products
 Bitumen Upgrader Residue Conversion to Incremental Synthetic Fuels Products Technical Paper Expander Energy Inc. Jan Wagner, P.Eng. Steve Kresnyak, P.Eng. Final Issue June 19, 2013 Introduction During
LSU Natural Gas Conference
 LSU Natural Gas Conference Presented by: Bob Purgason VP Gulfcoast Region Williams Companies Introduction Structural shift in natural gas pricing The crude to gas ratio: A critical relationship for NGL
Changing US Crude Oil Imports are Driving Refinery Upgrades, Creating Opportunities
 1 Changing US Crude Oil Imports are Driving Refinery Upgrades, Creating Opportunities Christopher Buehler, Ph.D., P.E. Praveen Gunaseelan, Ph.D. Crude Oil Quality Association October 22, 2009 Meeting Houston,
An INDEPENDENT energy consulting company since 1996 No affiliation with any marketer, broker, agent, utility, pipeline or producer.
 An INDEPENDENT energy consulting company since 1996 No affiliation with any marketer, broker, agent, utility, pipeline or producer. More than two decades of experience in the natural gas and electric industries
US Oil and Gas Import Dependence: Department of Energy Projections in 2011
 1800 K Street, NW Suite 400 Washington, DC 20006 Phone: 1.202.775.3270 Fax: 1.202.775.3199 Email: acordesman@gmail.com Web: www.csis.org/burke/reports US Oil and Gas Import Dependence: Department of Energy
U.S. Crude Oil and Natural Gas Proved Reserves, Year-end 2016
 U.S. Crude Oil and Natural Gas Proved Reserves, Year-end 2016 February 2018 Independent Statistics & Analysis www.eia.gov U.S. Department of Energy Washington, DC 20585 This report was prepared by the
FT-GTL UNLOCKS VALUE FROM NATURAL GAS
 FT-GTL UNLOCKS VALUE FROM NATURAL GAS Doug Miller Michael Goff Black & Veatch Corporation Ken Agee Emerging Fuels Technology April 2017 Introduction An estimated 147 billion cubic meters of gas was flared
IHS LATIN AMERICA LPG SEMINAR
 ENTERPRISE PRODUCTS PARTNERS L.P. IHS LATIN AMERICA LPG SEMINAR November 8, 2016 Joseph Fasullo Manager, International NGLs ALL RIGHTS RESERVED. ENTERPRISE PRODUCTS PARTNERS L.P. enterpriseproducts.com
Market Diversification & Infrastructure Oilmen s Executive Business Forum Banff, August 21, 2012 Dave Collyer, CAPP
 Market Diversification & Infrastructure Oilmen s Executive Business Forum Banff, August 21, 2012 Dave Collyer, CAPP The Canadian Oil and Natural Gas Industry - A Key Driving Force in the Canadian Economy
Oil Markets, Midstream and Downstream
 ENERGY Oil Markets, Midstream and Downstream Enhance your decision making with the power of IHS Markit integrated solutions for Oil Markets, Midstream and Downstream. Energy with IHS Markit is the leading
Calima to benefit from ~ A$72 Billion of proposed investment in Western Canadian gas pipeline infrastructure
 Market Announcements Platform ASX Limited Exchange Centre 20 Bridge Street Sydney NSW 2000 ASX Code: CE1 July 4, 2018 Calima to benefit from ~ A$72 Billion of proposed investment in Western Canadian gas
ISA Calgary. September 26, 2013
 ISA Calgary September 26, 2013 Canada s leading integrated energy company Focused on profitable growth and returning cash to shareholders The Suncor Advantage Largest reserves in the oil sands (1) Integrated
Short Term Energy Outlook March 2011 March 8, 2011 Release
 Short Term Energy Outlook March 2011 March 8, 2011 Release Highlights West Texas Intermediate (WTI) and other crude oil spot prices have risen about $15 per barrel since mid February partly in response
I Saw Miles and Miles of Texas
 A RBN Energy Drill Down Report Copyright 2016 RBN Energy I Saw Miles and Miles of Texas Mexican Demand, LNG Exports Pull Marcellus/Utica Gas to Lone Star State Favorable production economics will drive
Impacts of. Canada s Cleaner Energy Exports. Global Greenhouse Gas Emissions. Whistler, B.C. Canada. May 2002
 Impacts of Canada s Cleaner Energy Exports on Global Greenhouse Gas Emissions Whistler, B.C. Canada May 2002 1. Introduction The North American economy is highly integrated. Canada and the United States
Brownfield Projects. Equinox Engineering
 BROWNFIELD PROJECTS Equinox Engineering Brownfield Projects Equinox Engineering Ltd. is a world class provider of EPCM services to the global oil and gas marketplace. Founded in 1997, Equinox has successfully
Fuelled Up. An Updated Overview and Outlook of Canada s Propane Market and Industry
 Fuelled Up. An Updated Overview and Outlook of Canada s Propane Market and Industry REPORT DECEMBER 2018 Fuelled Up Canada s Propane Market and Industry. The footprint of Canada s low-emission propane
Alliance Pipeline. BMO Western Canadian Tour
 Alliance Pipeline BMO Western Canadian Tour September 16, 2014 Forward-Looking Information Certain information contained in this presentation constitutes forwardlooking statements. The words anticipate,
Annual Energy Outlook 2015
 Annual Energy Outlook 215 for Asia Pacific Energy Research Centre Annual Conference 215 Tokyo, Japan by Sam Napolitano Director of the Office of Integrated and International Energy Analysis U.S. Energy
December 30, Canada Transportation Act Review Secretariat 350 Albert Street, Suite 330 Ottawa, ON K1A 0N5
 December 30, 2014 Canada Transportation Act Review Secretariat 350 Albert Street, Suite 330 Ottawa, ON K1A 0N5 Subject: Submission to the Canada Transportation Act Review Secretariat: The Canadian Gas
The Outlook for Energy: A View to 2040
 The Outlook for Energy: A View to 2040 Rob Gardner March 2014 This presentation includes forward looking statements. Actual future conditions (including economic conditions, energy demand, and energy supply)
Fuel Focus. Understanding Gasoline Markets in Canada and Economic Drivers Influencing Prices. Issue 18, Volume 9
 Fuel Focus Understanding Gasoline Markets in Canada and Economic Drivers Influencing Prices Issue 18, Volume 9 October 3, 14 Copies of this publication may be obtained free of charge from: Natural Resources
Changes to America s Gasoline Pool. Gary Devenish. September 30, Baker & O Brien, Inc. All rights reserved.
 Changes to America s Gasoline Pool Gary Devenish September 30, 2016 Baker & O Brien, Inc. All rights reserved. Legal Notice Baker & O Brien, Inc., (Baker & O Brien) prepared this report for the Argus Condensate
Accelerated Depletion: Assessing Its Impacts on Domestic Oil and Natural Gas Prices and Production
 SR/OIAF/2000-04 : Assessing Its Impacts on Domestic Oil and Natural Gas Prices and Production July 2000 Energy Information Administration Office of Integrated Analysis and Forecasting U.S. Department of
Fuel Focus. Understanding Gasoline Markets in Canada and Economic Drivers Influencing Prices. Issue 2, Volume 9
 Fuel Focus Understanding Gasoline Markets in Canada and Economic Drivers Influencing Prices Issue 2, Volume 9 February 21, 14 Copies of this publication may be obtained free of charge from: Natural Resources
NASEO WINTER ENERGY OUTLOOK
 ENTERPRISE PRODUCTS PARTNERS L.P. NASEO WINTER ENERGY OUTLOOK October, 2014 Mike Smith Group Sr. Vice President ALL RIGHTS RESERVED. ENTERPRISE PRODUCTS PARTNERS L.P. enterpriseproducts.com DISCLAIMER
World and U.S. Oil and Gas Production and Price Outlook: To Infinity (or at least 2050) and Beyond
 and Beyond") World and U.S. Oil and Gas Production and Price Outlook: To Infinity (or at least 25) and Beyond Energy and Environment Symposium April 18, 218 Rifle, Colorado by Troy Cook, Senior Global Upstream Analyst,
World and U.S. Oil and Gas Production and Price Outlook: To Infinity (or at least 25) and Beyond Energy and Environment Symposium April 18, 218 Rifle, Colorado by Troy Cook, Senior Global Upstream Analyst,
Platts NGLs Conference. September 24, 2013
 Platts NGLs Conference September 24, 2013 Agenda 2013 - Executing the Plan 2014 Responding to Delineation Results 2015 Major Ramp Up 2016 Utica to Reach 50% of Marcellus Wet Conclusions 1 Executing the
U.S. Crude Oil and Natural Gas Proved Reserves, Year-end 2015
 U.S. Crude Oil and Natural Gas Proved Reserves, Year-end 2015 December 2016 Independent Statistics & Analysis www.eia.gov U.S. Department of Energy Washington, DC 20585 This report was prepared by the
Heavy Oil Upgrading from mine to motor
 Heavy Oil Upgrading from mine to motor C Fairbridge, J Chen, P Rahimi, E Little Devon, Alberta, Canada August 1, 2011 Heavy Oil Working Group Energy and Climate Partnership of the Americas 1 Targets, mandates,
Oil and Gas 101: An Overview of Emissions from Upstream Oil and Gas Exploration and Production Sources
 Oil and Gas 101: An Overview of Emissions from Upstream Oil and Gas Exploration and Production Sources Mike Pring, Eastern Research Group July 18, 2018 Training Overview Oil and gas production in the United
OPTI. October 2002 SHELL GLOBAL SOLUTIONS CANADA INC.
 SHELL GLOBAL SOLUTIONS October 2002 2 SHELL GLOBAL SOLUTIONS Gasification Technologies 2002 Integrated Oil Development Using OrCrude Upgrading and Shell Gasification Process Jim Arnold Phil Rettger Max
Opportuni)es and Consequences of the US Shale Revolu)on. Eric N. Smith Tulane Energy Ins)tute 7/9/16
es and Consequences of the US Shale Revolu)on. Eric N. Smith Tulane Energy Ins)tute 7/9/16") Opportuni)es and Consequences of the US Shale Revolu)on Eric N. Smith Tulane Energy Ins)tute 7/9/16 The surplus of supply over demand in the first half is currently about 800,000 b/d compared with the
Opportuni)es and Consequences of the US Shale Revolu)on Eric N. Smith Tulane Energy Ins)tute 7/9/16 The surplus of supply over demand in the first half is currently about 800,000 b/d compared with the
Canada s oil sands the in situ producers perspective
 Canada s oil sands the in situ producers perspective February 11, 2010 By: Chris Bloomer (Presented by: Gerald W. Bruce, IOSA member) IOSA Member Petrobank Who is IOSA? In situ Oil Sands Alliance Independent
American Strategy and US Energy Independence
 Cordesman: Strategy and Energy Independence 10/21/13 1 American Strategy and US Energy Independence By Anthony H. Cordesman October 21, 2013 Changes in energy technology, and in the way oil and gas reserves
SHALE DEVELOPMENT TRENDS AND IMPLICATIONS ON VALVE NEEDS JOHN D. SELDENRUST, VICE PRESIDENT-ENGINEERING & CONSTRUCTION
 SHALE DEVELOPMENT TRENDS AND IMPLICATIONS ON VALVE NEEDS JOHN D. SELDENRUST, VICE PRESIDENT-ENGINEERING & CONSTRUCTION WHAT IS UNCONVENTIONAL GAS? Gas that is more difficult or less economical to extract
Crude by Rail Lower Cost, Lower Risk, Better Netback, Right Away
 Crude by Rail Lower Cost, Lower Risk, Better Netback, Right Away James Cairns Vice President, Petroleum and Chemicals Upgrading Crude by Rail Capacity Summit February 26-27, 2013 Houston, TX FORWARD-LOOKING
Canadian Energy Research Institute
 Relevant Independent Objective Energy and Hydrogen for Alberta s Oil Sands Oil Sands Supply and Infrastructure Conference Bob Dunbar, President Strategy West Inc. bob.dunbar@strategywest.com Former Senior
Bitumen Upgrader Residue Conversion to Incremental Synthetic Fuels Products
 WHOC14-110 Bitumen Upgrader Residue Conversion to Incremental Synthetic Fuels Products STEVE KRESNYAK, P.Eng. JAN WAGNER, P.Eng. Expander Energy Inc. November 2013 This paper has been selected for presentation
2015 Trilateral Energy Outlook Project
 2015 Trilateral Energy Outlook Project December 2015 Prepared by: The National Energy Board Canada Secretaría de Energía de México U.S. Energy Information Administration This report was prepared in support
Assessment of the Cost and Scale of Refinery Capacity Additions Necessary to Absorb Projected US Light Tight Oil Increase
 Assessment of the Cost and Scale of Refinery Capacity Additions Necessary to Absorb Projected US Light Tight Oil Increase October 2014 Turner, Mason & Company ( TM&C ) has evaluated the potential impending
U.S. Crude Oil and Natural Gas Proved Reserves, 2012
 U.S. Crude Oil and Natural Gas Proved, 2012 April 2014 Independent Statistics & Analysis www.eia.gov U.S. Department of Energy Washington, DC 20585 This report was prepared by the U.S. Energy Information
U.S. oil and natural gas outlook
 U.S. oil and natural gas outlook New York, NY By Adam Sieminski, EIA Administrator U.S. Energy Information Administration Independent Statistics & Analysis www.eia.go v The U.S. has experienced a rapid
FROM RAILROAD COMMISSIONER RYAN SITTON
 2018 E N E R G Y M A R K E T O U T L O O K FROM RAILROAD COMMISSIONER RYAN SITTON TABLE OF CONTENTS 2018 ENERGY MARKET OUTLOOK Summing up the analysis contained in this report in a few sentences, my prediction