Extent of Eutrophication in Southern California Estuaries
|
|
|
- Rosemary Hunter
- 6 years ago
- Views:
Transcription
1 Extent of Eutrophication in Southern California Estuaries Martha Sutula and Karen McLaughlin SCCWRP Presentation to Orange County Coastal Coalition May 17, 2012
2 Why Assess Eutrophication in Southern California Bight Estuaries? Eutrophication is one of the leading causes of degraded biological condition in US water bodies Regional problem, lack of data Bight Program = opportunity First large scale assessment in southern California Consensus on indicators and protocols
3 Key Questions What is the extent and magnitude of eutrophication in southern California estuaries? How do OC estuaries rank among those assessed? Is indicator response driven by nutrient concentrations or nutrient loads?


4 Conceptual Model of Development of Eutrophication in SCB Estuaries Nutrient load Nutrient load Shading Light Light Macroalgae Phytoplankton Changes in Water Chemistry (DO, ph) Minimally Disturbed Increased Nutrient Loading Changes in Sediment Chemistry (Sulfide, Ammonia) Affected by Eutrophication Seagrass Benthic Diatoms Macroalgae Phytoplankton
5 Approach Indicators of eutrophication: Primary producers biomass and cover, bimonthly Macroalgae Phytoplankton Brackish-Water Submerged Aquatic Vegetation Dissolved Oxygen continuous in bottom water Nutrient loads or nutrient concentrations? Estuarine ambient nutrients- bimonthly Riverine Nutrient Loading Continuous flow Dry weather concentrations- bimonthy MS4 data or modeled (Sengupta et al. in prep)

6 Study Design 27 Segments from 23 Estuaries; Randomly Selected Monitored from Nov Oct 2009 Targeted index area within each estuary-- Most Conservative Answer
7 How to Assess Extent and Magnitude of Eutrophication? CA NNE still in development Evaluated existing frameworks, selected EU-WFD Framework Macroalgae Phytoplankton European Union-Water Framework Directive ASSETS- National Estuarine Eutrophication Assessment National Coastal Assessment Dissolved Oxygen X X X Nutrients Concentration, load, or combination Narrative Only X X Only loads Narrative Only Narrative Only X Only concentration
8 European Union Water Framework Directive Categorize estuaries based on ecological condition Very High Thresholds for indicators related to biological response to eutrophication Dissolved oxygen Macroalgae Phytoplankton Doesn t specify how to combine indicators Ecological Condition High Moderate Low Very Low Considered Problem Area


9 Macroalgae Assessment Biomass (g dw m -2 ) Ecological Condition Interpreted from WFD Framework Percent Cover 5% > 5% > 15% > 25% > 75% > 415 Moderate Low V. Low V. Low V. Low > 140 Moderate Moderate Low V. Low V. Low > 70 High Moderate Moderate Low Low > 15 V. High High High Moderate Low 15 V. High High High Moderate Moderate Very High High Moderate Low 2 g dw m -2 4% cover 7 g dw m % cover 25 g dw m % cover 76 g dw m % cover
 Very High < 5 High 5-7 Moderate 7-10 Low 10-30 Very Low 30 Chlorophyll a (mg/l)")

10 Phytoplankton Assessment Ecological Condition Interpreted from WFD Framework Annual Average of Sonde Chlorophyll a (µg/l) Very High < 5 High 5-7 Moderate 7-10 Low Very Low 30 Chlorophyll a (mg/l) Chlorophyll a (mg/l) /1/08 2/1/09 4/1/09 6/1/09 8/1/09 10/1/09 12/1/09 Very High 100 Annual Average: 3 mg L -1 Annual Average: 21 mg L /1/08 2/1/09 4/1/09 6/1/09 8/1/09 10/1/09 12/1/09 Low

11 Dissolved Oxygen Assessment 10th percentile of hourly running average DO data (mg/l) Very High 5.7 High Moderate Low Very Low < % Time Ecological Condition Interpreted from WFD Framework Very Low Moderate Very High th %tile Dissolved Oxygen Concentration (mg/l) 25

12 According to WFD, Eutrophication is Pervasive in SCB Estuaries Indicator % With Ecological Condition Less than High Any One 96% Either Primary Producer & DO 52% Macroalgae 78% Phytoplankton 37% Dissolved Oxygen 59% Ecological Condition Very High High Moderate Low Very Low
13 Uncertainties Did we adequately capture variability? Temporal variability Spatial variability What is the appropriate assessment framework for SCB estuaries? Relevance of European thresholds? Little guidance on data management Little guidance on frequency of sampling or how to incorporate event duration


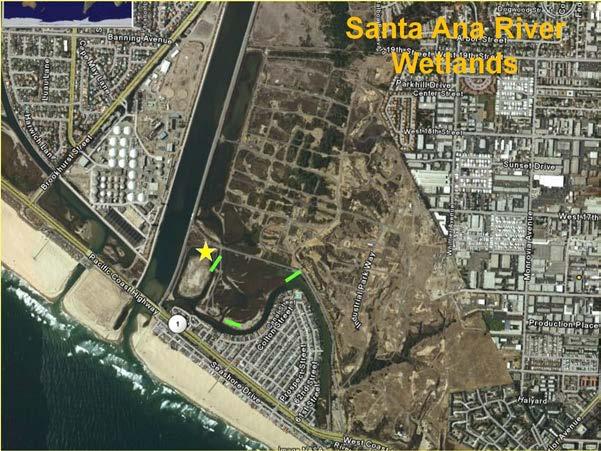
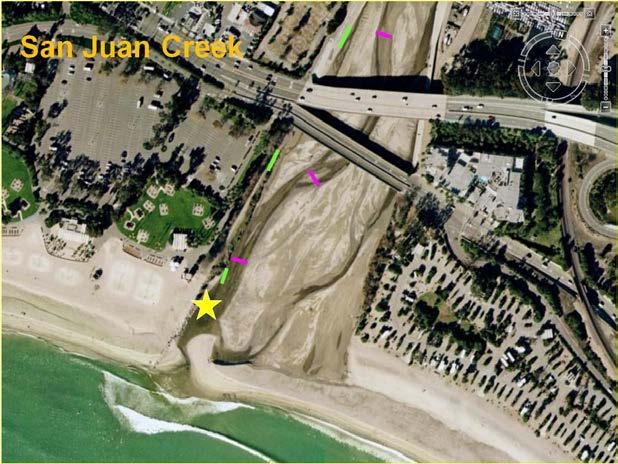
14 What OC Estuaries Were Monitored?
15 How Did OC Estuaries Fair? Segment Macroalgae Phytoplankton Dissolved Oxygen Very High Seal Beach - Full Seal Beach- Muted Bolsa Chica- Full Bolsa Chica - Muted Santa Ana River Ecological Condition High Moderate Low San Juan Creek Very Low
16 OC Estuaries Ranking Among 27 Sites Segment Percentile Rank Among All Estuarine Segments Macroalgae Phytoplankton Dissolved Oxygen Seal Beach - Full Seal Beach- Muted Bolsa Chica- Full Bolsa Chica - Muted Santa Ana River San Juan Creek Higher is Better
17 Summary Based on WFD, eutrophication is pervasive in SCB segments OC Estuaries are high to low condition (moderately eutrophic) Indicator response related to nutrient loads, not nutrient concentrations Additional work to increase precision Indicators related to nutrient loading on different time scales Macroalgae and phytoplankton significantly correlated with nutrient loading DO significantly correlated with sediment organic matter; integrating effects of eutrophication over a longer period
18 Questions? Martha Sutula Karen McLaughlin
19 Representative Primary Producers: Macroalgae Dominant with Few Exceptions January September May % Carbon Biomass DL UCL GS SCR MLM MLF ZC TC BL BW SBM SBF BCM BCF SAR SJC SMC SME AHL BQL SEL LPL MB SDR SDF SDM TJE SAV Macroalgae Phytoplankton
Southern California Bight 2008 Regional Monitoring Program: Volume VIII. Estuarine Eutrophication
 Technical Report 0711 Southern California Bight 2008 Regional Monitoring Program: Volume VIII. Estuarine Eutrophication K. McLaughlin 1, M. Sutula 1, L. Busse 2, S. Anderson 3, J. Crooks 4, R. Dagit 5,
A regional survey of the extent and magnitude of eutrophication in Mediterranean estuaries of southern California, USA
 A regional survey of the extent and magnitude of eutrophication in Mediterranean estuaries of southern California, USA Karen McLaughlin 1, Martha Sutula 1, Lilian Busse 2, Sean Anderson 3, Jeffrey Crooks
Nutrient Objectives for San Francisco Bay: Concepts, Process and Proposed Indicators
 Nutrient Objectives for San Francisco Bay: Concepts, Process and Proposed Indicators Martha Sutula So. California Coastal Water Research Project Lester McKee San Francisco Estuary Institute Naomi Feger
MODELING NUTRIENT LOADING AND EUTROPHICATION RESPONSE TO SUPPORT THE ELKHORN SLOUGH NUTRIENT TOTAL MAXIMUM DAILY LOAD
 MODELING NUTRIENT LOADING AND EUTROPHICATION RESPONSE TO SUPPORT THE ELKHORN SLOUGH NUTRIENT TOTAL MAXIMUM DAILY LOAD Martha Sutula Southern California Coastal Water Research Project Workshop on The Science
COUPLED PHYSICAL BIOGEOCHEMICAL MODELS
 COUPLED PHYSICAL BIOGEOCHEMICAL MODELS Upwelling CONCEPTUAL MODEL OF EUTROPHICATION IN THE COASTAL OCEAN Nutrient/ Acid Deposition Local Emissions HABs! Phytoplankton Blooms Senesce and Settling Respiration:
Patterns and filters of eutrophication endpoints in Elkhorn Slough
 Patterns and filters of eutrophication endpoints in Elkhorn Slough Brent Hughes, Kerstin Wasson, John Haskins Elkhorn Slough National Estuarine Research Reserve What is Eutrophication? Source: Associated
Some EU and US experiences in eutrophication assessment for transitional and coastal waters
 Some EU and US experiences in eutrophication assessment for transitional and coastal waters http://www.eutro.org J.G.Ferreira S.B. Bricker EU Joint Research Centre Assessment of Eutrophication in European
Chapter 4.4. Development of a Water Quality Index for the Maryland Coastal Bays
 Chapter 4.4 Development of a Water Quality Index for the Maryland Coastal Bays Tim Carruthers 1 and Catherine Wazniak 2 1 Integration and Application Network, University of Maryland Center for Environmental
Investigating the State of Acidification in the Southern California Bight
 Investigating the State of Acidification in the Southern California Bight Karen McLaughlin SCCWRP Symposium February 26, 2015 What is Ocean Acidification? Ocean Acidification is the other CO 2 problem
C. Jacoby Supervising Environmental Scientist Estuaries Section Bureau of Water Resources
 C. Jacoby Supervising Environmental Scientist Estuaries Section Bureau of Water Resources Questions What is the lagoon? What is a shared challenge? How are we doing? What happened? What have we learned?
1.1 MONITORING PROGRAM OBJECTIVES The major objectives of the Monitoring Program outlined in the Municipal Stormwater Permit are to:
 1.1 MONITORING PROGRAM OBJECTIVES The major objectives of the Monitoring Program outlined in the Municipal Stormwater Permit are to: Assess compliance with the Los Angeles County Municipal Stormwater Permit
Water Quality Improvement Plan Provision B.2 Submittal: Priority Water Quality Conditions
 JUNE 2017 [ REVISED DRAFT] SANTA MARGARITA RIVER WATERSHED MANAGEMENT AREA Water Quality Improvement Plan Provision B.2 Submittal: Priority Water Quality Conditions Submitted by COUNTY OF RIVERSIDE, COUNTY
St. Lucie Estuary: Analysis of Annual Cycles and Integrated Water Column Productivity
 St. Lucie Estuary: Analysis of Annual Cycles and Integrated Water Column Productivity Tom Gallo, Malcolm Pirnie Inc. Clifton Bell, Malcolm Pirnie Inc. Peter Doering, South Florida Water Management District
Relationships of water age with chlorophyll a concentrations in the eutrophic Lower Alafia River estuary. Michael S. Flannery Xinjian Chen
 Relationships of water age with chlorophyll a concentrations in the eutrophic Lower Alafia River estuary Michael S. Flannery Xinjian Chen Chlorophyll a (µg/l) Kilometers from river mouth KM = 16.47-1.96(Ln
Numeric Nutrient Criteria Update
 Numeric Nutrient Criteria Update Kevin Carter South Florida Water Management District Office Of Everglades Policy and Coordination 561-682-6949, kecarter@sfwmd.gov Palm Beach County Water Resources Task
Wood Canyon Emergent Wetland Project. City of Aliso Viejo 12 Journey, Suite 100 Aliso Viejo, CA 92656
 Wood Canyon Emergent Wetland Project City of Aliso Viejo 12 Journey, Suite 100 Aliso Viejo, CA 92656 Introduction Wood Canyon is located within Aliso and Wood Canyon Regional Park in southwest Orange County,
Florida Nutrient Criteria Update
 Standards and Assessment Florida Nutrient Criteria Update Russ Frydenborg Path Forward March 15, 2013: FDEP and EPA announced agreement to continue the protection of Florida s waterways from excess nitrogen
Appendix B: Inventory of Data Sources
 Appendix B: Inventory of Data Sources LIST OF DATA SOURCES AND REFERENCES TO SUPPORT WATER QUALITY IMPROVEMENT PLAN FOR THE SOUTH ORANGE COUNTY WATERSHED MANAGEMENT AREA November 4, 2015 Orange County
Science Supporting Biointegrity- Biostimulatory Policies for California Wadeable Streams
 Science Supporting Biointegrity- Biostimulatory Policies for California Wadeable Streams Presentation to SCCWRP Commission June 1, 2018 Biological Assessment Rather Than Chemistry-- is the Best Way to
Numeric Nutrient Endpoint Development for San Francisco Bay Estuary: Literature Review and Data Gaps Analysis
 Technical Report 0644 Numeric Nutrient Endpoint Development for San Francisco Bay Estuary: Literature Review and Data Gaps Analysis Lester McKee a, Martha Sutula b, Alicia Gilbreath a, Julie Beagle a,
SECTION C11.0, WATER QUALITY MONITORING AND ANALYSIS
 Table C-11-1: Pesticide detections frequencies above aquatic life benchmarks and concentrations summary statistics (ng/l) from samples collected during 2011-12 storm events % Detected Mean Min Max Pyrethroid
Inflow, water quality, and flushing of Lake Worth Lagoon
 Inflow, water quality, and flushing of Lake Worth Lagoon Christopher Buzzelli, Cassondra Thomas, Peter Doering* Coastal Ecosystems Section South Florida Water Management District Photo by C. Buzzelli OBJECTIVES
ASSESSMENTS FOR STORMWATER MONITORING AND MANAGEMENT
 ASSESSMENTS FOR STORMWATER MONITORING AND MANAGEMENT Eric Stein Biology Departments Southern California Coastal Water Research Project (SCCWRP) Effects of Stormwater Runoff Stormwater Assessment is Complex
OCSD Urban Runoff Program SCAP Collection Systems in Motion
 OCSD Urban Runoff Program SCAP Collection Systems in Motion Tom B. Meregillano Regulatory Specialist Orange County Sanitation District, CA OCSD Service Area Los Angeles Santa Ana San Diego Orange County,
Backdrop: Nutrient Pollution (nitrogen & phosphorus) Excessive Nutrients may cause
 Excessive Nutrients may cause") TMDLS PROPOSED NUTRIENT TMDL IVER & RECLAMATION ECLAMATION CANAL BASIN, & THE MORO COJO SLOUGH SUBWATERSHED LOWER SALINAS RIVER MONTEREY COUNTY Agenda Item 9 Photo Credits: Mary Hamilton CCRWQCB Salinas
TMDLS PROPOSED NUTRIENT TMDL IVER & RECLAMATION ECLAMATION CANAL BASIN, & THE MORO COJO SLOUGH SUBWATERSHED LOWER SALINAS RIVER MONTEREY COUNTY Agenda Item 9 Photo Credits: Mary Hamilton CCRWQCB Salinas
Dead-Zones and Coastal Eutrophication: Case- Study of Chesapeake Bay W. M. Kemp University of Maryland CES Horn Point Laboratory Cambridge, MD
 Dead-Zones and Coastal Eutrophication: Case- Study of Chesapeake Bay W. M. Kemp University of Maryland CES Horn Point Laboratory Cambridge, MD Presentation to COSEE Trends Orientation at UMCES HPL 4 August
Chuck Jacoby Supervising Environmental Scientist, Estuaries Section, St. Johns River Water Management District Program Scientist, Indian River Lagoon
 Chuck Jacoby Supervising Environmental Scientist, Estuaries Section, Program Scientist, Indian River Lagoon National Estuary Program Lagoon is: Sensitive Long (156 miles) Shallow Wind & tide driven Not
Nitrogen Management through Land Use. Holly Greening, Tampa Bay Estuary Program July 2010
 Nitrogen Management through Land Use Holly Greening, Tampa Bay Estuary Program July 2010 Importance of Water Quality Management Eutrophication (excess nutrients) common to many estuaries, streams and lakes
ARKANSAS NUTRIENT CRITERIA DEVELOPMENT. EPA Region 6 Nutrient RTAG Dallas, Texas April 14, 2015
 ARKANSAS NUTRIENT CRITERIA DEVELOPMENT EPA Region 6 Nutrient RTAG Dallas, Texas April 14, 2015 CRITERIA DEVELOPMENT MILESTONES Assessment Methodology Beaver Lake Wadeable Streams Nutrient Trading-Act 335
BIGHT' 08. Estuarine Eutrophication. Southern California Bight 2008 Regional Monitoring Program Vol. VIII
 BIGHT' 08 Estuarine Eutrophication Southern California Bight 2008 Regional Monitoring Program Vol. VIII SOUTHERN CALIFORNIA BIGHT 2008 REGIONAL MONITORING PROGRAM: VIII. Estuarine Eutrophication August
Long Island Sound Nitrogen Reduction Strategy Overview Public Webinar November 8, 2017
 Long Island Sound Nitrogen Reduction Strategy Overview Public Webinar November 8, 2017 Photo Credit: CTDEEP/Hammonasset Beach State Park, CT Presentation Overview Nitrogen strategy overview Outline technical
Florida Department of Environmental Protection Numeric Nutrient Criteria: Current Status
 Florida Department of Environmental Protection Numeric Nutrient Criteria: Current Status Russ Frydenborg, Drew Bartlett, Daryll Joyner, Ken Weaver Division of Assessment and Restoration Support Nutrient
Finalizing the Chesapeake Bay Health Index (BHI)
") Finalizing the Chesapeake Bay Health Index (BHI) Part 1: Water Quality Index Part 2: Biotic Index Bill Dennison Ben Longstaff, Michael Williams, Claire Buchanan, Roberto Llansó, and Peter Bergstrom On
Finalizing the Chesapeake Bay Health Index (BHI) Part 1: Water Quality Index Part 2: Biotic Index Bill Dennison Ben Longstaff, Michael Williams, Claire Buchanan, Roberto Llansó, and Peter Bergstrom On
THS Sci-O Water Quality Tryout Test. Partner 1: Partner 2: Total Score: /104
 THS Sci-O 2018-19 Water Quality Tryout Test Partner 1: Partner 2: Total Score: /104 1 Part One: 1-6. Label the times each part of the thermal stratification cycle occurs (ex: summer, spring turnover, etc.)
EUTROPHICATION. Student Lab Workbook
 EUTROPHICATION Student Lab Workbook THE SCIENTIFIC METHOD 1. Research Background literature research about a topic of interest 2. Identification of a problem Determine a problem (with regards to the topic)
Big Bend Model. Wayne Magley Watershed Evaluation and TMDL Section FDEP. March 7, 2016
 Big Bend Model Wayne Magley Watershed Evaluation and TMDL Section FDEP March 7, 2016 BACKGROUND As outlined in the EPA November 30, 2012 document Methods and Approaches for Deriving Numeric Criteria for
Item 4 Page 1 of 5 EE: Developing Benthic Community Condition Indices for Mesohaline Environments
 Item 4 Page 1 of 5 PS/SS: Development of Benthic Community Condition Indices for Mesohaline Environments of the San Francisco Bay. Estimated Total Cost: $125,800 (two-year study 2012 and 2013) $50,000
R.N. Nordin Ph.D. Resource Quality Section Water Management Branch Ministry of Environment (now called Ministry of Water, Land and Air Protection)
") Water Quality Water Quality Criteria for Nutrients and Algae Overview Report Prepared pursuant to Section 2(e) of the Environment Management Act, 1981 R.N. Nordin Ph.D. Resource Quality Section Water Management
Water Quality Water Quality Criteria for Nutrients and Algae Overview Report Prepared pursuant to Section 2(e) of the Environment Management Act, 1981 R.N. Nordin Ph.D. Resource Quality Section Water Management
Common Procedure for the Identification of the Eutrophication Status of the OSPAR Maritime Area. UK National Report
 Common Procedure for the Identification of the Eutrophication Status of the OSPAR Maritime Area UK National Report 1 Table of contents Table of contents 2 1 Introduction 4 2 Description of assessed areas
C-11.0 WATER QUALITY MONITORING SUMMARY AND ANALYSES
 C-11.0 WATER QUALITY MONITORING SUMMARY AND ANALYSES C-11.1 Introduction In response to the monitoring and reporting requirements of the Fourth Term Municipal Stormwater Permit (R8-2009-0030, NPDES CAS618030)
CHAPTER 15 WATER POLLUTION. INTO THE GULF Researchers try to pin down what s choking the Gulf of Mexico
 CHAPTER 15 WATER POLLUTION INTO THE GULF Researchers try to pin down what s choking the Gulf of Mexico SAVING THE BAY Teams of researchers try to pin down what s choking the Chesapeake Water pollution
Remote Sensing of Seagrass to Assess Coastal Environmental Integrity
 Remote Sensing of Seagrass to Assess Coastal Environmental Integrity Richard G. Lathrop Scott Haag Rutgers University Jacques Cousteau National Estuarine Research Reserve Outline Human Land Use/Land Cover
Numeric Nutrient Criteria
 Numeric Nutrient Criteria Kevin Carter South Florida Water Management District Office Of Everglades Policy and Coordination 561-682-6949, kecarter@sfwmd.gov Lake Worth Lagoon Initiative Symposium Palm
Lake Elsinore and Canyon Lake Nutrient TMDL Monitoring Quarter 3 Report (DRAFT)
") Lake Elsinore and Canyon Lake Nutrient TMDL Monitoring 2016-2017 Quarter 3 Report (DRAFT) Prepared for: Lake Elsinore & San Jacinto Watershed Project Authority 11615 Sterling Avenue Riverside, California
Lake Elsinore and Canyon Lake Nutrient TMDL Monitoring 2016-2017 Quarter 3 Report (DRAFT) Prepared for: Lake Elsinore & San Jacinto Watershed Project Authority 11615 Sterling Avenue Riverside, California
Christian L. Avila, Galia Varona, Maurice Pierre, Omar Abdelrahman, and Jamie Monty Miami-Dade County Department of Regulatory and Economic Resources
 Christian L. Avila, Galia Varona, Maurice Pierre, Omar Abdelrahman, and Jamie Monty Miami-Dade County Department of Regulatory and Economic Resources (Division of Environmental Resources Management (DERM).
Lower Cape Fear River Basin Cape Fear DO Issues
 Lower Cape Fear River Basin Cape Fear DO Issues by Jim Bowen, Assoc. Professor Civil Engr. Dept., UNC Charlotte Cape Fear Basin TMDL Conference Raleigh, NC September 9, 2003 Outline of Talk 1. Water Quality
Model Monitoring Program for Municipal Separate Storm Sewer Systems in Southern California
 Model Monitoring Program for Municipal Separate Storm Sewer Systems in Southern California A report from the Stormwater Monitoring Coalition s Model Monitoring Technical Committee August 004 Technical
Linking Ecosystem Indicators to Ecosystem Services
 Linking Ecosystem Indicators to Ecosystem Services Christine Davis* G. Van Houtven, C. Mansfield, M. Cutrofello, and M. O Neil *Health and Environmental Impacts Division, OAQPS U.S. Environmental Protection
DECISION ID Region 8 Santa Ana River, Reach 3
 DECISION ID 63257 Region 8 Santa Ana River, Reach 3 Final Listing Decision: Last Listing Cycle's Final Listing Decision: Revision Status Impairment from Pollutant or Pollution: Total Dissolved Solids Do
SECTION C11.0, WATER QUALITY MONITORING AND ANALYSIS C-11.0 WATER QUALITY MONITORING SUMMARY AND ANALYSES. C-11.1 Introduction
 C-11.0 WATER QUALITY MONITORING SUMMARY AND ANALYSES C-11.1 Introduction In response to the monitoring and reporting requirements of the Fourth Term Municipal Stormwater Permit (R9-2009-0002, NPDES CAS0108740)
Sediment Quality Objectives Update. Steven Bay
 Sediment Quality Objectives Update Steven Bay Commission Meeting: March 2, 2018 Background CA adopted SQOs and assessment methods in 2008 Next phase of SQO program nearing culmination Commission asked
Clockhouse Lane Pit Lakes - Water Quality and Ecology Overview 2015
 Clockhouse Lane Pit Lakes - Water Quality and Ecology Overview 2015 Heathrow Airport uses specialist consultants to monitor the Clockhouse Lane Pit system of interconnected lakes for water quality and
Swedish experiences on the importance of N and P
 Danish Coastal Eutrophication Conference Copenhagen 213-6-19 Swedish experiences on the importance of N and P Ragnar Elmgren & Ulf Larsson Dept. Ecology, Environment & Plant Sciences Stockholm University
CERP System Status Reports The Evolution from
 CERP System Status Reports The Evolution from 2006-2009 Eliza Hines 22 July 2009 Everglades Restoration Comprehensive Everglades Restoration Plan (CERP) 18,000 sq mile ecosystem Everglades & South Florida
Chesapeake Bay. report card
 Chesapeake Bay report card 2010 C- C Healthy water quality provides better habitat conditions for crabs, fish, and other aquatic species. issolved oxygen is essential to the survival of all these organisms;
Background. Eutrophication - an increase in the rate of supply of organic matter to an ecosystem. - Scott Nixon (1995)
") Background Estuaries are among the most productive ecosystems on earth. They can produce organic material at rates comparable to those in the most intensively cultivated farm fields. Generally, high productivity
Background Estuaries are among the most productive ecosystems on earth. They can produce organic material at rates comparable to those in the most intensively cultivated farm fields. Generally, high productivity
Water quality monitoring and assessment: general principles and fitness for purpose
 Water quality monitoring and assessment: general principles and fitness for purpose Deborah V Chapman GEMS/Water Capacity development Centre University College Cork Considerations Purpose of monitoring
Explanatory Note. Interim Classification of Irish Coastal and Transitional Waters for the purposes of the EU Water Framework Directive.
 Explanatory Note Interim Classification of Irish Coastal and Transitional Waters for the purposes of the EU Water Framework Directive. Introduction November 2008 The EU Water Framework Directive (2000/60/EC)
Impact of Orange County Sanitation District Wastewater Disinfection on Beach Water Quality
 Impact of Orange County Sanitation District Wastewater Disinfection on Beach Water Quality Coastal Coalition March 27, 2014 Presented By: Dr. Samuel Choi Orange County Sanitation District Environmental
Coastal studies in Long Term Ecological Research. Dan Reed Santa Barbara Coastal LTER
 Coastal studies in Long Term Ecological Research Dan Reed Santa Barbara Coastal LTER NSF s Long Term Ecological Research Program 24 sites representing a diverse array of biomes Major focus of research
Ocean Acidification in the Southern California Bight
 Ocean Acidification in the Southern California Bight Karen McLaughlin SCCWRP Symposium March 1, 2017 What is Ocean Acidification? Ocean Acidification is the other CO 2 problem : Ocean ph decreases when
Biogeochemical Treatment of ARD at the Island Copper Mine Pit Lake
 Biogeochemical Treatment of ARD at the Island Copper Mine Pit Lake Presented by: C. Pelletier, D. Muggli, M. Wen, and G. Poling Rescan Environmental Services Ltd. Rupert Inlet and Island Copper Mine Site
Ecosystem Approach for Sustainable Aquaculture
 Ecosystem Approach for Sustainable Aquaculture ECASA www.ecasa.org.uk/ ECASA Planning Meeting IFREMER Paris 6 th -8 th April 2005 J.G. Ferreira A. Sequeira A. Newton www.ecowin.org/ecasa/ IMAR Portugal
Pacific Coastal Ecology Branch Physical and Water Quality Data
 Pacific Coastal Ecology Branch Physical and Water Quality Data Data Contributors: Cheryl A. Brown, Peter Eldridge, Robert Ozretich, Anne Sigleo & David Specht CRUISES CTD profiles using (SBE 19 SEACAT)
APPENDIX B - QUALITY ASSURANCE AND QUALITY CONTROL PROCEDURES. Interlaboratory Comparison for Wastewater Effluent Analysis
 APPENDIX B - QUALITY ASSURANCE AND QUALITY CONTROL PROCEDURES Interlaboratory Comparison for Wastewater Effluent Analysis A comparison study was conducted to determine the amount of variability between
Lake Elsinore and Canyon Lake Nutrient TMDL Monitoring Quarter 3 Report
 Lake Elsinore and Canyon Lake Nutrient TMDL Monitoring 2017-2018 Quarter 3 Report Prepared for: Lake Elsinore & San Jacinto Watershed Project Authority 11615 Sterling Avenue Riverside, California 92503
Status and trend analysis in the Maryland water quality monitoring program
 Status and trend analysis in the Maryland water quality monitoring program Matt Hall Research Statistician Tidewater Ecosystem Assessment mhall@dnr.state.md.us Cathy Wazniak Coastal Bays Program Manager
Appendix 2 Screening of Keewatinoow Construction Camp Waste Water Effluent Discharge to Creek Fourteen
 Appendix 2 Screening of Keewatinoow Construction Camp Waste Water Effluent Discharge to Creek Fourteen Prepared by: North/South Consultants Inc. July 19, 2011 Introduction The following provides a screening
Dog River Watershed Management Plan
 Dog River Watershed Management Plan Preliminary Water Quality Data Analysis Doug Robison, PWS ESA is where solutions and service meet. Water Quality - Regulatory Primer Designated Use Categories Swimming
ELKHORN SLOUGH TECHNICAL REPORT SERIES 2019: 1
 ELKHORN SLOUGH TECHNICAL REPORT SERIES 2019: 1 Sponsored by the Elkhorn Slough National Estuarine Research Reserve and the Elkhorn Slough Foundation Long-term trends and spatial patterns of water quality
Riparian Restoration on California's Coast November 3, Reach scale
 Research and Adaptive Management Research approaches in stream corridor assessment and restoration Integral to all components Recognition of uncertainty Commitment to monitor and learn Willingness to adjust
Little River Watershed Restoration Project. Mark Powell, Consultant Natural Resources Management
 Little River Watershed Restoration Project Mark Powell, Consultant Natural Resources Management Lessons Learned Strong partnerships RC&D, Soil and Water, 2 counties, Albemarle Commission, Universities,
Lake Pepin Photo by Guy Schmickle
 Options for Meeting Water Quality Standards Lake Pepin Technical Conference September 23, 28 Lake Pepin Photo by Guy Schmickle Overview Role of modeling in the TMDL Main features of UMR-LP Model Reductions
GULF OF MEXICO - SEGMENT 2501
 GULF OF MEXICO - SEGMENT 2501 GULF OF MEXICO - SEGMENT 2501 LAND COVER BACTERIA CHLOROPHYLL A Impairment Concern No Impairments or Concerns GULF OF MEXICO - SEGMENT 2501 OTHER IMPAIRMENTS Bays & Estuaries
Assessment of Episodic Streams in the San Diego Region
 Technical Report #1011 Assessment of Episodic Streams in the San Diego Region Raphael D. Mazor1, Jeff Brown1, Eric D. Stein1, John R. Olson2, Matthew D. Robinson2, and Theresa Clark2 1 Southern California
WFD and MSFD in Slovenia regional perspective from a research point of view
 WFD and MSFD in Slovenia regional perspective from a research point of view Janja FRANCÉ & Martina ORLANDO-BONACA National Institute of Biology, Marine Biology Station Fornače 41, SI-6330 Piran WFD was
Climate Change Impacts for the Central Coast and Hunter Regions
 Climate Change Impacts for the Central Coast and Hunter Regions http://www.ozcoasts.gov.au/climate/ima ges/f1_risks.jpg Peter Smith 1 Climate change will have increasing impacts on a wide range of natural
Turning water quality data into lake-specific nutrient standards
 Turning water quality data into lake-specific nutrient standards 2015 Tribal Lands and Environment Forum Nancy Schuldt, Water Projects Coordinator Fond du Lac Reservation Current Narrative Standard:
COMMON IMPLEMENTATION STRATEGY FOR THE WATER FRAMEWORK DIRECTIVE (2000/60/EC)
") Technical Report - 2009-039 COMMON IMPLEMENTATION STRATEGY FOR THE WATER FRAMEWORK DIRECTIVE (2000/60/EC) Policy Summary of Guidance document No. 23 ON EUTROPHICATION ASSESSMENT IN THE CONTEXT OF EUROPEAN
Technical Report - 2009-039 COMMON IMPLEMENTATION STRATEGY FOR THE WATER FRAMEWORK DIRECTIVE (2000/60/EC) Policy Summary of Guidance document No. 23 ON EUTROPHICATION ASSESSMENT IN THE CONTEXT OF EUROPEAN
Calibration of Linked Hydrodynamic and Water Quality Model for Santa Margarita Lagoon
 TECHNICAL REPORT 3015 July 2016 Calibration of Linked Hydrodynamic and Water Quality Model for Santa Margarita Lagoon Final Report Pei-Fang Wang Chuck Katz Ripan Barua SSC Pacific James Martin Mississippi
Climate Change & the Chesapeake TS3 workgroup chapter. European MedSeA
 Climate Change & the Chesapeake TS3 workgroup chapter European MedSeA 21 ST CENTURY CLIMATE CHANGE AND SUBMERGED AQUATIC VEGETATION IN THE CHESAPEAKE BAY The 20 th century story: nutrient pollution, eutrophication,
Chlorophyll-based Water Quality Criteria for Protecting Aquatic Life Designated Uses
 Chlorophyll-based Water Quality Criteria for Protecting Aquatic Life Designated Uses Paul Bukaveckas Virginia Commonwealth University pabukaveckas@vcu.edu Eutrophication: A Long-standing Water Quality
Coastal Bays. report card. Gold stars for partnerships. Black skimmers are dependent on island habit in the Coastal Bays
 22 26 21 214 One of only 28 such programs nationwide, the goal of the Maryland Program is and Assateague Island ational Seashore. The 175-square mile watershed is home to the treasured resources of St.
Estero Americano Watershed Sediment Reduction Project, Phase II, Sonoma and Marin Counties, CA. Draft Quarterly Monitoring Report Item B.4.
 Estero Americano Watershed Sediment Reduction Project, Phase II, Sonoma and Marin Counties, CA Draft Quarterly Monitoring Report Item B.4.2 This quarterly report summarizes data collected from December
FRESHWATER STREAM INVERTEBRATES: RESPONSE TO WATER QUALITY IMPAIRMENT AND PHYSICAL HABITAT ALTERATION
 Technical Paper #0508 FRESHWATER STREAM INVERTEBRATES: RESPONSE TO WATER QUALITY IMPAIRMENT AND PHYSICAL HABITAT ALTERATION Prepared by: Bill Isham Weston Solutions, Inc. (WESTON ) For Presentation at:
Chesapeake Bay Nitrogen Assessments
 Chesapeake Bay Nitrogen Assessments May 20, 2010 Workshop on Nitrogen Assessment Science in the USA Thomas E. Jordan Chesapeake Bay Watershed Area=167,000 km 2 Spans 6 states + DC 6 physiographic provinces
Little Bay Water Quality Report Card Spring 2014
 Little Bay Water Quality Report Card Spring 2014 Little Bay is a small, semi-enclosed estuary located in the heart of Rockport, Texas. Estuaries, where freshwater from rivers and streams mixes with salt
A new stream condition index based on algae: What does it mean for the SMC?
 A new stream condition index based on algae: What does it mean for the SMC? Updates on assessments of sediment, hydromodification, and physical habitat Applications of SMC data to integrated reporting
LM0308: Catchment Management for Water Quality
 LM0308: Catchment Management for Water Quality Case Study 5: Uncertainty in ecological responses to water quality control measures at the river basin scale. Lead: Richard Williams (CEH); Andy Wade (University
Tina Laidlaw US EPA 1
 Tina Laidlaw US EPA 1 Many states have developed approaches for listing waterbodies for nutrient-related impairments based on the narrative standard Existing state approaches are similar to CO s proposal
Nutrient Cycling and Water Quality on California Rangelands
 Nutrient Cycling and Water Quality on California Rangelands Randy Dahlgren Department of Land, Air and Water Resources University of California - Davis Core Research Team Barbara Allen-Diaz Rob Atwill
Barnegat Bay Water Quality and Quantity Monitoring Program
 Barnegat Bay Water Quality and Quantity Monitoring Program Helen Pang, Trish Ingelido, Ariane Giudicelli, Barbara Hirst, Amanda Lotto and Jill Lipoti Water Monitoring and Standards NJDEP 2013 Delaware
Linking Pesticide Detection in Runoff with Water Quality Toxicity. Dr. Ted von Bitner OC Watersheds June 1, 2011
 Linking Pesticide Detection in Runoff with Water Quality Toxicity Dr. Ted von Bitner OC Watersheds June 1, 2011 Acknowledgements OC Watersheds Joel Magsalin, Project Scientist Salt Creek Watershed partners
LAKE TARPON WATER QUALITY MANAGEMENT PLAN SCOPE OF WORK
 LAKE TARPON WATER QUALITY MANAGEMENT PLAN SCOPE OF WORK Project Background Lake Tarpon With a surface area of approximately four square miles and a watershed of approximately 52 square miles, Lake Tarpon,
Wetland Monitoring in Cranberry Marsh Through the Durham Region Coastal Wetland Monitoring Project
 Wetland Monitoring in Cranberry Marsh Through the Durham Region Coastal Wetland Monitoring Project Greg Grabas Canadian Wildlife Service Environment Canada Durham Region Coastal Wetlands Great wetlands
Good morning. In order to ask questions, you must enter your audio pin, or enter your question in the chat box
 Good morning. In order to ask questions, you must enter your audio pin, or enter your question in the chat box SCCWRP Clear Lake Sampling & Analysis Services Request for Qualifications Bidders Informational
Nutrients. Water Quality Planning Branch Water Division Arkansas Department of Environmental Quality
 Nutrients Water Quality Planning Branch Water Division Arkansas Department of Environmental Quality Water Quality & Biological Data Water Quality Standards & Criteria Assessment Permit Limitations Impairment
TOTAL MAXIMUM DAILY LOAD (TMDL)
") TOTAL MAXIMUM DAILY LOAD (TMDL) For Nutrients In Black Point Channel (WBID 1637) Prepared by: US EPA Region 4 61 Forsyth Street SW Atlanta, Georgia 30303 September 2009 TABLE OF CONTENTS 1.0 INTRODUCTION...
TOTAL MAXIMUM DAILY LOAD (TMDL) For Nutrients In Black Point Channel (WBID 1637) Prepared by: US EPA Region 4 61 Forsyth Street SW Atlanta, Georgia 30303 September 2009 TABLE OF CONTENTS 1.0 INTRODUCTION...
Nutrient Limits: What to Expect. Water Division Arkansas Department of Environmental Quality
 Nutrient Limits: What to Expect Water Division Arkansas Department of Environmental Quality wentz@adeq.state.ar.us bailey@adeq.state.ar.us Timeline of Nutrient Criteria Development 1998 EPA published the
HYPOXIA Definition: ~63 µm; 2 mg l -1 ; 1.4 ml l -1 ; 30 %
 HYPOXIA Definition: ~63 µm; 2 mg l -1 ; 1.4 ml l -1 ; 30 % Consequences of hypoxia Reduce habitat for living resources Change biogeochemical processes P released from sediments Denitrification reduced