Monitoring the Effectiveness of Best Management Practices for the Reduction of Total Suspended Solids in Agricultural Runoff
|
|
|
- Agnes Barber
- 6 years ago
- Views:
Transcription


1 Monitoring the Effectiveness of Best Management Practices for the Reduction of Total Suspended Solids in Agricultural Runoff Presented By: The Ecological Conservation Organization
2 Introduction Agriculture run-off has been identified as a contributing source to nonpoint source pollution and therefore negatively effecting water quality and crop yield BMP (best management practices) implementation can help reduce pollution of waterways.
3 Goals and Objectives Determine concentrations of TSS (total suspended solids) from agricultural fields Assess pre BMP and post BMP sites to determine any statistical difference in TSS Determine any importance of crop cover on field in relation to TSS concentrations
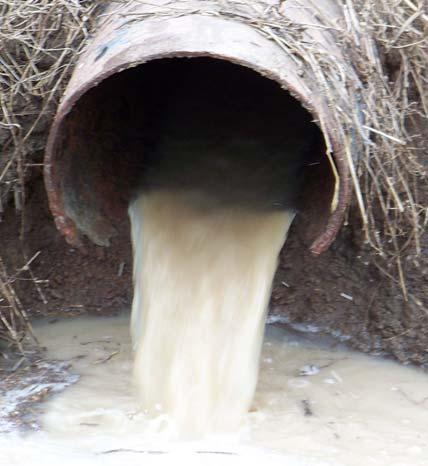
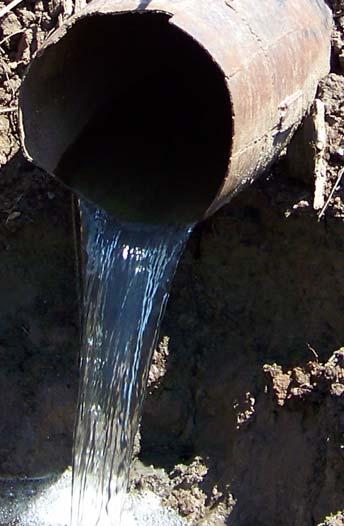
4 Site Description Pre- BMP Water eroding through earthen levee from rain or irrigated water Post-BMP Drop Pipe Flashboard Riser
5 Best Management Practices Flashboard risers are water control structures made with removable boards that can be used to adjust the level of water held behind the structure. Drop pipes reduce gulling or erosion of soils by transporting water through a confined system and reduce erosion by the precipitation of suspended sediment by the ponding of water.


6


7 5oakswildlifeservices.com
8 Site Selection Land Ownership Cooperation Accessibility Proximity to one another


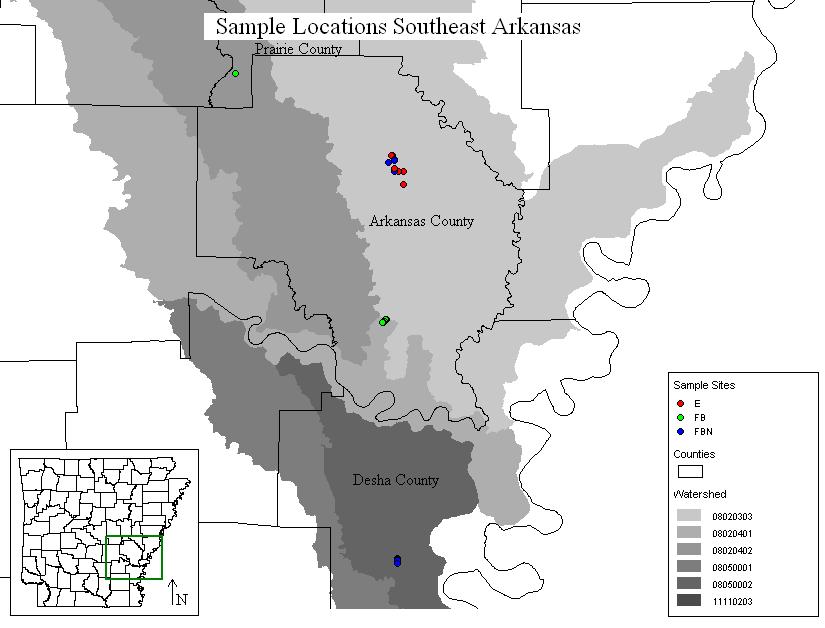
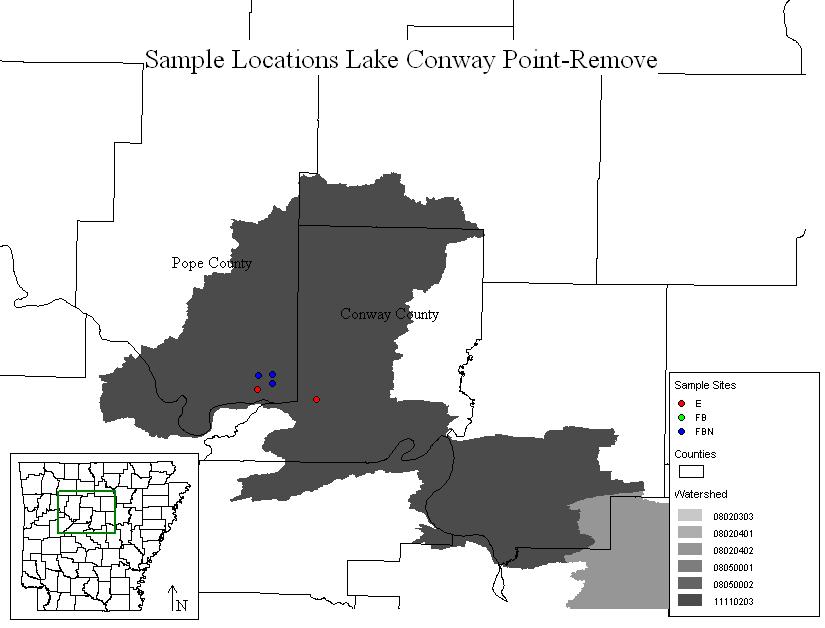
9 38 Sampling Locations Five counties, two physiographic regions Arkansas River Valley - Conway and Pope Counties Mississippi Alluvial Plain - Arkansas, Desha and Prairie Counties
10
11


12 Sampling Protocol Soil Saturation to produce run-off Irrigation or rain events Seasonality differences Samples from sites containing a BMP Samples from eroding sites with planned BMP


13 Data Interpretation Statistical Methods Outliers were determined and removed from data set Mann-Whitney Test Mann-Whitney was used to determine statistical differences strictly between Pre-BMP and Post-BMP samples ANOVA determined any significant differences in the type of BMP implemented determined any significant differences in the type of field cover Tukey s Pairwise Comparison compare differences between the following categories: no field cover containing BMP, no field cover without BMP, field cover containing BMP and field cover without BMP.
 93 Pre-BMP (4-18,740 mg/l TSS mean 1,715) 161 Post-BMP (2 5,029 mg/l")
14 Results 254 utilized samples (outliers removed +- 3 std dev.) 93 Pre-BMP (4-18,740 mg/l TSS mean 1,715) 161 Post-BMP (2 5,029 mg/l TSS mean )
15 Results Treatment Count Mean Standard TSS (mg/l) Deviation Eroded (Pre-BMP) 93 1, , Flashboard Riser, No Boards (Post-BMP) Flashboard Riser (Post- BMP) Drop Pipe (Post-BMP) Total 254
16 To test the effectiveness of the BMP a Mann-Whitney (Wilcoxon) test was used to compare the medians of TSS concentrations in the Pre-BMP sites to Post-BMP sites. The test resulted in a p-value >0.01, therefore concluding the Pre- BMP sites had a statistically significant higher TSS concentrations than Post-BMP sites with 99% confidence.
17 Results Cover Count Mean Standard TSS (mg/l) Deviation Barren 82 2, , Beans Corn Grass Rice Wheat Total 254
18 A multifactor ANOVA was utilized to determine significance levels amongst the TSS concentrations between cover types. The test concluded that the concentration of TSS from barren fields was significantly higher then all other cover types. No statistical differences for the concentrations of TSS between the remaining cover types (Beans, Corn, Grass, Rice, and Wheat) was found to be significant.
19 Field Type Pre-BMP Mean TSS (mg/l) Results Percent Reduction for BMP Implementation for Field Types Post-BMP Mean TSS (mg/l) Percent Reduction Barren 4, , % Covered 2, % Percent Reduction 45.30% 93.80%
20 A Tukey s Pairwise comparison was performed based on BMP presence and cover presence. Sites characterized as barren & Pre-BMP contributed statistically higher TSS concentrations than all other sites. The remaining characterizations demonstrated TSS concentrations descending in following order: Cover & Pre-BMP, Barren & Post-BMP, and Cover & Post-BMP.
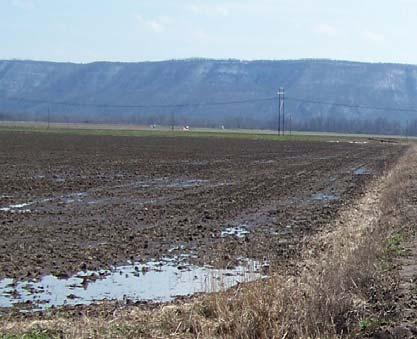
21 Difficulties Weather conditions presented the largest barrier in the project. Roads often become nearly impassable when soils exceeded their saturation point. Storms can be unpredictable with regards to precipitation amount. Timing of runoff. Cold/wet nights MUD, MUD, AND MORE MUD
22 Difficulties
23
24 Conclusion Significant lower TSS at sites with drop pipes or flashboard risers. Significant lower TSS at sites with cover crop. Combination of BMP and cover crop had greatest significant reduction of TSS concentrations over any other combination.

25 Dan DeVun (501)
Attachment 1. Categorical Summary of BMP Performance Data for Solids (TSS, TDS, and Turbidity) Contained in the International Stormwater BMP Database
 Contained in the International Stormwater BMP Database") Attachment 1 Categorical Summary of BMP Performance Data for Solids (TSS, TDS, and Turbidity) Contained in the International Stormwater BMP Database Prepared by Geosyntec Consultants, Inc. Wright Water
Attachment 1 Categorical Summary of BMP Performance Data for Solids (TSS, TDS, and Turbidity) Contained in the International Stormwater BMP Database Prepared by Geosyntec Consultants, Inc. Wright Water
Heather L. Welch US Geological Survey, Lower Mississippi-Gulf Water Science Center
 Contribution of total dissolved phosphorus in irrigation runoff from the Mississippi River valley alluvial aquifer to phosphorus concentrations in a Delta stream Heather L. Welch US Geological Survey,
Unit E: Basic Principles of Soil Science. Lesson 7: Understanding Soil Erosion and Management Practices
 Unit E: Basic Principles of Soil Science Lesson 7: Understanding Soil Erosion and Management Practices 1 Important Terms Accelerated erosion Conservation tillage Cover crops Diversion ditches Geologic
University of Wisconsin Discovery Farms Staff 2013 Wisconsin Corn / Soy Expo Wisconsin Dells, WI
 University of Wisconsin Discovery Farms Staff 2013 Wisconsin Corn / Soy Expo Wisconsin Dells, WI Overview 1. UW-Discovery Farms, unique program and information, since 2001 Data from private working farms
A Nutrient Mass Balance of the Watershed Research and Education Center: Where, When and How Much?
 A Nutrient Mass Balance of the Watershed Research and Education Center: Where, When and How Much? BRIAN E. HAGGARD, JOHN T. METRAILER, DIRK PHILIPP, J. VAUGHN SKINNER, J. THAD SCOTT, AND ANDREW N. SHARPLEY
Nutrient BMP Evaluation Project: Preliminary Conclusions
 Nutrient BMP Evaluation Project: Preliminary Conclusions Manure Management Update 2013 Conference Lethbridge, AB January 14, 2013 Beneficial Management Practices How effective are they, what are the costs,
Earth s Water. 97% Salt 3% Fresh
 Earth s Water 97% Salt 3% Fresh Of the 3% Freshwater 77% is in icecaps and glaciers (frozen) 22% is under the surface (groundwater) 1% is other: lakes, streams, rivers, etc. Surface water Supports cities
2010 Growing Season - Barton County, Kansas Land Cover Summary
 2010 Growing Season - Barton County, Kansas Land Cover Summary Number of Fields Percent of Total Fields Total Acres Percent of Acres ALFALFA 39 7.1% 3,075.5 6.4% CORN 45 8.1% 5,328.6 11.1% CRP 4 0.7% 408.5
Summary of Water Monitoring Data
 Clay County Drainage Site Summary of Water Monitoring Data 2011 2015 Introduction The Red River Valley in northwestern Minnesota is experiencing an increase in the amount of agricultural subsurface drainage
Water Conservation Practices for Rice and Soybean Irrigation
 Water Conservation Practices for Rice and Soybean Irrigation Phil Tacker Cooperative Extension Service Earl Vories Northeast Research & Extension Center I way over-married and am blessed with two teenage
Recommended Resources: The following resources may be useful in teaching this lesson:
 Unit E: Basic Principles of Soil Science Lesson 7: Understanding Soil Erosion and Management Practices Student Learning Objectives: Instruction in this lesson should result in students achieving the following
Understanding Soil Erosion and Management Practices
 Lesson C6 8 Understanding Soil Erosion and Management Practices Unit C. Plant and Soil Science Problem Area 6. Basic Principles of Soil Science Lesson 8. Understanding Soil Erosion and Management Practices
Discovery Farms Minnesota N and P, what is happened in Farm Fields? Jerome Lensing January 9, 10, 11, 2018 AgVise Labs
 Discovery Farms Minnesota N and P, what is happened in Farm Fields? Jerome Lensing January 9, 10, 11, 2018 AgVise Labs Jerome.lensing@hotmail.com Discovery Farms is a farmer led water quality research
Impacts of 2008 flooding on agricultural lands in Illinois, Missouri, and Indiana Kenneth R. Olson
 FEATURE doi:10.2489/jswc.64.6.167a Impacts of 2008 flooding on agricultural lands in Illinois, Missouri, and Indiana Kenneth R. Olson T he 2008 spring rains in Illinois, Missouri, and Indiana delayed planting,
Alabama Department of Agriculture & Industries. Commissioner John McMillan
 Alabama Department of Agriculture & Industries Commissioner John McMillan 24 th Annual Nonpoint Source Conference DATA Our stakeholders must have an accurate inventory of our state s water resources before
Septic System Impacts on Stormwater and Impaired Waterbodies. December 8, 2016 Tim Denison, Johnson Engineering Marcy Frick, Tetra Tech
 Septic System Impacts on Stormwater and Impaired Waterbodies December 8, 2016 Tim Denison, Johnson Engineering Marcy Frick, Tetra Tech Presentation Overview Charlotte County: Many areas adjacent to impaired
Evaluation of Water Quality Effects of Stormwater Pond Construction in Horry County, South Carolina
 Evaluation of Quality Effects of Stormwater Construction in Horry County, South Carolina Environmental Quality Lab Burroughs & Chapin Center for Marine and Wetland Studies Coastal Carolina University February
Targeting Best Management in Contrasting Watersheds
 Targeting Best Management in Contrasting Watersheds Andrew Sharpley, Tommy Daniel, Sheri Herron & Bil Gburek University or Arkansas, BMP s Inc. & USDA-ARS ARS Today s s P Cycle is Fragmented Grain P Manure
MARK CREEK DEMONSTRATION PROJECT
 MARK CREEK DEMONSTRATION PROJECT OCC Tasks 20 and 21 FY 1990 319(h) Task 210 EPA Grant # C9-006704-90-0 Submitted by: Oklahoma Conservation Commission Water Quality Division 413 NW 12 th Oklahoma City,
Elimination of the CRP? Economic Consequences
 Elimination of the CRP? Economic Consequences Daryll E. Ray, Presenter Daniel De La Torre Ugarte and Chad Hellwinckel, Authors University of Tennessee Agricultural Policy Analysis Center National Press
Jordan River TMDL Update
 Jordan River TMDL Update 2010 Watershed Symposium August 4 th, 2010 Hilary N. Arens Utah Division of Water Quality Jordan River TMDL Outline What is a TMDL and what is the Jordan impaired for? Evaluation
Division of Watershed Stewardship Drainage Program
 Not Your Father s Tax Ditch Enhancing Delaware s Drainage Network Through the Use of Natural Channel Design Techniques Division of Watershed Stewardship Drainage Program Presented at the National Conference
METHODS OF IRRIGATION BY NAVANITA CHOUDHURY ASSISTANT PROFESSOR RSET
 METHODS OF IRRIGATION BY NAVANITA CHOUDHURY ASSISTANT PROFESSOR RSET CLASSIFICATION OF IRRIGATION METHOD A.Surface Irrigation: Water moves over and across the land by simple gravity flow in order to wet
Long Prairie River Watershed Restoration and Protection Strategies (WRAPS) Report Summary
 Report Summary") Long Prairie River Watershed Restoration and Protection Strategies (WRAPS) Report Summary Minnesota has adopted a watershed approach to address the state s 80 major watersheds (denoted by 8-digit hydrologic
Long Prairie River Watershed Restoration and Protection Strategies (WRAPS) Report Summary Minnesota has adopted a watershed approach to address the state s 80 major watersheds (denoted by 8-digit hydrologic
New Practices for Nutrient Reduction: STRIPs and Saturated Buffers. Matthew Helmers and Tom Isenhart Iowa State University
 New Practices for Nutrient Reduction: STRIPs and Saturated Buffers Matthew Helmers and Tom Isenhart Iowa State University Situation Increasing concern for local and regional waters Substantial demand for
OVERVIEW AND VERIFICATION. Trends in Arkansas Rice Production
 OVERVIEW AND VERIFICATION Trends in Arkansas Rice Production C.E. Wilson, Jr. and S.K. Runsick ABSTRACT Arkansas is the leading rice-producing state in the U.S., representing 49.5% of the total U.S. production
The Relationship between the Properties and Features of Wetland Soils and the Adjacent Uplands
 The Relationship between the Properties and Features of Wetland Soils and the Adjacent Uplands By USDA Natural Resources Conservation Service Connecticut Staff Wetlands and watercourses are features of
Chapter 1 Welcome & Introduction
 Chapter 1 Welcome & Introduction Welcome to Missouri Stream Team! This program is made possible by a strong partnership between the citizens of Missouri and the following organizations: Beginning in 1989,
Best practices to minimize runoff pollution
 Best practices to minimize runoff pollution Prof. Dr. Emilio J. González-Sánchez University of Cordoba, Spain emilio.gonzalez@uco.es www.uco.es/cemtro Surface runoff occurs when there is more water than
L-THIA Online and LID in a watershed investigation
 L-THIA Online and LID in a watershed investigation Larry Theller Agricultural and Biological Engineering, Purdue University Great Lakes Sedimentation Workshop Ann Arbor Mi. L-THIA On-line watershed delineation
Sediment and nutrient generation rates for Queensland rural catchments an event monitoring program to improve water quality modelling
 Sediment and nutrient generation rates for Queensland rural catchments an event monitoring program to improve water quality modelling Dave Waters¹ and Robert Packett² 1 Queensland Department of Natural
Presented by Jane Clary, CPESC Wright Water Engineers, Inc. For Mountain States Chapter, IECA Dec. 2011
 Presented by Jane Clary, CPESC Wright Water Engineers, Inc. For Mountain States Chapter, IECA Dec. 2011 Brief Background on Proposed CO Nutrient Criteria November 21, 2011 Water Quality Control Division
How to control muddy floods from cultivated catchments?
 How to control muddy floods from cultivated catchments? Lessons from the Melsterbeek catchment in Flanders (Belgium) Karel Vandaele, Jo Lammens, Peter Priemen & Olivier Evrard* Samenwerking Land & Water
D EROSION AND SEDIMENT CONTROL. Table of Contents
 Table of Contents D1. GENERAL... 1 D2. OBJECTIVE... 1 D3. REFERENCE MATERIAL... 1 D4. REGULATORY REQUIREMENTS... 1 D5. EROSION AND SEDIMENT CONTROL (ESC) PLANS... 2 D5.1 Goals and Objectives:... 2 D5.2
Wetland Losses and Human Impacts
 Wetland Losses and Human Impacts Matthew J. Gray University of Tennessee Distribution of North American Wetlands Peatlands of Alaska and Canada Hudson and James Bay Wetlands Prairie Potholes Great Lakes
OVERVIEW AND VERIFICATION. Trends In Arkansas Rice Production
 OVERVIEW AND VERIFICATION Trends In Arkansas Rice Production C.E. Wilson, Jr., S.K. Runsick, and R. Mazzanti ABSTRACT Arkansas is the leading rice-producing state in the U.S., representing 45.1% of the
2010 Growing Season - Cowley County, Kansas Land Cover Summary
 2010 Growing Season - Cowley County, Kansas Land Cover Summary Number of Fields Percent of Total Fields Total Acres Percent of Acres ALFALFA 3 0.7% 68.5 0.2% CORN 35 8.4% 2,494.7 8.9% CRP - - - - FALLOW
Components of reports Terrestrial habitat reports
 Section 4. Terrestrial Habitats Terrestrial Habitats Components of reports... 1189 Definition Ranking Key factors Indicators of condition Conservation actions Monitoring Terrestrial habitat reports...
Dry Swale Wet Swale Grass Channel Dry Well Permeable Pavement Bioretention DESIGN ELEMENTS
 FACILITY ID: DATE: / / ASSESSED BY: NAME: ADDRESS: PHOTO IDS: SECTION 1- BACKGROUND INFORMATION (GIS) BMP TYPE : Dry Detention Pond Extended Detention Pond Wet Pond Filter (specify: ) Infiltration (specify:
4. Ponds and infiltration BMPs can achieve 60 to 100% removal efficiencies for sediment.
 Landscape BMPs For the purposes of this project, preventive measures have been categorized into two categories: landscape BMPs and source prevention BMPs. Landscape BMPs includes both vegetative practices
Model Results Operation and Maintenance (O& M) Results Cost-Benefit Analysis Results Conclusions
 Results Cost-Benefit Analysis Results Conclusions") BMP Performance and Outline Background Model Results Operation and Maintenance (O& M) Results Results Conclusions Melissa Baker, Water Resource Technician Capitol Region Watershed District, St. Paul, MN
BMP Performance and Outline Background Model Results Operation and Maintenance (O& M) Results Results Conclusions Melissa Baker, Water Resource Technician Capitol Region Watershed District, St. Paul, MN
FINAL REPORT L Anguille River Water Quality Project Cross County Conservation District
 FINAL REPORT L Anguille River Water Quality Project Cross County Conservation District SUMMARY Agricultural Producers, land users and landowners in the L Anguille River Watershed are committed to flood
Prioritizing Water-Quality Improvement Efforts on Agricultural Lands Using LiDAR Elevation Data
 Prioritizing Water-Quality Improvement Efforts on Agricultural Lands Using LiDAR Elevation Data Aaron Ruesch and Theresa Nelson Wisconsin Department of Natural Resources WLWCA March 11, 2014 Outline WLWCA
The Impact of Organisms on Soil Erosion
 The Impact of Organisms on Soil Erosion Erosion is the movement of soil particles from one location to another. Organisms may play a huge role in the destruction of landforms through erosion. How do animals
Pollutants in our Waters
 Pollutants in our Waters CARIWIN Advanced Course in IWRM September 17, 2007 Apurva Gollamudi Brace Centre for Water Resources Management McGill University It isn t the pollution that s harming the environment.
Strategies for Phosphorus Management on Cropland. Renee Hancock, NE NRCS State Water Quality Specialist
 Strategies for Phosphorus Management on Cropland Renee Hancock, NE NRCS State Water Quality Specialist Phosphorus Essential nutrient for growth of crops. Often needs to be applied to land for optimal crop
F-1. Performance Standards for the NEST Program
 Part F: NEST Program This part of the manual explains the requirements for review and approval of stormwater control measures not otherwise described in these rules under the Division s New Stormwater
Wisconsin Wastewater Operators Association. Protecting Our Water Resources: The Future Bill Hafs - NEW Water 10/2014
 Wisconsin Wastewater Operators Association Protecting Our Water Resources: The Future Bill Hafs - NEW Water 10/2014 The Fox River Contributes 1/3 of All Nutrients to Lake Michigan APRIL 15, 2011 Photo
Surface Water Management
 Surface Water Management Figure 7: Examples of Nonpoint Source Pollution The water quality leaving the metropolitan area is as good as the water quality entering the metropolitan area, and in compliance
STORMWATER MANAGEMENT PLAN CONTENTS CHECKLIST Stormwater Management Plan Contents. SWMP Page # or Reference Location Yes/No
 STORMWATER MANAGEMENT PLAN CONTENTS CHECKLIST Stormwater Management Plan Contents Site Description A description of construction activity. The proposed sequence for major activities. Estimates of the total
What Does It All Mean? CWA? Sara Esposito, P.E. DNREC Division of Watershed Stewardship
 What Does It All Mean? CWA? Sara Esposito, P.E. DNREC Division of Watershed Stewardship sara.esposito@state.de.us Why are we here? Just like pavement has helped move cars faster; it has also helped water
Rainfall, runoff and sediment transport in the Napa River watershed: now and a possible future
 Rainfall, runoff and sediment transport in the Napa River watershed: now and a possible future Lester McKee San Francisco Estuary Institute 5/24/2017 1 The importance of the natural water cycle of infiltration
Beneficial Management Practices to Reduce the Risk of Surface Water Contamination from Manured Agricultural Fields in South Coastal British Columbia
 Beneficial Management Practices to Reduce the Risk of Surface Water Contamination from Manured Agricultural Fields in South Coastal British Columbia Laurens J.P. van Vliet Agriculture and Agri-Food Canada
Module 3.2 Pollution Prevention
 Module 3.2 Pollution Prevention Prevention of Water Pollution from Nonpoint Sources A nonpoint source is a location without an identifiable point of discharge to a water body Important nonpoint sources
BMP Performance under a Changing Climate Evaluating Resilience
 BMP Performance under a Changing Climate Evaluating Resilience Monitoring and Assessing Impacts of Changes in Weather Patterns and Extreme Events on BMP Siting and Design Annapolis, MD September 7, 2017
STATE OF MINNESOTA MINNESOTA POLLUTION CONTROL AGENCY FINDINGS OF FACT. St. Francis Wastewater Treatment Facility Project Description
 p-ear2-78b STATE OF MINNESOTA MINNESOTA POLLUTION CONTROL AGENCY IN THE MATTER OF THE DECISION ON THE NEED FOR AN ENVIRONMENTAL IMPACT STATEMENT FOR THE PROPOSED ST. FRANCIS WASTEWATER TREATMENT FACILITY
2014 ANNUAL REPORT: ASSESSING THE IMPACT OF THE MRBI PROGRAM IN THE POINT REMOVE AND L ANGUILLE WATERSHEDS
 2014 ANNUAL REPORT: ASSESSING THE IMPACT OF THE MRBI PROGRAM IN THE POINT REMOVE AND L ANGUILLE WATERSHEDS 2014 ANNUAL REPORT ASSESSING THE IMPACT OF THE MRBI PROGRAM IN THE POINT REMOVE AND L ANGUILLE
Authors: Anna Lantin, RBF Consulting, Irvine, CA David Alderete Caltrans/CSUS Storm Water Program
 California State University, Sacramento (CSUS) University of California, Davis (UCD) California Department of Transportation (Caltrans) Effectiveness of Existing Highway Vegetation As Biofiltration Strips
BIOPOD TM BIOFILTER WITH STORMMIX BIOFILTRATION MEDIA. Inspection and Maintenance Guide
 BIOPOD TM BIOFILTER WITH STORMMIX TM BIOFILTRATION MEDIA Inspection and Maintenance Guide BioPod Biofilter with StormMix Biofiltration Media Description The BioPod Biofilter System (BioPod) is a stormwater
Appendix 12. Pollutant Load Estimates and Reductions
 Appendix 12. Pollutant Load Estimates and Reductions A pollutant loading is a quantifiable amount of pollution that is being delivered to a water body. Pollutant load reductions can be calculated based
BIOPOD TM BIOFILTER. with StormMix Biofiltration Media. Inspection and Maintenance Guide
 BIOPOD TM BIOFILTER with StormMix Biofiltration Media Inspection and Maintenance Guide BioPod Biofilter with StormMix Biofiltration Media Description The BioPod Biofilter System (BioPod) is a stormwater
Water Quality-Quantity Issues in Mid-South Rice Production
 Water Quality-Quantity Issues in Mid-South Rice Production USEPA Region 6 Agricultural Issues Seminar Series 26 May 2009 Joseph H. Massey, Ph.D. Associate Professor Department of Plant & Soil Sciences
Aquaculture Effluents and the Environment. CS Tucker, Mississippi State University
 Aquaculture Effluents and the Environment CS Tucker, Mississippi State University Characteristics of catfish pond effluents Impacts of catfish pond effluents Ways to reduce impacts of effluents What is
USDA and other Government Agency efforts to Enhance Soil and Water Conservation
 USDA and other Government Agency efforts to Enhance Soil and Water Conservation USDA-NRCS The Natural Resource Conservation Service (NRCS) was originally the Soil Conservation Service (SCS) SCS Created
Nutrient Management in. A presentation to the West Metro Water Alliance
 Nutrient Management in Developing and Agricultural Areas A presentation to the West Metro Water Alliance Chris Meehan, P.E. May 25, 2011 Agenda Physical Improvements Planning Improvements How to get it
OPERATING CONTROLLED DRAINAGE AND SUBIRRIGATION SYSTEMS
 OPERATING CONTROLLED DRAINAGE AND SUBIRRIGATION SYSTEMS Prepared by: Robert Evans, Extension Specialist and Wayne Skaggs,William Neal Reynolds Professor Department of Biological and Agricultural Engineering
Precipitation Surface Cover Topography Soil Properties
 Precipitation Surface Cover Topography Soil Properties Intrinsic capacity of rainfall to cause erosion Influenced by Amount, intensity, terminal velocity, drop size and drop size distribution of rain.
Improved Simulation of Soil and. Manure Phosphorus Loss in SWAT
 Improved Simulation of Soil and Manure Phosphorus Loss in SWAT SWAT Conference October, 2015 at Purdue University Amy S. Collick, Pete J. Kleinman, Tamie Veith, Daren Harmel, Mike White, Pete Vadas, USDA-ARS
WATERSHEDS. City Council Workshop August 21, 2018
 WATERSHEDS City Council Workshop August 21, 2018 Watersheds City of Ames was a founding member of the 28E Agreement that established the Squaw Creek Watershed Management Authority in 2012 Reduce Riverine
MODELING SEDIMENT AND PHOSPHORUS YIELDS USING THE HSPF MODEL IN THE DEEP HOLLOW WATERSHED, MISSISSIPPI
 MODELING SEDIMENT AND PHOSPHORUS YIELDS USING THE HSPF MODEL IN THE DEEP HOLLOW WATERSHED, MISSISSIPPI Jairo Diaz-Ramirez, James Martin, William McAnally, and Richard A. Rebich Outline Background Objectives
FOOTPRINT. Mitigation strategies to reduce pesticide inputs into groundand surface water and their effectiveness a state-of-the-art review
 FOOTPRINT Mitigation strategies to reduce pesticide inputs into groundand surface water and their effectiveness a state-of-the-art review S. Reichenberger, M. Bach, A. Skitschak, H.-G. Frede Institute
Wildlife and Agricultural Ecosystems
 Wildlife and Agricultural Ecosystems The changing agricultural landscape Green Revolution resulted in substantial changes in agriculture Yields have increased 2% per acre each year since 1948 Corn: 38.5
NREM 407/507 WATERSHED MANAGEMENT
 NREM 407/507 WATERSHED MANAGEMENT Please pick up Syllabus, Reading Material & Today s Lab on the Table in the Front Dick Schultz Instructor Sara Berges Teaching Assistant January 13, 2009 1. Conduct Get
Water Use Reporting for Agricultural Irrigation Use in Arkansas Nonpoint Source Pollution Stakeholder Meeting September 27-28, 2017
 Water Use Reporting for Agricultural Irrigation Use in Arkansas 2017 Nonpoint Source Pollution Stakeholder Meeting September 27-28, 2017 Update of Arkansas Water Plan Data from Water Use Database (WUDB)
Using MARORA to Assess Economic and Environmental Impacts of On-Farm Reservoirs
 Using MARORA to Assess Economic and Environmental Impacts of On-Farm Reservoirs J.Popp, E. Wailes, K. Young and J. Smartt Department of Agricultural Economics and Agribusiness University of Arkansas SERA
BIOLOGICAL TREATMENT of RUNOFF. Sarah A. White, Ph.D. 27 July 2017
 BIOLOGICAL TREATMENT of RUNOFF Sarah A. White, Ph.D. 27 July 2017 Water challenges & concerns Irrigation timing? Plant diseases? Cultural practices? How much have I lost? $ and opportunity cost Biological
Subwatershed Prioritization of the Lake Wister Watershed Using Baseflow Water Quality Monitoring Data
 Subwatershed Prioritization of the Lake Wister Watershed Using Baseflow Water Quality Monitoring Data Bradley J. Austin, Brina Smith, and Brian E. Haggard Eutrophication Process by which excess nutrients
Nutrient Reduction Strategy and Best Management Practices
 Nutrient Strategy and Best Management Practices Matthew Helmers Dean s Professor, College of Ag. & Life Sciences Professor, Dept. of Ag. and Biosystems Eng. Iowa State University Situation Increasing concern
Phosphorus Goal Setting Process Questions and Answers 2010
 Lake Winnipesaukee Watershed Management Plan Phase I: Meredith, Paugus, Saunders Bays 1. What is phosphorus? Phosphorus (P) is a naturally occurring element and a major nutrient required for biological
TMDLS FOR TURBIDITY AND FECAL COLIFORMS FOR L'ANGUILLE RIVER, AR
 TMDLS FOR TURBIDITY AND FECAL COLIFORMS FOR L'ANGUILLE RIVER, AR October 2001 TMDLS FOR TURBIDITYAND FECAL COLIFORMS FOR L'ANGUILLE RIVER, AR Prepared for EPA Region VI Watershed Management Section Dallas,
The hydrological effects of wildfire. David Scott The University of British Columbia, Kelowna, BC
 The hydrological effects of wildfire David Scott The University of British Columbia, Kelowna, BC Effects of fire on hydrology Scientific literature is full of contrasting reports Fires: little effect or
MILK RIVER WATERSHED WATER MONITORING REPORT 2017
 MILK RIVER WATERSHED WATER MONITORING REPORT 2017 Prepared for: Milk River Watershed Council Canada Prepared by: Palliser Environmental Services Ltd. March 2018 Acknowledgements Thank you to Cardston County,
Construction Site Inspections
 Construction Site Inspections Keep The Mud Out of The Creek Barry Tonning, Tetra Tech Inspections help to identify and correct problems! Inspection requirements Must inspect site every 14 days (LA) Some
Appendix D Index. SWM/BMP Facility Site Photographs. Subshed 440 Facility Photo #
 Index Subshed 440 Facility Photo # 19 1-3 489 4-7 Subshed 444 Facility Photo # 63 8-9 207 No photo 208 No photo 632 10-12 Subshed 448 Facility Photo # 28 13-16 481 17-20 5147 21-23 5255 24-25 5355 No photo
Leary s Brook at Prince Philip Drive
 Real-Time Water Quality Report Leary s Brook at Prince Philip Drive Deployment Period January 18, 216 to February 22, 216 Government of Newfoundland & Labrador Department of Environment and Conservation
Section 4. Terrestrial Habitats
 Section 4. Terrestrial Habitats Components of Reports... 1226 Definition ranking Key factors Indicators of condition Conservation actions Monitoring Terrestrial Habitat Reports... 1231 Caves, Mines, Sinkholes,
Lake Wallenpaupack Watershed Assessment Project
 Submitted to: Pennsylvania Growing Greener Grants Center Submitted by: Lake Wallenpaupack Watershed Management District HC 1 Box 15D Paupack, PA 18451 Table of Contents Title Page Executive Summary...
Success Stories for Conservation Districts Using 319 Nonpoint Source Program Funding. Cyd Curtis Erika Larsen
 Success Stories for Conservation Districts Using 319 Nonpoint Source Program Funding Cyd Curtis Erika Larsen What is a Nonpoint Source? Point Sources are defined by the CWA as conveyances that discharge:
2010 Growing Season - Harvey County, Kansas Land Cover Summary
 2010 Growing Season - Harvey County, Kansas Land Cover Summary Number of Fields Percent of Total Fields Total Acres Percent of Acres ALFALFA 12 2.6% 683.4 2.0% CORN 77 16.5% 6,627.5 19.7% CRP 1 0.2% 13.9
ORDINANCE # 854. Stormwater Management / Operation and Maintenance Requirements
 ORDINANCE # 854 Stormwater Management / Operation and Maintenance Requirements Section 1. Purpose and Authority In accordance with the provisions of Chapters 98, 124, 126, 440, 444, and 446h of the General
Watershed Response to Water Storage. 8/1/2012 Paul Wymar Scientist Chippewa River Watershed Project
 Watershed Response to Water Storage 8/1/2012 Paul Wymar Scientist Chippewa River Watershed Project Chippewa River Watershed 1.3 Million Acres Largest tributary watershed in the Minnesota River Basin 7
Black River Watershed Management Plan Plan
 Black River Watershed Management Plan Plan Final Report Part II: Appendices May 2010 This watershed management plan was prepared for the New York State Department of State Division of Coastal Resources
Phosphorus and TSS Trends in Duck Creek, Northeastern Wisconsin
 Phosphorus and TSS Trends in Duck Creek, Northeastern Wisconsin Paul Baumgart Daniel Cibulka Kevin Fermanich Alexis Heim University of Wisconsin Green Bay AWRA March, 2014 Acknowledgement This presentation
Monitoring agricultural subwatersheds containing conservation practices in the Black Hawk Lake watershed
 Agricultural and Biosystems Engineering Monitoring agricultural subwatersheds containing conservation practices in the Black Hawk Lake watershed Leigh Ann Long, M.S. Research Associate lalong@iastate.edu
Land Application and Nutrient Management
 MODULE D Land Application and Nutrient Management Figure 34-13. Relationship between the concentration of dissolved P in subsurface drainage from 30 cm deep lysimeters and the Mehlich-3 extractable soil
Water Resource Management in the Mississippi Delta
 Water Resource Management in the Mississippi Delta Dave Kelly Water Resource Specialist Yazoo Mississippi Delta Joint Water Management District Stoneville, Mississippi Mississippi River Valley Alluvial
Section 3 Current and Future Water Demand
 Understanding the magnitude and location of future water demands, and any potential changes from existing water demands, allows the County to develop recommendations that will meet or manage demands for
Hydrostatistics Principles of Application
 US Army Corps of Engineers Hydrologic Engineering Center Hydrostatistics Principles of Application July 1969 Approved for Public Release. Distribution Unlimited. TP-15 REPORT DOCUMENTATION PAGE Form Approved
Irrigation Impact and Trends in Kansas Agricultural 1
 Irrigation Impact and Trends in Kansas Agricultural 1 D.H. Rogers, G. A. Clark and M. Alam 2 Abstract: Total irrigated acreage in Kansas remains at approximately 3 million acres, which is about 15 percent
Using AnnAGNPS to Evaluate On-Farm Water Storage Systems (OFWS) as a BMP for Nutrient Loading Control in a Small Watershed in East Mississippi
 as a BMP for Nutrient Loading Control in a Small Watershed in East Mississippi") Using AnnAGNPS to Evaluate On-Farm Water Storage Systems (OFWS) as a BMP for Nutrient Loading Control in a Small Watershed in East Mississippi Ritesh Karki Graduate Student, Mississippi State University
Using AnnAGNPS to Evaluate On-Farm Water Storage Systems (OFWS) as a BMP for Nutrient Loading Control in a Small Watershed in East Mississippi Ritesh Karki Graduate Student, Mississippi State University