STEADY GROWTH IN MANUFACTURING SECTOR
|
|
|
- Oswald Wheeler
- 6 years ago
- Views:
Transcription


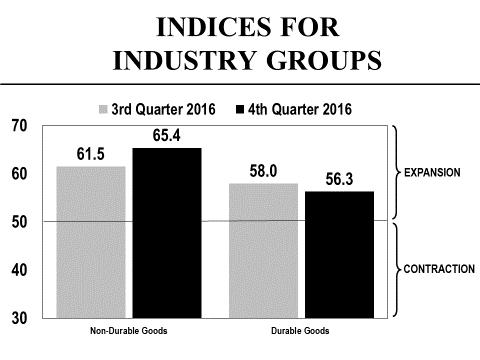
1 A. Gary Anderson Center for Economic Research For Release: Contact: Raymond Sfeir Professor of Economics and Research Fellow (714) STEADY GROWTH IN MANUFACTURING SECTOR ORANGE, CA According to a survey of purchasing managers, the California manufacturing economy is expected to grow at a slightly faster pace in the fourth quarter compared to the third quarter. The California Composite Index, measuring overall manufacturing activity, increased from 59.3 in the third quarter to 59.7 in the fourth quarter, indicating expansion but at a faster pace. This is the third consecutive increase in the growth rate since the first quarter of Production and inventories of purchased materials are expected to grow at a higher growth rate compared to the third quarter, while commodity prices are expected to increase at a lower rate.
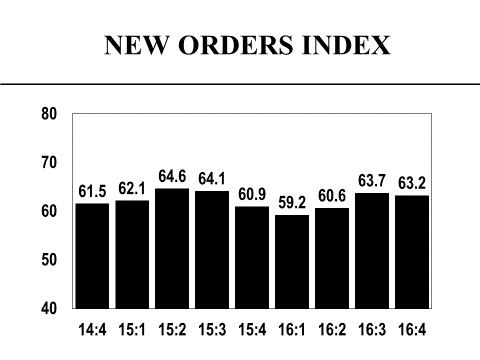
2 California Manufacturing at a Glance Composite Index 59.7 Growing at a higher rate Production 65.8 Growing at a higher rate Inventories of 57.2 Growing at a higher rate purchased materials Commodity prices 56.0 Growing at a slower rate Supplier deliveries 49.2 Slower New orders 63.2 Growing at a slower rate Employment 57.9 Growing at a higher rate Performance by Industry Group The index for the non-durable goods industries registered 65.4 in the fourth quarter compared to 61.5 in the third quarter, indicating a higher growth rate. Production, inventories of purchased materials, new orders and employment are expected to grow at a higher rate. Supplier deliveries are expected to be faster compared to the third quarter. The index for the durable goods industries registered 56.3 in the fourth quarter compared to 58.0 in the third quarter, indicating a lower growth rate. Production, inventories of purchased materials, new orders and employment are expected to grow at a lower rate. Supplier deliveries are expected to be slightly slower compared to the third quarter. Comments by the Purchasing Managers We are coming into the new crop year for rice. California will have one of the largest crops in decades. So the price of rice will be flat to lower than last year. (Food) Even though our sales volume is expected to be the same, we plan on transitioning temporary employees (approx. 4) who have been trained in the needed skills to direct employees to stabilize the work force, and protect the company s investment in its people. (Textile Mills) We have purchased all the inventory we need to ensure that we are able to meet the expectations of our peak season for Christmas purchases and see a very successful It looks like the economy is turning around. (Apparel) Business is very flat. Lowering inventories due to flat to weak demand. (Paper) The resin cartel is starting to reassert its control over the market and are increasing prices in the USA faster than those in Asia despite the lower costs here. Finding qualified employees is becoming a difficulty and is affecting production. (Paper) Business is changing. Less retail, more internet sales. (Wood Products) Q4 is our busy season and production levels will double or triple during Q4. We are in the healthcare open enrollment printing business. (Printing & Related Support Activities) We continue to run at near capacity. Started building new production facility in CA and purchased a large idled plant in VA in order to increase available capacity. (Chemicals) 2
3 The industry is experiencing tightness in High Density Polyethylene. This is keeping commodity prices high in the near term. Looking forward several capacity projects are coming on line. These capacity increases should help to moderate pricing next year. (Plastics & Rubber Products) Our import costs may rise with the problems experienced by Hanjin shipping. (Nonmetallic Mineral Products) Having a difficult time getting employees that remain past a few days even those who say they have to have a job support the family. Our rate is 1 out of 10. (Primary Metals) Though the oil industry continues to be depressed, we expect business to increase slightly in the 4th quarter, simply because oil companies need to maintain their budgetary obligations. Steel prices have dropped a bit, distributors are cutting price to move stock. (Fabricated Metal Products) We see less orders coming in for our products this coming 4Q16 as compared to 4Q15. This is usually due to the presidential election's uncertainty. Customers usually hold back on spending until the election is over. 1Q17 will look better as our customers feel better about the economy. (Machinery) Aggressive competition from Chinese manufacturers is causing an erosion of sales, which will impact everything from manufacturing to sales to service. (Computer & Electronic Products) Because of the upcoming election, most businesses are holding back on any growth plans, especially in military spending. Hopefully this will improve starting at the end of the year. (Electrical Equipment, Appliance & Components) We rely predominantly on the steel market; as we are a service-body & platform up-fitter for mediumduty chassis. It's becoming clearer that the cost of hard-goods are on a downward trend. (Transportation Equipment) Some of the sequestered US Government projects are starting to rebid and place orders. Many corporate projects are still sitting on the sidelines, presidential election Jitters, don't know? (Furniture & Related Products) Commercial Aerospace: Due to manufacturing issues with Pratt & Whitney Engines, next quarter Nacelle deliveries will decrease until issues are resolved. Military Aerospace: Flight surfaces for F-15 will remain stable for next quarter. Future is based on Boeing receiving additional order from Qatar. (Aerospace Products & Parts) 3
4 4
5 Background and methodology The Institute for Supply Management (ISM) conducts a monthly national survey of purchasing managers and publishes the survey results in its Report on Business. Such a survey is not available for the state of California. Given the size of our state, and the major role its manufacturing sector plays in the national economy, the A. Gary Anderson Center for Economic Research at Chapman University launched a quarterly survey of California purchasing managers starting in the third quarter of Similar to the ISM survey, our survey tracks changes in production, employment, new orders, inventories of purchased materials, commodity prices and supplier deliveries. Except for commodity prices and inventories of purchased materials, a seasonally adjusted index is computed for each variable. In order to have one single indicator for the performance of the state manufacturing sector, the Anderson Center has developed a Composite Index that is a weighted average of the underlying indices. A value of 50 for the Composite Index shows a general expansion of the manufacturing economy of the state and a value below 50 shows a decline. The industries are classified according to the North American Industry Classification System (NAICS). 5
6 Detailed Results of the Survey of California Purchasing Managers Expectations for the Fourth Quarter of 2016 In its attempt to present you with a better delivery of the survey results, the A. Gary Anderson Center for Economic Research has calculated an index for every variable in the survey. The "% Better," is added to half of the "% Same," after which a seasonal factor is used to get a seasonally adjusted index for each variable (except commodity prices). A value over 50 for an index indicates growth and a value below 50 indicates a decline. If for example the index increases from 55 to 59, we say that the growth rate is higher than the previous quarter because 59 is bigger than 55. If the index remains at 55, we say that the growth rate remains the same as the previous quarter. If the index decreases from 55 to 52, we say that we still have growth but that the growth rate is lower than the previous quarter because 52 is smaller than 55. Each industry in the manufacturing sector is represented in the survey based on its employment share of total manufacturing employment in the state. Production: The seasonally adjusted index for production is expected to increase from 64.7 in the third quarter to 65.8 in the fourth quarter, indicating that production is expected to increase at a higher rate in the fourth quarter. This is the thirtieth consecutive quarter that the production index has been above 50. Production is expected to increase most rapidly in the following industries: Food; Textile Mill Products; Apparel; Paper; Printing & Related Support Activities; Chemicals; Primary Metals; Fabricated Metal Products; Computer & Electronic Products; Transportation Equipment; Furniture & Related Products; and Miscellaneous. The Wood Products industry reported an expected decrease in production. Production % Higher % Same % Lower Net Seasonally Adjusted Index 4 th Quarter of rd Quarter of nd Quarter of st Quarter of Inventories of Purchased Materials: The seasonally adjusted index for inventories of purchased materials is expected to increase from 54.3 in the third quarter to 57.2 in the fourth quarter, indicating that inventories are expected to increase at a higher rate in the fourth quarter. Inventories of purchased materials are expected to increase most rapidly in the following industries: Food; Textile Mill Products; Apparel; Printing & Related Support Activities; Chemicals; Primary Metals; Fabricated Metal Products; and Furniture & Related Products. Inventories of purchased materials are expected to decrease most rapidly in the following industries: Wood Products; Nonmetallic Mineral Products; and Miscellaneous. Inventories of Purchased Materials % Higher % Same % Lower Net Seasonally Adjusted Index 4 th Quarter of rd Quarter of nd Quarter of st Quarter of
7 Commodity Prices: The seasonally unadjusted index for commodity prices is expected to decrease from 58.1 in the third quarter to 56.0 in the fourth quarter, indicating that commodity prices are expected to rise at a lower rate in the fourth quarter. Commodity prices are expected to increase most rapidly in the following industries: Textile Mill Products; Apparel; Paper; Printing & Related Support Activities; Nonmetallic Mineral Products; Fabricated Metal Products; Machinery; Computer & Electronic Products; Transportation Equipment; Furniture & Related Products; and Miscellaneous. Commodity prices are expected to decrease most rapidly in the following industries: Food; and Wood Products. Commodity Prices % Higher % Same % Lower Net Index 4 th Quarter of rd Quarter of nd Quarter of st Quarter of Supplier Deliveries: For this variable, an index value over 50 indicates slower deliveries, and an index value under 50 indicates faster deliveries. The seasonally adjusted index for supplier deliveries is expected to increase from 47.6 in the third quarter to 49.2 in the fourth quarter, indicating that supplier deliveries are expected to continue to be faster in the fourth quarter. Supplier deliveries are expected to be slowest in the following industries: Printing & Related Support Activities; and Primary Metals. Supplier deliveries are expected to be fastest in the following industries: Food; and Plastics & Rubber Products. Supplier Deliveries % Slower % Same % Faster Net Seasonally Adjusted Index 4 th Quarter of rd Quarter of nd Quarter of st Quarter of New Orders: The seasonally adjusted index for new orders is expected to decrease from 63.7 in the third quarter to 63.2 in the fourth quarter, indicating that new orders are expected to increase at a slower rate in the fourth quarter. New orders are expected to increase most rapidly in the following industries: Food; Textile Mill Products; Paper; Printing & Related Support Activities; Petroleum & Coal Products; Chemicals; Primary Metals; Fabricated Metal Products; Machinery; Computer & Electronic Products; and Miscellaneous. New orders are expected to decrease most rapidly in the following industries: Wood Products; and Transportation Equipment. New Orders % Higher % Same % Lower Net Seasonally Adjusted Index 4 th Quarter of rd Quarter of nd Quarter of st Quarter of
8 Employment: The seasonally adjusted index for employment is expected to increase from 56.2 in the third quarter to 57.9 in the fourth quarter, indicating that employment in manufacturing is expected to improve in the fourth quarter. Employment is expected to increase most rapidly in the following industries: Food; Textile Mill Products; Printing & Related Support Activities; Chemicals; Plastics & Rubber Products; Primary Metals; Machinery; Computer & Electronic Products; Transportation Equipment; and Furniture & Related Products. Employment is expected to decrease most rapidly in the following industries: Wood Products; and Machinery. Employment % Higher % Same % Lower Net Seasonally Adjusted Index 4 th Quarter of rd Quarter of nd Quarter of st Quarter of High-Tech Industries: The high-tech industries include the following: Computer & Electronic Products, and Aerospace Products & Parts. The high-tech industries currently employ about 341,800 employees, amounting to 26.2% of total manufacturing employment in the state. The percent of purchasing managers in the Computer & Electronic Products industry reporting higher expected production decreased from 53.4% in the third quarter to 39.4% in the fourth quarter. Additionally the percent of purchasing managers reporting higher expected employment in these industries decreased from 30.4% in the third quarter to 16.1% in the fourth quarter. 8

9 Orange County s Manufacturing Survey The Orange County manufacturing sector s Composite Index increased from 56.5 in the third quarter to 57.0 in the fourth quarter, indicating that the county s manufacturing economy is expected to grow at a higher rate in the fourth quarter. Orange County s index is now below California s for the fifth consecutive quarter. The seasonally adjusted index for production increased from 59.8 in the third quarter to 64.3 in the fourth quarter, indicating that production is expected to grow at a higher rate in the fourth quarter. This is the thirtieth consecutive quarter that the production index has been above 50. The seasonally adjusted index for new orders decreased from 61.4 in the third quarter to 58.5 in the fourth quarter, indicating that new orders are expected to grow at a lower rate in the fourth quarter. Unlike California, the index for inventories of purchased materials decreased from 52.7 in the third quarter to 49.7 in the fourth quarter indicating a very mild decrease in the level of inventories of purchased materials held by firms in the fourth quarter. The index for the non-durable goods industries leaped from 50.1 in the third quarter to 64.0 in the fourth quarter, indicating that the growth rate in these industries is expected to be much higher in the fourth quarter. This jump is fueled by a large expected increase in production and new orders. The index for the durable goods industries on the other hand decreased from 58.8 in the third quarter to 54.4 in the fourth quarter, indicating that the durable goods industries are expected to grow at a lower rate in the fourth quarter. Production, new orders and inventories of purchased materials are all expected to grow at a lower rate in the fourth quarter in the durable goods industries. 9
10 ABOUT THE ANDERSON CENTER FOR ECONOMIC RESEARCH The A. Gary Anderson Center for Economic Research (ACER) was established in 1979 to provide data, facilities and support in order to encourage the faculty and students at Chapman University to engage in economic and business research of high quality, and to disseminate the results of this research to the community. ANNUAL SCHEDULE OF CONFERENCES AND PRESS RELEASES JANUARY FEBRUARY MARCH APRIL MAY JUNE Economic Forecast Conferences for the Inland Empire California Purchasing Managers Survey California Leading Employment Indicator California Consumer Sentiment Survey California Purchasing Managers Survey California Leading Employment Indicator California Consumer Sentiment Survey Economic Forecast Update Conference for the U.S., California and Orange County JULY AUGUST SEPTEMBER OCTOBER NOVEMBER DECEMBER California Purchasing Managers Survey California Leading Employment Indicator California Consumer Sentiment Survey California Purchasing Managers Survey California Leading Employment Indicator Economic Forecast Conference for the U.S., California and Orange County California Consumer Sentiment Survey 10
MANUFACTURING GROWTH REBOUNDS
 A. Gary Anderson Center for Economic Research For Release: Contact: Raymond Sfeir Professor of Economics and Research Fellow (714) 997-6693 MANUFACTURING GROWTH REBOUNDS ORANGE, CA According to a survey
FASTER GROWTH IN MANUFACTURING
 A. Gary Anderson Center for Economic Research For Release: Contact: Raymond Sfeir Professor of Economics and Research Fellow (714) 997-6693 FASTER GROWTH IN MANUFACTURING ORANGE, CA According to a survey
MODEST GROWTH RATE RETREAT IN THE MANUFACTURING SECTOR
 A. Gary Anderson Center for Economic Research For Release: Contact: Raymond Sfeir Professor of Economics and Research Fellow (714) 997-6693 MODEST GROWTH RATE RETREAT IN THE MANUFACTURING SECTOR ORANGE,
MANUFACTURING SECTOR S GROWTH SLOWS
 A. Gary Anderson Center for Economic Research For Release: Contact: Raymond Sfeir Professor of Economics and Research Fellow (714) 997-6693 MANUFACTURING SECTOR S GROWTH SLOWS ORANGE, CA According to a
Chapman University rargyros School of Business and Economics
 Chapman University rargyros School of Business and Economics A. Gary Anderson Center for Economic Research For Release: Contact: Raymond Sfeir Professor of Economics and Research Fellow (714) 997-6693
Chapman University rargyros School of Business and Economics
 Chapman University rargyros School of Business and Economics A. Gary Anderson Center for Economic Research For Release: Contact: Raymond Sfeir Professor of Economics and Research Fellow (714) 997-6693
MANUFACTURING SECTOR CHURNS ALONG
 A. Gary Anderson Center for Economic Research For Release: Contact: Raymond Sfeir Professor of Economics and Research Fellow (714) 997-6693 MANUFACTURING SECTOR CHURNS ALONG ORANGE, CA According to a survey
March 2014 Manufacturing ISM Report On Business
 FOR RELEASE: April 1, 2014 Contact: Kristina Cahill Report On Business Analyst ISM, ROB Media Relations Tempe, Arizona 800/888-6276, Ext. 3015 E-mail: kcahill@ism.ws March 2014 Manufacturing ISM Report
April 2015 Manufacturing ISM Report On Business
 FOR RELEASE: May 1, 2015 Contact: Kristina Cahill Report On Business Analyst ISM, ROB/Research Tempe, Arizona 800/888-6276, Ext. 3015 E-mail: kcahill@instituteforsupplymanagement.org April 2015 Manufacturing
FEDERAL RESERVE statistical release
 FEDERAL RESERVE statistical release G.17 (419) For release at 9:15 a.m. (EST) January 18, 2019 INDUSTRIAL PRODUCTION AND CAPACITY UTILIZATION Industrial production increased 0.3 percent in December after
FEDERAL RESERVE statistical release
 FEDERAL RESERVE statistical release G.17 (419) For release at 9:15 a.m. (EDT) August 17, 2017 INDUSTRIAL PRODUCTION AND CAPACITY UTILIZATION Industrial production rose 0.2 percent in July following an
March 2015 Manufacturing ISM Report On Business
 FOR RELEASE: April 1, 2015 Contact: Kristina Cahill Report On Business Analyst ISM, ROB/Research Tempe, Arizona 800/888-6276, Ext. 3015 E-mail: kcahill@ism.ws March 2015 Manufacturing ISM Report On Business
Business-Facts Summary - Construction and Manufacturing NAICS Summary
 - Construction and NAICS Summary Title Page Title Page Data Version: 2018 Feb (Internal) Report Generation Method: Single Analysis Area: 1789 STATE ST, SAN DIEGO, CA, 92101-2530 Reporting Detail: As Selected
Economic Recovery: State of Manufacturing
 Economic Recovery: State of The Setup Getting the Euro to Work Chicago, IL July 2, 212 William Strauss Senior Economist and Economic Advisor output peaked in December 27 and fell 2.4% over the following
Assessing Manufacturing: Output and Labor
 Assessing : Output and Labor The Setup Making It In America Matters 212 NABE Industry Conference Cleveland, OH May 31, 212 William Strauss Senior Economist and Economic Advisor output peaked in December
This table has been produced by. The State & Regional Fiscal Studies Unit, University of Missouri-Columbia
 Table B-39 NAICS Component 1963 1964 1965 1966 1967 1968 1969 1970 1971 All industry total 607,008 650,513 704,697 767,075 811,782 887,569 962,902 1,012,299 1,097,173 Private industries 534,043 572,138
DECEMBER Big Jump in New Orders Drives Accelerated PMI; Business Activity Increase Fastest Since July 2004
 B U S I N E S S DECEMBER HIGH LIGHTS Big Jump in New Orders Drives Accelerated PMI; Business Activity Increase Fastest Since July Route to: Contents See the following pages for complete reports. Manufacturing
This table has been produced by. The State & Regional Fiscal Studies Unit, University of Missouri-Columbia
 Table B-39 NAICS Component *1987 1988 1989 1990 1991 1992 All industry total 6,076,695 6,398,624 6,540,047 6,638,210 6,627,809 6,828,525 Private industries 5,195,468 5,492,391 5,612,260 5,690,087 5,677,736
Central Bank of Nigeria Purchasing Managers Index (PMI) Survey Report
 Survey Report") Central Bank of Nigeria Purchasing Managers Index (PMI) Survey Report Statistics Department June 2017 1.0 Introduction PURCHASING MANAGERS INDEX (PMI) JUNE 2017 REPORT The June 2017 PMI was conducted by
Central Bank of Nigeria Purchasing Managers Index (PMI) Survey Report Statistics Department June 2017 1.0 Introduction PURCHASING MANAGERS INDEX (PMI) JUNE 2017 REPORT The June 2017 PMI was conducted by
Rural Manufacturing at a Glance, 2017 Edition
 United States Department of Agriculture Economic Research Service, Economic Information Bulletin 177, August 17 Rural Manufacturing at a Glance, 17 Edition Overview Despite declining rural manufacturing
PMI at 51.8% New Orders and Production Growing Employment and Inventories Contracting Supplier Deliveries Slower
 FOR RELEASE: 0:00 A.M. ET April, 206 Contact: Kristina Cahill Report On Business Analyst ISM, ROB/Research Manager Tempe, Arizona 800/888-6276, Ext. 305 E-mail: kcahill@instituteforsupplymanagement.org
HIGH LIGHTS. Non-Manufacturing Expanding at Faster Rate Than Manufacturing; New Orders Expanding in Both Sectors. Manufacturing.
 B U S I N E S S MARCH HIGH LIGHTS Expanding at Faster Rate Than Manufacturing; New Orders Expanding in Both Sectors Route to: Contents See the following pages for complete reports. Manufacturing report......
Highest Ranked Industries Top 10 Manufacturing Industries (3-Digit) in 8 South Carolina Counties
 in 8 South Carolina Counties") Highest Ranked Industries Top 10 Industries (3-Digit) in 8 South Carolina Counties Emsi Q4 Data Set February 2018 Upstate SC Alliance Emsi Q4 Data Set www.economicmodeling.com 1 Parameters Regions Code
Highest Ranked Industries Top 10 Industries (3-Digit) in 8 South Carolina Counties Emsi Q4 Data Set February 2018 Upstate SC Alliance Emsi Q4 Data Set www.economicmodeling.com 1 Parameters Regions Code
Economic Highlights. Consumer Price Index 1. Transportation Freight Trends 2 Rail Shipments 2. Industrial Production 3. Business Inventories 4
 January 20, 2010 Economic Highlights Prices Consumer Price Index 1 Transportation Transportation Freight Trends 2 Rail Shipments 2 Manufacturing Industrial Production 3 Business Inventories 4 Consumer
July 2016 Manufacturing ISM Report On Business
 FOR RELEASE: August 1, 2016 Contact: Kristina Cahill Report On Business Analyst ISM, ROB/Research Manager Tempe, Arizona 800/888-6276, Ext. 3015 E-mail: kcahill@instituteforsupplymanagement.org July 2016
Regional Competitive Industry Analysis
 Regional Competitive Industry Analysis Jackson and Josephine Counties October 2016 Josephine Jackson Michael Meyers, Economist (503) 229-6179 michael.meyers@oregon.gov Jill Cuyler, Research Analyst (503)
HIGH LIGHTS. Prices Continuing to Increase in Both Sectors, but at Slower Rates. Manufacturing. Non-Manufacturing APRIL 2005
 B U S I N E S S APRIL HIGH LIGHTS Prices Continuing to Increase in Both Sectors, but at Slower Rates Route to: Contents See the following pages for complete reports. Manufacturing report...... 2 report...................
MANUFACTURING IN IOWA
 MANUFACTURING IN IOWA NOVEMBER 2011 INSIDE: SECTOR SIZE 2 KEY INDUSTRIES EARNINGS 4 EXPORTS 5 JOB TRENDS 6 GDP TRENDS 7 COUNTY DEPENDENCE 3 8 OVERVIEW Iowa s competitive strengths in manufacturing emerged
Massachusetts Employment Projections Through 2014
 Massachusetts Employment Projections Through 2014 Massachusetts Department of Workforce Development Table of contents Overview 3 Job Growth by Major Industry Sector 6 Impact on workers 18 Impact on Education
Alberta s Manufacturing Industry is Recovering in 2017
 ECONOMIC COMMENTARY Alberta s Manufacturing Industry is Recovering in 2017 Highlights: Alberta s manufacturing industry was in recession in 2015 and 2016 as a result of the dramatic drop in crude oil prices.
Business-Facts Summary Dublin city, CA ( )
") 3 Digit NAICS Top Ten Summary Healthcare and Social Assistance Ambulatory Health Care Retail Trade Professional, Scientific, and Technical Other (except Public Administration) Retail Trade Retail Trade
3 Digit NAICS Top Ten Summary Healthcare and Social Assistance Ambulatory Health Care Retail Trade Professional, Scientific, and Technical Other (except Public Administration) Retail Trade Retail Trade
Industrial Land Analysis Executive Summary
 Industrial Land Analysis Executive Summary In early May, the Office of Economic Development and the Department of Community Planning and Development were jointly asked to examine a number of issues regarding
International Seminar on Early Warning and Business Cycle Indicators. 14 to 16 December 2009 Scheveningen, The Netherlands
 ESA/STAT/AC.202/S4.5 International Seminar on Early Warning and Business Cycle Indicators 14 to 16 December 2009 Scheveningen, The Netherlands Tracking the Mexican business cycle Yuriko Yabuta Mexico 2
Manufacturing recovery slows again in March
 March 2019 Media Contact: Tony Melville, Australian Industry Group. 0419 190 347 Manufacturing recovery slows again in March The Australian Industry Group Australian Performance of Manufacturing Index
September 2016 Manufacturing ISM Report On Business
 FOR RELEASE: October 3, 2016 Contact: Kristina Cahill Report On Business Analyst ISM, ROB/Research Manager Tempe, Arizona 800/888-6276, Ext. 3015 E-mail: kcahill@instituteforsupplymanagement.org September
FOR RELEASE: February 1, 2019
 FOR RELEASE: February 1, 2019 Contact: Kristina Cahill Report On Business Analyst ISM, ROB/Research Manager Tempe, Arizona 480-752-6276, Ext. 3015 E-mail: kcahill@instituteforsupplymanagement.org This
A MAN UFACTURING COMEBACK 1. A Man ufacturing Comeback: Men s and Women s Employment Gains and Losses in March 2012
 A MAN UFACTURING COMEBACK 1 UNEMPLOYMENT A Man ufacturing Comeback: Men s and Women s Employment Gains and Losses in 2011 March 2012 In 2011 manufacturing employment increased for the first time in more
STATE OF HAWAI'I. No. of. Total Average Rep. Units Average Quarterly Quarterly Industry March Employment Wages Wages January February March
 STATE OF HAWAI'I TOTAL, including government 37,439 598,205 6,028,316,620 10,077 596,822 598,744 599,049 TOTAL GOVERNMENT 6 123,628 1,526,182,323 12,345 121,692 123,988 125,205 Federal 1 32,650 483,102,256
STATE OF HAWAI'I. No. of. Total Average Rep. Units Average Quarterly Quarterly Industry September Employment Wages Wages July August September
 STATE OF HAWAI'I TOTAL, including government 37,044 581,957 6,080,565,857 10,448 581,677 578,368 585,826 TOTAL GOVERNMENT 6 118,031 1,532,738,257 12,986 118,907 114,660 120,525 Federal 1 34,864 560,380,978
 http://e-asia.uoregon.edu THE ROLE OF SMALL & MEDIUM-SIZED ENTERPRISES IN EXPORTS TO CHINA: A STATISTICAL PROFILE Results from the 2003 Exporter Data Base International Trade Administration Manufacturing
Stability in Prices PRICES INDUSTRIAL PRICES IN CURRENT EXPANSION. January 1962
 Stability in Prices INDUSTRIAL COMMODITY MARKETS were more competitive in 1961 than in earlier postwar periods of business expansion. Prices of some commodities advanced, but prices of others declined
Central Bank of Nigeria Purchasing Managers Index (PMI) Survey Report
 Survey Report") Central Bank Nigeria Purchasing Managers (PMI) Survey Report Statistics Department September 2017 1.0 Introduction PURCHASING MANAGERS INDEX (PMI) SEPTEMBER 2017 REPORT The September 2017 PMI was conducted
Central Bank Nigeria Purchasing Managers (PMI) Survey Report Statistics Department September 2017 1.0 Introduction PURCHASING MANAGERS INDEX (PMI) SEPTEMBER 2017 REPORT The September 2017 PMI was conducted
Business-Facts Summary - 3 Digit NAICS Summary
 - 3 Digit NAICS Summary Title Page Title Page Data Version: 2018 Feb (Internal) Report Generation Method: Single Analysis Area: 1789 STATE ST, SAN DIEGO, CA, 92101-2530 Reporting Detail: As Selected Include
NATIONAL SUMMARY OF DOMESTIC TRADE RECEIVABLES Copyright 2018 Printed in the United States of America Published each quarter since 1960
 NATIONAL SUMMARY OF DOMESTIC TRADE RECEIVABLES Copyright 2018 Printed in the United States of America Published each quarter since 1960 CREDIT RESEARCH FOUNDATION 1812 Baltimore Blvd. Suite H Westminster
WORLD KLEMS AND ASIA KLEMS
 WORLD KLEMS AND ASIA KLEMS By Dale W. Jorgenson Harvard University First Asia KLEMS Conference Asian Development Bank Institute Tokyo, Japan July 27, 2011 http://economics.harvard.edu/faculty/jorgenson/
Central Bank of Nigeria Purchasing Managers Index (PMI) Survey Report
 Survey Report") Central Bank Nigeria Purchasing Managers (PMI) Survey Report Statistics Department October 2017 1.0 Introduction PURCHASING MANAGERS INDEX (PMI) OCTOBER 2017 REPORT The October 2017 PMI survey was conducted
Central Bank Nigeria Purchasing Managers (PMI) Survey Report Statistics Department October 2017 1.0 Introduction PURCHASING MANAGERS INDEX (PMI) OCTOBER 2017 REPORT The October 2017 PMI survey was conducted
Summary. Figure 1: Changes in Major Items (Year-on-Year Basis) (Establishments with 10 or more employees) Number of employees (-2.
 (Establishments with 10 or more employees) Number of employees (-2.") Summary 1. Trends in establishments with 10 or more employees The number of establishments decreased for the second consecutive year, and the number of employees decreased for the first time in three years.
Summary 1. Trends in establishments with 10 or more employees The number of establishments decreased for the second consecutive year, and the number of employees decreased for the first time in three years.
FOR RELEASE: April 2, 2018
 FOR RELEASE: April 2, 2018 Contact: Kristina Cahill Report On Business Analyst ISM, ROB/Research Manager Tempe, Arizona 480-752-6276, Ext. 3015 E-mail: kcahill@instituteforsupplymanagement.org March 2018
NORTHWEST GEORGIA HIGH DEMAND CAREER INITIATIVE SECTOR PARTNERSHIP
 NORTHWEST GEORGIA HIGH DEMAND CAREER INITIATIVE SECTOR PARTNERSHIP CANDICE MCKIE ENTERPRISE INNOVATION INSTITUTE GEORGIA TECH NOVEMBER 17, 2017 Project Recap HDCI Overview The High Demand Career Initiative
Business-Facts: 3 Digit NAICS Summary 2015
 Business-Facts: 3 Digit NAICS Summary 25 McLean CRD 25 Polygon : MCLEAN, NAICS Code Business Description Establishment Employees Sales (in Millions) Agriculture, Forestry, Fishing and Hunting Crop Production
THE ECONOMIC IMPACT OF INFORMATION TECHNOLOGIES AFTER THE FINANCIAL CRISIS
 THE ECONOMIC IMPACT OF INFORMATION TECHNOLOGIES AFTER THE FINANCIAL CRISIS Dale W. Jorgenson, Harvard University http://economics.harvard.edu/faculty/jorgenson/ Keynote Lecture to the Annual Conference
INDUSTRIAL PRODUCTION INDICES IN AUGUST Figure 1. Industrial Production Indices (2010=100)
") INDUSTRIAL PRODUCTION INDICES IN AUGUST 2013 1 The preliminary data showed that the Industrial Production Index 2, seasonally adjusted 3, has increased by 0.9% in August 2013 as compared to July 2013.
INDUSTRIAL PRODUCTION INDICES IN AUGUST 2013 1 The preliminary data showed that the Industrial Production Index 2, seasonally adjusted 3, has increased by 0.9% in August 2013 as compared to July 2013.
Carbon in US Energy Production
 Carbon in US Energy Production Peter Wilcoxen Departments of Economics and Public Administration The Maxwell School, Syracuse University SURE 2009 November 5, 2009 http://wilcoxen.maxwell.insightworks.com/pages/talks/
Manufacturing sees slow but positive start to 2019
 January 2019 Media Contact: Tony Melville, Australian Industry Group. 0419 190 347 Manufacturing sees slow but positive start to 2019 The Australian Industry Group Australian Performance of Manufacturing
Industrial production indices - global developments
 Industry, trade and services Author: Digna AMIL Statistics in focus 61/8 Industrial production indices - global developments A great deal has been written about the internationalisation of the world economy,
Norbert J. Ore, CPSM, CPM, MA Chair, ISM Manufacturing Report on Business
 The ISM Reports on Business and the U.S. Economy Norbert J. Ore, CPSM, CPM, MA Chair, ISM Manufacturing Report on Business norjore@gmail.com we ll be talking about... The history and development of the
The Bush Record: Jobs -1,634,000 Net Private Sector Jobs Lost In First 3 Years and Eight Months
 Total nonfarm jobs... 131,567 132,388 (821) -0.6% Total private jobs... 109,926 111,560 (1,634) -1.5% Total private production jobs... 89,169 90,716 (1,547) -1.7% Goods-producing... 21,908 24,511 (2,603)
INDUSTRIAL PRODUCTION INDICES IN OCTOBER
 INDUSTRIAL PRODUCTION INDICES IN OCTOBER 2015 1 According to the preliminary data the Industrial Production Index 2, seasonally adjusted 3, increased by 0.1% in October 2015 as compared to September 2015.
Analysis of All Industrial Activities
 The First Quarter of 26 Analysis of All Industrial Activities Summary Contents 1. Industrial activities on a moderate upward trend (1) Outline of all industrial activities (2) Outline of industrial activities
How Are Alberta s Largest Manufacturing Sectors Faring in the Current Recession?
 ECONOMIC COMMENTARY How Are Alberta s Largest Manufacturing Sectors Faring in the Current Recession? Highlights: Alberta s manufacturing sector is currently in recession as a result of the dramatic drop
INDUSTRIAL PRODUCTION INDICES IN JULY Figure 1. Industrial Production Indices (2010 = 100)
") INDUSTRIAL PRODUCTION INDICES IN JULY 2017 1 According to the preliminary data the Industrial Production Index 2, seasonally adjusted 3, increased by 0.2% in July 2017 as compared to June 2017. In July
INDUSTRIAL PRODUCTION INDICES IN JULY 2017 1 According to the preliminary data the Industrial Production Index 2, seasonally adjusted 3, increased by 0.2% in July 2017 as compared to June 2017. In July
2016 Montana Manufacturers Survey
 216 Montana Manufacturers Survey March 217 Prepared by: Paul E. Polzin, Director Emeritus Bureau of Business and Economic Research University of Montana Missoula, Montana 59812 BUREAU OF BUSINESS AND ECONOMIC
Maintenance Study. February 2014
 Maintenance Study February 2014 Introduction and methodology Objective Plant Engineering performed this research to better understand maintenance practices and strategies currently in place in North American
"Check Out Our Web Site:
 AND PAYROLLS "Check Out Our Web Site: www.dllr.state.md.us/lmi/index.htm" MARYLAND DEPARTMENT LABOR, LICENSING AND REGULATION Office of Labor Market Analysis and Information 1100 North Eutaw Street Baltimore,
North Carolina Exports by Quarter (in constant 2Q 2013 dollars)
") P. 1/6 in Billions in Billions 1 North Carolina Trade Report 1, First Half of 2013 Exports from North Carolina play an increasingly important role in the state s economic recovery and job growth. That
P. 1/6 in Billions in Billions 1 North Carolina Trade Report 1, First Half of 2013 Exports from North Carolina play an increasingly important role in the state s economic recovery and job growth. That
11-Years From 2000 to 2011: Despite 30 Million Population Growth, First 11-Yr Job Loss Since 1927-'38
 40% 11-Years From 2000 to 2011: Despite 30 Million Population Growth, First 11-Yr Job Loss Since 1927-'38 % Total US Job Growth/Loss: Eleven Years Ending October Each Year 30% 20% 10% 0% October 2000 to
INDUSTRIAL PRODUCTION INDICES IN OCTOBER
 INDUSTRIAL PRODUCTION INDICES IN OCTOBER 2017 1 According to the preliminary data the Industrial Production Index 2, seasonally adjusted 3, decreased by 0.6% in October 2017 as compared to September 2017.
San Diego Economy Drought-Resistant, With Exceptions KEY FINDINGS
 San Diego Economy Drought-Resistant, With Exceptions KEY FINDINGS On average, non-agricultural private sector businesses in San Diego County annually use 6,887 cubic feet (54,341 gallons) of water for
Business-Facts: 3 Digit NAICS Summary 2015
 Business-Facts: 3 Digit Summary 215 Lake Anne 215 Polygon 1: LAKE ANNE 2, 11 Agriculture, Forestry, Fishing and Hunting 111 Crop Production 112 Animal Production and Aquaculture 113 Forestry and Logging
Results of Mt. Auburn Survey of Merrimack Valley Manufacturers
 Results of Mt. Auburn Survey of Merrimack Valley Manufacturers METHODOLOGY Survey Methodology 622 email addresses were collected through each of the WIBs. This accounted for about one third of total manufacturers
Yolo County Workforce Innovation Board Industry Clusters of Opportunity
 This report was prepared by the Labor Market Information Division (LMID) of the California Development Department to provide the Workforce Innovation Board () a resource for workforce development and planning.
Business-Facts: 3 Digit NAICS Summary 2015
 Business-Facts: 3 Digit NAICS Summary 215 Polygon 1:, Total NAICS Code Business Description Total Establishment Total Employees Sales (in Millions) 11 Agriculture, Forestry, Fishing and Hunting 111 Crop
"Check Out Our Web Site:
 AND PAYROLLS "Check Out Our Web Site: www.dllr.state.md.us/lmi/index.htm" MARYLAND DEPARTMENT LABOR, LICENSING AND REGULATION Office of Labor Market Analysis and Information 1100 North Eutaw Street Baltimore,
PRESS RELEASE. Industrial Production Price Index
 ROMANIA Press Office 16 Libertăţii Avenue, Sector 5, Bucharest Tel/Fax: 318 18 69; Fax: 312 48 75 e-mail: romstat@insse.ro; biroupresa@insse.ro PRESS RELEASE No. 48 of March 4, 2013 Industrial Production
Appendix B. Commodity Flow Profile
 Appendix B 1.0 Introduction The overall goal of the Kansas Department of Transportation (KDOT) Statewide Freight Plan is to develop a set of infrastructure, operational, and institutional recommendations
BUSINESS-FACTS: 2 DIGIT SIC SUMMARY
 Project : South Tulsa BUSINESS-FACTS: 2 DIGIT SUMMARY Prepared For You 1.00 Mile Radius TOT All Industries MAN All Manufacturing ( 20-39) RET All Retailing ( 52-59) 01 Agricultural Production - Crops 02
Manufacturing conditions improve solidly in. December. Commonwealth Bank Manufacturing PMI Purchasing Managers Index TM Report.
 January 2019 Manufacturing conditions improve solidly in December. Key findings Australia s manufacturing sector rounded off 2018 on a solid note, with business conditions improving at a strong pace in
Wholesale Distribution Economic Trends: Headwinds Slow Revenue Growth. in partnership with:
 2016 Wholesale Distribution Economic Trends: Headwinds Slow Revenue Growth from: in partnership with: Total revenues of wholesale distributors in 2015 fell by 4.3 percent to $5.3 trillion, reflecting a
Dennis Leong, Toni Rice, and Kathleen Spencer March 27, 2013
 Dennis Leong, Toni Rice, and Kathleen Spencer March 27, 2013 Northwoods Rail Transit Commission (NRTC) Why study freight rail in northern Wisconsin? Counties in the study area Photo: Wisconsin State Historical
Market Snapshot December 2016
 Market Snapshot December 2016 Of all the UK s recovered material prices metal can prices exhibited the strongest gains, increasing sharply during Q4-2016 with steel can prices up 17% and aluminium can
1 of 7. Table 5.1 Factors affecting industry output and employment, NAICS coverage
 2007 ICS 210000 Mining 211000 Oil and gas extraction Output is used in petroleum refining and by gas utilities industries. Output is expected to drop very slowly from current levels over the next decade,
February 2018 Economic Report
 February 218 Economic Report Table of Contents Economic Overview... 1 Terminology & Methodology.. 2 Business Cycle... 3 US Paper & Paper Products Production Index.... 4 US Pulp, Paper, & Board Mills Production
Kansas Advanced Manufacturing
 2008 Kansas Advanced Manufacturing Center for Economic Development and Business Research W. Frank Barton School of Business Wichita State University August 2008 1 Kansas Advanced Manufacturing Summary
Regional Competitive Industry Analysis
 Regional Competitive Industry Analysis Marion, Polk, and Yamhill Counties June 2017 Yamhill Polk Marion Michael Meyers, Economist (503) 229-6179 michael.meyers@oregon.gov Jill Cuyler, Research Analyst
Florida. Manufacturing Industry Edition. Source: Florida Department of Economic Opportunity, Bureau of Labor Market Statistics
 L a b o r M a r k e t I n d u s t r y P r o f i l e Florida Manufacturing Industry 2017 Edition Source: Florida Department of Economic Opportunity, Bureau of Labor Market Statistics Florida Manufacturing
INDUSTRIAL PRODUCTION INDICES IN JANUARY
 INDUSTRIAL PRODUCTION INDICES IN JANUARY 2018 1 In compliance with Regulation (EC) 1165/98 and amendment Regulation (EC) 1158/2005 since January 2018 the base year for Short-term business statistics has
Business-Facts: 3 Digit NAICS Summary 2015
 Business-Facts: 3 Digit NAICS Summary 215 Polygon 1:, Total NAICS Code Business Description Total Establishment Total Employees Sales (in Millions) 11 Agriculture, Forestry, Fishing and Hunting 111 Crop
INDUSTRIAL PRODUCTION INDICES IN FEBRUARY
 INDUSTRIAL PRODUCTION INDICES IN FEBRUARY 2018 1 In compliance with Regulation (EC) 1165/98 and amendment Regulation (EC) 1158/2005 since January 2018 the base year for Short-term business statistics has
IHS ECONOMICS Southwest Regional Manufacturers Association
 IHS ECONOMICS Southwest Regional Manufacturers Association Manufacturing Sector Profile August 2016 ihs.com PREPARED ESPECIALLY FOR: IHS CONSULTING REPORT Economic Strategy Solutions Brendan O Neil Managing
Workforce Oklahoma Employment Outlook 2010
 Workforce Oklahoma Oklahoma Security Commission Economic Research and Analysis Division Will Rogers Memorial Office Building Labor Market Information Unit, 4 th Floor N P.O. Box 52003 Oklahoma City, OK
ACKNOWLEDGMENTS ABOUT NSPARC
 ACKNOWLEDGMENTS This research was made possible by the Mississippi Development Authority in conjunction with economic development partners including the Electric Power Associations of Mississippi, Entergy
Missouri Ports: Cornerstone of the Sate s Economy
 Missouri Ports: Cornerstone of the Sate s Economy Project Overview and Findings presented to ITTS Conference presented by Cambridge Systematics, Inc. Paula Dowell, Ph.D. May 22, 2018 1 Missouri is Home
U.S. Productivity and Electronic Business Processes in Manufacturing
 IAOS Satellite Meeting on Statistics for the Information Society August 30 and 31, 2001, Tokyo, Japan U.S. Productivity and Electronic Business Processes in Manufacturing B.K. Atrostic John Gates Senior
Industries for PI+ v2.2
 1 Forestry, fishing and hunting 113-115 1 Forestry and Logging; Fishing, hunting and trapping 113, 114 1 Forestry and Logging 113 2 Fishing, hunting and trapping 114 2 Support activities for agriculture
Camden Food Economy Strategy July 2013 Campbell Soup Company
 Camden Food Economy Strategy July 2013 Campbell Soup Company The Reinvestment Fund $1.2 billion in community investments $700 million in capital under management 800 individual & institutional investors
BusinessCounts Methodology 2015A Release June 2015
 Introduction BusinessCounts is a geographic summary database of business establishments and employees for nearly ten million businesses and one hundred and thirty million employees. The database is available
APPLIED GEOGRAPHIC SOLUTIONS
 Version Release 2018 Introduction BusinessCounts is a geographic summary database of business establishments and employees for nearly ten million businesses and one hundred and thirty million employees.
Business-Facts: 2 Digit SIC Summary 2010
 Business-Facts: Digit Summary Radius : 777 RICHMOND HWY, ALEXANDRIA, VA 6-8,. -. Miles, s + TOT All Industries 9 8,86,8. 6 MAN All Manufacturing ( -9).7 RET All Retailing ( -9) 8,9.7 9 ADM Public Administration
Director, Center for Supply Chain Management Marquette University (414)
") J a n u a r y 2014 - F i n a l R e l e a s e Contact: Dr. Douglas Fisher Director, Center for Supply Chain Management Marquette University (414) 288-3995 douglas.fisher@marquette.edu Released: February
J a n u a r y 2014 - F i n a l R e l e a s e Contact: Dr. Douglas Fisher Director, Center for Supply Chain Management Marquette University (414) 288-3995 douglas.fisher@marquette.edu Released: February
FEDERAL RESERVE statistical release '4
 FEDERAL RESERVE statistical release '4 ' c G7 (419) Ror release at 9:15 a.m. (EST) November 30,1995 INDUSTRIAL PRODUCTION AND CAPACITY UTILIZATION (ANNUAL REVISION) The Federal Reserve's index of industrial