MANUFACTURING SECTOR CHURNS ALONG
|
|
|
- Ashlynn Whitehead
- 6 years ago
- Views:
Transcription
 997-6693 MANUFACTURING SECTOR CHURNS ALONG ORANGE, CA According to a survey of purchasing managers, the")


1 A. Gary Anderson Center for Economic Research For Release: Contact: Raymond Sfeir Professor of Economics and Research Fellow (714) MANUFACTURING SECTOR CHURNS ALONG ORANGE, CA According to a survey of purchasing managers, the California manufacturing economy is expected to grow at a slightly lower pace in the third of 2017 compared to the second quarter. The California Composite Index, measuring overall manufacturing activity, decreased from 62.2 in the second quarter to 61.0 in the third quarter, indicating slower expansion. Production, inventories of purchased materials, prices, new orders and employment are expected to grow at a slightly lower growth rate. Supplier deliveries are expected to be slower.
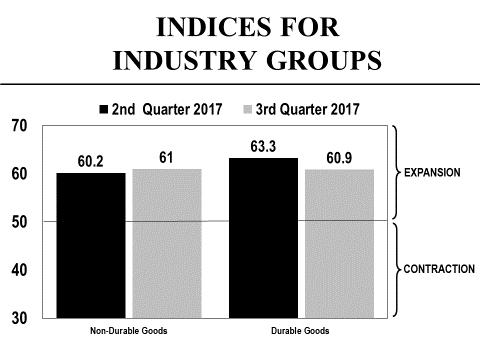
2 California Manufacturing at a Glance Composite Index 61.0 Growing at a lower rate Production 65.5 Growing at a lower rate Inventories of 65.8 Growing at a lower rate purchased materials Commodity prices 69.3 Rising at a lower rate Supplier deliveries 55.3 Slowing at a higher rate New orders 63.5 Growing at a lower rate Employment 61.2 Growing at a lower rate Performance by Industry Group The index for the non-durable goods industries rose from 60.2 in the second quarter to 61.0 in the third quarter, indicating a higher rate of growth in the third quarter of this year. Production, and new orders increased at a higher rate in the third quarter. The employment index was virtually unchanged in the second quarter and commodity prices moderated from 72.3 in the second quarter to 67.3 in the third quarter. The index for the durable goods industries declined from 63.3 in the second quarter to 60.9 in the third quarter, indicating a lower rate of growth in the third quarter. Production, inventories of purchased materials, commodity prices, new orders and employment increased at a lower rate in the third quarter. Supplier deliveries are expected to be slower with an index increasing from 52.1 in the second quarter to 56.7 in the third quarter. Comments by the Purchasing Managers Entering into Q3 this will be historically slow time for our industry (poultry), picking up again in Q4, which is historically the busiest. (Food) Part of our business is seasonal. We make outdoor cushions and pillows. The current season is almost over. We start again with production orders in August. The other part of our business is indoor pillows and cushions which remains strong. The survey reflects the end of the seasonal business. (Textile Mill Products) Apparel business overall is less active than usual, future orders are less than we expected. (Apparel) Summer is the slow season for our business. Prices have increased for corrugated and plastic film. Printing paper remains soft, however. (Paper) Experiencing weak demand coupled with increased prices on raw materials (up to 10% in some cases). Planning for across the board layoffs and increased outsourcing if trend continues through the summer. Suppliers are also continuing to keep inventories low, sometimes making it problematic when those big orders do finally hit. (Printing & Related Support Activities) Oil prices have remained relatively low; therefore disposable plastic pricing has been stable. Consolidation in biotechnology continues and in turn efficiencies have driven cost savings. (Chemicals) 2
3 Customers and prospects are shying away from all those purchases and/or resourcing. (Plastics & Rubber Products) We have found that our suppliers keep running out of product which is resulting in backorders with delayed deliveries... which in turn affects our customers completion of their order (installations). People are more demanding and want their product now and/or order to be completed yesterday. It is not the same mentality as when you were willing to wait 20 to 25 minutes to get a fresh pizza made with care (not throwing it together). We are unsure if suppliers deliveries are late due to influx of business, or if they are not carrying the inventory they used to... we are guessing the first based on some conversations. This is not a good sign for us but it is a good sign for our industry. (Nonmetallic Mineral Products) Finding it more difficult to find new employees for our operation (metal melting & casting). It appears to be a reflection of lower unemployment rates in our area. At the same time, customer demand for our products (aerospace related) remains very strong. (Primary Metals) Our back log is dropping. Sales calls (including cold calls) have increased by 20%. Sales people are telling me that business is very slow. (Fabricated Metal Products) We have just cleaned out low performing staff and at the same time are receiving mid-year price adjustments. We are looking at hiring new staff but are proceeding cautiously as the economic situation has not risen as expected. Department heads are taking good staff from other departments to fill the voids and then those departments are having to go find new staff. Hoping for better results in the second half of the year. (Machinery) Any action by the US Gov't that curtails trade with Mexico, Canada, and the Asian region will negatively impact our business in the USA, with lower sales, reduced profit, and resulting lower employment locally. Company factories located outside the USA will pick up the demand, maintaining global deliveries. (Computer & Electronic Products) Still riding the wave of prosperity. (Transportation Equipment) Definitely seeing more price increases on materials & services and have been forced to raise our prices as well. (Furniture & Related Products) The fourth quarter has been difficult in some aspects of our business. We expect all markets to pickup next quarter. (Aerospace Products and Parts) 3

4 4
5 Background and methodology The Institute for Supply Management (ISM) conducts a monthly national survey of purchasing managers and publishes the survey results in its Report on Business. Such a survey is not available for the state of California. Given the size of our state, and the major role its manufacturing sector plays in the national economy, the A. Gary Anderson Center for Economic Research at Chapman University launched a quarterly survey of California purchasing managers starting in the third quarter of Similar to the ISM survey, our survey tracks changes in production, employment, new orders, inventories of purchased materials, commodity prices and supplier deliveries. Except for commodity prices and inventories of purchased materials, a seasonally adjusted index is computed for each variable. In order to have one single indicator for the performance of the state manufacturing sector, the Anderson Center has developed a Composite Index that is a weighted average of the underlying indices. A value of 50 for the Composite Index shows a general expansion of the manufacturing economy of the state and a value below 50 shows a decline. The industries are classified according to the North American Industry Classification System (NAICS). 5
6 Detailed Results of the Survey of California Purchasing Managers Expectations for the Third Quarter of 2017 In its attempt to present you with a better delivery of the survey results, the A. Gary Anderson Center for Economic Research has calculated an index for every variable in the survey. The "% Better," is added to half of the "% Same," after which a seasonal factor is used to get a seasonally adjusted index for each variable (except commodity prices). A value over 50 for an index indicates growth and a value below 50 indicates a decline. If for example the index increases from 55 to 59, we say that the growth rate is higher than the previous quarter because 59 is bigger than 55. If the index remains at 55, we say that the growth rate remains the same as the previous quarter. If the index decreases from 55 to 52, we say that we still have growth but that the growth rate is lower than the previous quarter because 52 is smaller than 55. Each industry in the manufacturing sector is represented in the survey based on its employment share of total manufacturing employment in the state. Production: The seasonally adjusted index for production is expected to decrease marginally from 65.7 in the second quarter to 65.5 in the third quarter, indicating that production is expected to increase at a marginally lower rate in the third quarter. This is the thirty third consecutive quarter that the production index has been above 50. Production is expected to increase most rapidly in the following industries: Food; Beverage & Tobacco; Apparel; Paper; Chemicals; Plastics & Rubber Products; Wood Products; Nonmetallic Mineral Products; Primary Metals; Fabricated Metal Products; Machinery; Computer & Electronic Products; Electrical Equipment, Appliance & Components; Transportation Equipment; Furniture & Related Products; and Miscellaneous. No industry reported an expected decrease in production. Production % Higher % Same % Lower Net Seasonally Adjusted Index 3 rd Quarter of nd Quarter of st Quarter of th Quarter of Inventories of Purchased Materials: The seasonally adjusted index for inventories of purchased materials is expected to decrease from 61.9 in the second quarter to 55.8 in the third quarter, indicating that inventories are expected to increase at a lower rate in the third quarter. Inventories of purchased materials are expected to increase most rapidly in the following industries: Food; Chemicals; Plastics & Rubber Products; Wood Products; Primary Metals; Fabricated Metal Products; Machinery; Computer & Electronic Products; Electrical Equipment, Appliance & Components; and Miscellaneous. Inventories of purchased materials are expected to decrease most rapidly in the following industries: Textile Mill Products; Printing & Related Support Activities; and Furniture & Related Products. Inventories of Purchased Materials % Higher % Same % Lower Net Seasonally Adjusted Index 3 rd Quarter of nd Quarter of st Quarter of th Quarter of
7 Commodity Prices: The seasonally unadjusted index for commodity prices is expected to decrease from 72.2 in the second quarter to 69.3 in the third quarter, indicating that commodity prices are expected to rise at a lower rate in the third quarter of this year. Commodity prices are expected to increase most rapidly in the following industries: Food; Paper; Printing & Related Support Activities; Chemicals; Plastics & Rubber Products; Wood Products; Nonmetallic Mineral Products; Primary Metals; Fabricated Metal Products; Machinery; Computer & Electronic Products; Electrical Equipment, Appliance & Components; Transportation Equipment; Furniture & Related Products; and Miscellaneous. No industry reported an expected decrease in commodity prices. Commodity Prices % Higher % Same % Lower Net Index 3 rd Quarter of nd Quarter of st Quarter of th Quarter of Supplier Deliveries: For this variable, an index value over 50 indicates slower deliveries, and an index value under 50 indicates faster deliveries. The seasonally adjusted index for supplier deliveries is expected to increase from 53.0 in the second quarter to 55.3 in the third quarter, indicating that supplier deliveries are expected to be slower at a higher rate in the third quarter. Supplier deliveries are expected to be slowest in the following industries: Food; Chemicals; Wood Products; Nonmetallic Mineral Products; Primary Metals; Fabricated Metal Products; Machinery; Computer & Electronic Products; Electrical Equipment, Appliance & Components; Furniture & Related Products; and Miscellaneous. The Apparel industry reported an expectation of faster supplier deliveries. Supplier Deliveries % Slower % Same % Faster Net Seasonally Adjusted Index 3 rd Quarter of nd Quarter of st Quarter of th Quarter of New Orders: The seasonally adjusted index for new orders is expected to decrease from 63.5 in the second quarter to 62.8 in the third quarter, indicating that new orders are expected to increase at a lower rate in the third quarter. New orders are expected to increase most rapidly in the following industries: Food; Beverage & Tobacco; Paper; Chemicals; Plastics & Rubber Products; Wood Products; Nonmetallic Mineral Products; Primary Metals; Fabricated Metal Products; Machinery; Computer & Electronic Products; Electrical Equipment, Appliance & Components; Transportation Equipment; and Miscellaneous. New orders are expected to decrease most rapidly in the following industries: Printing & Related Support Activities; and Furniture & Related Products. New Orders % Higher % Same % Lower Net Seasonally Adjusted Index 3 rd Quarter of nd Quarter of st Quarter of th Quarter of
8 Employment: The seasonally adjusted index for employment is expected to decrease from 61.2 in the second quarter to 58.2 in the third quarter, indicating that employment in manufacturing is expected to increase at a slower rate in the third quarter. Employment is expected to increase most rapidly in the following industries: Food; Paper; Chemicals; Plastics & Rubber Products; Wood Products; Primary Metals; Fabricated Metal Products; Machinery; Computer & Electronic Products; Electrical Equipment, Appliance & Components; Transportation Equipment; and Miscellaneous. The Furniture & Related Products industry reported an expected decrease in employment. Employment % Higher % Same % Lower Net Seasonally Adjusted Index 3 rd Quarter of nd Quarter of st Quarter of th Quarter of High-Tech Industries: The high-tech industries include the following: Computer & Electronic Products, and Aerospace Products & Parts. The high-tech industries currently employ about 346,600 employees, amounting to 27.0% of total manufacturing employment in the state. The percent of purchasing managers in the Computer & Electronic Products industry reporting higher expected production decreased sharply from 42.3% in the second quarter to 32.8% in the third quarter. Additionally the percent of purchasing managers reporting higher expected employment in these industries also decreased markedly from 52.2% in the second quarter to 24.3% in the third quarter. 8

9 Orange County s Manufacturing Survey The Orange County manufacturing sector s Composite Index decreased from 61.7 in the second quarter to 60.2 in the third quarter, indicating that the county s manufacturing economy is expected to grow at a lower rate in the third quarter of this year. The Orange County index is below California s index for the second consecutive quarter. The seasonally adjusted index for production decreased from 66.2 in the second quarter to 65.8 in the third quarter, indicating that production is expected to grow at a lower rate in the third quarter of this year. This is the thirty third consecutive quarter that the production index has been above 50. The seasonally adjusted index for new orders decreased from 61.8 in the second quarter to 61.1 in the third quarter, indicating that new orders are expected to grow at a lower rate in the third quarter. The index for the non-durable goods industries decreased from 61.5 in the second quarter to 57.7 in the third quarter, indicating that the growth rate in these industries is expected to be lower in the third quarter. The index for inventories of purchased materials decreased from 59.9 in the second quarter to 47.6 in the third quarter indicated a markedly lower rate of growth. The index for the durable goods industries decreased from 61.7 in the second quarter to 61.1 in the third quarter, indicating that the durable goods industries are expected to grow at a lower rate in the third quarter. Production and employment are expected to grow at a lower rate. 9
10 ABOUT THE ANDERSON CENTER FOR ECONOMIC RESEARCH The A. Gary Anderson Center for Economic Research (ACER) was established in 1979 to provide data, facilities and support in order to encourage the faculty and students at Chapman University to engage in economic and business research of high quality, and to disseminate the results of this research to the community. ANNUAL SCHEDULE OF CONFERENCES AND PRESS RELEASES JANUARY MARCH APRIL JUNE Economic Forecast Conferences for the Inland Empire California Purchasing Managers Survey California Consumer Sentiment Survey California Purchasing Managers Survey California Consumer Sentiment Survey Economic Forecast Update Conference for the U.S., California and Orange County JULY SEPTEMBER OCTOBER DECEMBER California Purchasing Managers Survey California Consumer Sentiment Survey California Purchasing Managers Survey Economic Forecast Conference for the U.S., California and Orange County California Consumer Sentiment Survey 10
MANUFACTURING GROWTH REBOUNDS
 A. Gary Anderson Center for Economic Research For Release: Contact: Raymond Sfeir Professor of Economics and Research Fellow (714) 997-6693 MANUFACTURING GROWTH REBOUNDS ORANGE, CA According to a survey
STEADY GROWTH IN MANUFACTURING SECTOR
 A. Gary Anderson Center for Economic Research For Release: Contact: Raymond Sfeir Professor of Economics and Research Fellow (714) 997-6693 STEADY GROWTH IN MANUFACTURING SECTOR ORANGE, CA According to
FEDERAL RESERVE statistical release
 FEDERAL RESERVE statistical release G.17 (419) For release at 9:15 a.m. (EDT) August 17, 2017 INDUSTRIAL PRODUCTION AND CAPACITY UTILIZATION Industrial production rose 0.2 percent in July following an
March 2015 Manufacturing ISM Report On Business
 FOR RELEASE: April 1, 2015 Contact: Kristina Cahill Report On Business Analyst ISM, ROB/Research Tempe, Arizona 800/888-6276, Ext. 3015 E-mail: kcahill@ism.ws March 2015 Manufacturing ISM Report On Business
PMI at 51.8% New Orders and Production Growing Employment and Inventories Contracting Supplier Deliveries Slower
 FOR RELEASE: 0:00 A.M. ET April, 206 Contact: Kristina Cahill Report On Business Analyst ISM, ROB/Research Manager Tempe, Arizona 800/888-6276, Ext. 305 E-mail: kcahill@instituteforsupplymanagement.org
A MAN UFACTURING COMEBACK 1. A Man ufacturing Comeback: Men s and Women s Employment Gains and Losses in March 2012
 A MAN UFACTURING COMEBACK 1 UNEMPLOYMENT A Man ufacturing Comeback: Men s and Women s Employment Gains and Losses in 2011 March 2012 In 2011 manufacturing employment increased for the first time in more
HIGH LIGHTS. Non-Manufacturing Expanding at Faster Rate Than Manufacturing; New Orders Expanding in Both Sectors. Manufacturing.
 B U S I N E S S MARCH HIGH LIGHTS Expanding at Faster Rate Than Manufacturing; New Orders Expanding in Both Sectors Route to: Contents See the following pages for complete reports. Manufacturing report......
MANUFACTURING IN IOWA
 MANUFACTURING IN IOWA NOVEMBER 2011 INSIDE: SECTOR SIZE 2 KEY INDUSTRIES EARNINGS 4 EXPORTS 5 JOB TRENDS 6 GDP TRENDS 7 COUNTY DEPENDENCE 3 8 OVERVIEW Iowa s competitive strengths in manufacturing emerged
North Carolina Exports by Quarter (in constant 2Q 2013 dollars)
") P. 1/6 in Billions in Billions 1 North Carolina Trade Report 1, First Half of 2013 Exports from North Carolina play an increasingly important role in the state s economic recovery and job growth. That
P. 1/6 in Billions in Billions 1 North Carolina Trade Report 1, First Half of 2013 Exports from North Carolina play an increasingly important role in the state s economic recovery and job growth. That
Alberta s Manufacturing Industry is Recovering in 2017
 ECONOMIC COMMENTARY Alberta s Manufacturing Industry is Recovering in 2017 Highlights: Alberta s manufacturing industry was in recession in 2015 and 2016 as a result of the dramatic drop in crude oil prices.
INDUSTRIAL PRODUCTION INDICES IN JULY Figure 1. Industrial Production Indices (2010 = 100)
") INDUSTRIAL PRODUCTION INDICES IN JULY 2017 1 According to the preliminary data the Industrial Production Index 2, seasonally adjusted 3, increased by 0.2% in July 2017 as compared to June 2017. In July
INDUSTRIAL PRODUCTION INDICES IN JULY 2017 1 According to the preliminary data the Industrial Production Index 2, seasonally adjusted 3, increased by 0.2% in July 2017 as compared to June 2017. In July
THE ECONOMIC IMPACT OF INFORMATION TECHNOLOGIES AFTER THE FINANCIAL CRISIS
 THE ECONOMIC IMPACT OF INFORMATION TECHNOLOGIES AFTER THE FINANCIAL CRISIS Dale W. Jorgenson, Harvard University http://economics.harvard.edu/faculty/jorgenson/ Keynote Lecture to the Annual Conference
GROWS IN: NEO OVERCOMES a 23% dip to approach pre-recession output EMPLOYMENT IN PRODUCTIVITY WITH 16% GAIN NEO OUTPACES U.S.
 NORTHEAST OHIO MANUFACTURING RECOVERING FROM GREAT RECESSION NEO OVERCOMES a 23% dip to approach pre-recession output NEO manufacturing EMPLOYMENT GROWS IN: Petroleum & Coal Products Beverage & Tobacco
INDUSTRIAL PRODUCTION INDICES IN OCTOBER
 INDUSTRIAL PRODUCTION INDICES IN OCTOBER 2017 1 According to the preliminary data the Industrial Production Index 2, seasonally adjusted 3, decreased by 0.6% in October 2017 as compared to September 2017.
International Seminar on Early Warning and Business Cycle Indicators. 14 to 16 December 2009 Scheveningen, The Netherlands
 ESA/STAT/AC.202/S4.5 International Seminar on Early Warning and Business Cycle Indicators 14 to 16 December 2009 Scheveningen, The Netherlands Tracking the Mexican business cycle Yuriko Yabuta Mexico 2
STATE OF HAWAI'I. No. of. Total Average Rep. Units Average Quarterly Quarterly Industry March Employment Wages Wages January February March
 STATE OF HAWAI'I TOTAL, including government 37,439 598,205 6,028,316,620 10,077 596,822 598,744 599,049 TOTAL GOVERNMENT 6 123,628 1,526,182,323 12,345 121,692 123,988 125,205 Federal 1 32,650 483,102,256
STATE OF HAWAI'I. No. of. Total Average Rep. Units Average Quarterly Quarterly Industry September Employment Wages Wages July August September
 STATE OF HAWAI'I TOTAL, including government 37,044 581,957 6,080,565,857 10,448 581,677 578,368 585,826 TOTAL GOVERNMENT 6 118,031 1,532,738,257 12,986 118,907 114,660 120,525 Federal 1 34,864 560,380,978
2016 Montana Manufacturers Survey
 216 Montana Manufacturers Survey March 217 Prepared by: Paul E. Polzin, Director Emeritus Bureau of Business and Economic Research University of Montana Missoula, Montana 59812 BUREAU OF BUSINESS AND ECONOMIC
11-Years From 2000 to 2011: Despite 30 Million Population Growth, First 11-Yr Job Loss Since 1927-'38
 40% 11-Years From 2000 to 2011: Despite 30 Million Population Growth, First 11-Yr Job Loss Since 1927-'38 % Total US Job Growth/Loss: Eleven Years Ending October Each Year 30% 20% 10% 0% October 2000 to
Industrial Land Analysis Executive Summary
 Industrial Land Analysis Executive Summary In early May, the Office of Economic Development and the Department of Community Planning and Development were jointly asked to examine a number of issues regarding
Regional Competitive Industry Analysis
 Regional Competitive Industry Analysis Marion, Polk, and Yamhill Counties June 2017 Yamhill Polk Marion Michael Meyers, Economist (503) 229-6179 michael.meyers@oregon.gov Jill Cuyler, Research Analyst
Business-Facts: 3 Digit NAICS Summary 2015
 Business-Facts: 3 Digit NAICS Summary 25 McLean CRD 25 Polygon : MCLEAN, NAICS Code Business Description Establishment Employees Sales (in Millions) Agriculture, Forestry, Fishing and Hunting Crop Production
CINCINNATI REPORT ON BUSINESS
 CINCINNATI REPORT ON BUSINESS ISM-CINCINNATI AFFILIATED WITH THE INSTITUTE FOR SUPPLY MANAGEMENT November 211 PRESS RELEASE Important: Do Not Release Until 12:1 a.m. Wednesday, November 3, 211 SUBJECT:
Empire State Manufacturing Survey
 January 218 Empire State Manufacturing Survey Business activity continued to grow at a solid clip in New York State, according to firms responding to the January 218 Empire State Manufacturing Survey.
San Diego Economy Drought-Resistant, With Exceptions KEY FINDINGS
 San Diego Economy Drought-Resistant, With Exceptions KEY FINDINGS On average, non-agricultural private sector businesses in San Diego County annually use 6,887 cubic feet (54,341 gallons) of water for
Winds of Change. MCAA Summary April Macroeconomic Rise for 2018 US Global. Tariffs
 Winds of Change Alex Chausovsky Senior Consulting Advisor MCAA Summary April 218 Macroeconomic Rise for 218 US Global Global Issues Impacting Businesses Tariffs Leading Indicator Signals are Mixed Know
ACKNOWLEDGMENTS ABOUT NSPARC
 ACKNOWLEDGMENTS This research was made possible by the Mississippi Development Authority in conjunction with economic development partners including the Electric Power Associations of Mississippi, Entergy
Appendix A NAICS Codes and Titles
 Appendix A NAICS Codes and Titles The current analysis of the US economy uses a classification system that is based on the 6-digit North American Industry Classification System (NAICS) introduced in year
Florida. Manufacturing Industry Edition. Source: Florida Department of Economic Opportunity, Bureau of Labor Market Statistics
 L a b o r M a r k e t I n d u s t r y P r o f i l e Florida Manufacturing Industry 2017 Edition Source: Florida Department of Economic Opportunity, Bureau of Labor Market Statistics Florida Manufacturing
UN List of Industrial Products
 UN List of Industrial Products United Nations Statistics Division Workshop on Classifications, Montevideo, Uruguay, 14-18 March 2005 25/04/2005 1 History UN list of industrial products was developed in
World Manufacturing Production
 World Manufacturing Production Statistics for Quarter I, 2017 Report on world manufacturing production This report presents the observed growth rates and growth estimates of world manufacturing production
Analysis of Trade Development between China and Association of Southeast Asian Nations
 Journal of Behavioural Economics, Finance, Entrepreneurship, Accounting and Transport, 2013, Vol. 1, No. 1, 15-20 Available online at http://pubs.sciepub.com/jbe/1/1/3 Science and Education Publishing
News Release (For Immediate Release)
") Institute for Supply Management, Greater Grand Rapids, Inc. P. O. Box 230621 Grand Rapids, MI 49523-0321 News Release (For Immediate Release) June 6, 2017 Current Business Trends By Brian G. Long, Ph.D.,
Institute for Supply Management, Greater Grand Rapids, Inc. P. O. Box 230621 Grand Rapids, MI 49523-0321 News Release (For Immediate Release) June 6, 2017 Current Business Trends By Brian G. Long, Ph.D.,
Food and Beverage Sales and Pricing Challenges By Kevin Grier, Senior Market Analyst April 2008
 Food and Beverage Sales and Pricing Challenges By Kevin Grier, Senior Market Analyst April 2008 The Canadian grocery sector is exceptionally competitive. In fact, grocery chains continue to lose share
Who Gained Market Share in Indonesian Manufacturing?
 Who Gained Market Share in Indonesian Manufacturing? Sadayuki Takii and Eric D. Ramstetter ICSEAD and Graduate School of Economics, Kyushu University Working Paper Series Vol. 2008-14 March 2008 The views
August 2017 Economic Report
 August 217 Economic Report Table of Contents Economic Overview... 1 Terminology & Methodology.. 2 Business Cycle... 3 US Paper & Paper Products Production Index.... 4 US Pulp, Paper, & Board Mills Production
Economic Viability of Combined Heat and Power in ERCOT
 WADE Annual Meeting & DistribuGen Conference and NYSERDA CHP Expo October 14-17, 2014, Westchester, New York Economic Viability of Combined Heat and Power in ERCOT PRESENTED BY Yingxia Yang O c t 1 6 t
Business-Facts: 3 Digit NAICS Summary 2015
 Business-Facts: 3 Digit Summary 215 Lake Anne 215 Polygon 1: LAKE ANNE 2, 11 Agriculture, Forestry, Fishing and Hunting 111 Crop Production 112 Animal Production and Aquaculture 113 Forestry and Logging
EMPLOYMENT AND PAYROLLS 2006 ANNUAL AVERAGES. "Check Out Our Web Site:
 AN PAYROLLS 2006 S "Check Out Our Web Site: www.dllr.state.md.us/lmi/index.htm" MARYLAN EPARTMENT OF LABOR, LICENSING AN REGULATION Office of Workforce Information and Performance 1100 North Eutaw Street
DUBAI BUSINESS SURVEY Q Department of Economic Development, Dubai. Economic Information Division Economic Policies & Studies Sector
 DUBAI BUSINESS SURVEY Q4-2016 Department of Economic Development, Dubai Economic Information Division Economic Policies & Studies Sector INTRODUCTION The Department of Economic Development (DED) was established
Report April Key Economic and Labour Force Issues Facing Canada s Manufacturing Sector. economic performance and trends
 Report April 2008 Key Economic and Labour Force Issues Facing Canada s Manufacturing Sector economic performance and trends Key Economic and Labour Force Issues Facing Canada s Manufacturing Sector by
BusinessCounts Methodology 2015A Release June 2015
 Introduction BusinessCounts is a geographic summary database of business establishments and employees for nearly ten million businesses and one hundred and thirty million employees. The database is available
APPLIED GEOGRAPHIC SOLUTIONS
 Version Release 2018 Introduction BusinessCounts is a geographic summary database of business establishments and employees for nearly ten million businesses and one hundred and thirty million employees.
agriculture, forestry & fisheries January to March 2013 Volume 2, number 1 June 2013 DIRECTORATE: AGRO-PROCESSING SUPPORT
 Quarterly Economic Review of the Agro-processing industry in South Africa January to March 2013 Volume 2, number 1 June 2013 DIRECTORATE: AGRO-PROCESSING SUPPORT agriculture, forestry & fisheries Department:
Regional Competitive Industry Analysis
 Regional Competitive Industry Analysis Clackamas, Multnomah, and Washington Counties July 2017 Washington Multnomah Clackamas Michael Meyers, Economist (503) 229-6179 michael.meyers@oregon.gov Jill Cuyler,
Wholesale Distribution Economic Trends: Headwinds Slow Revenue Growth. in partnership with:
 2016 Wholesale Distribution Economic Trends: Headwinds Slow Revenue Growth from: in partnership with: Total revenues of wholesale distributors in 2015 fell by 4.3 percent to $5.3 trillion, reflecting a
MONTHLY OVERSEAS CONTAINER TRADE UPDATE: FEBRUARY 2016
 MONTHLY CONTAINER TRADE REPORT - Overseas Containers MONTHLY OVERSEAS CONTAINER TRADE UPDATE: FEBRUARY 216 Overseas container trade February 216 Full overseas container imports Full overseas container
Retail Trade. Quarterly analysis of activity in retail, wholesale and motor trade. Fourth quarter Q1 12 March 2014
 Retail Trade Quarterly analysis of activity in retail, wholesale and motor trade Fourth quarter 216 214Q1 12 March 214 Please refer to the glossary on the BER s website for explanations of technical terms.
Factors affecting output and employment
 Table V 2. Factors affecting industry output and employment, 2004 14 111 Crop production Output is expected to grow more slowly than GDP. Employment is projected to fall as a result of increasing productivity,
The Plan Bay Area. Page Copyright 2012 Pearson Addison-Wesley. All rights reserved.
 The Plan Bay Area Page 1 20-1 What is the Plan Bay Area? Plan Bay Area 2040 is a state-mandated, integrated long-range transportation and land use plan. As required by Senate Bill 375 (2008), all metropolitan
How Are Alberta s Largest Manufacturing Sectors Faring in the Current Recession?
 ECONOMIC COMMENTARY How Are Alberta s Largest Manufacturing Sectors Faring in the Current Recession? Highlights: Alberta s manufacturing sector is currently in recession as a result of the dramatic drop
HOG PRODUCERS SHOW LITTLE SIGN OF RETREAT
 HOG PRODUCERS SHOW LITTLE SIGN OF RETREAT APRIL 2007 Chris Hurt 2007 NO. 2 Hog producers reported in the latest USDA update that they increased the size of the breeding herd by 1 percent. This means pork
August IPI Beats Expectation up 6.8%, Highest in 2 ½ Years.
 12 October 20 ECONOMIC REVIEW August 20 Industrial Production Index August IPI Beats Expectation up 6.8%, Highest in 2 ½ Years. IPI expanded above market expectations. Malaysia s industrial production
Acknowledgement: Ralph Prahl, Prahl & Associates, contributed critical review and analysis
 Subject Focus on Energy Evaluation Updating Industry Classification for Participants in Business To Oscar Bloch, Public Service Commission of Wisconsin From Eric Rambo, Bryan Ward, and Dan Belknap, PA
BUSINESS-FACTS: 2 DIGIT SIC SUMMARY
 Project : South Tulsa BUSINESS-FACTS: 2 DIGIT SUMMARY Prepared For You 1.00 Mile Radius TOT All Industries MAN All Manufacturing ( 20-39) RET All Retailing ( 52-59) 01 Agricultural Production - Crops 02
ECONOMIC DRIVERS FOR THE CHEMICAL INDUSTRY
 ECONOMIC DRIVERS FOR THE CHEMICAL INDUSTRY 3 October 2017 Pittsburgh Chemical Day Pittsburgh, PA Martha Gilchrist Moore Sr. Director Policy Analysis and Economics Outline Global Situation and Outlook U.S.
LITHUANIA-DENMARK BILATERAL TRADE review
 LITHUANIA-DENMARK BILATERAL TRADE review Published: 01.08.2017 SUMMARY Denmark is one of the most important trade partners for Lithuania. In 2016 the trade turnover in goods between the two countries slightly
Manufacturing Career Information
 Manufacturing Career Information Mike Willis Executive Director, South Texas Manufacturers Association Mike@STMA-TX.org 3/8/17 In partnership with: More Education = Better Labor Market Outcomes What is
Implications of the U.S.-Korea Free Trade Agreement for Agriculture and other Sectors of the Economy
 Agribusiness & Applied Economics Report No. 619 October 2007 Implications of the U.S.-Korea Free Trade Agreement for Agriculture and other Sectors of the Economy Renan Zhuang Jeremy W. Mattson Won W. Koo
Industrial Energy Efficiency as a Resource by Region
 Industrial Energy Efficiency as a Resource by Region Garrett Shields and Robert D. Naranjo, BCS Incorporated Sandy Glatt, U.S. Department of Energy ABSTRACT The energy intensity of specific manufacturing
U.S. Bank Freight Payment Index
 U.S. Bank Freight Payment Index 3rd Quarter National Freight Market Overview Freight Shipments Freight Spend Index Value 133.0 Index Value 164.7 Quarterly % Change 3.3% Quarterly % Change 8.3% Yearly %
Business-Facts: 2 Digit SIC Summary 2010
 Business-Facts: Digit Summary Radius : 777 RICHMOND HWY, ALEXANDRIA, VA 6-8,. -. Miles, s + TOT All Industries 9 8,86,8. 6 MAN All Manufacturing ( -9).7 RET All Retailing ( -9) 8,9.7 9 ADM Public Administration
MONTHLY OVERSEAS CONTAINER TRADE UPDATE: SEPTEMBER 2017
 MONTHLY CONTAINER TRADE REPORT - Overseas Containers MONTHLY OVERSEAS CONTAINER TRADE UPDATE: SEPTEMBER 217 Overseas container trade September 217 Full overseas container imports Full overseas container
Trade Report. Maersk Group. Optimism Over Brazil Growth in 2017 Timid BRAZIL Q4 2016
 Maersk Group Trade Report 2016 BRAZIL Optimism Over Brazil Growth in 2017 Timid Capacity to remain unchanged during the whole year Exports to struggle amid lack of space and equipment Carriers costs increasing,
MINISTRY OF PLANNING AND INVESTMENT LAO STATISTICS BUREAU
 Workshop on Energy Statistics for ASEAN Countries Kuala Lumpur, Malaysia 21-23 November 2016 Data Collection On Energy Statistics and Using Data to Establish The Supply and Use Table Sypaseut NAVONGSA
Energy use in manufacturing 2015
 Energy 2016 Energy use in manufacturing 2015 Energy use in manufacturing diminished by 3 per cent in 2015 According to Statistics Finland, energy use in manufacturing decreased by three per cent from the
Dennis Leong, Toni Rice, and Kathleen Spencer March 27, 2013
 Dennis Leong, Toni Rice, and Kathleen Spencer March 27, 2013 Northwoods Rail Transit Commission (NRTC) Why study freight rail in northern Wisconsin? Counties in the study area Photo: Wisconsin State Historical
Rising Flathead Valley 32 nd Annual Montana Economic Outlook Seminar February 6, 2007
 Rising Flathead Valley 32 nd Annual Montana Economic Outlook Seminar February 6, 2007 Center for Business Information and Research Flathead Valley Community College Director: Gregg Davis, Ph.D. Business
Core Benchmarks Planning, Inventory & Forecasting
 Core Benchmarks Planning, Inventory & Forecasting The Supply Chain Leadership Forum 2010 Dallas, Texas Track D-3 Facilitated by Greg Hazlett Principal, Tompkins Associates Session Scope This Session Will
Is There A Rural-Urban Technology Gap?
 Is There A Rural-Urban Technology Gap? Results of the ERS Rural Manufacturing Survey United States Department of Agriculture Economic Research Service Agriculture Information Bulletin Number 736-01 August
marketreport FEBRUARY 2016
 marketreport FEBRUARY 2016 Onion & Garlic Dehydrated Onion Market Summary 2016 US onion crop planting progressing well; El Nino having benefic impact on CA snowpack and precipitation; Chopped/ minced and
Operational Costs of Canal Companies and Irrigation Districts in the Intermountain Region
 Operational Costs of Canal Companies and Irrigation Districts in the Intermountain Region by John Wilkins-Wells, 1 Hubert J. Lagae, 2 Raymond L. Anderson, 3 and Muhammad S. Anwer 4 Presented at Western
T he Asian economic and financial crisis
 Patricia S. Pollard is an economist and Research Officer at the Federal Reserve Bank of St. Louis. Cletus C. Coughlin is a vice president and the Associate Director of Research at the Federal Reserve Bank
Central Bank of the Islamic Republic of Iran. Wholesale Price Index in Iran
 Central Bank of the Islamic Republic of Iran General Directorate of Economic Statistics Wholesale Price Index in Iran Mordad 1383 (July 22 - August 21, 2004) Monthly Report Economics Statistics Department
Chapter 3-Your Purchasing Power. Section 3-1_Inflation and the Value of Money
 Chapter 3-Your Purchasing Power Section 3-1_Inflation and the Value of Money What is Inflation? The increase in the general prices for goods and services. It reflects how much prices are rising When prices
/ Press Information. After three years of consecutive growth, 2012 U.S. ad spend reaches $139.5 billion; Olympics, election contribute to gains.
 / Press Information Contact details: Bill Daddi Daddi Brand Communications Phone: 646-370-1341 Cell: 917-620-3717 Email: Bill@DaddiBrand.com KANTAR MEDIA REPORTS U.S. ADVERTISING EXPENDITURES INCREASED
Rice Outlook and Baseline Projections. University of Arkansas Webinar Series February 13, 2015 Nathan Childs, Economic Research Service, USDA
 Rice Outlook and Baseline Projections University of Arkansas Webinar Series February 13, 2015 Nathan Childs, Economic Research Service, USDA THE GLOBAL RICE MARKET PART 1 The 2014/15 Global Rice Market:
FOR IMMEDIATE RELEASE
 Contact: Matthias Chen, Marcom & Product Development Matthias.Chen@dnb.com.sg +65 6439 6670 +65 9478 5568 FOR IMMEDIATE RELEASE Business sentiments remain upbeat in Q4 Outlook for manufacturing, services
Canadian International Merchandise Trade
 Catalogue no. 65-001-X Vol. 69, no. 12. Canadian International Merchandise Trade. Statistical tables Table 1 Merchandise trade of Canada, balance of payments basis, seasonally adjusted - Current dollars
Canadian International Merchandise Trade
 Catalogue no. 65-001-X Vol. 69, no. 9. Canadian International Merchandise Trade. Statistical tables Table 1 Merchandise trade of Canada, balance of payments basis, seasonally adjusted - Current dollars
Canadian International Merchandise Trade
 Catalogue no. 65-001-X Vol. 69, no. 7. Canadian International Merchandise Trade. Statistical tables Table 1 Merchandise trade of Canada, balance of payments basis, seasonally adjusted - Current dollars
Commodity Market Monthly
 Commodity Market Monthly Research Department, Commodities Unit May 12, 216 www.imf.org/commodities commodities@imf.org Commodity prices surged 4.7 percent in April, with gains in all main indices, and
Canadian International Merchandise Trade
 Catalogue no. 65-001-X Vol. 66, no. 9. Canadian International Merchandise Trade. Statistical tables Table 1 Merchandise trade of Canada, balance of payments basis, seasonally adjusted Current dollars Export
Regional Competitive Industry Analysis
 Regional Competitive Industry Analysis Baker, Union, and Wallowa Counties October 2017 Union Wallowa Baker Michael Meyers, Economist (503) 229-6179 michael.meyers@oregon.gov Jill Cuyler, Research Analyst
Hog:Corn Ratio What can we learn from the old school?
 October 16, 2006 Ames, Iowa Econ. Info. 1944 Hog:Corn Ratio What can we learn from the old school? Economists have studied the hog to corn ratio for over 100 years. This ratio is simply the live hog price
Understanding the Scale of the Problem: US Energy Sources and CO2 Emissions
 Understanding the Scale of the Problem: US Energy Sources and CO2 Emissions Pete Wilcoxen Departments of Economics and Public Administration The Maxwell School, Syracuse University BUA/ECS 650/EST 696
Key Enabling technologies are technology domains that are knowledge intensive and associated with high R&D intensity, rapid innovation cycles, high ca
 Prof. Göran Roos Key Enabling technologies are technology domains that are knowledge intensive and associated with high R&D intensity, rapid innovation cycles, high capital expenditure, highly-skilled
SUB-SAHARAN AFRICA S EXPORT TRENDS AND THE EPAS
 SC/TDP/AN/EPA/28 Original: English SUB-SAHARAN AFRICA S EXPORT TRENDS AND THE EPAS EXECUTIVE SUMMARY Trade trends are changing quite rapidly for Africa. A careful analysis of Africa s export statistics
Changing Industrial Structure Vancouver
 Changing Industrial Structure Figure 1 shows how s regional industrial composition has changed in the past 25 to 30 years. Most notably, s economy has become increasingly dominated by service-based industries.
Agriculture: expansions highlighted developments
 Agriculture: expansions highlighted developments A broad-based expansion in livestock production and another bumper grain harvest highlighted agricultural developments in 1976. Meat production rose 9 percent
A Year of Unbalanced Growth:
 National Employment Law Project A Year of Unbalanced Growth: Industries, Wages, and the First 12 Months of Job Growth After the Great Recession DATA BRIEF February 2011 In this data brief, we draw on recent
When Lightning Strikes
 When Lightning Strikes Malcolm Baldrige National Quality Award Winner JoAnn Brumit CEO KARLEE Profile Certified Contract Manufacturer Providing Total SOLUTIONS for your precision machining, sheet metal,
Municipal Solid Waste Generation, Recycling, and Disposal in the United States: Facts and Figures for 2010
 Municipal Solid Waste Generation, Recycling, and Disposal in the United States: Facts and Figures for 2010 The U.S. Environmental Protection Agency (EPA) has collected and reported data on the generation
Hog Producers Near the End of Losses
 Hog Producers Near the End of Losses January 2003 Chris Hurt Last year was another tough one for many hog producers unless they had contracts that kept the prices they received much above the average spot
Market View. Aluminum Highlights. Week Ending: March 2, 2018 An update on industry activity and economic indicators. Follow us on:
 Market View Aluminum Highlights Week Ending: An update on industry activity and economic indicators By: Beau Walker, Department Leader, Market Intelligence and Projects Trane, Energy Supply Services The
HOGS VS. ETHANOL: ETHANOL WINS!
 HOGS VS. ETHANOL: ETHANOL WINS! OCTOBER 2006 Chris Hurt 2006 NO. 6 The pork industry s concerns about higher corn prices from the extraordinary growth in corn demand for ethanol appears to be moving from
City of Hamilton. The current and future state of Hamilton s advanced manufacturing sector
 City of Hamilton The current and future state of Hamilton s advanced manufacturing sector October 2013 Advanced manufacturing is best viewed as a cluster of economic activities encompassing much more than
Economic Impacts. Refineries in Skagit County
 Economic Impacts of the Refineries in Skagit County February 13, 2015 Center for Economic and Business Research Prepared for the Economic Development Association of Skagit County Table of Contents Executive
Executive summary. Butter prices at record levels
 June 2017 Executive summary Butter prices at record levels South African milk production growth disappointed in the first five months of 2017. Total production during this period is marginally lower than