Evaluation of Wind Loads on Solar Panels
|
|
|
- Paul Franklin
- 6 years ago
- Views:
Transcription
1 Florida International University FIU Digital Commons FIU Electronic Theses and Dissertations University Graduate School Evaluation of Wind Loads on Solar Panels Johann Barata Florida International University, DOI: /etd.FI Follow this and additional works at: Recommended Citation Barata, Johann, "Evaluation of Wind Loads on Solar Panels" (2011). FIU Electronic Theses and Dissertations This work is brought to you for free and open access by the University Graduate School at FIU Digital Commons. It has been accepted for inclusion in FIU Electronic Theses and Dissertations by an authorized administrator of FIU Digital Commons. For more information, please contact
2 FLORIDA INTERNATIONAL UNIVERSITY Miami, Florida EVALUATION OF WIND LOADS IN SOLAR PANELS A thesis submitted in partial fulfillment of the requirements for the degree of MASTER OF SCIENCE in CIVIL ENGINEERING by Johann Barata 2012
3 To: Dean Amir Mirmiran choose the name of dean of your college/school College of Engineering and Computing choose the name of your college/school This thesis, written by Johann Barata, and entitled Evaluation of Wind loads on Solar panels, having been approved in respect to style and intellectual content, is referred to you for judgment. We have read this thesis and recommend that it be approved. Arindam Gan Chowdhury Yimin Zhu Girma Bitsuamlak, Major Professor Date of Defense: December 2, 2011 The thesis of Johann Barata is approved. choose the name of your college/schools dean Dean Amir Mirmiran choose the name of your college/school College of Engineering and Computing Dean Lakshmi N. Reddi University Graduate School Florida International University, 2012 ii
4 DEDICATION I dedicate this thesis to my son Jonathan G. Barata, to my wife Danay Barata, and to my professor Dr. Girma Bitsuamlak. They all gave the courage and motivation to make this research a reality. I am truly grateful to all of you. iii
5 ACKNOWLEDGMENTS I would like to thank my professor, Dr. Girma Tsegaye Bitsuamlak, who gave me a thorough guidance to complete this thesis work, and for inspiring me to work with Wind Engineering as part of the Master of Science in Civil Engineering program at Florida International University. I would also like to thank Dr. Arindam Gan Chowdhury and Dr. Yimin Zhu for their assistance in the completion of this work. My thesis would not have been possible without the support of my friends; Amanuel Tecle, who was particularly helpful in guiding me towards the various steps of this project, Workamaw P. Warsido who made it possible by doing the statistical analysis of the data, the Wall of Wind researchers, and the staff of the RWDI for their support especially Marco Arccado and Bruce McInnis. I will also like to thank my friend and colleague Christian A. Vidal, who dedicatedly proofread my work and suggested modifications. I am also grateful to all my peers and the people who made my time in school an amazing experience. iv
6 ABSTRACT OF THE THESIS EVALUATION OF WIND LOADS ON SOLAR PANELS by Johnn Barata Florida International University, 2012 Miami, Florida Professor Dr. Girma Tsegaye Bitsuamlak, Major Professor The current impetus for alternative energy sources is increasing the demand for solar energy technologies in Florida the Sunshine State. Florida s energy production from solar, thermal or photovoltaic sources accounts for only 0.005% of the state total energy generation. The existing types of technologies, methods of installation, and mounting locations for solar panels vary significantly, and are consequently affected by wind loads in different ways. The fact that Florida is frequently under hurricane risk and the lack of information related with design wind loads on solar panels result in a limited use of solar panels for generating energy in the Sunshine State Florida. By using Boundary Layer Wind Tunnel testing techniques, the present study evaluates the effects of wind on solar panels, and provides explicit and reliable information on design wind loads in the form of pressure coefficient value. The study considered two different types of solar panel arrangements, (1) isolated solar panel and (2) arrays, and two different mounting locations, (1) ground mounted and (2) roof mounted. Detailed wind load information was produced as part of this study for isolated and arrayed solar panels. Two main conclusions from this study are the v
7 following:(1) for isolated solar panel with high slopes the wind load for wind angle of attack (AoA) perpendicular to the main axis exhibited the largest wind loads; (2) for arrays, while the outer rows and column were subjected to high wind loads for AoA perpendicular to the main axis, the interior solar panels were subjected to higher loads for oblique AoA. vi
8 TABLE OF CONTENTS CHAPTER PAGE 1. INTRODUCTION RESEARH HYPOTHESIS RESEARCH OBJECTIVE LITERATURE REVIEW METHODOLOGY Boundary layer wind tunnel setup and flow characteristics Isolated solar panel: study wind tunnel model and instrumentation Solar Panel Array: Wind Tunnel Study Model and Instrumentation Ground-Mounted Arrayed Solar Panel: Roof-mounted arrayed solar panel RESULTS AND DISCUSSIONS Wind pressure coefficient Single Ground Mounted Solar Panel Variation of wind pressure coefficients with wind angle of attack (AoA) Effects of support heights (H) on wind pressure coefficients Effects of Solar Panel Slope (S10, 20, 25, 30 And 40) On Wind Pressure Coefficients Effects of upstream exposure (open vs. suburban) on wind pressure coefficients Solar panel array: study wind tunnel model and instrumentation Ground- mounted solar pane array Variation of wind pressure coefficients with wind angle of attack (AOA) Effects of longitudinal distance between the arrays on Cp values Effects of Lateral gap between the solar panel on Cp values Roof Mounted solar panels array Variation of wind pressure coefficients with wind angle of attack (AoA) Effects of roof perimeter gap on Cp values CONCLUSIONS AND RECOMMENDATIONS REFERENCES vii
9 TABLE OF FIGURES FIGURE PAGE Figure 1. Trapezoidal planks and triangular floor roughness elements used to develop open exposure for the bottom 30 m, mean wind speed profile, turbulence intensity profile, and longitudinal turbulence spectrum at 3.81cm (1.5in) height in the mode... 8 Figure 2. Isolated solar panel model in a boundary layer wind tunnel in a testing position Figure 3. Isolated solar panel slopes and support heights considered in the study Figure 4.Pressure tap distribution used for Single PV model Figure 5. Ground-mounted arrayed solar panel model in a boundary layer wind tunnel in a testing position Figure 6.Pressure tap distribution used for both ground- and roof-mounted model. Note: For arrayed case a total of ten PV panels were instrumented simultaneously with this tap distribution for each test case Figure 7.Ground-mounted solar panel: Longitudinal distances investigated in the wind tunnel Figure 8.Ground-mounted solar panels: Lateral gaps Figure 9.Ground-mounted arrays considered in the present study Figure 10.Ground-mounted array test configuration definition Figure 11.Roof-mounted arrayed solar panel model in a boundary layer wind tunnel in a testing position Figure 12.Roof-mounted arrays basic test configuration definition Figure 13.Perimeter gaps considered for roof-mounted solar panel array Figure 14.Total roof-mounted array test configurations Figure 15.Wind profile, and reference height definition Figure 16.Maximum Cp Plots for (a) 0 o (b) 45 o (c) 90 o (d) (e) (f) (g) 270 o, and (h) 315 o wind AoAs Figure 17.Minimum Cp Plots for (a) 0 o (b) 45 o (c) 90 o (d) (e) (f) (g) 270 o, and (h) 315 o wind AoAs Figure 18.(a) Mean Cp for H12, H24, and H32 and wind AoA 1800 and (b) maximum Cp for H12, H24, and H32 and wind AoA viii
10 Figure 19.(a) Mean Cp for H12, H24, and H32 and wind AoA 45 0 and (b) Maximum Cp for H12, H24, and H32 and wind AoA Figure 20.(a) Mean Cp for S10, S20, S25, S30 and S40 and wind AoA (open terrain), and (b)maximum Cp for S10, S20, S25, S30 and S40 and wind AoA (open terrain) Figure 21.(a) Mean Cp for S10, S20, S25, S30 and S40 and wind AoA 45 0 (open terrain) and (b) maximum Cp for S10, S20, S25, S30 and S40 and wind AoA Figure 22.. Variation of the average CP for different open and suburban profiles (a) 45 0 and (b) AoA Figure 23.Net Cp contours for wind AOAs (a) 00 (b) 315 0, (c) and (d) Figure 24. Ground-mounted arrays: net Cp contours for longitudinal gap (a) 24 in, (b) 48 in and (c) 72 and AoA Figure 25. Ground-mounted arrays: Net Cp contours for longitudinal gap (a) 24 in, (b) 48 in and (c) 72 and AoA Figure 26. Ground-mounted arrays: Net Cp contours for longitudinal gap (a) 24 in, (b) 48 in and (c) 72 and AoA Figure 27. Ground-mounted array: net Cp contours for longitudinal gap (a) 24 in, (b) 48 in and (c) 72 and AoA Figure 28. Ground-mounted array: net Cp contours for lateral gap (a) 0 in, (b) 32 in and (c) 72 and AoA Figure Ground-mounted array: net Cp contours for lateral gap (a) 0 in, (b) 32 in and (c) 72 and AoA Figure 30 Ground-mounted array: net Cp contours for lateral gap (a) 0 in, (b) 32 in and (c) 72 and AoA Figure 31.Ground-mounted arrays: net Cp contours for lateral gap (a) 0 in, (b) 32 in and (c) 72 and AoA Figure 32.32a, 32b, 32c and 32d show the net Cp contours for wind AOAs 0 0 to AOA 3150, and and zero perimeter gap Figure 33.Roof-mounted arrays: net Cp contours for roof perimeter (a) 0 in, (b) 36 in and (c) 72 and AoA Figure 34.Roof-mounted arrays: net Cp contours for roof perimeter (a) 0 in, (b) 36 in and (c) 72 and AoA Figure 35.Roof-mounted arrays: net Cp contours for roof perimeter (a) 0 in, (b) 36 in and (c) 72 and AoA ix
11 Figure 36. Roof-mounted arrays: net Cp contours for roof perimeter (a) 0 in, (b) 36 in and (c) 72 and AoA x
12 1. INTRODUCTION In the last few years, the price of electricity generation has increased dramatically, especially in the state of Florida. Electricity in Florida has been for many years around 16 percent higher than the national average. Over half of the state s electricity is generated from natural gas, and 25 percent of it comes from coal. In general, Florida generates more electricity from petroleum than any other state. Florida also produces electricity from municipal solid waste and landfill gas, though the contribution from these sources to the overall state s electricity production is insignificant. In 2009, a 25-megawat solar photovoltaic plant was constructed in the state, which influenced the planning of several other solar plants statewide (Florida Energy facts). Yet, the state of Florida s energy production from solar thermal, or photovoltaic, accounts for only a 0.005% of the state s total energy generation. The current impetus for alternative energy sources is increasing the demand for solar energy technologies in Florida and around the United States. The existing types of technologies, methods of installation, and mounting locations (ground, roof, or integrated with the building envelope) vary significantly, and are consequently affected by wind loads in different ways. Most cities in Florida tend base construction on Chapter 16 of the Florida Building Code (FBC- 2007) for structural mounting, attachments and design of photovoltaic equipment. However, Chapter 16 of the FBC does not explicitly provide a dedicated section regarding photovoltaic installation. This lack of information related with design wind loads on photovoltaic technology results in 1
13 two kinds of oversight: (1) more of the systems are consequently over-designed, resulting in a direct increase of installation costs, and (2) the photovoltaic systems are under designed, resulting in the total destruction of equipment after an extreme wind event. The lack of prescriptive requirements as part of the FBC diminishes the opportunity for the solar panel industry to further develop. Uncertainty about what constitutes a safe and secure installation for a given wind load can complicate the approval process for a solar panel installation, thus hindering the progress of solar panel technology. 2. RESEARCH HYPOTHESIS The effects of wind loads on solar panels could be accurately measured by using Wind Tunnel Testing techniques. It is consequently hypothesized by both developing wind tunnel tests and analyzing the data that more accurate and reliable information about wind loads on solar panels can be obtained, thus, reducing the uncertainty. 3. RESEARCH OBJECTIVES The research objectives are to: (i) Evaluate wind loads on a single ground mounted solar panel and (ii) Evaluate wind loads on a ground and roof mounted arrayed solar panel using industry accepted boundary layer wind tunnel experimentation. (iii) Assess effects of solar panel slopes on pressure coefficients. (iv) Assess effects of solar panel terrain exposure on pressure coefficients. (v) Assess effects of solar panel support highs on pressure coefficients. 2
14 (vi) Assess effects of spacing between arrays on pressure coefficients in solar panel arrays. 4. LITERATURE REVIEW Considering the high demand for solar power and the variations among solar technologies available, only a limited number of wind tunnel and numerical studies exist regarding solar panel aerodynamics. Chevalien et al. (1979) performed a wind tunnel study investigating the sheltering effect on a row of solar panels mounted on a building model. Kopp et al. (2002) conducted experimental studies on the evaluation of wind-induced torque on solar arrays arranged in a parallel scheme, and demonstrated that for a separation close to the critical value where the onset of wake buffeting was anticipated, the peak aerodynamically-induced system torque was observed at a wind angle of attack due to the formation of vortex shedding from the upstream modules. Chung et al. (2008) carried out an experimental study to investigate the wind uplift and mean pressure coefficients on a solar collector model installed on the roof of buildings under typhoon-type winds. The study found that the uplift force could be effectively reduced by using a guide plate normal to the incident wind direction, and also, by adopting a lifted model. In addition, this study demonstrated that pronounced local effects developed around the front edge, and decreased near a distance of one-third from the leading edge. Neffba et al. (2008) at the Colorado State University, made numerical calculations of wind loads on solar photovoltaic collectors to estimate drag, lift and overturning moments on different collector support systems. These results 3
15 were compared with direct-force measurement tests obtained during wind tunnel experiments. The numerical procedure employed k-epsilon, RNG and k-omega turbulence closures to predict loads. The RNG and k-omega model approaches produced reasonable agreement with measured loads, whereas the k-epsilon model failed to replicate measurements. Numerically generated particle path lines about the model collectors strongly resembled wind tunnel smoke visualization observations. Steenbergen et al. (2010) did a full-scale measurement of wind loads on standoff photovoltaic systems to obtain design data for standoff solar panels modules. The results indicate that for these systems, the top and bottom pressures are very well correlated. Results are now available, which can be used as a first step towards generating guidelines for the installation of standoff solar energy panels. Banks et al. (2008) consulted on wind loads for several solar energy projects. According to these studies, the author published some articles providing guidelines to calculate wind loads on roof-mounted solar panels in the US utilizing ASCE 7-05.Uematsu et al, (2008), made several wind tunnel testings on freestanding canopy roofs in order to determine the characteristics of wind loads on this type of structures. Tan et al. (2009) demonstrated that the wind conditions affect the performance of a solid particle solar receiver (SPSR) by convection heat transfer through the existing open aperture. The wind effect on the performance of an SPSR was investigated numerically with and without the protection of an aero 4
16 window. The independence of the calculating domain in a wind field was studied in order to select a proper domain for the numerical simulation. The cavity thermal efficiencies and the existing temperature of the solid particles was calculated and analyzed for different wind conditions. The numerical investigation of the SPSRs' performance provided a guide in optimizing the prototype design, finding out the suitable working condition and proposing efficiency enhancing techniques for SPSRs. Hangan et al. (2009) made CFD simulations to estimate the wind loads for various wind directions on stand-alone and arrayed solar panels. Simulations were carried out for Reynolds number (Re) equal to 2, 10, 6 at different azimuthally and inclination angles. They explicitly proved that for the standalone cases, the bottom panels in an array were critical in terms of wind loading. Theoharia et al. (2009) investigated the characteristics of steady-state wind loads affecting rectangular, flat solar collectors of two different sizes mounted in clusters on the flat roofs of a five-story building by testing in the boundary layer wind tunnel. A key conclusion of the study was, in comparison with isolated flat plates, that wind loads on solar collectors are significantly reduced by the sheltering effects of the first row of collectors and of the building itself. Another investigation was performed by Theoharia (2009) to determine the maximum sheltering effect of one set of panels on another set. It was observed that at a specific distance between two sets of panels, the drag coefficient for the downstream sets of panels reached a minimum. 5
17 Kurnik et al. (2010) tested the solar panel s module temperature and performance under different mounting and operational conditions, which explicitly proved that the solar panel performance depends strongly on the way modules are mounted (open-rack, ventilated or unventilated roof mounting, etc.), and the wind speeds they are exposed to. Geurts et al. (2010) studied the effect of wind loads on roof-mounted photovoltaic array panels. The results were presented in the format of the new Euro Code on wind loads. They concluded that the current wind loading standards were not sufficient to include the most common types of active roofs. Barkaszi et al. (2010) summarized wind load calculations for solar panel arrays using the ASCE Standard The study provided examples that demonstrated a step-by-step procedure for approximately calculating wind loads on solar panel arrays. They also recommended that wind tunnel testing should be conducted for the most common rooftop solar panel installation to verify methods of installation and calculations. Recently, Bitsuamlak et al. (2010) investigated four different test cases to determine the wind effects on stand-alone, ground-mounted solar panels, with a series of different wind angles of attack, and various numbers of panels. The CFD results have been compared and validated with a full-scale experimental measurement performed at the Wall of Wind (WoW) testing facility at Florida International University (FIU). The numerical results obtained from CFD simulations showed similar patterns of pressure coefficient distribution when compared to full-scale measurements, but the magnitude of the pressure 6
18 coefficients was generally underestimated by the numerical calculations when compared to the experimental results. The solar panels experienced the highest overall wind loads for wind angle of attack. The study also demonstrated that a prominent sheltering effect caused by upwind solar panels substantially reduced the wind loads on the adjacent solar panel when they are arranged in tandem. 5. METHODOLOGY 5.1. Boundary layer wind tunnel setup and flow characteristics. For the present study, the aerodynamic characteristics of solar panel modules under atmospheric boundary layer flow conditions were investigated. The lower part of atmospheric boundary layer was simulated in the boundary layer wind tunnel at a length, velocity and time scales of 1:20, 1:4, and 1:5, respectively. The boundary layer wind tunnel facility was used to simulate a mean speed and various turbulence profiles of the natural wind approaching a building model. The facility has a long working section with a roughened floor, and turbulence-generating spires were installed at the upwind end. In the present study, floor roughness and spires have been selected to simulate open and suburban wind profiles. Open wind profiles were generated by a combined effect of 15in x 19in (38.1cm x 48.3cm) spire and 1.5in (3.81cm) triangular-floor roughness elements, while suburban wind profiles were generated by a combination of 18in x 18in (45.72cm x 45.72cm) spires with 4in (10.16cm) floor roughness elements. Figure 1 shows the wind velocity and turbulence intensity profiles as well as the spectra examples for open terrain exposure. 7
 height in the mode.")
19 Figure 1 Trapezoidal planks and triangular floor roughness elements used to develop open exposure for the bottom 30 m, mean wind speed profile, turbulence intensity profile, and longitudinal turbulence spectrum at 1.5in (3.81cm) height in the mode. 8
 at full-scale and tested at RWDI s 7ft x 8.1ft (2.13m x 2.46m) boundary layer wind tunnel facility in Miramar, Florida. The model was tested in the absence of surroundings.")
20 5.2. Isolated solar panel: study wind tunnel model and instrumentation. The isolated solar panel model was constructed in a scale of 1:20 to represent a 30ft x 4.4ft (9.14m x 1.34m) at full-scale and tested at RWDI s 7ft x 8.1ft (2.13m x 2.46m) boundary layer wind tunnel facility in Miramar, Florida. The model was tested in the absence of surroundings. The models were cut out from Plexiglas acrylic sheets using a high precision laser cutting machine, and the pressure tubes were glued with fast setting solvent cement. They were placed at 43.5ft (13.3m) down-stream of the tunnel entrance at the center of a 7.5ft (2.3m) diameter turntable. Figure 2 shows the wind tunnel model for isolated solar panel. Figure 2 Isolated solar panel model in a boundary layer wind tunnel in a testing position. 9
21 Solar panels with five different slopes (i.e. 0 o, 10 o, 20 o, 25 o, 30 o, and 40 o ) expected to cover optimal orientations for different locations (latitudes) and three different leg heights, i.e. 12 in (30.48 cm), 24 in (60.96 cm) and 32 in (81.28 cm); short legs were considered in the study. Figure 3 summarizes the tested slope and support height cases. Each combination of slope and leg height was tested for wind angle of attacks (AoA) ranging from 0 o to 350 o at 10 o intervals. In addition, 45 o and 135 o AoA have been tested for all cases. The following nomenclature where slopes and short leg heights will be designated by the prefixes S and H followed by their corresponding values has been adopted. For instance, S25H12 is 25 0 slope and 12 inches short leg height. Each combination of slope and leg height was tested also for both open and suburban profile. 10
22 Figure 3 Isolated solar panel slopes and support heights considered in the study. 11
23 Pressure distribution on the panel surface was obtained from 80 taps installed at 40 points on the panel surface for the Single Ground mounted solar panel, (two at each point, one on the top and the other on the bottom surface) as shown in Fig. 4. Figure 4. 4 Pressure tap distribution used for Single PV model. Pressure taps distribution used for Single PV model. Pressure readings were taken by connecting the pressure taps to Scani-Valve (intelligent pressure and temperature measuring module) with 0.053in (1.34mm) solar panels C tubes for a duration of a 90-second period, at a sampling frequency of 512Hz. Consequently, a total of 46,080 measurement points were collected for each angle, providing enough information for each particular case tested. The data collected is low-pass filtered to reduce resonant effects resulting from the tubes using a transfer function developed specifically for the tubes used. The Scani-Valve equipment consisted of eight coupling input connections, each with a 64-channel capacity. Since it had 80 taps installed, for the Single Ground Mounted solar panel, 80 channels of the Scani-Valve where connected to the model. Each channel generated a column of data, and the pressure was measured in psi 46,080 times for each angle following the frequency that has been explained above. 12
24 A similar procedure was use for both Ground Mounted Arrayed solar panels and Roof Mounted solar panels. As it was mentioned above, the model used for testing Ground Mounted Arrayed solar panel and Roof Mounted solar panel had 48 taps. In this case, a total of ten instrumented panels were placed in the wind tunnel. Accordingly, a total of 480 channels where connected to the Scani-Valve, and each channel generated a column of data of pressure measured in psi Solar Panel Array: Wind Tunnel Study Model and Instrumentation Ground-Mounted Arrayed Solar Panel: For the ground-mounted arrayed solar panel, ten solar panel models were constructed at a 1:30 scale to represent a 30ft x 4.4ft (9.14m x 1.34m) panel at fullscale and tested at RWDI s 7ft x 8.1ft (2.13m x 2.46m) in the boundary layer wind tunnel facility in Miramar, Florida. Several dummy models, i.e. without instrumentation but having similar geometry with the instrumented ones, were used to create arrayed surrounding conditions. The height of the shortest leg of the support was fixed in order to represent a 32 inch high full scale, and the slope of the solar panel was set to 25 degrees. The models were cut out from Plexiglas acrylic sheets using high a precision laser cutting machine, and the pressure tubes were glued with fast setting solvent cement. They were placed at 43.5ft (13.3m) downstream of the tunnel entrance at the center of a 7.5ft (2.3m) diameter turn-table. Figure 5 shows the ground-mounted array considered in the present study. 13

25 Figure 5 Ground-mounted arrayed solar panel model in a boundary layer wind tunnel in a testing position. 14
26 Pressure distribution on the panel surface was obtained from 48 taps installed at 24 points on the panel surface for the ground mounted arrayed solar panel (two at each point, one on the top and the other on the bottom surface) as shown in Fig. 6. Figure 6 Pressure-taps distribution used for both, ground and roof-mounted model. Note: For arrayed case a total of ten PV panels were instrumented simultaneously with this tap distribution for each test case. A pressure measurement procedure similar with the one described for the isolated solar panel was used for ground-mounted arrayed solar panel. As it was mentioned above, the model used for testing the Ground Mounted Arrayed solar panel and Roof Mounted solar panel had 48 taps. In this case, a total of ten instrumented panels were placed in the wind tunnel. Accordingly, a total of 480 channels were connected to the Scani-Valve, and each channel generated a column of data of pressure measured in psi. Longitudinal distance between the solar panel: Three different longitudinal distances between each panel to represent 24, 48 and 72 inches (61,122 and183 cm) 15

27 at full scale were investigated (refer Fig. 7). During the wind tunnel testing, the center of the footprint area of the ten panels was placed in the center of the 7.5ft (2.3m) diameter turn-table. Figure 7 Ground-mounted solar panel: Longitudinal distances investigated in the wind tunnel. Lateral gap between the solar panel: Three different lateral gaps between each ground mounted solar panel to represent 0 inches, 36 inches(91.44 cm) and 72 inches (183 cm)at full scale were investigated (refer Fig. 8). 16


28 Figure 8 Ground-mounted solar panels: Lateral gaps investigated in the wind tunnel. Test configuration: The ground-mounted array considered in the present study is shown in Fig 9. The critically loaded solar panels would be the ones located at the corners. Due to symmetry, only the north-east and south-east corners were investigated in the present study, i.e. regions I and II shown in Figure 9 respectively. Due to the enormous array size, it was not possible to instrument all the three columns in the north-east test at the same time. At the time of testing the Scani-Valve capacity was limited to 500 channels, sufficient only for connecting 10 solar panels at a time. Also it was necessary to test the array in parts as described below due to the lack of enough room in the boundary layer wind tunnel for testing all arrays together. However by systematically testing configuration 1, 2 and 3 separately as shown in Fig 10 a, b and c respectively and putting the test result together, the 17

29 North east corner could be covered. Similarly, by systematically testing configuration 4, 5 and 6 separately as shown in Fig 10 d, e and f respectively and putting the test result together, the South east corner was covered. The teninstrumented panels were tested together with other dummy panels (noninstrumented panels) for six different configurations as it is shown in Fig. 10. Each configuration is further described in detail below. Each combination of longitudinal distances and lateral gaps were tested in six different configurations, and each one was tested for different wind angles of attack (AoA). Figure 9 Ground-mounted arrays considered in the present study. 18
30 Figure 10 Ground-mounted array test configuration definition. Configuration C3 was a result of setting the ten-instrumented panels between two equal and symmetrically distributed groups of non-instrumented panels. Each group consisted of 26 non-instrumented panels. The short leg height of the instrumented panel faces south (180 0 wind direction). This configuration was tested from 0 degrees to 90 degrees. Configuration C2 was a result of setting the ten-instrumented panels (marked in red in the figure) between two groups that were not instrumented panels. The western group consisted of 26 non-instrumented panels as it is shown in figure
31 The eastern group consisted of 13 non-instrumented panels as it is shown in figure 10.The short leg height of the instrumented panel faced south (180 degree wind direction). This configuration was tested from 270 degrees to 0 degrees. Configuration C1 was a result of setting the ten instrumented panels together with 26 non-instrumented panels as it is shown. The short leg height of the instrumented panel faces south (180 0 wind direction). This configuration was tested form 0 degrees to 270 degrees. It should be mentioned that for each of the three above described configurations C1, C2, and C3, a set of three non-instrumented panels were placed behind the 10 instrumented panels as it is shown. Configuration C6 was a result of setting the ten-instrumented panels between two groups equals and symmetrically distributed not-instrumented panels. Each group consisted of 26 non-instrumented panels as it is shown. The short leg height of the instrumented panel faces south (180 0 wind direction). This configuration was tested from 180 degrees to 270 degrees. Configuration C5 was result of setting the ten-instrumented panels between two groups of non-instrumented panels. The western group consisted of 26 noninstrumented panels as it is shown. The eastern group consisted of 13 noninstrumented panels as it is shown. The short leg height of the instrumented panel faces south (180 0 wind direction). This configuration was tested from 180 degrees to 270 degrees. Configuration C4 was a result of setting the ten instrumented together with 26 non-instrumented panels as it is shown. The short leg height of the instrumented 20
32 panel faces south (180 degree wind direction). This configuration was tested from 180 degrees to 270 degrees Roof-mounted arrayed solar panel For the Roof Mounted solar panel; ten solar panel models were constructed at a 1:30 scale. The panels were separated to represent 48 inches longitudinal distance at full scale between them. The height of the panel s supports was fixed to represent 32 inches (91.44 cm) at full scale short legs. The center of the footprint area of the ten panels was placed in the center of the 7.5ft (2.3m) diameter turn-table. They were mounted on a building model cutout from Plexiglas acrylic sheet to represent a width of 90ft, a length of 117ft, and 18.5ft high building (see Fig. 11). A number of 35 (non-instrumented) 30ft x 4.4ft (9.14m x 1.34m) model panels were used in order to simulate the surrounded solar panels. They were also mounted on a similar building model. 21
.")
33 Figure 11 Roof-mounted arrayed solar panel model in a boundary layer wind tunnel in a testing position. Pressure distribution on the panel surface was obtained from 48 taps installed at 24 points on the panel surface for the roof-mounted arrayed solar panels (see Fig. 6). A pressure measurement procedure similar with the one described for isolated solar panel and for ground-mounted arrayed solar panels was used here as well. Test configuration: The roof-mounted array considered in the present study is shown in Fig 11. Due to symmetry, only half of the roof area needs to be tested. Again, due to the enormous array size, it was not possible to instrument all three columns at the same time. Hence test configurations 1, 2, 3 and 4 described in Fig 12 were adopted. The configurations were set by modifying the position of the noninstrumented panels in relation with the ten instrumented panels (see Figure 12). 22
 at full scale between them were considered as shown in Fig. 13.")
34 Figure 12 Roof-mounted arrays basic test configuration definition. Another parameter considered for the roof-mounted solar panels array was the roof perimeter gap. Three different roof perimeter gaps, referred here after simply as perimeter gaps, representing 0, 36 and 72 inches ( 0,92 and 183 cm ) at full scale between them were considered as shown in Fig. 13. Adding a walking area to the building perimeter modified each configuration. The walking area modified the distance between the solar panels and the building perimeter. The walking areas were made to represent both 36 inches and 72 inches (92cm and 183 cm) at full scale. The modification described previously resulted in a total of eight test-configurations as it is shown at Fig. 14, where each combination of roof perimeter-gaps were tested in four different configurations and each one was tested for different AoA. 23

35 Figure 13 Perimeter gaps considered for roof-mounted solar panel array. 24
36 Figure 14 Total roof-mounted array test configurations. Configurations c2a, c2b, c2c, were the result of setting the ten instrumented panels (marked in red in the figure) between two groups of equals and symmetrically distributed non-instrumented panels. Each group consisted of 15 non-instrumented panels. 5 non-instrumented panels more were added in order to keep the configuration symmetrical, in order to cover the northern windward side as it is shown. The short leg height of the instrumented panel faces south (180 0 wind direction). This configuration was tested from 90 degrees to one 180 degrees, and also the one 135 degree angle was tested. Configurations c1a,c1b,c1c were the result of setting the ten instrumented panels (marked in red in the figure) beside one group of 15 non-instrumented panels 25
37 covering the western windward; 5 more not instrumented panels were added in order to keep the configuration symmetrical, and in order to cover the northern windward side as it is shown. The short leg height of the instrumented panel faces south (180 degree wind direction). This configuration was tested from 90 degrees to 180 degrees, and also the 135 degree angle was tested. Configurations c3a, c3b, c3c were the result of setting the ten instrumented panels (marked in red in the figure) between two groups of equal and symmetrically distributed non-instrumented panels; each group consisted of 15 non-instrumented panels; 5 more non-instrumented panels were added in order to keep the configuration symmetrical and in order to cover the southern windward side as it is shown. The short leg height of the instrumented panel faces south (180 0 wind direction). This configuration was tested form 0 degrees 90 degrees, and also the 45 degree angle was tested. Configurations c4a,c4b,c4c were the result of setting the ten instrumented panels (marked in red in the figure) beside one group of 15 non-instrumented panels covering the western windward; 5 more non-instrumented panels were added in order to keep the configuration symmetrical, and in order to cover the southern windward side as it is shown. The short leg height of the instrumented panel faces south (180 0 wind direction). This configuration was tested from 90 degrees to 180 degrees, and also the 135 degree angle was tested. As it has been mentioned previously, each of the four configurations above was briefly modified by adding a walking area to the building perimeter. The walking area modified the distance between the solar panel and the building perimeter. 26
38 6. RESULTS AND DISCUSSIONS 6.1. Wind pressure coefficient. As it has been mentioned above the pressure readings were taken by connecting the pressure taps to the Scani-Valve, and each tap generated a column of data. The pressure was measured in psi 46,080 times for each angle following the frequency that has been explained above. The data was analyzed in order to evaluate the wind pressure coefficients. The pressure coefficients were referenced to the middle height h of the model panel (see Fig. 15). Once the velocity was gotten the q reference was calculated by using the equation q reference = ½ρV². The q reference value was used in order to calculate the pressure coefficients (C p ) value for each pressure measured; it was done by simply dividing the pressure measured by the q reference value. Figure 15 Wind profile, and reference height definition. 27
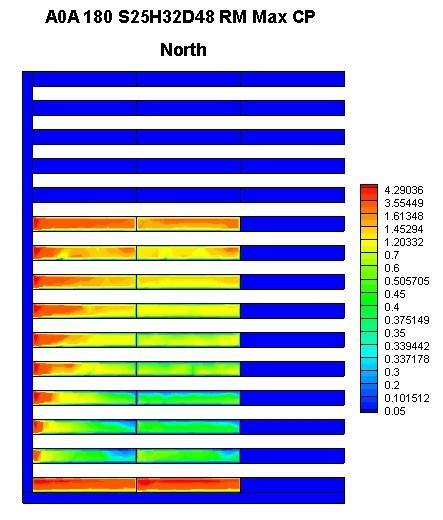
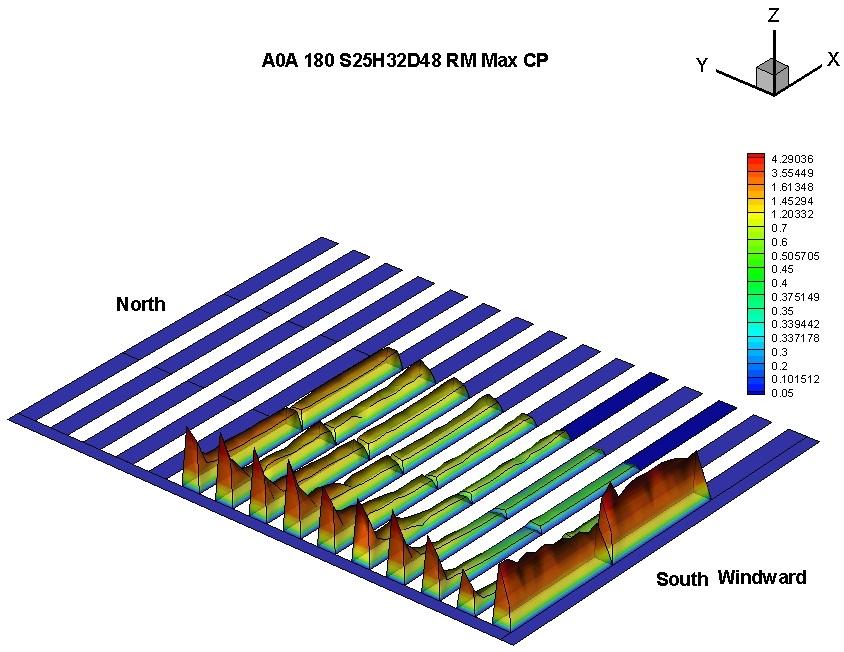
39 Once the C p values were calculated for each tap a net C p value was calculated by adding both the C p value for the tap on the top, and the C p value for the tap on the bottom surface. A statistical analysis was performed after. The statistical analysis resulted in valuable information that explicitly shows the maximum C p, the minimum C p, and the mean C p for each pressure measurement point (taps) on the solar panel Single Ground Mounted Solar Panel As it has been previously mentioned, the data obtained for the Single Ground Mounted solar panel included the four variables: Wind Profile (Open or Sub), height of the support, slope of the panel, the wind direction (AoA); also three main statistical analyses were done with the C P value obtained from the pressure analysis: Maximum (Net), Minimum (Net), and Average Net C P value. The net value was obtained by adding the top and bottom tap measurement (vector addition) at each measuring points as defined in Fig. 4. Parametric analysis of the wind load on the single ground mounted solar panel was made by fixing one of the variables, and performing a comparative analysis on the others. Comparative analysis of the wind load on the single ground mounted solar panel includes: different AoA; the same AoA (worst cases) but for different heights of the support (H); the same AoA (worst cases) but for different slopes (S); and the same AoA (worst cases) but for different Wind Profiles (Open, Suburban) Variation of wind pressure coefficients with wind angle of attack (AoA) A solar panel with a slope of 25 degrees, and H = 32in was selected to show the variation of the pressure coefficients for different wind AoA. This slope was selected as it is more representative for South Florida s latitude. Figures 15 and 16 28

40 show the net C p three dimensional plots for the solar panels with 25 0 slope and for wind AoAs of 0 0 to AoA of at 45 0 steps. These figures (i.e. Figs 16a to h) are explicitly showing the effect of the variation of the AoA on the solar panels C P value. The worst wind AoAs appears to be 45 0, and Wind AoA of which is symmetrical with 45 0 is also critical. AoA 0 0 and AoA 45 0 AoA 90 0 and AoA
 90 o (d) 135 0 (e) 180 0 (f) 225 0 (g) 270 o, and (h) 315 o wind AoAs.")
41 AoA and AoA Figure 16 Maximum Cp Plots for (a) 0 o (b) 45 o (c) 90 o (d) (e) (f) (g) 270 o, and (h) 315 o wind AoAs. 30
42 AoA and AoA
 27")
43 Figure 17 Minimum Cp Plots for (a) 0 o (b) 45 o (c) 90 o (d) (e) (f) (g) 270 o, and (h) 315 o wind AoAs Effects of support heights (H) on wind pressure coefficients To study the effects of support height the worst wind AoAs, and 45 0 for the three different support heights (H=12, 24, and 32 in) were considered. Figures 18a and 18b show both the mean and the maximum C P value for an AoA of 180 0, the slope of the panel was 25 degrees and the wind profile was open. Figures 19a and 32


44 19b show both the mean and the maximum C P value for an AOA of 45 0, the slope of the panel was 25 degrees and the wind profile was open. The three dimensional contour comparison both for 45 0 and wind AoAs clearly shows no major variations for the different heights of the support. Thus it can be concluded that the support height does not have significant effect on wind loads for support height variations similar to the present case. (a) (b) Figure 18 (a) Mean Cp for H12, H24, and H32 and wind AoA 1800 and (b) maximum Cp for H12, H24, and H32 and wind AoA
 Maximum Cp for H12, H24, and H32")
 On Wind Pressure Coefficients To study the effects of solar panel slope, the")
45 (a) (b) Figure 19 (a) Mean Cp for H12, H24, and H32 and wind AoA 45 0 and (b) Maximum Cp for H12, H24, and H32 and wind AoA Effects of Solar Panel Slope (S10, 20, 25, 30 And 40) On Wind Pressure Coefficients To study the effects of solar panel slope, the worst wind AoAs, 45 0 and for a case with support height H=32in were considered. Figures 20 and 21 show both the mean and the maximum CP value for an AOA of 45 0 and 180 0, respectively. The slope of the solar panels was 25 degrees and the wind profile was open. 34
, and")
.")
 and (b)")

46 (a) (b) Figure 20 (a) Mean Cp for S10, S20, S25, S30 and S40 and wind AoA 1800 (open terrain), and (b)maximum Cp for S10, S20, S25, S30 and S40 and wind AoA 1800 (open terrain). (a) (b) Figure 21 (a) Mean Cp for S10, S20, S25, S30 and S40 and wind AoA 450(open terrain) and (b) maximum Cp for S10, S20, S25, S30 and S40 and wind AoA 450.It was clearly shown an increase in the Cp values from the slope 0 to the slope
 on wind pressure coefficients To study the effects of upstream exposure the worst wind AoAs, 45 0 and 180 0 for a case with support height H=32 in")

47 Effects of upstream exposure (open vs. suburban) on wind pressure coefficients To study the effects of upstream exposure the worst wind AoAs, 45 0 and for a case with support height H=32 in and a slope of 25 0 were considered. Figures 22a and 22b show comparisons between open and suburban maximum and minimum CP value for an AoA of 45 0 and 180 0, respectively. (a) (b) Figure 22 Variation of the average CP for different open and suburban profiles (a) 45 0 and (b) AoA. Within the figures above the suburban profile shown higher C P values Solar panel array: study wind tunnel model and instrumentation 36
48 Ground- mounted solar pane array As it has been previously mentioned the data obtained for the Ground Mounted solar panel arrays included three variables: (i) the wind direction (AoA), (ii) Longitudinal distance between the solar panel, and (iii) lateral gap between the solar panel Variation of wind pressure coefficients with wind angle of attack (AOA) A solar panel with a slope of 25 0, and H = 32in and zero longitudinal distance between the solar arrays was selected to show the variation of the pressure coefficients for four different wind AoA (0 0, 180 0, and ). As mentioned before, this slope was selected as it is more representative for South Florida s latitude. Figures 23a, 23b, 23c and 23d show the net C p contours for wind AOAs 0 0 to AOA 320 0, and

49 (a) 38
50 (b) 39
51 (c) 40
52 (d) Figure 23 Net Cp contours for wind AOAs (a) 00 (b) 315 0, (c) and (d) Effects of longitudinal distance between the arrays on Cp values A solar panel with a slope of 25 0, and H = 32in was selected to show the effect of longitudinal distance on the pressure coefficients for four different wind AoA (0 0, 180 0, and ). Three different longitudinal distances between each panel to represent 24, 48 and 72 inches at full scale were investigated (refer Fig. 7). Figures 24a, 24b, 23c show the net C p contours for longitudinal gap of 24, 48 and 72 41

53 respectively for AoA 0 0. Figures 25a to c show the same C p contours but for to AOA Figures 26a to c show the same C p contours but for AoA From figures 26a to figure c the same C p contours but for AoA (a) Figures 24 Ground-mounted arrays: net Cp contours for longitudinal gap (a) 24 in, (b) 48 in and (c) 72 and AoA
54 (a) Figures 25 Ground-mounted arrays: Net Cp contours for longitudinal gap (a) 24 in, (b) 48 in and (c) 72 and AoA
 24 in, (b) 48 in and (c) 72 and AoA 180")
55 (b) Figures 26 Ground-mounted arrays: Net Cp contours for longitudinal gap (a) 24 in, (b) 48 in and (c) 72 and AoA
56 (b) Figures 27 Ground-mounted array: net Cp contours for longitudinal gap (a) 24 in, (b) 48 in and (c) 72 and AoA Effects of Lateral gap between the solar panel on Cp values A solar panel with a slope of 25 0, and H = 32 in was selected to show the effect of longitudinal distance on the pressure coefficients for four different wind AoA (0 0, 180 0, and ). Three different longitudinal distances between each 45

57 panel to represent 0, 32 and 72 inches at full scale were investigated (refer Fig. 7). Figures 28a, 28b, 28c show the net Cp contours for lateral gaps of 0, 32 and 72 respectively for AoA 0 0. Figures 29a to c show the same C p contours but for to AOA Figures 30a to c show the same C p contours but for AoA From figure 31(a) to figure (c) the same C p contours but for AoA are shown. (a) Figures 28 Ground-mounted array: net Cp contours for lateral gap (a) 0 in, (b) 32 in and (c) 72 and AoA
 0 in, (b) 32 in and (c) 72 and AoA 315 0.")
58 (a) Figure 29 Ground-mounted array: net Cp contours for lateral gap (a) 0 in, (b) 32 in and (c) 72 and AoA
59 (a) Figures 30 Ground-mounted array: net Cp contours for lateral gap (a) 0 in, (b) 32 in and (c) 72 and AoA

60 (a) 49
 0 in, (b) 32 in and (c) 72 and AoA 215 0.")
61 (a) Figure 31 Ground-mounted arrays: net Cp contours for lateral gap (a) 0 in, (b) 32 in and (c) 72 and AoA
62 Roof Mounted solar panels array As it has been previously mentioned, the data obtained for the roofmounted solar panel arrays included two variables: (i) the wind AoA, (ii) roof perimeter gap Variation of wind pressure coefficients with wind angle of attack (AoA) A solar panel with a slope of 25 0, and H = 32 in and zero roof perimeter gap was selected to show the variation of the pressure coefficients for four different wind AoA (0 0, 180 0, and ). 51

63 52
64 Figure 24 32a, 32b, 32c and 32d show the net Cp contours for wind AOAs 0 0 to AOA 3150, and and zero perimeter gap Effects of roof perimeter gap on Cp values A solar panel with a slope of 25 0, and H = 32 in was selected to show the effect of longitudinal distance on the pressure coefficients for four different wind AoA (0 0, 180 0, and ). Three different roof perimeter gaps to represent 0, 36 and 72 inches at full scale were investigated (refer Fig. 7). Figures 33a, 33b, 33c show the net C p contours for lateral gaps of 0, 36 and 72 respectively for AOA 0 0. Figures 34a to c show the same C p contours but for to AOA Figures 35a to c show the same C p contours but for AoA From figures 36a to figure c the same C p contours but for AoA
65 54 (a)

66 55 (b)

 72 and AoA 0 0.")
67 (c) Figure 33 Roof-mounted arrays: net Cp contours for roof perimeter (a) 0 in, (b) 36 in and (c) 72 and AoA 0 0. (c) 56


68 57 a)(a)

 72 and AoA 315 0.")
69 (b) Figure 34 Roof-mounted arrays: net Cp contours for roof perimeter (a) 0 in, (b) 36 in and (c) 72 and AoA (c) 58
70 (a) Figure 35 Roof-mounted arrays: net Cp contours for roof perimeter (a) 0 in, (b) 36 in and (c) 72 and AoA

71 60
72 61 (b)

73 62 (c)
74 (a) Figures 36 Roof-mounted arrays: net Cp contours for roof perimeter (a) 0 in, (b) 36 in and (c) 72 and AoA CONCLUSIONS AND RECOMMENDATIONS By using Boundary Layer Wind Tunnel testing techniques, the present study evaluates the effects of wind on solar panels, and provides explicit and reliable information on design wind loads in the forms of pressure coefficient value. The study considered both, two different types of solar panels arrangements, isolated solar panel and arrays, and two different mounting locations, ground mounted and roof mounted. Detailed design wind load 63
75 information was produced as part of this study for isolated and arrayed solar panels. Some of the observations include the following: For isolated solar panels, the wind load on high sloped ones for wind AoA perpendicular to the main axis exhibited the largest wind loads. For arrays, while the outer rows and column were subjected to high wind loads for AoA perpendicular to the main axis, the interior solar panels were subjected to higher loads for oblique AoA. For the isolated solar panels a major variations were found in C p values as a result of both, the different AoA, and different slopes of the panel. A considerable variation in the C p values was also observed as a result of the solar panel terrain exposure. However no major variation was found as a result of the solar panel support height. For the ground mounted arrays, the solar panels major variations were found in C p values as a result of the different AoA. A considerable variation in the C p values was also observed as a result of both; the longitudinal distance between the arrays, and the lateral gap between the solar panels. For the roof mounted arrays, the solar panels major variations were found in C p values as a result of the different AoA. A considerable variation in the C p values was also observed as a result of the perimeter gap around the solar panels. 64
Wind Pressures on Solar Panels Mounted on Residential Homes
 The 22 World Congress on Advances in Civil, Environmental, and Materials Research (ACEM 2) Seoul, Korea, August 26-3, 22 Wind Pressures on Solar Panels Mounted on Residential Homes Aly Mousaad ALY ) and
DYNAMIC WIND LOADING OF H-SHAPED TALL BUILDINGS
 The Seventh Asia-Pacific Conference on Wind Engineering, November 8-12, 2009, Taipei, Taiwan DYNAMIC WIND LOADING OF H-SHAPED TALL BUILDINGS K. M. Lam 1, S. Y. Wong 1 and A. P. To 2 1 Department of Civil
THE PREDICTION OF WIND LOADS ON BUILDING ATTACHMENTS
 THE PREDICTION OF WIND LOADS ON BUILDING ATTACHMENTS C. Mans 1, G. A. Kopp, D. Surry Boundary Layer Wind Tunnel Laboratory The University of Western Ontario, London, Ontario, Canada, N6A 5B9 1 Corresponding
Wind Loads on Rooftop Solar Panel Systems: A Contribution to NBCC 2015
 Wind Loads on Rooftop Solar Panel Systems: A Contribution to NBCC 5 Ted Stathopoulos a, Eleni Xypnitou a, Ioannis Zisis b a Department of Building, Civil and Environmental Engineering, Concordia University,
AREA-AVERAGED CHARACTERISTICS OF WIND LOADS ON ROOF-MOUNTED SOLAR ARRAYS
 The Eighth Asia-Pacific Conference on Wind Engineering, December 4, 3, Chennai, India AREA-AVERAGED CHARACTERISTICS OF WIND LOADS ON ROOF-MOUNTED SOLAR ARRAYS Jinxin Cao, Yukio Tamura, Akihito Yoshida
Photovoltaic (PV) Arrays
 Arrays") y l n O s r e b m e M S H n B o I i t r u b Fo i r t s i D l a n r e t x E Not for Photovoltaic (PV) Arrays Wind Performance of Ballasted PV Arrays on Low-Slope Commercial Roofs October 2015 Executive
y l n O s r e b m e M S H n B o I i t r u b Fo i r t s i D l a n r e t x E Not for Photovoltaic (PV) Arrays Wind Performance of Ballasted PV Arrays on Low-Slope Commercial Roofs October 2015 Executive
Wind loads at solar and photovoltaic modules for large plants
 Ruscheweyh Consult GmbH Aachen Veröffentlichung Wind loads at solar and photovoltaic modules for large plants Hans Ruscheweyh, Reiner Windhövel Ruscheweyh Consult GmbH, Teichstr. 8, Aachen, Germany, info@ruscheweyh.de
Wind Loads Acting on Solar Panels in a Row by CFD Analysis
 Wind Loads Acting on Solar Panels in a Row by CFD Analysis Veysel Emre Uslu 1), Oguz Uzol 2) and * Afsin Saritas 3) 1), 3) Dept. of Civil Eng., Middle East Technical University, Ankara 06800, Turkey 2)
WIND LOADS ON SOLAR PANEL SYSTEMS ATTACHED TO BUILDING ROOFS. Eleni Xypnitou. A Thesis. The Department. Building, Civil and Environmental Engineering
 WIND LOADS ON SOLAR PANEL SYSTEMS ATTACHED TO BUILDING ROOFS Eleni Xypnitou A Thesis In The Department of Building, Civil and Environmental Engineering Presented in Partial Fulfillment of the Requirements
Addition. Wind Loads on Rooftop Solar Panels , At a Glance Standard. Wind Loads on Rooftop Solar Panels
 Wind Loads on Rooftop Solar Panels 29.4.3, 29.4.4 At a Glance New provisions for determining wind loads on solar panels on buildings have been added to ASCE 7-16. One method applies specifically to low-sloped
WIND LOADS ON BUILDINGS MWFRS (ENVELOPE PROCEDURE)
") Chapter C28 WIND LOADS ON BUILDINGS MWFRS (ENVELOPE PROCEDURE) The Envelope Procedure is the former low-rise buildings provision in Method 2 of ASCE 7-05 for MWFRS. The simplified method in this chapter
Chapter C28 WIND LOADS ON BUILDINGS MWFRS (ENVELOPE PROCEDURE) The Envelope Procedure is the former low-rise buildings provision in Method 2 of ASCE 7-05 for MWFRS. The simplified method in this chapter
Local and overall wind pressure and force coefficients for solar panels
 Local and overall wind pressure and force coefficients for solar panels Ted Stathopoulos, Ioannis Zisis 2, Eleni Xypnitou Department of Building, Civil and Environmental Engineering, Concordia University,
PARAMETRIC CFD WIND FORCE ANALYSIS ON A RESIDENTIAL ROOF MOUNTED PHOTOVOLTAIC PANEL
 PARAMETRIC CFD WIND FORCE ANALYSIS ON A RESIDENTIAL ROOF MOUNTED PHOTOVOLTAIC PANEL Caption: CFD simulation of wind force on photovoltaic roof mounted panel OBJECTIVE Our client was in the process of installing
Performance of the Acrylife Roof Vent
 Performance of the Acrylife Roof Vent Murray J. Morrison, PhD, Anne D. Cope, PhD, P.E., Timothy A. Reinhold, PhD, P.E. Report: IBHS-12XX01 August 31, 2012 Prepared for: Acrylife 1165 Stafford Umberger
ASCE 7-16: Changes to Wind Calculations for Rooftop Solar
 ASCE 7-16: Changes to Wind Calculations for Rooftop Solar Joe Cain, P.E. Chair, SEIA Codes & Standards Working Group David Banks, PhD, P.Eng Principal Cermak Peterka Petersen (CPP) ASCE 7-16: Changes to
Benchmark Buildings for an International HFBB Comparison
 Benchmark Buildings for an International HFBB Comparison Introduction The High Frequency Base Balance (HFBB) (also known as the High-Frequency Force Balance (HFFB)), has been widely used as a wind-tunnel
WIND LOADS ON BALUSTRADES. Antonios W. Rofail a, Christian Mans a
 WIND LOADS ON BALUSTRADES Antonios W. Rofail a, Christian Mans a a Windtech Consultants, 19 Willis Street, Wolli Creek, NSW, Australia ABSTRACT: This paper examines the wind loading on impermeable balustrade
International Journal of Advanced Engineering Technology E-ISSN
 International Journal of Advanced Engineering Technology E-ISSN 0976-3945 Research Article WIND INTERFERENCE ON SINGLE SIMILAR GABLE ROOF BUILDING WITH OVERHANGS Narayan K a *, Gairola A b Address for
Wind loads on solar panels mounted on flat rooftops: Progress and limitations
 Wind loads on solar panels mounted on flat rooftops: Progress and limitations Zhitian Zhang 1)* and *Ted Stathopoulos 2) 1) Wind Engineering Research Center, Hunan University, Changsha, China 2) Department
WIND FLOW IN THE RECESSED CAVITIES OF A TALL
 The Seventh Asia-Pacific Conference on Wind Engineering, November 8-12, 2009, Taipei, Taiwan WIND FLOW IN THE RECESSED CAVITIES OF A TALL BUILDING Charles C.K. Cheng 1, K.M. Lam 2 and Andrew Y.T. Leung
Flow Visualization and Wind Uplift Analysis of a Suspended Solar Water Heater
 Available online at www.sciencedirect.com Procedia Engineering 31 (2012) 3 8 International Conference on Advances in Computational Modeling and Simulation Flow Visualization and Wind Uplift Analysis of
Wind loads on solar energy roofs
 Wind loads on solar energy roofs Chris P.W. Geurts, Carine A. van Bentum TNO Built Environment and Geosciences, Delft, the Netherlands This paper presents an overview of the wind loads on roofs, equipped
The Bridge and Wind Engineering Teacher Workshop
 The Bridge and Wind Engineering Teacher Workshop Prepared by Arindam Gan Chowdhury (FIU IHRC and CEE) Click to OPEN Presented by Jimmy Erwin July 26, 2016 BUILDING CODES FOR SOUTH FLORIDA South Florida
Multi-scale methodology to assess wind loads on building louvers
 8 th International Colloquium on Bluff Body Aerodynamics and Applications Northeastern University, Boston, Massachusetts, USA June 7-11, 2016 BBAA VIII Multi-scale methodology to assess wind loads on building
Journal of Wind Engineering and Industrial Aerodynamics
 J. Wind Eng. Ind. Aerodyn. ( ) Contents lists available at ScienceDirect Journal of Wind Engineering and Industrial Aerodynamics journal homepage: www.elsevier.com/locate/jweia The role of corner vortices
Interference of Wind Turbines with Different Yaw Angles of the Upstream Wind Turbine
 42nd AIAA Fluid Dynamics Conference and Exhibit 25-28 June 2012, New Orleans, Louisiana AIAA 2012-2719 Interference of Wind Turbines with Different Yaw Angles of the Upstream Wind Turbine Ahmet Ozbay 1,
FEM ANALYSIS OF TILE ROOFS UNDER SIMULATED TYPHOON IMPACT
 The Seventh Asia-Pacific Conference on Wind Engineering, November 8-12, 29, Taipei, Taiwan FEM ANALYSIS OF TILE ROOFS UNDER SIMULATED TYPHOON IMPACT Peng Huang 1, Ming Gu 2, Amir Mirmiran 3, Arindam Gan
CFD and Wind Tunnel Study of the Performance of a Multi- Directional Wind Tower with Heat Transfer Devices
 Available online at www.sciencedirect.com ScienceDirect Energy Procedia 75 (2015 ) 1692 1697 The 7 th International Conference on Applied Energy ICAE2015 CFD and Wind Tunnel Study of the Performance of
Expert statement on the wind loads impacting solar modules with different inclinations from below
 Dr. Zapfe GmbH Engineering office for constructive engineering and solar planning Dr.-Ing. Cedrik Zapfe Mobile: 0176 19191280 E-Mail: cedrik.zapfe@ing-zapfe.de Alustraße 1 83527 Kirchdorf/Haag i.ob, GERMANY
Performance Analysis for Natural Draught Cooling Tower & Chimney through Numerical Simulation
 Performance Analysis for Natural Draught Cooling Tower & Chimney through Numerical Simulation Kanteyya A 1, Kiran Kumar Rokhade 2 Assistant Professor, Department of Mechanical Engineering, HKESSLN College
CFD/FEM Based Analysis Framework for Wind Effects on Tall Buildings in Urban Areas
 2017 2nd International Conference on Industrial Aerodynamics (ICIA 2017) ISBN: 978-1-60595-481-3 CFD/FEM Based Analysis Framework for Wind Effects on Tall Buildings in Urban Areas Qiao Yan, Dalong Li,
APPLYING COMPUTATIONAL FLUID DYNAMICS TO ARCHITEC- TURAL DESIGN DEVELOPMENT
 APPLYING COMPUTATIONAL FLUID DYNAMICS TO ARCHITEC- TURAL DESIGN DEVELOPMENT Strategy and Implementation JIN-YEU TSOU Department of Architecture, Chinese University of Hong Kong Sha Tin, New Territories,
SET PROJECT STRUCTURAL ANALYSIS OF A TROUGH MODULE STRUCTURE, IN OPERATION AND EMERGENCY Luca Massidda
 SET PROJECT STRUCTURAL ANALYSIS OF A TROUGH MODULE STRUCTURE, IN OPERATION AND EMERGENCY Luca Massidda Table of Contents Introduction... 2 Finite element analysis... 3 Model description... 3 Mirrors...
INVESTIGATIONS ON PERFORMANCE OF A SAVONIUS HYDROKINETIC TURBINE
 INVESTIGATIONS ON PERFORMANCE OF A SAVONIUS HYDROKINETIC TURBINE Ph.D. THESIS by ANUJ KUMAR ALTERNATE HYDRO ENERGY CENTRE INDIAN INSTITUTE OF TECHNOLOGY ROORKEE ROORKEE-247667 (INDIA) AUGUST, 2017 INVESTIGATIONS
LOCAL WIND LOADS ON ROOF-MOUNTED SOLAR ENERGY SYSTEMS
 LOCAL WIND LOADS ON ROOF-MOUNTED SOLAR ENERGY SYSTEMS Chris P.W. Geurts a,b, Carine A. van Bentum b a Architecture Building and Planning, Eindhoven University of Technology, the Netherlands b TNO, Delft,
Optimization of Wind Loads Affecting Skyscrapers using ANSYS
 Optimization of Wind Loads Affecting Skyscrapers using ANSYS Kavana B C 1, M S kalappa 2 1MTech student, dept of civil Engineering, MCE, Hassan, Karnataka, India 2Professor, dept of civil Engineering,
ASSESSMENT OF AIR CHANGE RATE AND CONTRIBUTION RATIO IN IDEALIZED URBAN CANOPY LAYERS BY TRACER GAS SIMULATIONS
 Topic B4: Ventilation ASSESSMENT OF AIR CHANGE RATE AND CONTRIBUTION RATIO IN IDEALIZED URBAN CANOPY LAYERS BY TRACER GAS SIMULATIONS Qun WANG 1, Mats SANDBERG 2, Jian HANG 1* 1 Department of Atmospheric
Local wind loads on roof-mounted solar energy systems
 Local wind loads on roof-mounted solar energy systems Geurts, C.P.W.; Bentum, van, C.A. Published in: Recent advances in research on environmental effects on buildings and people Published: 01/01/2010
2012 Wood Frame Construction Manual: Wind Speed and Design Pressure Determination According to ASCE 7 10
 2012 Wood Frame Construction Manual: Wind Speed and Design Pressure Determination According to ASCE 7 10 Presented by: William L. Coulbourne, PE Copyright Materials This presentation is protected by US
Performance Evaluation of Natural Ventilation Devices to Improve Thermal Comfort of a Computer Lab of University Building Using CFD as a Tool
 From the SelectedWorks of Innovative Research Publications IRP India Spring March 1, 2015 Performance Evaluation of Natural Ventilation Devices to Improve Thermal Comfort of a Computer Lab of University
Dynamic Time-history Analysis on Wind-induced Response of Light-weight Roof System
 Missouri University of Science and Technology Scholars' Mine International Specialty Conference on Cold- Formed Steel Structures (2012) - 21st International Specialty Conference on Cold-Formed Steel Structures
A New Analytical Approach to Improving the Aerodynamic Performance of the Gyromill Wind Turbine
 A New Analytical Approach to Improving the Aerodynamic Performance of the Gyromill Wind Turbine Eiji Ejiri 1,*, Tomoya Iwadate 2 1 Department of Mechanical Science and Engineering, Chiba Institute of Technology,
ANALYSIS AND MITIGATION OF THERMAL EFFECTS ON A LARGE FACADE-MOUNTED PV ARRAY
 ANALYSIS AND MITIGATION OF THERMAL EFFECTS ON A LARGE FACADE-MOUNTED PV ARRAY A. Driesse 1, S. J. Harrison 2, Q. Lin 2 1 Queen's University, Integrated Learning Center, Kingston, ON, Canada; 2 Queen's
Analysis of Wind Loads on Buildings and Signs: A Computer Program Based on ASCE 7
 Analysis of Wind Loads on Buildings and Signs: A Computer Program Based on ASCE 7 Dr. H. Estrada* (corresponding author) and Y. Chiu* *Civil Engineering Program Texas A&M University Kingsville MSC 194
Can we build disaster resilient communties? A new look at wind effects on houses
 Can we build disaster resilient communties? A new look at wind effects on houses Can we build disaster resilient communties? A new look at wind effects on houses Gregory A. Kopp Boundary Layer Wind Tunnel
Effects of Neighboring Building on Wind Loads
 ctbuh.org/papers Title: Authors: Subject: Keywords: Effects of Neighboring uilding on Loads Kangpyo Cho, Assistant Professor, Wonkwang University Sungil Hong, Senior Researcher, Wonkwang University Kyu-Seok
Physical and Numerical Visualizations of Unsteady Separated Flows Separated Flows
 Physical and Numerical Visualizations of Unsteady Separated Flows Separated Flows Fathi Finaish Department of Mechanical and Aerospace Engineering Missouri University of Science and Technology Great Midwestern
G.Muttrah Commercial & Residential Complex Muscat, Sultanate of Oman
 G.Muttrah Commercial & Residential Complex Muscat, Sultanate of Oman Technical Report III Samir Al-Azri Structural Option Consultant: December 1 st, 2009 Page 1 Table of Contents I. Executive summary.
DynoRaxx EVOLUTION PR Guide to Code Compliant Installation
 DynoRaxx EVOLUTION PR Guide to Code Compliant Installation Publication Number 100611 866.620.2410 dynoraxx.com Table of Contents I. Installer Responsibilities... 3 II. Simplified Procedure for Calculating
Wind-induced Pressures on Patio Covers
 Wind-induced Pressures on Patio Covers by Ioannis Zisis 1 and Ted Stathopoulos 2, F.ASCE CE Database Keywords: wind tunnel tests, wind loads, low-rise buildings, load distribution standards and codes.
Wedging Angle Effect on the Aerodynamic Structure of a Rutland 913 Horizontal Axis Wind Turbine
 International Journal of Fluid Mechanics & Thermal Sciences 2016; 2(1): 1-9 http://www.sciencepublishinggroup.com/j/ijfmts doi: 10.11648/j.ijfmts.20160201.11 ISSN: 2469-8105 (Print); ISSN: 2469-8113 (Online)
THERMAL ANALYSIS OF A FACADE-MOUNTED PV ARRAY
 SESCI 23 CONFERENCE Queen's University Kingston, Ontario, Canada August 18 to 2, 23 THERMAL ANALYSIS OF A FACADE-MOUNTED PV ARRAY S. J. Harrison 1, A. Driesse 2, Q. Lin 1 1 Queen's University, Solar Calorimetry
boundary layer wind flow. Measured wind pressures were expanded from limited measurement points to all the structural nodes using the orthonormal coor
 Internal stresses in cladding support members of long-span arched roof under wind load hibin Ding a, Yukio Tamura a, Akihito Yoshida a a Tokyo Polytechnic University, Iiyama 1583, Atsugi, Kanagawa, Japan
Three-Dimensional Numerical Simulation of a Model Wind Turbine
 Three-Dimensional Numerical Simulation of a Model Wind Turbine N. Tabatabaei 1, M.J. Cervantes 1,2, C. Trivedi 2, J-O Aidanpää 1 1 Luleå University of Technology, Sweden 2 Norwegian University of Science
INFLUENCE OF HEAT SOURCE LOCATION ON AIR TEMPERATURES IN SEALED MV SWITCHGEAR
 INFLUENCE OF HEAT SOURCE LOCATION ON AIR TEMPERATURES IN SEALED MV SWITCHGEAR Elin FJELD Wilhelm RONDEEL Knut VAAGSAETHER Univ.Coll. of Southeast Norway USN Norway USN - Norway elin.fjeld@usn.no wilhelm.rondeel@usn.no
Wind Impact on Textile Structures
 Wind Impact on Textile Structures J. Wacker TensiNet Symposium, Newcastle, UK, 26 th 28 th of October 2016 About Wacker Ingenieure, Wind Engineering Office in Birkenfeld, Germany 3 own wind tunnels Own
School of Engineering and Applied Science Building Miami University, Oxford, OH Technical Assignment 3 December 3, 2007
 School of Engineering and Applied Science Building Miami University, Oxford, OH Technical Assignment 3 December 3, 2007 Jonathan Kirk AE 481W Senior Thesis The Pennsylvania State University Faculty Advisor:
PROPOSED CHANGE TO THE 2012 BUILDING CODE O. REG. 332/12 AS AMENDED
 Ministry of Municipal Affairs PROPOSED CHANGE TO THE 2012 BUILDING CODE O. REG. 332/12 AS AMENDED CHANGE NUMBER: SOURCE: B-04-01-11 Ontario-NBC CODE REFERENCE: Division B / 4.1.7. DESCRIPTION OF THE PROPOSED
Minimum slab thickness of RC slab to prevent undesirable floor vibration. Technology, Dhaka-1000, Bangladesh. 2.
 Minimum slab thickness of RC slab to prevent undesirable floor vibration Mohammad Rakibul Islam Khan 1, *Zafrul Hakim Khan 2,Mohammad Fahim Raiyan 3 and Khan Mahmud Amanat 4 1, 2, 3, 4 Department of Civil
Dynamic optimization for the wind-induced response of a tall building
 Dynamic optimization for the wind-induced response of a tall building Workamaw Warsido 1, Ryan Merrick 2 Girma Bitsuamalk 3, 1 Research Assistant, Civil and Environmental Engineering department (CEE),
Visualization of the tip vortices in a wind turbine wake
 J Vis (2012) 15:39 44 DOI 10.1007/s12650-011-0112-z SHORT PAPER Zifeng Yang Partha Sarkar Hui Hu Visualization of the tip vortices in a wind turbine wake Received: 30 December 2010 / Revised: 19 September
Terrain classification and exposure factor in the 2005 National Building Code of Canada
 Terrain classification and exposure factor in the 25 National Building Code of Canada Ted Stathopoulos a, Ioannis Zisis a, Kai Wang b a Concordia University, 55 St. Catherine W., Montreal, Canada b formerly
A COMPARETIVE ANALYSIS OF AERODYNAMIC CHARECTERISTICS OF A VERTICAL AXIS VANE TYPE WIND TURBINE OVER EVEN AND ODD NUMBER OF BLADES
 A comparetive analysis of aerodynamic charecteristics of a vertical axis vane type wind turbine 14 A COMPARETIVE ANALYSIS OF AERODYNAMIC CHARECTERISTICS OF A VERTICAL AXIS VANE TYPE WIND TURBINE OVER EVEN
EXPERIMENTAL INVESTIGATION OF DOWNSTREAM FLOW FIELD IN A LINEAR TURBINE CASCADE: EFFECTS OF RELATIVE WALL MOTION
 EXPERIMENTAL INVESTIGATION OF DOWNSTREAM FLOW FIELD IN A LINEAR TURBINE CASCADE: EFFECTS OF RELATIVE WALL MOTION V. Uma Maheshwar, Associate Professor, Dept of Mechanical Engineering, University College
Numerical Investigation of Air Flow and Temperature Distribution in a Trombe Wall System: A CFD Study
 Numerical Investigation of Air Flow and Temperature Distribution in a Trombe Wall System: A CFD Study Bharath V #1, Puneeth Kumar M V #2, Preetham B M #3, Shashikanth *4 # 1-3 Department of Mechanical
Sensitivity Analysis of Personal Exposure Assessment Using a Computer Simulated Person Brohus, Henrik; Jensen, H. K.
 Aalborg Universitet Sensitivity Analysis of Personal Exposure Assessment Using a Computer Simulated Person Brohus, Henrik; Jensen, H. K. Published in: Healthy Buildings 2009 Publication date: 2009 Document
TREES IN URBAN STREET CANYONS AND THEIR IMPACT ON THE DISPERSION OF AUTOMOBILE EXHAUSTS. Christof Gromke*, Bodo Ruck
 TREES IN URBAN STREET CANYONS AND THEIR IMPACT ON THE DISPERSION OF AUTOMOBILE EXHAUSTS Christof Gromke*, Bodo Ruck Laboratory of Building- and Environmental Aerodynamics Institute for Hydromechanics,
Wind driven flow through building openings
 International Conference Passive and Low Energy Cooling 427 for the Built Environment, May 25, Santorini, Greece Wind driven flow through building openings P. Karava, T. Stathopoulos and A.K. Athienitis
Drexel University Race Street Dormitory REVISED THESIS PROPOSAL Doug Tower Structural Advisor: Kevin Parfitt 2/7/07
 Drexel University Race Street Dormitory REVISED THESIS PROPOSAL Doug Tower Structural Advisor: Kevin Parfitt 2/7/07 Table of Contents I. Executive Summary... 3 II. Introduction... 4 III. Background...
Broward County Advantage Marketing Program In-Kind Exchange Agreement
 Broward County Advantage Marketing Program In-Kind Exchange Agreement PROJECT: AGENCY: TITLE: Go SOLAR - Broward Rooftop Solar Challenge Broward County Environmental Planning and Growth Management Department
Dr. J. Wolters. FZJ-ZAT-379 January Forschungszentrum Jülich GmbH, FZJ
 Forschungszentrum Jülich GmbH, FZJ ZAT-Report FZJ-ZAT-379 January 2003 Benchmark Activity on Natural Convection Heat Transfer Enhancement in Mercury with Gas Injection authors Dr. J. Wolters abstract A
Roof Mounted Wind Turbines: The influence of roof shape, building height and urban location on wind speed
 Roof Mounted Wind Turbines: The influence of roof shape, building height and urban location on wind speed ISLAM ABOHELA 1, STEVEN DUDEK 1 and NEVEEN HAMZA 1 1 School of Architecture, Planning and Landscape,
Application of Particle Image Velocimetry in Hydraulic Engineering Research. Michael Horst, Ph.D., P.E., ASCE 1
 Application of Particle Image Velocimetry in Hydraulic Engineering Research Michael Horst, Ph.D., P.E., ASCE 1 Particle Image Velocimetry (PIV) is a non-intrusive method used for ascertaining hydraulic
Wall Pressure Coefficients for Low- to High-Rise Buildings
 Western University Scholarship@Western Electronic Thesis and Dissertation Repository May 2017 Wall Pressure Coefficients for Low- to High-Rise Buildings Emilio S. Hong The University of Western Ontario
Analytical Analysis for Enhancement of Performance and Efficiency for Different Blade of HAWT by Computer Program
 Analytical Analysis for Enhancement of Performance and Efficiency for Different Blade of HAWT by Computer Program 1 Hemant Rav Patel, 2 Dr. V.N. Bartaria, 3 Dr. A.S. Rathore 1 Department of Mechanical
A STUDY ON NUMERICAL SIMULATION ON FLOW-FIELDS & WIND-INDUCED NOISE AROUND BUILDINGS
 The Seventh Asia-Pacific Conference on Wind Engineering, November 8-12, 2009, Taipei, Taiwan A STUDY ON NUMERICAL SIMULATION ON FLOW-FIELDS & WIND-INDUCED NOISE AROUND BUILDINGS Young-duk Kim 1, Yohanes
Schöck Isokorb Type CM
 Schöck Isokorb Type Schöck Isokorb Type The Schöck Isokorb Type is suitable for cantilevered reinforced concrete slabs. (C for concrete slab) It transmits negative moment (M) and positive shear force.
Heat transfer enhancement in fire tube boiler using hellically ribbed tubes
 Heat transfer enhancement in fire tube boiler using hellically ribbed tubes Miss Simantini Balasaheb Kute --------------------------------------------------------***-------------------------------------------------------------
Numerical analysis of eccentric orifice plate using ANSYS Fluent software
 IOP Conference Series: Materials Science and Engineering PAPER OPEN ACCESS Numerical analysis of eccentric orifice plate using ANSYS Fluent software To cite this article: D Zahariea 2016 IOP Conf. Ser.:
Guideline for Fire Safety. Elements of Solar. Photovoltaic Systems
 Guideline for Fire Safety Elements of Solar Photovoltaic Systems July 17, 2008 This document was developed by the Orange County Fire Chiefs Association, Orange County Fire Marshal Committee. It is based
CFD SIMULATION AND EXPERIMENTAL VALIDATION OF FLUID FLOW IN LIQUID DISTRIBUTORS
 CFD SIMULATION AND EXPERIMENTAL VALIDATION OF FLUID FLOW IN LIQUID DISTRIBUTORS Marc Heggemann 1, Sebastian Hirschberg 1, Lothar Spiegel 2, Christian Bachmann 2 1 Sulzer Innotec, Sulzer Markets & Technology
Wind Tunnel Applications for Buildings
 Wind Tunnel Applications for Buildings Presented by: Jim Swanson, Halvorson and Partners Donald Scott, PCS Structural Solutions Jon Galsworthy, RWDI Add Company Logo Here Outline 1. Introduction 2. ASCE7
ASCE 7 10 Wind Code Understanding
 RE: ASCE-7-10 / 60 + Building Coastal Medical Center 123 Carolina Dr Coastal, NC To Whom It May Concern: ASCE 7 10 Wind Code Understanding There is no test in the roofing industry that blows 110 mph winds
CODASC: A DATABASE FOR THE VALIDATION OF STREET CANYON DISPERSION MODELS. Christof Gromke
 CODASC: A DATABASE FOR THE VALIDATION OF STREET CANYON DISPERSION MODELS Christof Gromke Building Physics and Services, Department of the Built Environment, Eindhoven University of Technology, Eindhoven,
LIST OF ACRONYMS / ABBREVIATIONS USED IN THIS DOCUMENT Acronym / abbreviation Definition
 LIST OF ACRONYMS / ABBREVIATIONS USED IN THIS DOCUMENT Acronym / abbreviation Definition ACC CCGT CFD CSP DNI DoW EC GE IP IPR LCA LDA LSV MACC MENA MS/RA PIV PM PTC RANS SME WP WPS WT Air Cooled Condenser
A STUDY ON FLOW BEHAVIOR INSIDE A SIMPLE MODEL OF EJECTOR
 A STUDY ON FLOW BEHAVIOR INSIDE A SIMPLE MODEL OF EJECTOR Taketoshi Koita 1 and Junjiro Iwamoto ABSTRACT This paper is concerned with the experimental results on the internal flow of the ejector. To improve
Wind-Induced Torsional Loads on Low- and Medium-Rise Buildings
 Wind-Induced Torsional Loads on Low- and Medium-Rise Buildings Mohamed Ragab Elsharawy A Thesis In the Department of Building, Civil and Environmental Engineering Presented in Partial Fulfillment of the
Guidelines for Solar Photovoltaic Installation
 WEST COVINA FIRE DEPARTMENT Fire Prevention Bureau 1435 W. Puente Ave. West Covina, CA 91790 (626) 338-8800 Guidelines for Solar Photovoltaic Installation PURPOSE SCOPE TABLE OF CONTENTS..2..2 REQUIREMENTS..2
Investigation of Orion Re-Entry Drogue Chute Aerodynamic Characteristics
 50th AIAA Aerospace Sciences Meeting including the New Horizons Forum and Aerospace Exposition 09-12 January 2012, Nashville, Tennessee AIAA 2012-0270 Investigation of Orion Re-Entry Drogue Chute Aerodynamic
Modelling of air pollution on urban buildings: a wind tunnel study
 Modelling of air pollution on urban buildings: a wind tunnel study A. M. Mfula 1,2, V. Kukadia 1, R. F. Griffiths 2 & D. J. Hall 3 1 Building Research Establishment Ltd (BRE), UK 2 Environmental Technology
Analysis of Shear Wall Transfer Beam Structure LEI KA HOU
 Analysis of Shear Wall Transfer Beam Structure by LEI KA HOU Final Year Project report submitted in partial fulfillment of the requirement of the Degree of Bachelor of Science in Civil Engineering 2013-2014
On The Effect Of Various Design Factors On Wind-Induced Natural Ventilation Of Residential Buildings In Malaysia M. F. Mohamad 1,2*, A. Hagishima 2, J
 On The Effect Of Various Design Factors On Wind-Induced Natural Ventilation Of Residential Buildings In Malaysia M. F. Mohamad 1,2*, A. Hagishima 2, J. Tanimoto 2, N. Ikegaya 2, and A. R. Omar 1 1 Faculty
A study of single-sided ventilation and provision of balconies in the context of high-rise residential buildings
 A study of single-sided ventilation and provision of balconies in the context of high-rise residential buildings Mohamed M. F. 1,2,*, King S. 2, Behnia M. 3, Prasad D. 2 1 Faculty of Engineering and Built
International Journal of Scientific & Engineering Research, Volume 7, Issue 6, June ISSN
 International Journal of Scientific & Engineering Research, Volume 7, Issue 6, June-26 36 DIAGRID STRUCTURAL SYSTEM FOR R.C.FRAMED MULTIED BUILDINGS Harshita Tripathi, Dr. Sarita Singla Abstract- One of
Performance Study of Solar Air Heater with Baffled Duct
 IOSR Journal of Mechanical and Civil Engineering (IOSR-JMCE) ISSN: 2278-1684 Volume 4, Issue 5 (Nov - Dec 2012), PP 52-56 Performance Study of Solar Air Heater with Baffled Duct BK Maheshwari 1, Rajendra
Florida Structural Engineers
 Florida Structural Engineers South Florida Chapter January 8, 2008 Miami Lakes, Florida Aluminum Association of Florida, Inc. Joe Belcher ~ David Miller AAF Code Involvement: Historical Perspective 1998:
Aerodynamic mitigation of wind uplift loads on low-rise buildings. *Aly-Mousaad Aly
 Aerodynamic mitigation of wind uplift loads on low-rise buildings *Aly-Mousaad Aly Department of Civil and Environmental Engineering, Louisiana State University, Baton Rouge, LA 70803, USA aly@lsu.edu
PROPOSED CHANGE TO THE 2012 BUILDING CODE O. REG. 332/12 AS AMENDED
 Ministry of Municipal Affairs PROPOSED CHANGE TO THE 2012 BUILDING CODE O. REG. 332/12 AS AMENDED CHANGE NUMBER: SOURCE: B-04-01-09 Ontario-NBC CODE REFERENCE: Division B / 4.1.6. DESCRIPTION OF THE PROPOSED
Numerical Analysis of Heat Pipe Fin Stack by Delta Wing Vortex Generator
 Numerical Analysis of Heat Pipe Fin Stack by Delta Wing Vortex Generator #1 Diksha D Nadkarni, #2 Dr.R.R.Arakerimath 1 Student, Mechanical Department, Pune University, India 2 Professor, Mechanical Department,
Computational Modelling and Scale Model Validation of Airflow Patterns in Naturally Ventilated Barns
 Computational Modelling and Scale Model Validation of Airflow Patterns in Naturally Ventilated Barns Merlijn De Paepe 1, Jan Pieters 2, Bart Merci 3, Wim Cornelis 4, Donald Gabriels 4 and Peter Demeyer