5/2/13. Zooplankton! Phytoplankton! Nutrients!
|
|
|
- Rafe Copeland
- 6 years ago
- Views:
Transcription

1 Phytoplankton! Zooplankton! Nutrients! 1
2 Phytoplankton! Zooplankton! Critical Depth Recycled Nutrients! Oxidized Nutrients! Detritus! Rest of Ocean Biological and Solubility Pumps 2
3 New (Export) vs. Regenerated Production Redfield (1958) Dugdale & Goering (1967) Eppley & Peterson (1979) Shuter (1979) Fisheries CO 2 Sequestration Nitrate Ammonium Adapted from Chisholm 2000 Assumptions: We have chosen a box large enough to balance out advection and diffusion Everything, on average, is in steady-state Because it is in steady state, we can assume Redfield- Ratios There must be mass balance (nothing appears or disappears) 3
4 Estimating New Production In Vitro 14C Assimilation hours-->day O2 evolution hours-->day 15N measurements hours-->day 18O2 evolution hours-->day Physical Transport Sediment traps days-->months Bulk Property NO3 flux to photic zone hours-->days OUR below photic zone seasonal-->annual 238U/234Th days Other Remote Sensing days-->weighted annual Optimal energy conversion instantaneous Reconciling Time-Space Scales! Steady State? Mass Balance Sediment Traps Incubations FRRF PvsE Source: 4

5 Eppley & Peterson, 1979 Defined the f-ratio Determined that there are worldwide patterns in export production Can estimate export from total productivity IP = P B opt Chl opt z eu t irr I o I o [mg C m-2 d -1 ] P B opt - maximum C fixation rate per unit chlorophyll Chl opt - chlorophyll concentration at the depth of P B opt z eu - euphotic depth t irr - photoperiod I o - surface irradiance Behrenfeld and Falkowski L+O 42:1-20 5
 -1 h -1 7 6 High Light Cells 5 4 3 2 Low Light Cells 1 0 0 500 1000 1500 2000 2500 Irradiance (µmol quanta m -2 s -1 ) But it looks like light kills phytoplankton.")
6 Hypothesis: A large body of evidence leads to the conclusion that light limits the growth of phytoplankton. The distribution of phytoplankton should reflect the distribution of light. Photosynthesis mgc (mg Chl) -1 h High Light Cells Low Light Cells Irradiance (µmol quanta m -2 s -1 ) But it looks like light kills phytoplankton. Hypothesis rejected 6

7 Hypothesis: There is also evidence leads to the conclusion that higher temperatures enhance the growth of phytoplankton. The distribution of phytoplankton should reflect the distribution of surface temperature. Temperature ( o C) SST Looks like phytoplankton have a low boiling point. Hypothesis rejected. 7

8 Well, its not light, not temperature, what could it be? Mar. Aug. Mixed Layer Depths A simple calculation, but a complex interaction. Annual average surface nitrate concentration. Vigorous fluid mixing introduces a net flux of nitrate (read nutrients) into the surface, well-lit layer leading to patterns of biomass (chlorophyll in this case) 8

9 5/2/13 VGPM-derived Carbon Export! Laws et al., 2000 Surface Nutrients Export Note that the highest export is NOT where there are lots of excess nutrients Laws et al.,
,")
10 Large Scale Patterns! Kudela et al., 2005, Oceanography 18: Seasonal Patterns! We will return to this, but globally, we start to see both spatial and seasonal patterns driven by the combination of physics (nutrients, mixing), light, and temperature Kudela et al., 2005, Oceanography 18:
11 New (Export) vs. Regenerated Production Redfield (1958) Dugdale & Goering (1967) Eppley & Peterson (1979) Shuter (1979) Fisheries CO 2 Sequestration Nitrate Ammonium Adapted from Chisholm 2000 New (Export) vs. Regenerated Production Redfield (1958): to first order, all plankton have similar ratios of elements, meaning we can track any element and convert to any other (remember that this also means that ON AVERAGE, phytoplankton are growing optimally, because we deviate from Redfield when nutrient (growth) limited). Dugdale & Goering, 1967: Because of Redfield ratios, we can track one element (N) and take advantage of the fact that nitrate is generally new (exogenous) while ammonium/urea is generally regenerated (endogenous) to a system. At the time, we thought N2 fixation and other sources were negligible. 11
12 New (Export) vs. Regenerated Production Eppley & Peterson (1979): If we integrate over large space and time scales, New Production has to equal Export Production. So we have a simple way of estimating how stable an ecosystem is, how much energy is available for fisheries, etc. Shuter (1979): States that Redfield Ratios for BIOMASS must mean that organisms are taking up elements at the same proportions. In other words, you can track ANY ONE ELEMENT and assume it is representative of GROWTH. Phytoplankton! Zooplankton! Nutrients! Taken together, these concepts allow us to simplify biology. We can track any nutrient (the N box), assume that ON AVERAGE growth and composition are the same (the P box) and relate new/regenerated production to export (the Z box). But we know that is not always how the ocean works. 12
 is in a state of flux, with new organisms and processes being discovered (and unknown global implications) Although there are")
13 Zehr & Kudela, 2011, Annu. Rev. Mar. Sci, 3: Summary Points:! The conceptual N cycle (and therefore new/regenerated production) is in a state of flux, with new organisms and processes being discovered (and unknown global implications) Although there are hypotheses about the global N balance, and how the N cycle may be affected by global climate change, there are too many unconstrained uncertainties and we therefore can only predict the most obvious responses to past or future climate change Zehr & Kudela, 2011, Annu. Rev. Mar. Sci, 3:

 density")
 density of seawater Then we")
 /ρ v Velocity")
14 5/2/13 Sediment Traps! Stokes Law! Q: How long does it take for a particle to sink in the ocean? A: We need to know 3 things: 1) density of the particle 2) radius of the particle 3) density of seawater Then we use Stokes Law: radius Density Viscosity V = 2 / 9 g r2 (ρ -ρ) /ρ v Velocity gravity Particle density - water 14
 /ρ v V = 2.")


15 Applications of Stoke s Law! V = 2 / 9 g r 2 (ρ -ρ) /ρ v V = r 2 r = 3 to 40 microns r = 3 to 40 x10-4 cm Simplification for spherical particles with densities near that of rock V = (3 to 40 x10-4 ) 2 V = cm/s 11 to 2300 days to sink! Martin s Equation (VERTEX)! Biomass decreases essentially exponentially with depth. Martin Equation: F=Fz(Z0/Z)^b (b= for Monterey) 15

16 Thorium Fluxes (U238/Th234)! 16
17 17
18 Conservative vs. Non-Conservative Conservative properties follow linear mixing laws Temperature Gases Non-Conservative properties are non-linear in space and time Biology Salinity Non-reactive elements Some properties fall in-between Nutrients Apparent Oxygen Utilization Oxygen Utilization Rate! O2 Organic carbon inorganic nutrients 18


19 Nitrate Mass Balance Equals New (Export) Production Turk et al., 2001 Reconciling Time-Space Scales! Steady State? Mass Balance Sediment Traps Incubations FRRF PvsE Source: 19
20 Large Cells = High Biomass From Chisholm, 1992 Figure 3, 8 Wilkerson et al. 2000, DSR 47:
21 Adding it all up. There are limiting elements to both the rate of growth and biomass of phytoplankton On average, biomass is in Redfield-proportions for C:N:P:O (:Si) Large cells are capable of faster uptake due to internal pools and surge kinetics Only cells growing near µmax are Redfield Export production mass decreases logarithmically with depth Therefore, diatoms and other large, heavy cells are extremely important! 21
Phytoplankton! Zooplankton! Nutrients!
 Phytoplankton! Zooplankton! Nutrients! Phytoplankton! Zooplankton! Critical Depth Recycled Nutrients! Oxidized Nutrients! Detritus! Rest of Ocean Biological and Solubility Pumps New (Export) vs. Regenerated
Nutrient-uptake kinetics and ecological/evolutionary selection
 Nutrient-uptake kinetics and ecological/evolutionary selection Specific Rate of Uptake (d -1 ) 2.5 2.0 1.5 1.0 0.5 Nutrient Uptake V max = 2.25 d -1 K = 2.0 µm s V max = 1.5 d -1 K = 0.5 µm s II I 0.0
Nitrogen Cycling in the Sea
 Nitrogen Cycling in the Sea Matt Church (MSB 612 / 9568779/ mjchurch@hawaii.edu) Marine Microplankton Ecology / OCN 626 NH 4 N0 2 N0 2 NH 4 Outline Nitrogen species in marine watersdistributions and concentrations
Nitrogen Cycling in the Sea
 Nitrogen Cycling in the Sea NH 4 + N0 2 N0 2 NH 4 + Outline Nitrogen species in marine watersdistributions and concentrations New, regenerated, and export production The processes: Assimilation, N 2 fixation,
Determining the f ratio 11/16/2010. Incubate seawater in the presence of trace 15
 Plankton production is supported by 2 types of nitrogen: 1) new production supported by external sources of N (e.g. NO 3 and N 2 ), 2) recycled or regenerated production, sustained by recycling of N. Assumptions:
Phytoplankton and Upper Ocean Biogeochemical Cycles Along Line P
 Phytoplankton and Upper Ocean Biogeochemical Cycles Along Line P Angelica Peña Institute of Ocean Sciences, Fisheries & Oceans Canada. Contribution: Diana Varela, Department of Biology & School of Earth
Biogeochemistry of Nitrogen Isotopes in Northern Indian Ocean
 Biogeochemistry of Nitrogen Isotopes in Northern Indian Ocean Thesis submitted to The Maharaja Sayajirao University of Baroda, Vadodara, India For the degree of Doctor of Philosophy in Geology By Sanjeev
Phytoplankton and bacterial biomass, production and growth in various ocean ecosystems
 Phytoplankton and bacterial biomass, production and growth in various ocean ecosystems Location Bact. Biomass (mg C m -2 ) Phyto. Biomass (mg C m -2 ) BactB: PhytoB BactP (mg C m -2 d -1 ) 1 o Pro (mg
Ocean Production and CO 2 uptake
 Ocean Production and CO 2 uptake Fig. 6.6 Recall: Current ocean is gaining Carbon.. OCEAN Reservoir size: 38000 Flux in: 90 Flux out: 88+0.2=88.2 90-88.2 = 1.8 Pg/yr OCEAN is gaining 1.8 Pg/yr Sum of the
Measurements and Models of Primary Productivity
 Measurements and Models of Primary Productivity Supported by NSERC 1 including OTN John J. Cullen! Department of Oceanography, Dalhousie University Halifax, Nova Scotia, Canada B3H 4R2! 2014 C-MORE Summer
Oceanic CO 2 system - Significance
 OCN 401 Biogeochemical Systems (10.25.18) (10.30.18) (Schlesinger: Chapter 9) (11.27.18) Oceanic Carbon and Nutrient Cycling - Part 2 Lecture Outline 1. The Oceanic Carbon System 2. Nutrient Cycling in
25 years of Hawaii Ocean Time-series carbon flux determinations: Insights into productivity, export, and nutrient supply in the oligotrophic ocean
 25 years of Hawaii Ocean Time-series carbon flux determinations: Insights into productivity, export, and nutrient supply in the oligotrophic ocean MATTHEW CHURCH, ROBERT BIDIGARE, JOHN DORE, DAVID KARL,
11/9/2010. Stoichiometry of POM and DOM. DOC cycling via DO 14 C Williams, Oeschger, and Kinney; Nature v224 (1969)
") DOC cycling via DO 1 C Williams, Oeschger, and Kinney; Nature v22 (1969) UV photooxidation Radiocarbon in the Atlantic and Pacific Oceans Peter M. Williams and Ellen Druffel; Nature 1987, JGR 1992 DIC
DOC cycling via DO 1 C Williams, Oeschger, and Kinney; Nature v22 (1969) UV photooxidation Radiocarbon in the Atlantic and Pacific Oceans Peter M. Williams and Ellen Druffel; Nature 1987, JGR 1992 DIC
Nitrogen and phosphorus cycling in the ocean
 Nitrogen and phosphorus cycling in the ocean Deborah A. Bronk Department of Physical Sciences Outline: 1. The Redfield ratio 2. Liebig s Law of the Minimum 3. The nitrogen cycle 4. The phosphorus cycle
The Hawaii Ocean Time-series (HOT): Highlights and perspectives from two decades of ocean observations
: Highlights and perspectives from two decades of ocean observations") The Hawaii Ocean Time-series (HOT): Highlights and perspectives from two decades of ocean observations MATTHEW CHURCH UNIVERSITY OF HAWAII OCB SCOPING WORKSHOP SEPTEMBER 2010 A Dedicated HOT Team NSF What
The Hawaii Ocean Time-series (HOT): Highlights and perspectives from two decades of ocean observations MATTHEW CHURCH UNIVERSITY OF HAWAII OCB SCOPING WORKSHOP SEPTEMBER 2010 A Dedicated HOT Team NSF What
increase in mean winter air temperature since 1950 (Ducklow et al, 2007). The ocean
. The ocean") Exploring the relationship between Chlorophyll a, Dissolved Inorganic Carbon, and Dissolved Oxygen in the Western Antarctic Peninsula Ecosystem. Katie Coupland December 3, 2013 Since the start of the industrial
Exploring the relationship between Chlorophyll a, Dissolved Inorganic Carbon, and Dissolved Oxygen in the Western Antarctic Peninsula Ecosystem. Katie Coupland December 3, 2013 Since the start of the industrial
The Carbon cycle. Atmosphere, terrestrial biosphere and ocean are constantly exchanging carbon
 The Carbon cycle Atmosphere, terrestrial biosphere and ocean are constantly exchanging carbon The oceans store much more carbon than the atmosphere and the terrestrial biosphere The oceans essentially
Biological Oceanography
 Biological Oceanography What controls production in the sea? The BIG 2: 1) Light (energy) 2) Nutrients (matter) Secondarily 3) Temperature 4) Stratification (coupled to 2 & 3) 5) Grazing/predation The
WHY CARBON? The Carbon Cycle 1/17/2011. All living organisms utilize the same molecular building blocks. Carbon is the currency of life
 The Carbon Cycle WHY CARBON? Inventories: black text Fluxes: purple arrows Carbon dioxide (+4) AN = 6 (6P/6N) AW = 12.011 Oxidation: -4 to +4 Isotopes: 11 C, 12 C, 1 C, 14 C Methane (-4) Carbon is the
Chapter VI. Primary and Secondary Production rate in the Arabian Sea. Using Remote Sensing. 6.1 Introduction Results and Discussion
 Primary and Secondary Production rate in the Arabian Sea Using Remote Sensing 6.1 Introduction 6.2. Results and Discussion 6.2.1 Primary production 6.2.2 Secondary production CHAPTER VI Primary and Secondary
Production and Life OCEA 101
 Production and Life OCEA 101 Overview Photosynthesis Primary production Phytoplankton biomass Controls on primary production and biomass Food webs Photosynthesis Photosynthesis requires: (i) sunlight (ii)
5.0 PHYTOPLANKTON PHYSIOLOGY. Luke Twomey Christopher P. Buzzelli Hans W. Paerl. 5.1 Introduction
 5. PHYTOPLANKTON PHYSIOLOGY Luke Twomey Christopher P. Buzzelli Hans W. Paerl 5.1 Introduction Phytoplankon production is the primary source of organic carbon in the water column of the NRE (Matson and
Examine annual or seasonal scale changes in
 Primary production approach 5: Estimate Net community production based on in situ variations in oxygen, nutrients, carbon, or biomass (often chlorophyll) Examine annual or seasonal scale changes in O 2,
Nutrients, biology and elemental stoichiometry
 Nutrients, biology and elemental stoichiometry Subtropics and tropics: oligotrophic = low nutrient, low biomass. Equatorial upwelling regions: Elevated nutrients (1 10 MNO 3 ) and biomass (relative to
Does Ocean acidification change the C-flux to depth, or the strength or the efficiency of the biological pump?
 Ocean Carbon Ballasting Respiration, decomposition and export Uta Passow (AWI, Bremerhaven and MSI, UC Santa Barbara) Does Ocean acidification change the C-flux to depth, or the strength or the efficiency
Chemical and biological effects on mesopelagic organisms and communities in a high-co 2 world
 Chemical and biological effects on mesopelagic organisms and communities in a high-co 2 world Louis Legendre Villefranche Oceanography Laboratory, France Richard B. Rivkin Memorial University of Newfoundland,
CO 2 (g) + H 2 O = H 2 CO 3 log K H = HCO 3 log K 1 = HCO - 3 = H CO 3 log K 2 = -9.0
 + H 2 O = H 2 CO 3 log K H = HCO 3 log K 1 = HCO - 3 = H CO 3 log K 2 = -9.0") Ocean 400 Chemical Oceanography Winter 2006 Your Name Final Exam Read all questions carefully before you begin to answer. Use the back of the pages if necessary. Points are assigned to each question in
Ocean 400 Chemical Oceanography Winter 2006 Your Name Final Exam Read all questions carefully before you begin to answer. Use the back of the pages if necessary. Points are assigned to each question in
Intro to Biogeochemical Modeling Ocean & Coupled
 Intro to Biogeochemical Modeling Ocean & Coupled Keith Lindsay, NCAR/CGD NCAR is sponsored by the National Science Foundation Lecture Outline 1) Large Scale Ocean Biogeochemical Features 2) Techniques
Nutrients; Aerobic Carbon Production and Consumption
 Nutrients; Aerobic Carbon Production and Consumption OCN 623 Chemical Oceanography 5 February 2013 Reading: Libes, Chapters 8-10 Outline 1. Overview - photosynthesis & respiration 2. Nutrients - chemical
Answer THREE questions, at least ONE question from EACH section.
 UNIVERSITY OF EAST ANGLIA School of Environmental Sciences Main Series Undergraduate Examination 2012-2013 CHEMICAL OCEANOGRAPHY ENV-2A45 Time allowed: 2 hours. Answer THREE questions, at least ONE question
SUNLIGHT & OCEAN ZONATION
 PLANKTON, PRIMARY PRODUCTIVITY, AND BIOGEOCHEMISTRY EPSS 15 Fall 2017 LAB #7 SUNLIGHT & OCEAN ZONATION Sunlight is critical to the distribution of oceanic life The base of the food chain (phytoplankton)
Biogeochemical fluxes in scenario simulations for the Baltic Sea in the period with Saint-Petersburg Baltic Eutrophication Model (SPBEM)
") Biogeochemical fluxes in scenario simulations for the Baltic Sea in the period 196-2 with Saint-Petersburg Baltic Eutrophication Model (SPBEM) Vladimir Ryabchenko1, Alexey Isaev2, Mikhail Molchanov2, Tatjyana
Biogeochemical fluxes in scenario simulations for the Baltic Sea in the period 196-2 with Saint-Petersburg Baltic Eutrophication Model (SPBEM) Vladimir Ryabchenko1, Alexey Isaev2, Mikhail Molchanov2, Tatjyana
Jeffrey Polovina 1, John Dunne 2, Phoebe Woodworth 1, and Evan Howell 1 Julia Blanchard 3
 Projected expansion of the subtropical biome and contraction of the temperate and equatorial upwelling biomes in the North Pacific under global warming Jeffrey Polovina 1, John Dunne 2, Phoebe Woodworth
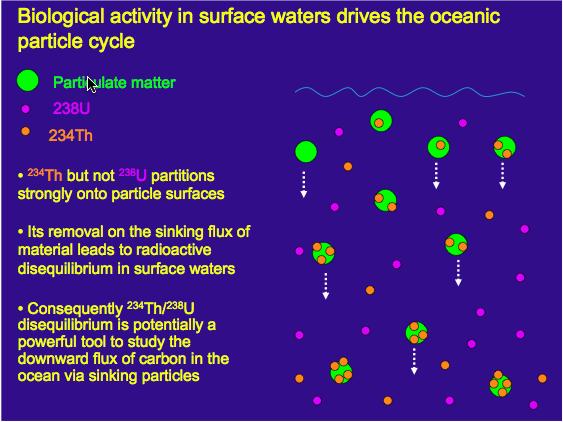
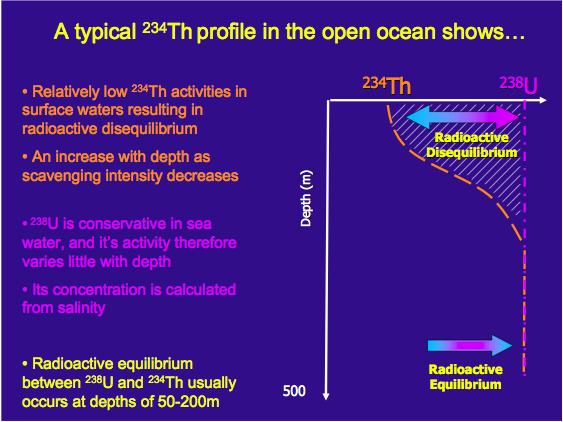
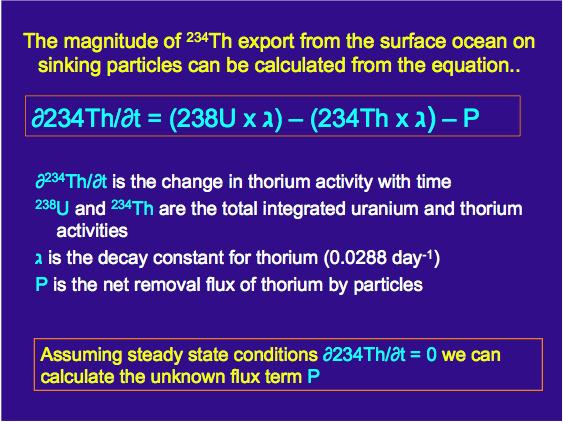
Tracking the fate of carbon in the ocean using thorium-234
 Tracking the fate of carbon in the ocean using thorium-234 Ken Buesseler Dept. of Marine Chemistry and Geochemistry Woods Hole Oceanographic Institution Outline 1. Background- the biological pump & why
Patterns of Productivity
 Phytoplankton Zooplankton Nutrients Patterns of Productivity There is a large Spring Bloom in the North Atlantic (temperate latitudes remember the Gulf Stream!) What is a bloom? Analogy to terrestrial
SUPPLEMENTARY INFORMATION
 SUPPLEMENTARY INFORMATION DOI: 10.1038/NGEO1745 Isotopic ratios of nitrite as source and age tracers for oceanic nitrite Carolyn Buchwald 1 and Karen L. Casciotti 2 1 Massachusetts Institute of Technology/
Estimating Primary Productivity with WIM/WAM
 Estimating Primary Productivity with WIM/WAM Mati Kahru 2008 1 Estimating Primary Productivity with WIM/WAM Contents Estimating Primary Productivity with WIM/WAM... 1 1 Introduction... 1 2 Prerequisites...
Impact on Phytoplankton Community. Mesocosms. from Oyster Biodeposit Resuspension in Shear Turbulence Resuspension
 Impact on Phytoplankton Community from Oyster Biodeposit Resuspension in Shear Turbulence Resuspension Mesocosms. By: Sarah Davis* Mentors: Dr. Elka Porter and Dr. Richard Lacouture Collaboration with:
Trophic Structure & Food Webs
 Trophic Structure & Food Webs 1946, Riley published a simple food web model: PP = 153T - 120P - 7.3N - 9.1Z + 6713 1947, simplified it to: dn/dt = N(Ph - R) - G Trophic Structure & Food Webs 1946, Riley
Life in the Surface Layer
 Life in the Surface Layer Satellite-derived annual mean chlorophyll-a concentration, log(chla[mg/m3]), the most widespread measurement of biological activity. The first-order interpretation is that this
Developments in the ecological box modelling of the Curonian Lagoon
 Developments in the ecological box modelling of the Curonian Lagoon /9/9, Klaipeda Dr. Ali Ertürk Istanbul Technical University Department of Environmental Engineering INTRODUCTION 1 What is ESTAS? EcoSystem
Trophic Structure & Food Webs
 Trophic Structure & Food Webs 1946, Riley published a simple food web model: PP = 153T - 120P - 7.3N - 9.1Z + 6713 1947, simplified it to: dn/dt = N(Ph - R) - G Trophic Structure & Food Webs 1946, Riley
Modeling responses of diatom productivity and biogenic silica export to iron enrichment in the equatorial Pacific Ocean
 GLOBAL BIOGEOCHEMICAL CYCLES, VOL. 21,, doi:10.1029/2006gb002804, 2007 Modeling responses of diatom productivity and biogenic silica export to iron enrichment in the equatorial Pacific Ocean F. Chai, 1
A functional gene approach to studying nitrogen cycling in the sea. Matthew Church (MSB 612 / March 20, 2007
 A functional gene approach to studying nitrogen cycling in the sea Matthew Church (MSB 612 / 6-8779 mjchurch@hawaii.edu) March 20, 2007 Overview Climate change, carbon cycling, and ocean biology Distributions
Phytoplankton and primary production 4
 Aquatic ecology BIO 4400 Phytoplankton and primary production 4 k a Bente Edvardsen 2009 Aims of learning - marine botany Give an understanding and knowledge on: Ecological role of phytoplankton Primary
Modelling of higher trophic levels with an large ecosystem model: -state of the art -limitations -perspectives. Piet Ruardij
 Modelling of higher trophic levels with an large ecosystem model: -state of the art -limitations -perspectives Piet Ruardij 1 Modelling the North Sea: Actual situation: 8+1 coupled hydrodynamical-ecosystems
Part 3. Oceanic Carbon and Nutrient Cycling
 OCN 401 Biogeochemical Systems (11.03.11) (Schlesinger: Chapter 9) Part 3. Oceanic Carbon and Nutrient Cycling Lecture Outline 1. Models of Carbon in the Ocean 2. Nutrient Cycling in the Ocean Atmospheric-Ocean
Seasonal Anoxia over the Western Indian Continental Shelf
 Seasonal Anoxia over the Western Indian Continental Shelf S.W.A. Naqvi, Hema Naik, A.K. Pratihary, M. Gauns, Witty D Souza, Gayatree Narvenkar, D.A. Jayakumar, M.S. Shailaja & P.V. Narvekar National Institute
Operational System for Coastal Waters of Gdansk Region
 Operational System for Coastal Waters of Gdansk Region Goals Supporting the Region Authority and the society with essential information about the coastal water conditions Coastal water dangers warning
Nitrogen Isotopes.
 Nitrogen Isotopes http://wordsinmocean.files.wordpress.com/2012/02/n-cycle.png Stable Isotope Notation Isotope data reported in standard or notation: Nitrogen 15 N 15 15 N/ N/ 14 14 N N sample AIR 1 1000
Iron fertilization of the Oceans: Reconciling Commercial Claims with Published Models
 Iron fertilization of the Oceans: Reconciling Commercial Claims with Published Models An Unpublished White Paper by: Phoebe Lam # and Sallie W. Chisholm * April 29, 2002 Abstract Box model studies of geochemists
Part 3. Oceanic Carbon and Nutrient Cycling
 OCN 401 Biogeochemical Systems (10.27.16) (Schlesinger: Chapter 9) Part 3. Oceanic Carbon and Nutrient Cycling Lecture Outline 1. The Oceanic Carbon System 2. Nutrient Cycling in the Ocean 3. Other elements
LIMNOLOGY. Inland Water Ecosystems. JACOB KALFF McGill University. Prentice Hall. Upper Saddle River, New Jersey 07458
 LIMNOLOGY Inland Water Ecosystems JACOB KALFF McGill University Prentice Hall Prentice Hall Upper Saddle River, New Jersey 07458 Contents CHAPTER 1 Inland Waters and Their Catchments: An Introduction and
Assessment and Modelling of Baltic Ecosystem Response (AMBER)
") Assessment and Modelling of Baltic Ecosystem Response (AMBER) Joachim W Dippner and the AMBER team AMBER Kick-off meeting 19. 1. 2009 Participants Leibniz-Institute for Baltic Sea Research Warnemünde,
Assessment and Modelling of Baltic Ecosystem Response (AMBER) Joachim W Dippner and the AMBER team AMBER Kick-off meeting 19. 1. 2009 Participants Leibniz-Institute for Baltic Sea Research Warnemünde,
Denitrification 2/11/2011. Energy to be gained in oxidation. Oxidized N. Reduced N
 Oxidized N Energy to be gained in oxidation Reduced N (Sarmiento & Gruber, 2006) Denitrification The reduction of NO 3 and NO 2 to N 2 during heterotrophic respiration of organic matter. Occurs predominately
Ocean Acidification the other CO2 problem..
 Ocean Acidification the other CO2 problem.. 1. Ocean Acidification the other CO2 problem.. Recall: Atm CO 2 already above recent planetary history CO 2 Today: What does this do to ocean water? Main Outline:
Lakes, Primary Production, Budgets and Cycling
 OCN 401-Biogeochemical Systems Lecture #10 (9.22.11) Lakes, Primary Production, Budgets and Cycling (Schlesinger: Chapter 7) 1. Primary Production and Nutrient Cycling in Lakes Physical aspects and nomenclature
A biological contribution to partial pressure of CO 2 in the western Arctic Ocean and Bering Sea
 A biological contribution to partial pressure of CO 2 in the western Arctic Ocean and Bering Sea *Futsuki, R. 1, T. Hirawake 2, A. Fujiwara 2,3, T. Kikuchi 4, S. Nishino 4, D. Sasano 5,6, M. Ishii 5,6,
Biology 13- Marine Biology
 Introductions Biology 13- Marine Biology Instructor: Dr. Kevin Raskoff Email: kraskoff@mpc.edu Phone: (831) 646-4132 Office: Life Science, 203B (upstairs) Office hours: Mon-Thurs- 10-11; Thur 5-6pm; or
The Global Carbon Cycle
 The Global Carbon Cycle Tom Bibby September 2003 bibby@imcs.rutgers.edu falko@imcs.rutgers.edu The Carbon Cycle - Look at past climatic change; as controlled by the carbon cycle. - Interpret the influence
Oxygen in the Columbia River Estuary: Distribution and Dynamics. Pat Welle
 1 Oxygen in the Columbia River Estuary: Distribution and Dynamics Observation Prediction Analysis Collaboration Pat Welle Additional Contributors: Antonio Baptista 1 Yvette Spitz 2 Jesse E. Lopez 1 G.
MAR 650-Lecture 1: Influences of Light on Biological Production. Importance: In the ocean: 1) Photosynthesis and Primary Production
 Photosynthesis and Primary Production") MAR 650-Lecture 1: nfluences of Light on Biological Production 1) Photosynthesis and Primary Production photosynthesis CO 2 H 2 O Carbohydrate O 2 respiration mportance: Photosynthesis requires lights,
MAR 650-Lecture 1: nfluences of Light on Biological Production 1) Photosynthesis and Primary Production photosynthesis CO 2 H 2 O Carbohydrate O 2 respiration mportance: Photosynthesis requires lights,
Biogeochemical Treatment of ARD at the Island Copper Mine Pit Lake
 Biogeochemical Treatment of ARD at the Island Copper Mine Pit Lake Presented by: C. Pelletier, D. Muggli, M. Wen, and G. Poling Rescan Environmental Services Ltd. Rupert Inlet and Island Copper Mine Site
CHEMICAL: CARBON and OXYGEN (read 44-45; in Dodson)
") BIOE 155, Fall BACKGROUND INFORMATION CHEMICAL: CARBON and OXYGEN (read -5; 3-39 in Dodson) Types of molecules Organic: compounds containing Carbon-Hydrogen bonds Inorganic: everything else. Photosynthesis
BIOE 155, Fall BACKGROUND INFORMATION CHEMICAL: CARBON and OXYGEN (read -5; 3-39 in Dodson) Types of molecules Organic: compounds containing Carbon-Hydrogen bonds Inorganic: everything else. Photosynthesis
Marine Primary Productivity: Measurements and Variability. Matt Church Department of Oceanography MSB 612
 Marine Primary Productivity: Measurements and Variability Matt Church Department of Oceanography MSB 612 Sunlight CO 2 + 2H 2 O CH 2 O + O 2 + H 2 O + heat Gross Primary Production (GPP): The rate of organic
A sense of place N, W LNLC region two layered system. < 50m mixed layer ~125 m euphotic zone/nutricline. Station ALOHA (1988 onwards)
") STATION ALOHA 1. Introduction to the region 2. Types of blooms (enhanced biomass/growth emphasis on the mixed layer) 3. Drivers of variability 4. Beyond biomass towards productivity angelicque white, oregon
STATION ALOHA 1. Introduction to the region 2. Types of blooms (enhanced biomass/growth emphasis on the mixed layer) 3. Drivers of variability 4. Beyond biomass towards productivity angelicque white, oregon
Marine Microbial Processes
 Marine Microbial Processes Outline size-structured food webs brief history of the development of our current understanding of microbially dominated food webs carbon cycling in marine food webs evolving
Patterns of Productivity
 Patterns of Productivity Limitation by Light and Nutrients OCN 201 Biology Lecture 8 Primary Production - the production of biomass by autotrophs Secondary Production - the production of biomass by heterotrophs
Dead-Zones and Coastal Eutrophication: Case- Study of Chesapeake Bay W. M. Kemp University of Maryland CES Horn Point Laboratory Cambridge, MD
 Dead-Zones and Coastal Eutrophication: Case- Study of Chesapeake Bay W. M. Kemp University of Maryland CES Horn Point Laboratory Cambridge, MD Presentation to COSEE Trends Orientation at UMCES HPL 4 August
Global Biogeochemical cycles and Ocean Productivity
 Global Biogeochemical cycles and Ocean Productivity Biological Oceanography Recall: goal is not to understand the biology of one particular organism (or group), but to understand organisms fit into the
What does each part of the equation mean? q=cm T
 Assignment #10 Energy Pyramids LO: I can define trophic levels and explain the energy flow. I can apply those ideas to food webs EQ: Where does all the energy from the sun go? (4-5 sentences) LEVEL ZERO
Using dynamic biomes and a climate model to describe the responses of the North Pacific to climate change over the 21 st Century
 Using dynamic biomes and a climate model to describe the responses of the North Pacific to climate change over the 21 st Century Jeffrey Polovina 1, John Dunne 2, Phoebe Woodworth 1, and Evan Howell 1
Ironing Out Uncertainties in Climate Engineering. Ocean Fertilization: Ken Buesseler
 Ocean Fertilization: Ironing Out Uncertainties in Climate Engineering Ken Buesseler Senior Scientist Marine Chemistry and Geochemistry Dept. Woods Hole Oceanographic Institution Carbon Sequestration in
Global Biogeochemical Cycles. Supporting Information for
 Global Biogeochemical Cycles Supporting Information for The annual cycle of gross primary production, net community production and export efficiency across the North Pacific Ocean Hilary I. Palevsky 1a,
Global Assessment of Carbon Export Using Satellite Observations: New Approaches & A Plan for the Future
 Global Assessment of Carbon Export Using Satellite Observations: New Approaches & A Plan for the Future Dave Siegel UC Santa Barbara Help from Ken Buesseler & Scott Doney WHOI Sevrine Sailley Univ. Plymouth
Northern Adriatic sea ecosystem model: trophic network analysis, time simulation and spatial dynamics
 Northern Adriatic sea ecosystem model: trophic network analysis, time simulation and spatial dynamics Barausse, A., Artioli, Y., Palmeri, L., Duci, A., Mazzoldi, C. Environmental Systems Analysis Lab and
Better Oceanography through Optics. Chlorophyll Primary Productivity Harmful Algal Blooms
 Better Oceanography through Optics Chlorophyll Primary Productivity Harmful Algal Blooms Chlorophyll Biomass (mg m -3 ) Ocean Color to Estimate Chlorophyll Biomass 10.0 SeaWiFS Chl a 1.0 0.1 Adapted from
Model Study of Coupled Physical-Biogeochemical Variability in the Labrador Sea
 Model Study of Coupled Physical-Biogeochemical Variability in the Labrador Sea Hakase Hayashida M.Sc. Thesis (Physical Oceanography) Memorial University of Newfoundland January 14, 214 Global carbon cycle:
Benthic Microalgal Nutrient Limitation Using Bioassays. Merrie Beth Neely and Gabriel A. Vargo
 Benthic Microalgal Nutrient Limitation Using Bioassays Merrie Beth Neely and Gabriel A. Vargo Objectives Use mesocosms to evaluate if nutrients are limiting for benthic microalgae across Florida Bay in
Lecture 13 - Primary Production: Water Column Processes
 12.742 - Marine Chemistry Fall 2004 Lecture 13 - Primary Production: Water Column Processes Prof. Scott Doney Somewhat different organization from years past - start with surface productivity and work
Subtropical Ocean Ecosystem. North Pacific Climate Variations
 Subtropical Ocean Ecosystem Structure Changes Forced by North Pacific Climate Variations Bob Bidigare Hawaii Institute tute of Marine Biology ogy University of Hawaii at Manoa Acknowledgements HOT Personnel
Nitrate Dynamics at ALOHA and K2. Karen Casciotti Woods Hole Oceanographic Institution Department of Marine Chemistry and Geochemistry
 Nitrate Dynamics at ALOHA and K2 Karen Casciotti Woods Hole Oceanographic Institution Department of Marine Chemistry and Geochemistry VERTIGO 24 Experiments Nitrate isotopic profiles Coupled δ 15 N and
Biogeochemical Cycles. Nutrient cycling at its finest!
 Biogeochemical Cycles Nutrient cycling at its finest! Four Criteria for Sustainability Sustainable Ecosystems Need: Reliance on Solar Energy High Biodiversity Population Control Nutrient Cycling This note
The Baltic Proper Ecosystem & Climate Change
 Baltic Earth/BEAM Summer School Askö 2015-08-28 The Baltic Proper Ecosystem & Climate Change Ragnar Elmgren Dept. Ecology, Environment & Plant Sciences Take home message: We are still extremely uncertain
ereefsoptical and biogeochemical model. CSIRO OCEANS AND ATMOSPHERE FLAGSHIP
 ereefsoptical and biogeochemical model. CSIRO OCEANS AND ATMOSPHERE FLAGSHIP 2 Presentation title Presenter name BGC state variables: - 10 dissolved - 22 living particulate - 11 non-living part. -6 epibenthic.
Biological Pump. Suttle (2005) Nature 437:
 Nature 437:") Scenario This reservoir of dissolved organic carbon (DOC) is as large as that of CO2 in the atmosphere Its average age is ~5000y and hence can be a mechanism of carbon sequestration Viruses are major players
Scenario This reservoir of dissolved organic carbon (DOC) is as large as that of CO2 in the atmosphere Its average age is ~5000y and hence can be a mechanism of carbon sequestration Viruses are major players
DISSOLVED CONSTITUENTS IN MARINE PORE WATER ... DATA EVALUATION...
 DISSOLVED CONSTITUENTS IN MARINE PORE WATER PORE WATER PROFILES DIFFUSIVE FLUXES... DATA EVALUATION... How to read pore water concentration profiles 1 How to read pore water concentration profiles Consumption
Math for Soil Scientists
 Math for Soil Scientists Mark S. Coyne University of Kentucky and James A. Thompson West Virginia University THOMSON * ^ : D E L I V I A R L E A R N I N G A u s t r a l i a C a n a d a M e x i c o S i
Communities What organizes biology above the level of the population?
 ECOLOGY part 2 Populations/Communities Similar species can co-exist more readily if they utilize different portions of shared niche axes have different niches (determined by traits) Coastal wetland So,
Aquatic respiration and ocean metabolism
 Aquatic respiration and ocean metabolism Remember what life is all about: Energy (ATP) Reducing power (NADPH) Nutrients (C, N, P, S, Fe, etc., etc.) Photosynthetic organisms use sunlight, H 2 O, and dissolved
UPPER OCEAN METHANE DYNAMICS -- ANNUAL REPORT
 UPPER OCEAN METHANE DYNAMICS -- ANNUAL REPORT Francis J. Sansone Oceanography Department University of Hawaii 1000 Pope Road Honolulu, HI 96822 email: sansone@soest.hawaii.edu phone: (808) 956-8370 fax:
Trace Metal Iron (Fe), an important element to measure at sea. Dr. Thato Nicholas Mtshali
, an important element to measure at sea. Dr. Thato Nicholas Mtshali") Trace Metal Iron (Fe), an important element to measure at sea Dr. Thato Nicholas Mtshali Southern Atlantic Ocean and Antarctic Seminar (Cape Town): 5 December 2017 A CSIR-led multidisciplinary and multi-institutional
Trace Metal Iron (Fe), an important element to measure at sea Dr. Thato Nicholas Mtshali Southern Atlantic Ocean and Antarctic Seminar (Cape Town): 5 December 2017 A CSIR-led multidisciplinary and multi-institutional
Future climate scenarios for phosphorus and nitrogen dynamics in the Gulf of Riga
 Future climate scenarios for phosphorus and nitrogen dynamics in the Gulf of Riga Bärbel Müller Karulis, Latvian Institute of Aquatic Ecology Juris Aigars, Latvian Institute of Aquatic Ecology In colaboration
A Carbon Budget in Tokyo Bay
 Journal of Oceanography Vol. 49, pp. 249 to 256. 1993 A Carbon Budget in Tokyo Bay TETSUO YANAGI 1, TOSHIRO SAINO 2, TAKASHI ISHIMARU 3 and SHIN-ICHI UYE 4 1 Department of Civil and Ocean Engineering,
Estimating Primary Productivity with WIM/WAM
 Estimating Primary Productivity with WIM/WAM Please see \Course\4\Tutorial_Primary_Productivity.pdf on DVD or http://www.wimsoft.com/tutorial_primary_productivity.pdf Ocean primary production (PP) is a
Ecosystem Ecology. Trophic levels energy flow through ecosystems. Productivity and energy. Autotrophs: primary producers Heterotrophs: consumers
 Ecosystem Ecology 1. Overview of material and energy flows in ecosystems 2. Primary production 3. Secondary production and trophic efficiency 4. Ecological Pyramids Trophic levels energy flow through ecosystems
St. Lucie Estuary: Analysis of Annual Cycles and Integrated Water Column Productivity
 St. Lucie Estuary: Analysis of Annual Cycles and Integrated Water Column Productivity Tom Gallo, Malcolm Pirnie Inc. Clifton Bell, Malcolm Pirnie Inc. Peter Doering, South Florida Water Management District
Carbon Dioxide, Alkalinity and ph
 Carbon Dioxide, Alkalinity and ph OCN 62 Chemical Oceanography Reading: Libes, Chapter 15, pp. 8 94 (Remainder of chapter: Biogenic production, carbonate saturation and sediment distributions ) 1. CO 2
SGLI/GCOM-C1. Algorithm Theoretical Basic Document. Ocean net primary productivity (ONPP)
") SGLI/GCOM-C1 Algorithm Theoretical Basic Document Ocean net primary productivity (ONPP) Version 3.3 31 March 2016 PI: Toru Hirawake 1* Co-I: Amane Fujiwara 2, Tomonori Isada 3 and Sei-ichi Saitoh 1, 4
SGLI/GCOM-C1 Algorithm Theoretical Basic Document Ocean net primary productivity (ONPP) Version 3.3 31 March 2016 PI: Toru Hirawake 1* Co-I: Amane Fujiwara 2, Tomonori Isada 3 and Sei-ichi Saitoh 1, 4
INTERPLAY BETWEEN ECOSYSTEM STRUCTURE AND IRON AVAILABILITY IN A GLOBAL MARINE ECOSYSTEM MODEL
 ITERPLAY BETWEE ECOSYSTEM STRUCTURE AD IRO AVAILABILITY I A GLOBAL MARIE ECOSYSTEM MODEL Stephanie Dutkiewicz Fanny Monteiro, Mick Follows, Jason Bragg Massachusetts Institute of Technology Program in