25 years of Hawaii Ocean Time-series carbon flux determinations: Insights into productivity, export, and nutrient supply in the oligotrophic ocean
|
|
|
- Virgil Manning
- 6 years ago
- Views:
Transcription


1 25 years of Hawaii Ocean Time-series carbon flux determinations: Insights into productivity, export, and nutrient supply in the oligotrophic ocean MATTHEW CHURCH, ROBERT BIDIGARE, JOHN DORE, DAVID KARL, MICHAEL LANDRY, RICARDO LETELIER, ROGER LUKAS OCEAN CARBON BIOGEOCHEMISTRY SUMMER WORKSHOP JULY 2013 NSF
2 Thank you Craig Carlson (UCSB) and Ricardo Letelier (OSU) Ken Johnson (MBARI) Heather Benway (WHOI) Mary Z. (WHOI) The National Science Foundation NSF


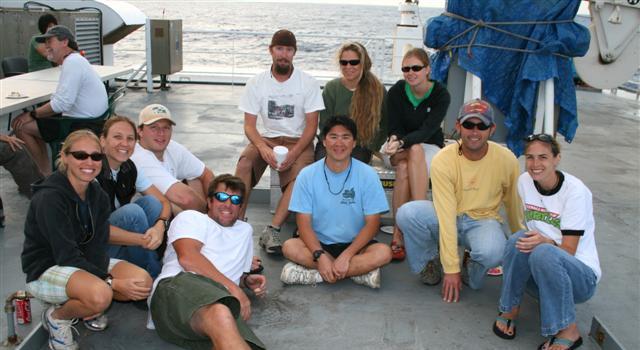


3 A Dedicated HOT Team NSF

4 HOT Subtropical gyres comprise some the largest habitats on this planet Constraining carbon production and sequestration in these regions is critical to global carbon budgets Time series programs afford unique opportunities to define the magnitude and pathways of carbon fluxes in the open sea


5 Time, water, and change The complexity of ecosystem dynamics, even in stable systems, demands multidisciplinary, sustained observations. ALOHA Implementation and leveraging of remote and autonomous sampling platforms at ocean time series sites is providing new insights into bioelemental cycling in these ecosystems. Photo: Paul Lethaby
")


6 The Hawaii Ocean Time-series (HOT) Near monthly cruises to Station ALOHA since October 1988 ALOHA is a deep, open ocean (~4800 m) site Shipboard and remote (moorings, gliders, floats, and satellites) measurements of ocean biogeochemistry, physics, and plankton ecology 4-day cruises, intensive sampling to 1000 m
7 The upper ocean habitat PAR (μmol quanta m -2 s -1 ) PAR MLD 14 C-PP (μmol C L -1 d -1 ) C-PP 50 Depth (m) N+N Chl a 1% 0.1% Nitrate + Nitrite (μmol N L -1 ) Chlorophyll a (μg L -1 ) Mixed layer ~ m, euphotic zone ~ m >65% of the daily carbon fixation occurs in the nutrient-deplete mixed layer
8 MLD NO 3- + NO 2 - PAR 14 C-PP

9 Carbon fixation and particulate carbon export Annually averaged 14 C-PP: ~15 mol C m -2 yr -1 Annually averaged PC 150m export: ~0.9 mol C m -2 yr -1 PC 150 m : 14 C-PP =


10 The many faces of Station ALOHA Jan July 2004 Feb Apr Sept Nov Ricardo Letelier and Angel White (OSU)
, becoming a weak source of CO 2 in the late summer.")
11 Variability in mixed layer inorganic carbon Seasonal variations in pco 2 largely a function of temperature. Sink Source Most of the year mixed layer CO 2 is undersaturated (~13 μatm), becoming a weak source of CO 2 in the late summer. Salinity normalized DIC decreases from winter-spring into summerfall. What processes control the summertime drawdown of DIC at Station ALOHA?
12 Spring-fall drawdown of DIC in the absence of nitrate is a common feature of the subtropical gyres (Michaels et al. 1994, Bates et al. 1996, 1998, Gruber et al. 1998, Lee et al. 2000, Karl et al. 2003, etc.)
 Diffusion MIXED LAYER Lateral transport THERMOCLINE Adapted from Keeling et al.")
13 Biological and physical processes controlling variability in carbon inventories and fluxes CO 2 ATMOSPHERE Gas exchange DIC Mixed layer boundary Diffusion DIC Net community production Entrainment Organic Carbon (DOC, POC) Diffusion MIXED LAYER Lateral transport THERMOCLINE Adapted from Keeling et al. (2004) Particle export
 and physics (vertical and lateral transport, air-sea exchange) 3.")
14 Quantifying net community production in the open sea is difficult 1. Small net changes superimposed on large background pools and fluxes 2. Need to accurately quantify impacts of biology (production and respiration) and physics (vertical and lateral transport, air-sea exchange) 3. Ecology matters nutrient fluxes and growth efficiencies GPP: mol C m -2 yr -1 Station ALOHA NCP: mol C m -2 yr -1 GPP - R = NCP NCP : GPP =


15 Measurements of net community production at Station ALOHA Mixed layer DIC and 13 C/ 12 C Seasonal evolution of dissolved oxygen, O 2 :inert gas ratios, and oxygen isotopes Nitrogen-based determinations of new production; over annual scales NCP Vertical transport of organic matter export (POC, DOC, and migrant flux)


16 Estimates of NCP at ALOHA abound based on inorganic nutrient based carbon mass dynamics on oxygen balances and carbon export
17 Estimates of net community production at ALOHA O 2 based approaches Method of Determination Mixed Layer O 2 : Ar Rate (± stdev) mol C m -2 yr -1 Period References (± 1.0) Emerson et al. (1997); Hamme and Emerson (2006); Juranek and Quay (2005); Quay et al. (2010) Mooring O (± 1.8) 2005 Emerson et al. (2008) C-based approaches Passive and active OM fluxes Sub-mixed layer float profiles Sub-mixed layer glider surveys Mixed layer 13 C/ 12 Cand DIC dynamics Sediment traps (150 m) (±0.2) Riser and Johnson (2008) 0.9 (± 0.1) 2005 Nicholson et al. (2008) 1.6 ± ± ± Emerson et al. (1997) Quay and Stutsman (2003) Keeling et al. (2004) 0.9 (± 0.3) HOT core data 234 Th deficits 1.5 (± 0.8) Benitez-Nelson et al. (2001) DOC export HOT core data Zooplankton-mediated 0.1 (± 0.09) Al-Mutairi and Landry (2001) Hannides et al. (2009)
18 The devil is in the details Diagnostic models depend on accuracy of : Air-sea flux (±30%) - limited by gas exchange parameterization Lateral transport (±50-70%) limited by horizontal velocities Vertical entrainment/diffusion (±50%) - poor constraint on K z Some estimates based on mixed layer dynamics (i.e. O 2 : Ar or 13 C/ 12 C) while others based on sub-mixed layer (seasonal evolution of O 2 ) O 2 based approaches require appropriate PQ and RQ Sediment trap biases Particles and DOC Nutrient sources supporting NCP
19 Where do nutrients come from to support NCP? Physical : Mixing, upwelling, diffusion, advection, etc. NO 3- supported new production Biological: N 2 fixation (N 2 NH 3 ) NO 3 - N 2 fixation NH + 4 Organic matter NO 3 - Organic matter NO 2 - NH 4 + Export


")

20 Annual N supply: >88 mmol N m -2 yr -1 (0.6 mol C m -2 yr -1 ) Courtesy of Ken Johnson, MBARI Chemical Sensor Lab
21 Vertical transport of nutrients by physical processes introduces C-enriched waters Sub-euphotic zone waters have ΔC:ΔN ratio of ~25:1 to >400:1 Sinking particles C:N ~7:1


22 Biological N supply to the ocean: N 2 fixation N 2 fixation estimated to fuel ~50% of particulate export in the subtropical N. Pacific Numerous taxa of N 2 fixing microorganisms N 2 fixation supported diatom-driven export estimated to contribute ~35% of the annual C-flux to the deep sea Silica Export (μmol Si m -2 d -1 ) Carbon Export (μmol C m -2 d -1 ) Jan Feb Mar Apr May Jun Jul Aug Sep Oct Nov Dec Jan Jan Feb Mar Apr May Jun Jul Aug Sep Oct Nov Dec Jan Month Month Karl et al. (2012) PNAS 109:


23
24 Annual climatology of N 2 fixation at Station ALOHA Böttjer, Wilson, et al. Annual ( ) average N 2 fixation (bubble): 48 mmol N m -2 yr -1 (0.3 mol C m -2 yr -1 ) Annual ( ) average N 2 fixation (no-bubble): 143 mmol N m -2 yr -1 (0.9 mol C m -2 yr -1 )
25 Summary NCP at ALOHA averages ~2 mol C m -2 yr -1, with an uncertainty of ~±50%. Uncertainties in NCP derive from poor constraint on both physical (lateral advection, vertical entrainment, air-sea exchange) and biological processes (DOC flux, sediment traps, vertical migrators). The processes supplying nutrients supporting NCP remain unclear. Time series programs (augmented by autonomous technologies) continue to improve our ability to constrain the magnitude and variability in carbon fluxes in the open sea.
26 THANK YOU
27 EXTRA SLIDES


28 Station ALOHA is one of the few places on Earth where time series measurements enable mass balance constraint on ocean NCP How temporally variable are rates of production and export in the central North Pacific? What processes control this variability? What is the fate of biologically fixed carbon?
29 Interannual to subdecadal scale variability in mixing and mixed layer DIC Deeper mixing, low DIC What role do biological and physical processes play in controlling the magnitude and variability in seasonal- to decadal-scale ocean carbon fluxes?
30 Annual cycle of productivity and export m Carbon export (mmol C m -2 d -1 ) C-prim. prod. (mmol C m -2 d -1 ) m Silica Export (μmol Si m -2 d -1 ) m 4000 m Carbon Export (μmol C m -2 d -1 ) Jan Feb Mar Apr May Jun Jul Aug Sep Oct Nov Dec Jan Jan Feb Mar Apr May Jun Jul Aug Sep Oct Nov Dec Jan Month Month Plankton community structure plays a key role in controlling carbon export


31 Climate modulated changes in the NPSG ecosystem Interannual to subdecadal variability in upper ocean mixing appears linked to basinscale climate fluctuations. Changes in nutrient and light availability alters biological productivity and biomass. Variability in inorganic carbon inventories, ocean ph, and air-sea CO 2 flux appear correlated to variations in salinity. Depth (m)
32 14 C-primary production provides a highly sensitive means of quantifying daily rates of carbon fixation. Requires confinement of samples DO 14 C? At ALOHA ~20-30% of particulate carbon fixation Daytime only or 24 hours? ~20-30% loss overnight 14 C-primary production gross primary production 14 C-primary production net community production Depending on how the method is employed, 14 C-primary production net primary production?
The Hawaii Ocean Time-series (HOT): Highlights and perspectives from two decades of ocean observations
: Highlights and perspectives from two decades of ocean observations") The Hawaii Ocean Time-series (HOT): Highlights and perspectives from two decades of ocean observations MATTHEW CHURCH UNIVERSITY OF HAWAII OCB SCOPING WORKSHOP SEPTEMBER 2010 A Dedicated HOT Team NSF What
The Hawaii Ocean Time-series (HOT): Highlights and perspectives from two decades of ocean observations MATTHEW CHURCH UNIVERSITY OF HAWAII OCB SCOPING WORKSHOP SEPTEMBER 2010 A Dedicated HOT Team NSF What
How will we measure the response of carbon export in the ocean to climate change? Ken Johnson MBARI
 How will we measure the response of carbon export in the ocean to climate change? Ken Johnson MBARI johnson@mbari.org Outline: Why care about ocean carbon flux? Future changes? How would we measure changes
Marine Primary Productivity: Measurements and Variability. Matt Church Department of Oceanography MSB 612
 Marine Primary Productivity: Measurements and Variability Matt Church Department of Oceanography MSB 612 Sunlight CO 2 + 2H 2 O CH 2 O + O 2 + H 2 O + heat Gross Primary Production (GPP): The rate of organic
Measuring primary production rates in the ocean: Enigmatic results between incubation and non incubation methods at Station ALOHA
 Click Here for Full Article GLOBAL BIOGEOCHEMICAL CYCLES, VOL. 24,, doi:10.1029/2009gb003665, 2010 Measuring primary production rates in the ocean: Enigmatic results between incubation and non incubation
WHY CARBON? The Carbon Cycle 1/17/2011. All living organisms utilize the same molecular building blocks. Carbon is the currency of life
 The Carbon Cycle WHY CARBON? Inventories: black text Fluxes: purple arrows Carbon dioxide (+4) AN = 6 (6P/6N) AW = 12.011 Oxidation: -4 to +4 Isotopes: 11 C, 12 C, 1 C, 14 C Methane (-4) Carbon is the
Examine annual or seasonal scale changes in
 Primary production approach 5: Estimate Net community production based on in situ variations in oxygen, nutrients, carbon, or biomass (often chlorophyll) Examine annual or seasonal scale changes in O 2,
Phytoplankton! Zooplankton! Nutrients!
 Phytoplankton! Zooplankton! Nutrients! Phytoplankton! Zooplankton! Critical Depth Recycled Nutrients! Oxidized Nutrients! Detritus! Rest of Ocean Biological and Solubility Pumps New (Export) vs. Regenerated
DOC and major carbon reservoirs and fluxes
 The Composition and cycling of Dissolved organic matter-i Review of DOC distribution Review of radiocarbon in DOC Sources of DOC Seasonal cycling of DOC above the permanent thermocline Composition of DOC
5/2/13. Zooplankton! Phytoplankton! Nutrients!
 Phytoplankton! Zooplankton! Nutrients! 1 Phytoplankton! Zooplankton! Critical Depth Recycled Nutrients! Oxidized Nutrients! Detritus! Rest of Ocean Biological and Solubility Pumps 2 New (Export) vs. Regenerated
Trace Metal Iron (Fe), an important element to measure at sea. Dr. Thato Nicholas Mtshali
, an important element to measure at sea. Dr. Thato Nicholas Mtshali") Trace Metal Iron (Fe), an important element to measure at sea Dr. Thato Nicholas Mtshali Southern Atlantic Ocean and Antarctic Seminar (Cape Town): 5 December 2017 A CSIR-led multidisciplinary and multi-institutional
Trace Metal Iron (Fe), an important element to measure at sea Dr. Thato Nicholas Mtshali Southern Atlantic Ocean and Antarctic Seminar (Cape Town): 5 December 2017 A CSIR-led multidisciplinary and multi-institutional
The Carbon cycle. Atmosphere, terrestrial biosphere and ocean are constantly exchanging carbon
 The Carbon cycle Atmosphere, terrestrial biosphere and ocean are constantly exchanging carbon The oceans store much more carbon than the atmosphere and the terrestrial biosphere The oceans essentially
Autonomous observing at time series stations. Ken Johnson Monterey Bay Aquarium Research Institute
 Autonomous observing at time series stations using moorings, gliders & floats Ken Johnson Monterey Bay Aquarium Research Institute The goals of autonomous, time-series observations might be: measure carbon
A large Southern Ocean CO 2 source detected by biogeochemical profiling floats
 A large Southern Ocean CO 2 source detected by biogeochemical profiling floats A. Gray (postdoc, Princeton), Ken Johnson (MBARI), J. L. Sarmiento (Princeton), et al. I. Introduction II. Methods & results
Ocean Production and CO 2 uptake
 Ocean Production and CO 2 uptake Fig. 6.6 Recall: Current ocean is gaining Carbon.. OCEAN Reservoir size: 38000 Flux in: 90 Flux out: 88+0.2=88.2 90-88.2 = 1.8 Pg/yr OCEAN is gaining 1.8 Pg/yr Sum of the
Quantifying Sources & Sinks of Atmospheric CO 2. Uptake and Storage of Anthropogenic Carbon
 Quantifying Sources & Sinks of Atmospheric CO 2 Uptake and Storage of Anthropogenic Carbon by Christopher L. Sabine ; NOAA/PMEL, Seattle, WA USA Acknowledgements: Richard A. Feely (PMEL), Frank Millero
Lakes: Primary Production, Budgets and Cycling. Lecture Outline
 OCN 401-Biogeochemical Systems (10.06.16) Lakes: Primary Production, Budgets and Cycling Reading: Schlesinger, Chapter 8 Lecture Outline 1. Seasonal cycle of lake stratification Temperature / density relationship
HYPOXIA Definition: ~63 µm; 2 mg l -1 ; 1.4 ml l -1 ; 30 %
 HYPOXIA Definition: ~63 µm; 2 mg l -1 ; 1.4 ml l -1 ; 30 % Consequences of hypoxia Reduce habitat for living resources Change biogeochemical processes P released from sediments Denitrification reduced
IMPROVEMENTS IN WATER QUALITY OF A DANISH ESTUARY FOLLOWING NUTRIENT REDUCTIONS
 IMPROVEMENTS IN WATER QUALITY OF A DANISH ESTUARY FOLLOWING NUTRIENT REDUCTIONS Peter Stæhr 1, Jeremy Testa 2, Jacob Carstensen 1 1 Dept. Bioscience,, Denmark 2 Chesapeake Biological Laboratory, Univ.
Electric Forward Market Report
 Mar-01 Mar-02 Jun-02 Sep-02 Dec-02 Mar-03 Jun-03 Sep-03 Dec-03 Mar-04 Jun-04 Sep-04 Dec-04 Mar-05 May-05 Aug-05 Nov-05 Feb-06 Jun-06 Sep-06 Dec-06 Mar-07 Jun-07 Sep-07 Dec-07 Apr-08 Jun-08 Sep-08 Dec-08
Causes of Gulf of Mexico Hypoxia
 Causes of Gulf of Mexico Hypoxia Nancy N. Rabalais 1 R. Eugene Turner 2 1 Louisiana Universities Marine Consortium 2 Louisiana State University Center for Sponsored Coastal Ocean Research, Coastal Ocean
Stable versus unstable planktonic food webs in oceans
 Stable versus unstable planktonic food webs in oceans L. Legendre 1, F. Rassoulzadegan 2 1 Département de biologie, Université Laval, Québec, QC G1K 7P4, Canada 2 Station Zoologique, BP 28, F-06230 Villefranche-sur-Mer,
A 9-year increasing trend in mesozooplankton biomass at the Hawaii Ocean Time-series Station ALOHA
 ICES Journal of Marine Science, 61: 457e463 (2004) doi:10.1016/j.icesjms.2004.03.023 A 9-year increasing trend in mesozooplankton biomass at the Hawaii Ocean Time-series Station ALOHA Cecelia C. Sheridan
Production vs Biomass
 Patterns of Productivity OCN 201 Biology Lecture 5 Production vs Biomass Biomass = amount of carbon per unit area (= standing stock * C/cell) Units (e.g.): g C m -2 Primary Production = amount of carbon
Patterns of Productivity
 Patterns of Productivity OCN 201 Biology Lecture 8 Primary Production - the production of autotrophic biomass Secondary Production - the production of heterotrophic biomass Production vs Biomass Biomass
Dead-Zones and Coastal Eutrophication: Case- Study of Chesapeake Bay W. M. Kemp University of Maryland CES Horn Point Laboratory Cambridge, MD
 Dead-Zones and Coastal Eutrophication: Case- Study of Chesapeake Bay W. M. Kemp University of Maryland CES Horn Point Laboratory Cambridge, MD Presentation to COSEE Trends Orientation at UMCES HPL 4 August
High-resolution estimates of net community production and air-sea CO 2 flux in the northeast Pacific
 GLOBAL BIOGEOCHEMICAL CYCLES, VOL. 26,, doi:10.1029/2012gb004380, 2012 High-resolution estimates of net community production and air-sea CO 2 flux in the northeast Pacific Deirdre Lockwood, 1 Paul D. Quay,
Relationships between Residence Time and Cyanobacterial Blooms in a Nutrient-Rich River System
 Relationships between Residence Time and Cyanobacterial Blooms in a Nutrient-Rich River System Michael F. Coveney, John C. Hendrickson, Erich R. Marzolf, Rolland S. Fulton, Jian J. Di, Clifford P. Neubauer,
Chemical Sensors on Profiling Floats
 Chemical Sensors on Profiling Floats Todd Martz Scripps Institution of Oceanography Ken Johnson MBARI AST-11 24 March 2010 Seven years of O 2 data near HOT from floats. Biggest challenge make data from
Deep sea gradients in [DOC]
![Deep sea gradients in [DOC]](/thumbs/72/66709616.jpg "Deep sea gradients in [DOC]") Deep sea gradients in [DOC] NMR and carbohydrate analyses of deep sea HMWDOC monosaccharide distribution surface relative % 5200m relative % NMR and carbohydrate analyses of deep sea HMWDOC 13 C- and 1
Deep sea gradients in [DOC] NMR and carbohydrate analyses of deep sea HMWDOC monosaccharide distribution surface relative % 5200m relative % NMR and carbohydrate analyses of deep sea HMWDOC 13 C- and 1
10 Productivity and Food Webs in the Sea. Notes for Marine Biology: Function, Biodiversity, Ecology By Jeffrey S. Levinton
 10 Productivity and Food Webs in the Sea Notes for Marine Biology: Function, Biodiversity, Ecology By Jeffrey S. Levinton Microbial Loop 2 Larger consumers Microbial loop DOC & POC Viruses Bacteria Herbivores
Phytoplankton Blooms in the Baltic Sea Numerical Simulations
 Dynamics of Phytoplankton Blooms in the Baltic Sea Numerical Simulations L. Dzierzbicka-Głowacka, and M. Janecki Abstract Dynamic of phytoplankton blooms in the Baltic Sea has been analyzed applying the
Carbon cycling and climate: the CO 2. connection
 Carbon cycling and climate: the C 2 connection Gasses in the ocean The carbonate system (and buffering in the ocean) Carbon dioxide and the climate connection. Importance of C 2 to climate C 2 acts like
Seasonal Anoxia over the Western Indian Continental Shelf
 Seasonal Anoxia over the Western Indian Continental Shelf S.W.A. Naqvi, Hema Naik, A.K. Pratihary, M. Gauns, Witty D Souza, Gayatree Narvenkar, D.A. Jayakumar, M.S. Shailaja & P.V. Narvekar National Institute
A mysterious CO2 anomaly in the atmosphere - how 2.5Gt of carbon came in 1988 and went in 1992
 A mysterious CO anomaly in the atmosphere - how.gt of carbon came in 1988 and went in 199 There is an unexplained atmospheric CO bubble centred around 1990. The apparent smooth and continuous rise in atmospheric
Chesapeake Bay. report card
 Chesapeake Bay report card 2010 C- C Healthy water quality provides better habitat conditions for crabs, fish, and other aquatic species. issolved oxygen is essential to the survival of all these organisms;
Quantification of the surface-atmosphere exchange of energy and carbon dioxide of an extensive urban green roof by eddy covariance measurements
 Quantification of the surface-atmosphere exchange of energy and carbon dioxide of an extensive urban green roof by eddy covariance measurements Gründach BER Structure Introduction Study area and measurement
Developing and optimizing a coordinated Salish Sea zooplankton monitoring program
 Western Washington University Western CEDAR Salish Sea Ecosystem Conference 2014 Salish Sea Ecosystem Conference (Seattle) May 1st, 3:30 PM - 5:00 PM Developing and optimizing a coordinated Salish Sea
Status of FerryBox Systems in Europe. Franciscus Colijn and Wilhelm Petersen HZG
 Status of FerryBox Systems in Europe Franciscus Colijn and Wilhelm Petersen HZG History of using Ships of Opportunity (SoOs) for Ocean Monitoring 1853 Brussels Conference: systemizing reporting of marine
Application of Gliders for Near-Real Time METOC Data Collection Capability for Battlespace Characterization
 DISTRIBUTION STATEMENT A: Approved for public release; distribution is unlimited. Application of Gliders for Near-Real Time METOC Data Collection Capability for Battlespace Characterization Charles Trees
A biological contribution to partial pressure of CO 2 in the western Arctic Ocean and Bering Sea
 A biological contribution to partial pressure of CO 2 in the western Arctic Ocean and Bering Sea *Futsuki, R. 1, T. Hirawake 2, A. Fujiwara 2,3, T. Kikuchi 4, S. Nishino 4, D. Sasano 5,6, M. Ishii 5,6,
Peatland Carbon Stocks and Fluxes:
 Peatland Carbon Stocks and Fluxes: monitoring, measurements and modelling Dr Andreas Heinemeyer ah126@york.ac.uk University of York, Stockholm Environment Institute UNFCCC 24 th October 2013 South Africa:
Overview of the Surface Hydrology of Hawai i Watersheds. Ali Fares Associate Professor of Hydrology NREM-CTAHR
 Overview of the Surface Hydrology of Hawai i Watersheds Ali Fares Associate Professor of Hydrology NREM-CTAHR 5/23/2008 Watershed Hydrology Lab 1 What is Hydrology? Hydrology is the water science that
OCN 201 Chemical Oceanography Class Notes, Fall Chemical Distributions: the roles of biology and physics
 The Nutrients OCN 201 Chemical Oceanography Class Notes, Fall 2001 Chemical Distributions: the roles of biology and physics Chris Measures Department of Oceanography The phytoplankton in the surface waters
MEDUSA. Model of Ecosystem Dynamics, nutrient Utilisation, Sequestration and Acidification. Julien Palmiéri, Andrew Yool, Katya Popova
 MEDUSA Model of Ecosystem Dynamics, nutrient Utilisation, Sequestration and Acidification Julien Palmiéri, Andrew Yool, Katya Popova Oxford 1-12-2015 UKESM1 and imarnet Development of UKESM1 required the
CO 2. and the carbonate system II. Carbon isotopes as a tracer for circulation. The (solid) carbonate connection with. The ocean climate connection
 carbonate connection with. The ocean climate connection") CO 2 and the carbonate system II Carbon isotopes as a tracer for circulation The (solid) carbonate connection with ocean acidity Climate The ocean climate connection The carbon cycle the carbon cycle involves
CO 2 and the carbonate system II Carbon isotopes as a tracer for circulation The (solid) carbonate connection with ocean acidity Climate The ocean climate connection The carbon cycle the carbon cycle involves
Nitrogen Cycling, Primary Production, and Water Quality in the New River Estuary. Defense Coastal/Estuarine Research Program (DCERP)
") Nitrogen Cycling, Primary Production, and Water Quality in the New River Estuary Defense Coastal/Estuarine Research Program (DCERP) Introduction: A key theme of the ongoing DCERP program is monitoring
Nitrogen Cycling, Primary Production, and Water Quality in the New River Estuary Defense Coastal/Estuarine Research Program (DCERP) Introduction: A key theme of the ongoing DCERP program is monitoring
Carbon Dioxide, Alkalinity and ph
 Carbon Dioxide, Alkalinity and ph OCN 62 Chemical Oceanography Reading: Libes, Chapter 15, pp. 8 94 (Remainder of chapter: Biogenic production, carbonate saturation and sediment distributions ) 1. CO 2
Phytoplankton and primary production 4
 Aquatic ecology BIO 4400 Phytoplankton and primary production 4 k a Bente Edvardsen 2009 Aims of learning - marine botany Give an understanding and knowledge on: Ecological role of phytoplankton Primary
Present and future ocean-atmosphere CO 2 fluxes, and EO measurement needs
 Present and future ocean-atmosphere CO 2 fluxes, and EO measurement needs Andy Watson, Ute Schuster, Jamie Shutler, Ian Ashton College of Life and Environmental Science, University of Exeter Parvadha Suntharalingam,
Includes the coastal zone and the pelagic zone, the realm of the oceanographer. I. Ocean Circulation
 Includes the coastal zone and the pelagic zone, the realm of the oceanographer I. Ocean Circulation II. Water Column Production A. Coastal Oceans B. Open Oceans E. Micronutrients F. Harmful Algal Blooms
Nitrate Dynamics at ALOHA and K2. Karen Casciotti Woods Hole Oceanographic Institution Department of Marine Chemistry and Geochemistry
 Nitrate Dynamics at ALOHA and K2 Karen Casciotti Woods Hole Oceanographic Institution Department of Marine Chemistry and Geochemistry VERTIGO 24 Experiments Nitrate isotopic profiles Coupled δ 15 N and
SWEM QUESTIONS FOR MODEL WORKSHOP
 SWEM QUESTIONS FOR MODEL WORKSHOP A. Management Overview What is the purpose (i.e., heuristic or predictive?) of the model as a management tool? In principle, SWEM is meant to be a predictive tool, although
Ammonia costs spike sharply higher Nitrogen prices disrupt calm in fertilizer market By Bryce Knorr, grain market analyst
 Ammonia costs spike sharply higher Nitrogen prices disrupt calm in fertilizer market By Bryce Knorr, grain market analyst Ammonia joined other forms of nitrogen in the parade of higher costs, with contracts
Solar Radiation Effects on Partial Pressure of Carbon Dioxide in Shallow Lakes
 LAWATER 218: 12TH ANNUAL LOUISIANA WATER CONFERENCE Solar Radiation Effects on Partial Pressure of Carbon Dioxide in Shallow Lakes Rongjie Yang, Y. Jun Xu*, Zhen Xu & Shiliang Liu School of Renewable Natural
Life in Water. Chapter 3
 Life in Water Chapter 3 Outline Hydrologic Cycle Oceans Shallow Marine Waters Marine Shores Estuaries, Salt Marshes, and Mangrove Forests Rivers and Streams Lakes 2 The Hydrologic Cycle Over 71% of the
Administration Division Public Works Department Anchorage: Performance. Value. Results.
 Administration Division Anchorage: Performance. Value. Results. Mission Provide administrative, budgetary, fiscal, and personnel support to ensure departmental compliance with Municipal policies and procedures,
Hypoxia in the Gulf of Mexico: Benefits and Challenges of Using Multiple Models to Inform Management Decisions
 Hypoxia in the Gulf of Mexico: Benefits and Challenges of Using Multiple Models to Inform Management Decisions Multiple Models for Management (M3.2) in the Chesapeake Bay February 25, 2013 Annapolis MD
OCEAN BIOGEOCHEMISTRY AND ECOLOGY, MODELING OF
 OCEAN BIOGEOCHEMISTRY AND ECOLOGY, MODELING OF N. Gruber, Institute of Biogeochemistry and Pollutant Dynamics, ETH Zurich, Switzerland S. C. Doney, Woods Hole Oceanographic Institution, Woods Hole, MA,
IN THE INDIAN OCEAN? Marta Álvarez
 IS THERE A HIGHER C ANT STORAGE IN THE INDIAN OCEAN? Marta Álvarez C. Lo Monaco, T. Tanhua, A. Yool, A. Oschlies, J.L. Bullister, C. Goyet, F. Touratier, E. McDonagh and H.L. Bryden. IMEDEA, CSIC UIB,
Context of the Program Element
 Context of the Program Element Scientific Rationale The need to understand how carbon cycles through the Earth system is critically important to our ability to predict future climate change. Carbon dioxide
Development of an integrated ISFET ph sensor for high pressure applications in the deep-sea
 Development of an integrated ISFET ph sensor for high pressure applications in the deep-sea Kenneth S. Johnson Monterey Bay Aquarium Research Institute 7700 Sandholdt Road Moss Landing, CA 95039 phone:
7.014 Lecture 20: Biogeochemical Cycles April 1, 2007
 Global Nutrient Cycling - Biogeochemical Cycles 7.14 Lecture 2: Biogeochemical Cycles April 1, 27 Uptake Bioelements in Solution Weathering Precipitation Terrestrial Biomass Decomposition Volatile Elements
Using satellite ocean colour data to inves1gate variability and climate change effects in phytoplankton
 IOCCG Ocean Op+cs School 2014 Using satellite ocean colour data to inves1gate variability and climate change effects in phytoplankton Stephanie Henson s.henson@noc.ac.uk MODIS true colour image August
John H. Kerr Dam and Reservoir Virginia and North Carolina (Section 216)
") John H. Kerr Dam and Reservoir Virginia and North Carolina (Section 216) Wilmington District, Corps of Engineers Stakeholder Update Presentation January 24, 2014 Authorized under Section 216 of Public
John H. Kerr Dam and Reservoir Virginia and North Carolina (Section 216) Wilmington District, Corps of Engineers Stakeholder Update Presentation January 24, 2014 Authorized under Section 216 of Public
The Global Carbon Cycle
 The Global Carbon Cycle Laurent Bopp LSCE, Paris Introduction CO2 is an important greenhouse gas Contribution to Natural Greenhouse Effect Contribution to Anthropogenic Effect 1 From NASA Website 2 Introduction
Principles of Terrestrial Ecosystem Ecology
 E Stuart Chapin III Pamela A. Matson Harold A. Mooney Principles of Terrestrial Ecosystem Ecology Illustrated by Melissa C. Chapin With 199 Illustrations Teehnische Un.fversitSt Darmstadt FACHBEREIGH 10
IMARES. Ecosystem Modelling Wadden Sea. Bert Brinkman IMARES Piet Ruardij NIOZ
 Ecosystem Modelling Wadden Sea Bert Brinkman Piet Ruardij NIOZ Why ecological models? Many questions (what is the effect of.. on the ecosystem functioning) cannot be answered by monitoring or direct measurements
Modeling Your Water Balance
 Modeling Your Water Balance Purpose To model a soil s water storage over a year Overview Students create a physical model illustrating the soil water balance using glasses to represent the soil column.
How Climate Change Affects the Physiology of Trees
 How Climate Change Affects the Physiology of Trees Jim Downer University of California Cooperative Extension ajdowner@ucdavis.edu http://ceventura.ucdavis.edu Things to consider Climate change: is it real?
Carbon Dioxide, Alkalinity and ph
 Carbon Dioxide, Alkalinity and ph OCN 623 Chemical Oceanography 31 January 2013 Reading: Libes, Chapter 15, pp. 383 394 (Remainder of chapter will be used with the lecture: Biogenic production, carbonate
Carbon Cycle Midterm Exam April 1, Answer Key
 Carbon Cycle Midterm Exam April 1, 2008 Answer Key 1. a. What process dominates the seasonal cycle in atmospheric O 2 at 41 S? Southern summer release and southern winter uptake by the ocean. Part due
Nitrogen and phosphorus cycling in the ocean
 Nitrogen and phosphorus cycling in the ocean Deborah A. Bronk Department of Physical Sciences Outline: 1. The Redfield ratio 2. Liebig s Law of the Minimum 3. The nitrogen cycle 4. The phosphorus cycle
What s Happening in Lake Whatcom?
 What s Happening in Lake Whatcom? Dr. Robin A. Matthews, Director Institute for Watershed Studies Huxley College of the Environment Western Washington University June 6, 2011 Site 2 Basin 2 Lake Whatcom
Modeling Chester River Water Quality...
 Modeling Chester River Water Quality... Jeremy Testa Damian Brady Kelly Cole Ming Li University of Maryland Center for Environmental Science University of Maine Outline (1) Quick update on ROMS (2) Comparison
Cattle Outlook. January, 2018
 Cattle Outlook January, 2018 Cattle Outlook January 2018 In This Issue: Supply Fundamentals Demand Fundamentals Summary 2 Historical Price Reference Where are Cattle Prices Currently, And Where are they
State of phytoplankton and. zooplankton in the Estuary and northwestern Gulf of St. Lawrence during Summary. DFO Science
 Fisheries and Oceans Canada Science Pêches et Océans Canada Sciences DFO Science Laurentian Region Stock Status Report C4-18 (2) State of phytoplankton and zooplankton in the Estuary and northwestern Gulf
Dairy Outlook. April By Jim Dunn Professor of Agricultural Economics, Penn State University. Market Psychology
 Dairy Outlook April 2017 By Jim Dunn Professor of Agricultural Economics, Penn State University Market Psychology The Class III price in March was $1.07 lower than in February, while the Class IV price
OREGON AND SW WA MARKET UPDATE February 2017
 OREGON AND SW WA MARKET UPDATE February 2017 Portland Metro and Southwest Washington (Multnomah, Clackamas, Washington, Columbia, & Clark Counties) Single Family Homes Resale (RMLS & Trendgraphix). Summary:
Changes in coastal environment and mass occurrence of jellyfish in Tokyo Bay. Haruto ISHII. (Tokyo University of Marine Science and Technology)
") Changes in coastal environment and mass occurrence of jellyfish in Tokyo Bay Haruto ISHII (Tokyo University of Marine Science and Technology) Ecosystem in hyper eutrophicated bay High concentrations of
Changes in coastal environment and mass occurrence of jellyfish in Tokyo Bay Haruto ISHII (Tokyo University of Marine Science and Technology) Ecosystem in hyper eutrophicated bay High concentrations of
Regional Habitat Indicators Project. Workshop #1. Nov 9, 2016
 Regional Habitat Indicators Project Workshop #1 Nov 9, 2016 Workshop Objectives Vet recommendations for management questions with Fist-to-Five Review and identify missing indicators Identify criteria for
Fertility management in organic strawberries
 Fertility management in organic strawberries Organic P management : P in composted manure is at least 70% as available as synthetic P fertilizer Using composted manure for N availability often results
People, Oceans and Climate Change
 People, Oceans and Climate Change A deeper look at the carbon dioxide cycle, greenhouse gases, and oceanic processes over the last 150 years OCN 623 Chemical Oceanography 18 April 2013 Reading: Libes,
Physiological response of Ostreococcus to nutrient depletion
 Physiological response of Ostreococcus to nutrient depletion Mentors: Dr. Alex Worden and Dr. Amy Zimmerman Summer 2014 Keywords: Biogeochemistry, Marine Biology, Microbiology, Phytoplankton and Stoichiometry
Ocean Fertilization Ironing Out Uncertainties in Climate Engineering
 Ocean Fertilization Ironing Out Uncertainties in Climate Engineering Ken Buesseler Senior Scientist Marine Chemistry and Geochemistry Dept. Woods Hole Oceanographic Institution Elisabeth and Henry Morss
Carbonate rocks 60 x 10 6 GT C. Kerogen 20 x 10 6 GT C. Atmospheric CO GT C. Terrestrial Plants 900 GT C. Uplift, exposure and erosion
 Atmospheric CO 2 750 GT C Uplift, exposure and erosion Terrestrial Plants 900 GT C Soils 2000 GT C Carbonate rocks 60 x 10 6 GT C Terrestrial Primary Production 50-100 GT C yr -1 River flux 0.5 GT C yr
ESCI-61 Introduction to Photovoltaic Technology
 April 7, 2010 1 ESCI-61 Introduction to Photovoltaic Technology Lecture #1 Ridha Hamidi, Ph.D. April 7, 2010 2 Today s Agenda 3:30-4:00 - Green sheet review and introductions 4:00-4:45 - Group Research
The role of freshwater ecosystems in carbon and nutrient cycling on the catchment scale. LSUE external launch Steven Bouillon
 The role of freshwater ecosystems in carbon and nutrient cycling on the catchment scale LSUE external launch Steven Bouillon Why are freshwater ecosystems important? CO 2 efflux 0.8 Pg C y -1 ~1.9 Pg C
Manual for Marine Monitoring in the COMBINE. Programme of HELCOM. Part C Programme for monitoring of eutrophication and its effects
 Manual for Marine Monitoring in the COMBINE Programme of HELCOM Part C Programme for monitoring of eutrophication and its effects Last updated: 31.03.2006 PART C PROGRAMME FOR MONITORING OF EUTROPHICATION
Responses of Marine Ecosystems to a Changing Climate
 Responses of Marine Ecosystems to a Changing Climate Ken Denman Fisheries and Oceans Canada EC Canadian Centre for Climate Modelling and Analysis c/o University of Victoria, BC, Canada & Institute of Ocean
Chapter Concepts LIFE IN WATER. The Hydrologic Cycle. The Hydrologic Cycle
 Chapter Concepts Chapter 3 LIFE IN WATER The hydrologic cycle exchanges water among reservoirs The biology of aquatic environments corresponds broadly to variations in physical factors such as light, temperature,
Global. Carbon Trends. Pep Canadell Global Carbon Project CSIRO Marine and Atmospheric Research Canberra, Australia
 Global Carbon Trends Pep Canadell Global Carbon Project CSIRO Marine and Atmospheric Research Canberra, Australia Outline 1. Recent Trends 2. Perturbation Budget 3. Sink Efficiency 4. Attribution 5. Processes
LOCATE Land Ocean Carbon Transfer. Richard Sanders and Dan Mayor, NOC April 2017
 LOCATE Land Ocean Carbon Transfer Richard Sanders and Dan Mayor, NOC April 2017 rics@noc.ac.uk Soil C pool is large Regulates climate 4 x ocean DOC 6 x combusted fossil fuel IPCC 2013 Org C key element
Robert J. Olson Woods Hole Oceanographic Institution, MS 32, Woods Hole, MA Phone: (508) FAX: (508)
 FAX: (508)") Plankton Analysis by Automated Submersible Imaging Flow Cytometry: Transforming a Specialized Research Instrument into a Broadly Accessible Tool and Extending its Target Size Range Robert J. Olson Woods
Plankton Analysis by Automated Submersible Imaging Flow Cytometry: Transforming a Specialized Research Instrument into a Broadly Accessible Tool and Extending its Target Size Range Robert J. Olson Woods
Reduced GPP and R eco CO 2 flux, but no ecosystem C loss under elevated O 3 Volk et al. Agroscope Reckenholz-Tänikon Research Station ART
 1 2 3 Federal Department of Economic Affairs FDEA Agroscope Reckenholz-Tänikon Research Station ART Subalpine grassland shows reduced GPP and R eco at elevated, but no substantial ecosystem C losses Matthias
MONDAY, 27 FEBRUARY 2017
 MONDAY, 27 FEBRUARY 2017 Room 301 B 302 A/B 304 A/B 305 A/B 306 A 306 B 308 A/B 199 168 258 162 150 168 194 9:00-9:50 9:50 - MORNING PLENARY - Marcia McNutt - 9:00 to 9:50 Session# 71 96 12 9 34 58 65
Deep sea gradients in [DOC]
![Deep sea gradients in [DOC]](/thumbs/72/66709491.jpg "Deep sea gradients in [DOC]") Deep sea gradients in [DOC] NMR and carbohydrate analyses of deep sea HMWDOC monosaccharide distribution surface relative % 5200m relative % NMR and carbohydrate analyses of deep sea HMWDOC 13 C- and 1
Deep sea gradients in [DOC] NMR and carbohydrate analyses of deep sea HMWDOC monosaccharide distribution surface relative % 5200m relative % NMR and carbohydrate analyses of deep sea HMWDOC 13 C- and 1
Climate Action Planning at Rice University. Richard R. Johnson Admin. Center for Sustainability and Energy Management 27 April 2016
 Climate Action Planning at Rice University Richard R. Johnson Admin. Center for Sustainability and Energy Management 27 April 2016 Mid 2000s: Climate Change Reaches Mainstream Rice University Commits to
The Impacts of Climate Change on Portland s Water Supply
 The Impacts of Climate Change on Portland s Water Supply Richard Palmer and Margaret Hahn University of Washington Department of Civil and Environmental Engineering Joe Dvorak, Dennis Kessler, Azad Mohammadi
The Global Carbon Cycle
 The Global Carbon Cycle Tom Bibby September 2003 bibby@imcs.rutgers.edu falko@imcs.rutgers.edu The Carbon Cycle - Look at past climatic change; as controlled by the carbon cycle. - Interpret the influence