SEPTEMBER 18 22, /3/ Final PWSA CPE Report
|
|
|
- Kristian Griffith
- 6 years ago
- Views:
Transcription
1 RESULTS OF THE COMPREHENSIVE PERFORMANCE EVALUATION FOR THE PITTSBURGH WATER & SEWER AUTHORITY ASPINWALL WATER FILTRATION PLANT PITTSBURGH, PENNSYLVANIA SEPTEMBER 18 22, /3/ Final PWSA CPE Report
2 Prepared By: Pennsylvania Department of Environmental Protection Rachel Carson State Office Building 400 Market Street Harrisburg, Pennsylvania US Environmental Protection Agency Region III Water Protection Division Office of Drinking Water and Source Water Protection 1650 Arch Street Philadelphia, Pennsylvania US Environmental Protection Agency Office of Water Office of Ground Water and Drinking Water Standards and Risk Management Division Technical Support Center 26 W. M.L. King Drive Cincinnati, Ohio Process Applications, Inc Redwing Road, Suite 340 Fort Collins, Colorado /3/ Final PWSA CPE Report
3 Table of Contents Page No. SITE VISIT INFORMATION 6 INTRODUCTION 8 DESCRIPTION OF WATER TREATMENT PLANT 9 Overview 9 Water Treatment Processes 10 PERFORMANCE ASSESSMENT 12 Historical Performance Assessment 12 Performance Summary 27 Special Studies 28 MAJOR UNIT PROCESS EVALUATION 51 PERFORMANCE-LIMITING FACTORS 57 FACTORS SUMMARY CHART 57 A FACTOR EXAMPLES 58 B FACTOR EXAMPLES 66 C FACTOR EXAMPLES 69 APPENDIX MPA RESULTS 71 PWSA ORGANIZATIONAL CHART 74 11/3/ Final PWSA CPE Report
4 List of Figures Page No. FIGURE 1 Process Flow Schematic of the Aspinwall Plant 10 FIGURE 2 Filter Effluent Configuration 14 FIGURE 3 OAS Turbidity Data Profile 17 FIGURE 4 Daily Maximum Clarified and Settled Turbidity Trends 18 FIGURE 5 Daily Maximum IFE and CFE Turbidity Trends 18 FIGURE 6 Filters 2 and 17 IFE Maximum Daily Turbidity Trends 21 FIGURE 7 Giardia Inactivation Ratio Calculated by CPE Team 25 FIGURE 8 CPE Calculated & PWSA Reported Giardia Inactivation Ratios 26 FIGURE 9 Filter 18 Waste Backwash Water Turbidity Profile 31 FIGURE 10 Example Filter 18 Flow Anomaly During Backwash Event 32 FIGURE 11 Filter 18 Recovery Curve Following Backwash 33 FIGURE 12 Turbidimeter Flow Rate vs. Manufacturer Specifications 37 FIGURE 13 Turbidimeter Sample Detention Time Check 38 FIGURE 14 Filter 12 IFE Turbidity Profile January 24-25, FIGURE 15 North and South CFE Turbidity August 31, FIGURE 16 Raw, Settled, & Clarified Turbidity Comparison 44 FIGURE 17 North CFE, South CFE, Filter 9 and Filter 16 IFE Turbidity 45 FIGURE 18 Water Quality Grab Sample Results 49 FIGURE 19 Total Manganese Trend at Each Unit Process 50 FIGURE 20 Major Unit Process Evaluation 52 11/3/ Final PWSA CPE Report
5 List of Tables TABLE 1 CPE Turbidity Performance Analysis Data Acquisition Description 13 TABLE 2 OAS Summary Statistics 16 TABLE 3 IFE Turbidity 95 th Percentile by Month for Each Filter 20 TABLE 4 Backwash Return to Service Performance 22 TABLE 5 Individual Backwash Recovery and Filter Performance 23 TABLE 6 Aspinwall Treatment Plant Performance Summary 27 TABLE 7 Filter 18 Backwash Description 28 TABLE 8 Turbidimeter Settings 39 TABLE 9 Online Chlorine Analyzer Settings Check 46 TABLE 10 Results of Coagulant Dosage Evaluation 47 TABLE 11 Coordinated Water Quality Grab Sample Results 48 TABLE 12 Summary of Performance Limiting Factors 57 11/3/ Final PWSA CPE Report
6 SITE VISIT INFORMATION Site and Mailing Address: Pittsburgh Water & Sewer Authority Aspinwall, Pennsylvania Date of Site Visit: September 18-22, 2017 Aspinwall Plant Personnel Participating: Robert Weimar Interim Executive Director Alex Sciulli Consultant to Water Production Team Deb Lestitian Chair, PWSA Board Kate Mechler Program Manager, Capital Programs Jim Paparocki Maintenance Manager, Water Production Jeff Turko Operations Manager, Water Production Faith Wydra Environmental Compliance Manager Mike Czypinski Acting Laboratory and Compliance Manager Dr. Stanley States Operations Consultant, Texas A&M Terry Campbell - Maintenance Consultant, Optimum Controls Corp. Kent Lindsay - Director of Finance 11/3/ Final PWSA CPE Report
7 CPE Team: Larry DeMers Process Applications, Inc., 2627 Redwing Rd., #340, Ft. Collins, CO ; Bill Davis Process Applications, Inc., 2627 Redwing Rd., #340, Ft. Collins, CO ; Jennifer Bunton Process Applications, Inc., 2627 Redwing Rd., #340, Ft. Collins, CO ; Rick Lieberman US Environmental Protection Agency, Technical Support Center, 26 W. M.L. King Drive, Cincinnati, OH 45268, , Alison Dugan US Environmental Protection Agency, Technical Support Center, 26 W. M.L. King Drive, Cincinnati, OH 45268, , Matt Alexander US Environmental Protection Agency, Technical Support Center, 26 W. M.L. King Drive, Cincinnati, OH 45268, , Kelly Moran US Environmental Protection Agency, Region 3, 1650 Arch Street, Philadelphia, PA , , Rick Rogers US Environmental Protection Agency, Region 3, 1650 Arch Street, Philadelphia, PA , , Ed Chescattie Pennsylvania Department of Environmental Protection, Rachel Carson State Office Building, 400 Market Street, Harrisburg, PA 17101, , Bethany Shrodo Pennsylvania Department of Environmental Protection, 208 West Third St. Suite 101, Williamsport, PA 17701, , Mike Hess Pennsylvania Department of Environmental Protection, Rachel Carson State Office Building, 400 Market Street, Harrisburg, PA 17101, , Kevin Anderson Pennsylvania Department of Environmental Protection, Rachel Carson State Office Building, 400 Market Street, Harrisburg, PA 17101, , Renee Diehl Pennsylvania Department of Environmental Protection, 400 Waterfront Drive, Pittsburgh, PA 15222, , John Paone Pennsylvania Department of Environmental Protection, 400 Waterfront Drive, Pittsburgh, PA, , Laura Blood Pennsylvania Department of Environmental Protection, Address, , 11/3/ Final PWSA CPE Report
8 INTRODUCTION The Composite Correction Program (CCP) 1 is an approach developed by the U. S. Environmental Protection Agency (USEPA) and Process Applications, Inc. (PAI) to improve surface water treatment plant performance and to achieve compliance with the Surface Water Treatment Rule (SWTR). Its development was initiated by PAI and the State of Montana 2, which identified the need for a program to manage performance problems at its surface water treatment plants. A Comprehensive Performance Evaluation (CPE) is a thorough evaluation of an existing treatment plant, resulting in a comprehensive assessment of the unit process capabilities and the impact of the operation, maintenance, and administrative practices on performance of the plant. The results of the evaluation establish the plant capability to consistently meet the optimization goals and list a set of prioritized factors limiting performance. Follow up technical assistance can be used to improve performance of an existing plant by systematically addressing the factors limiting performance identified during the CPE. The federal Surface Water Treatment Rule (SWTR), Interim Enhanced Surface Water Treatment Rule, and Long-Term 1 Enhanced Surface Water Treatment Rules require plants to achieve less than 0.3 NTU (nephelometric turbidity units) in 95 percent of the monthly combined filter effluent samples and to monitor individual filter performance. The enhanced SWTR requirements have been in effect for all surface water treatment plants since Research results and field experience have shown that achieving 0.3 NTU does not guarantee protection against some pathogenic microorganisms, as evidenced by some waterborne disease outbreaks. Producing a finished water with a turbidity of less than or equal to 0.10 NTU provides much greater protection against pathogens like Cryptosporidium. This microorganism passed through the public water supply and was responsible for a large outbreak of Cryptosporidiosis in Milwaukee, Wisconsin, in April 1993, where 400,000 people became ill and nearly 100 died. 1 Hegg, B.A., L.D. DeMers, J.H. Bender, E.M. Bissonette, and R.J. Lieberman, Handbook - Optimizing Water Treatment Plant Performance Using the Composite Correction Program, EPA 625/6-91/027, USEPA, Washington, D.C. (August 1998). 2 Renner, R.C., B.A. Hegg, and D.F. Fraser, Demonstration of the Comprehensive Performance Evaluation Technique to Assess Montana Surface Water Treatment Plants, Association of State Drinking Water Administration Conference, Tucson, AZ (February 1989). 11/3/ Final PWSA CPE Report
9 Cryptosporidium oocysts are extremely resistant to chlorine disinfection, necessitating properly operated physical removal barriers. Studies have shown that when filter effluent turbidities exceed 0.10 NTU, the likelihood of Cryptosporidium breakthrough increases. This CPE was conducted at the Pittsburgh Sewer and Water Authority s (PWSA) Aspinwall Water Treatment Plant (WTP). During the CPE, all aspects of water treatment administration, data, design, operation, and maintenance were evaluated with respect to their impact on achieving optimal performance of the turbidity and disinfection barriers. Each unit process at the Aspinwall WTP up to the entry point was evaluated in this CPE. PWSA also oversees operation of a membrane filtration plant, the Highland Park plant, which was offline for repairs, and not included in this CPE. PWSA Interim Executive Director, Mr. Robert Weimer, was the lead point of contact when scheduling this CPE. The CPE team would like to thank Mr. Weimer and all the plant staff for taking the time out of their busy schedules to fully participate in this CPE. During the evaluation, plant staff members acted in a professional manner, openly discussed current and past operational practices, and demonstrated a genuine interest in obtaining input on methods to improve future plant performance. This type of positive attitude represents a solid foundation for tackling the current and future challenges that PWSA is working to resolve. This report documents the findings of the CPE conducted at the PWSA Aspinwall WTP on September 19-21, DESCRIPTION OF WATER TREATMENT PLANT Overview The PWSA Aspinwall WTP supplies potable water for approximately 80percent of the City of Pittsburgh and Millvale Borough and sells bulk water to Reserve Township, Fox Chapel Authority, Aspinwall Borough, and the Hampton Shaler Water Authority, all in southwestern Pennsylvania. The plant is designed to treat source water from the Allegheny River through coagulation, flocculation, clarification, sedimentation, filtration, and disinfection. 11/3/ Final PWSA CPE Report
10
11 From the influent stilling basin, water flows through two traveling screens. After the screens, ferric chloride is added in a common trough prior to rapid mix. The water then flows through four constant speed flash mixers in series. Lime is added to the first chamber, and cationic polymer is added to the third chamber. Caustic soda and/or activated carbon can be fed into each of the rapid mix chambers. The estimated contact time in each mixer was approximately 30 seconds according to the PWSA engineering consultants. From the rapid mix basins, water flows by gravity to four flocculation and clarification basins. Each clarification unit includes two, 2-stage flocculators and a conventional sedimentation basin (referred to as a clarifier by PWSA staff). The flocculators are operated at constant speed. Waste sludge is scraped from the bottom of the sedimentation basin, via an automated removal system, and sent to the clarifier residual distribution chamber. Clarifier effluent water flows over weirs and is sent to a central receiving basin where the flow is split to two large uncovered concrete sedimentation basins. There is no automated sludge removal mechanism provided for these basins. From the sedimentation basins, water flows to the filter building; chlorine and cationic polymer are added prior to the filter splitter box. From the splitter box, water flows to 18 dual media (18 inches anthracite and 12 inches sand) filters. Flow onto the filters is controlled by modulating valves on the individual filter effluent lines. Each filter has two cells. The cells have separate underdrain systems and are washed independently. Each filter is backwashed just prior to approximately 100 hours of run time. Filtered water is used for backwashing, but the distribution system water can also be utilized for backwashing as long as adequate distribution system pressure is available (e.g. not available while Lamphur reservoir is offline). Backwash begins with air scour, followed by combined air and water wash, high rate water only wash, and then ETSW. Spent backwash water is sent to the backwash storage tank. This plant has always had filter to waste capabilities, but just recently began using filter to waste; water filtered to waste is sent to the backwash storage tank. Supernatant from the backwash storage tank is recycled to the East intake stilling basin constantly at a rate of five percent (capacity exists to recycle at a rate of 10 percent). Each filter has one individual filter effluent sample line that carries a sample stream to a Hach 1720E turbidimeter. The current 11/3/ Final PWSA CPE Report
12 location of sample taps leaves one cell of each filter unmonitored. The filters discharge into an effluent pipe where chlorine is added for disinfection. Redacted-Security Issue PERFORMANCE ASSESSMENT Historical Performance Assessment To achieve optimized performance, a water treatment plant must demonstrate that it can take a raw water source of variable quality and produce consistent, high quality finished water. Further, the performance of each unit process must demonstrate its capability to act as a barrier to the passage of particles at all times. The CPE team used turbidity data collected from the Aspinwall plant s continuous reading turbidimeters and laboratory log sheets (representing grab sampling results) to assess the effectiveness of the flocculation/clarification/sedimentation and filtration barriers. The turbidity data used in the performance evaluation were collected over a 12-month period, starting September 19, 2016 and ending September 18, The CPE team also used Giardia log inactivation calculations to assess the performance of the disinfection barrier. The data used to assess the disinfection barrier were obtained from the spreadsheet PWSA is using to report their 11/3/ Final PWSA CPE Report
13 daily log inactivation to PA DEP as well as data from the Pennsylvania Drinking Water Information System (PADWIS). Disinfection data were only available from the time period May 5 through August 31, See Table 1 for a discussion of the data sources used in the CPE performance analysis. TABLE 1. CPE Performance Analysis Data Acquisition Description Performance Parameter Raw water turbidity Clarifier turbidity Settled water turbidity Individual Filter Effluent (IFE) turbidity Data Used in the CPE Performance Analysis Data were taken from daily log sheets kept in the Aspinwall laboratory. Records were not available for the time period between September 19 and October 31, Lab personnel collect raw water turbidity grab samples once per day from a sample location in the river, prior to the water being exposed to permanganate. There is a continuous analyzer that measures raw water turbidity prior to coagulant addition but the continuous data were not used for this analysis due to the presence of permanganate in the water at the sample point, potentially affecting the turbidity measurement, and the capping of the continuous data at 100 NTU. The grab sample data were not capped. Data were taken from fifteen-minute readings extracted from the plant Supervisory Control and Data Acquisition (SCADA) system. The clarifier continuous turbidity sample location is on the combined clarifier flume prior to leaving the clarification building and prior to the transmission line to the settling ponds, so the readings represent the turbidity from the mixed water coming from all the clarifiers in operation. Data were taken from one-minute readings extracted from the plant SCADA system. The settled water continuous turbidity sample location is on the transmission line from the settling ponds, so the readings represent the turbidity from the mixed water coming from both ponds. Data were taken from fifteen-minute readings extracted from the plant SCADA system. The IFE continuous turbidity sample location at each filter is located on a manifold line that connects two separate filter cells. The meter is generally closest to the filter cell furthest from the filter effluent line. A filter effluent configuration diagram showing the approximate IFE turbidity sample location for a typical filter is provided in Figure 2. The data extracted from the SCADA historian was further processed by the CPE team to attempt to exclude data that represented turbidity during times when the filter was not in service. This was done by reviewing the filter flow rate (also extracted from the SCADA historian) and excluding all turbidity data when the flow rate seemed to be at or near zero. Due to anomalies in the filter flow rate data (See Special Study 2 and Figure 10) the turbidity values occurring when the flow read 1.3 MGD or below were excluded. Post backwash 11/3/ Final PWSA CPE Report
14
15 Turbidity Evaluation Raw water, settled water, IFE, and CFE turbidity data were entered into an Optimization Assessment Spreadsheet (OAS), and analyzed through the spreadsheet calculations and charts. Table 2 shows the OAS summary statistics for the plant. The statistics in Table 2 show the maximum daily values for raw, settled, IFE, and CFE turbidity during the September 19, 2016 to September 15, 2017 period, along with a comparison to optimization goals. For optimization purposes, the maximum daily turbidity readings are used to show the daily worst case performance by each of the barriers. If the plant can perform within the optimization goals at the time of its worst daily performance, then the plant staff can be assured that it is also meeting the goals during the rest of the day and providing the maximum public health protection. Table 2 shows that the annual average daily maximum raw water turbidity for the Aspinwall WTP was 16.1 NTU. For raw water conditions such as this, where the annual average daily maximum raw water turbidity is above 10 Nephelometric Turbidity Units (NTU), the optimization goal for settled water turbidity is 2.0 NTU in 95 percent of daily readings. The daily maximum clarified water and settled water turbidity met the optimization goal on only 0.3 and 52.2 percent of the days respectively. The daily maximum clarified water turbidity was 10.0 NTU in 95percent of the days and the daily maximum settled water turbidity was 5.0 NTU on 95 percent of the days during the evaluation period. It should be noted that both of these statistics were derived from data that had been capped by the SCADA system historian so the actual 95 th percentile of both readings was higher. Table 2 shows that the daily maximum IFE turbidity values (labeled as max. filtered turbidity ) met the optimization goals on about 10.7 percent of the days analyzed. The daily maximum IFE values were 0.52 NTU or less on 95 percent of the days analyzed. The daily maximum CFE values (labeled as combined filtered turbidity ) met the optimization goal of 0.10 NTU on 66 percent of the days analyzed; CFE values were 0.83 NTU or less during 95 percent of the days in the period. 11/3/ Final PWSA CPE Report
16 TABLE 2. OAS Summary Statistics ANNUAL DATA Avg Min Max RSQ 95% Opt. Goal Reg. NTU NTU NTU NTU % Values % Values Raw Turbidity n/a 51.7 n/a n/a Max. Clarifier Turbidity n/a Max. Settled Turbidity n/a Max. Filtered Turbidity n/a Combined Filtered Turbidity RSQ = Correlation Coefficient for two selected data-sets (>0.25 suggests correlation). 95percent = 95th percentile value for data-set. Opt. Goal = Percent of values in data-set that are less than or equal to the selected optimization turbidity goal. Reg. = Percent of values in data-set that are less than or equal to the regulated turbidity requirement. While Table 2 provides a summary of the plant s turbidity performance compared to the optimization goals, Figure 3 provides a visual representation of the plant turbidity profile compared to the optimization goals. The figure shows that higher raw water turbidity values occurred intermittently throughout the year. The lowest clarified water turbidity values tended to occur when the raw water turbidity was also low, around late October and early November 2016 but the clarifier performance was inconsistent all year and reached the data cap of 10 NTU on many occasions. The settled water turbidity tended to be lower than the clarified water turbidity but it also reached its data cap often, so the maximum settled water turbidities for many days cannot be reliably verified as lower than the clarified water turbidity. The data cap for clarified water was 10 NTU and the data cap for settled water was 5 NTU. Capping of these data would skew the RSQ result such that any correlation between raw water turbidity spikes and clarified water spikes would not be accurately measured. Passage of turbidity spikes from the raw through the clarifiers and/or the sedimentation ponds would represent the potential for higher risk of pathogens passing through the treatment barriers. Data capping prevents the ability of the PWSA plant staff to assess that risk. The data capping of the clarified turbidity and settled water turbidity is more evident when those two trends are isolated in Figure 4. Figure 4 also shows performance relative to the settled water turbidity goal for the settling processes. 11/3/ Final PWSA CPE Report

17

18
19 Table 3 shows the 95 th percentile turbidity values for each filter by month and summarizes the entire year of the study period. Blank cells in the table indicate no turbidity data was available from the 15-minute SCADA extraction for that time period. The CPE team assessed the filter rehabilitation project schedule and confirmed that the lack of turbidity data during those time periods were due to the filters being out of service for upgrading. The highest 95 th percentile value for each month is shown in red in the table. Table 3 shows filter 2 was the only filter to meet the 0.10 NTU optimization goal 95percent of the days evaluated. Filter 17 was the worst performing filter, meeting the goal only 71.5 percent of the days during the evaluation period. The 95 th percentile for filter 17 was 0.24 NTU. Filter 12 had the worst performance for three consecutive months during the December to February period. As a comparison, the annual maximum daily turbidity data from Filters 2 and 17 are shown in Figure 6. The filter 2 trend line in Figure 6 is less erratic than the trend line for filter 17, indicating more consistent performance. It also shows a trend that is more consistently below the goal of 0.10 NTU. 11/3/ Final PWSA CPE Report
20 TABLE 3. IFE Turbidity 95 th Percentile by Month for Each Filter Filtered Water Turbidity 95th Percentile Values (NTU) Filter 1 Filter 2 Filter 3 Filter 4 Filter 5 Filter 6 Filter 7 Filter 8 Filter 9 Filter 10 Filter 11 Filter 12 Filter 13 Filter 14 Filter 15 Filter 16 Filter 17 Filter 18 Combined Sep Oct Nov Dec Jan Feb Mar Apr May Jun Jul Aug Yr. 95% Yr. Goal 96.7% 84.7% 82.2% 78.7% 85.5% 80.0% 75.9% 85.1% 88.9% 84.7% 77.8% 80.5% 71.5% 73.7% 66.4% 11/3/ Final PWSA CPE Report
21 Filter 2 Filter Effluent Turbidity (NTU) Effluent Turbidity (NTU) Sep-16 Oct-16 Nov-16 Dec-16 Jan-17 Feb-17 Mar-17 Apr-17 May-17 Jun-17 Jul-17 Aug-17 Sep Sep-16 Oct-16 Nov-16 Dec-16 Jan-17 Feb-17 Mar-17 Apr-17 May-17 Jun-17 Jul-17 Aug-17 Sep-17 FIGURE 6. Filters 2 and 17 IFE Maximum Daily Turbidity Trends The optimization goal for individual filters that have filter to waste capability is to filter to waste following each filter backwash, and return the filter to service with turbidity less than 0.10 NTU and for the filter performance to remain less than 0.10 NTU for the entire filter run. The summary statistics from previously discussed Table 2 revealed poor IFE and CFE performance. Since filter to waste capability was not being utilized, data from the SCADA historian were available for analysis of filter performance during the ripening period. The 15-minute data from the SCADA historian were used to document all the backwashes at the Aspinwall plant during February 2017 (representing a time when water temperatures would be cold and filter recovery might be a challenge) and during the August 15 to September 18, 2017 period (representing the most recent time period prior to the CPE site visit). The data were analyzed by trending the filter effluent flow and filter turbidity data and finding typical backwash spikes after a period with low flow. Table 4 summarizes the backwash return to service performance statistics for the time periods evaluated. 11/3/ Final PWSA CPE Report
22

23
24 to achieve and maintain optimized performance. Optimizing the backwash procedure could reduce the recovery time of the filters and reduce the time necessary for filter to waste. Disinfection Evaluation The disinfection treatment process is an important barrier to microorganisms in any surface water treatment plant. In addition to maintaining adequate turbidity removal via pretreatment and filtration, the Aspinwall WTP is also required to maintain an additional 90percent (1-log) inactivation of Giardia cysts, and 99.99percent (4-log) inactivation of viruses in accordance with Pennsylvania regulations. To evaluate the disinfection process, the CPE team collected data from the spreadsheet PWSA is using to report their daily log inactivation to Pennsylvania Department of Environmental Protection (PA DEP) and the PADWIS to calculate inactivation ratios. This data included maximum daily flow, minimum daily temperature, maximum daily ph, minimum daily depth of the clear well, and minimum daily chlorine residual. The inactivation ratio is the concentration of disinfectant residual times the contact time through the disinfection zone (C x T or CT) achieved at the plant on a particular day, divided by the CT required (CTreq) to achieve 1.0 log inactivation of Giardia cysts. The CPE team calculated the plant inactivation ratios for May 5 through August 31, Graphical representation of the data is depicted in Figure 7. During a prior evaluation conducted by the PA DEP in April of 2017, the physical characteristics of the clear well were observed as they related to the baffling factor of 0.48 being used by PWSA staff for CT calculations at that time. PA DEP staff determined during that evaluation that a baffling factor of 0.3 was the maximum that could be allowed without a tracer study, given the clear well design. The PWSA staff immediately implemented use of the 0.3 baffling factor in plant disinfection calculations. The Giardia inactivation ratios shown in Figure 7 were generated using a baffling factor of 0.3, data compiled by PWSA for daily calculation of inactivation ratios (PWSA Log Inactivation Data spreadsheets), and minimum daily entry point chlorine residuals reported to PADWIS. As shown in Figure 7, the plant typically was not challenged to meet the required inactivation ratio during the evaluation period. The inactivation ratio fell below 2.0 in late June due to low 11/3/ Final PWSA CPE Report

25 chlorine residual in the clear well. During a CPE, the inactivation ratio would typically be assessed over the past year, but the CPE team was not able to locate data needed for CT calculations prior to May 5, Ideally, the inactivation ratio should be evaluated during the winter months when the source water has a lower temperature. FIGURE 7. Giardia Inactivation Ratio Calculated by CPE Team The inactivation ratios calculated by the CPE team were compared to the inactivation ratios reported to the PA DEP during the same period. This comparison, shown in Figure 8, indicates that inactivation ratios reported by PWSA for the Aspinwall WTP were consistently higher than those calculated by the CPE team. Analysis of the data indicates that the discrepancy may be due to the way the minimum chlorine residual is being determined each day and to minor differences in the calculation of minimum daily depth or volume of the clear well. As a result, the method of determining minimum chlorine residual and minimum clear well volume should be reviewed to ensure that disinfection requirements are met using accurate and representative data. 11/3/ Final PWSA CPE Report
26 14 PWSA Calculation CPE Team Calculation 12 Inactivation Ratio (M/R) /5/2017 5/25/2017 6/14/2017 7/4/2017 7/24/2017 8/13/2017 9/2/2017 FIGURE 8. Comparison of CPE-Calculated and PWSA-Reported Inactivation Ratios 11/3/ Final PWSA CPE Report
27 Performance Summary The performance observations described above are summarized in Table 6. TABLE 6. Aspinwall Treatment Plant Performance Summary Barrier Optimization Goal Performance Sedimentation Filtration Disinfection Settled water turbidity 2 NTU or less 95 percent of the time based on daily maximum values. IFE and CFE turbidities 0.10 NTU or less 95 percent of the time based on daily maximum values. Inactivation ratio above 1-log every day that the plant is in operation. The clarified water turbidity met the settled water goal only 0.3 percent of the days in the most recent year. The 95 th percentile turbidity value of the clarified water was equal to the data cap of 10 NTU. The settled water turbidity from the settling ponds met the goals 52percent of the days with a 95 th percentile turbidity value equal to the data cap of 5.0 NTU. Capping of data prevented an accurate assessment of raw water turbidity spikes passing through the clarification and sedimentation processes. The daily maximum turbidity values from the IFE data set show the filters to meet the optimization goal in 10.7 percent of the days in the most recent year. The 95 th percentile turbidity value was 0.52 NTU. The daily maximum values from the CFE turbidity records in the last year show the optimization goal to be achieved at the Aspinwall plant 66.4percent of the days. The 95 th percentile turbidity value over that period is 0.83 NTU. The disinfection process met the inactivation ratio goal every day during the period reviewed (May 5 thru August 31, 2017). Data prior to May 5 was not evaluated as PWSA staff only recently started tracking inactivation ratios using a CT spreadsheet that was provided by PA DEP. 11/3/ Final PWSA CPE Report
28 Special Studies During the CPE, several special studies were conducted for use in assessing plant performance and process control. These studies included: 1) a filter bed expansion, 2) filter backwash cleaning efficiency, 3) post-backwash turbidity recovery; 4) microscopic particulate analysis, and 5) turbidity data integrity assessment, which consisted of four smaller studies 6) online chlorine analyzer setting check 7) coagulant dosage evaluation, and 8) coordinated water quality grab sampling Special Study 1: Filter Bed Expansion For the filter related studies, Filter 18 was selected because it was close to the maximum filter run time targeted by the operators (i.e., 100 hours) on the day of the study. All the filters have been recently renovated, and the filter media includes 12 inches of sand and 18 inches of anthracite for a total media depth of 30 inches. A recently implemented filter backwash routine is summarized in Table 7. During the air scour event, even distribution of the air flow was observed across both halves of filter 18, and during the high rate water wash, similar flow distribution was observed across both filter cells. TABLE 7. Filter 18 Backwash Description Backwash Event Drain both filter cells to about 0.5 feet above media. Air scour west cell. Combined air and water wash until water level reaches 1.8 feet. High rate water only wash. ETSW at 66percent of pump speed. Air scour east cell. Combined air and water wash until water level reaches 1.8 feet. High rate water only wash. ETSW at 66percent of pump speed. Duration ~ 45 min. 5 min. 5 min. 8 min. 5 min. 5 min. ~ 8 min. 11/3/ Final PWSA CPE Report
29 Refill filters Filter to waste (both cells together) - recently implemented by water quality staff. Return to service. 60 min. During the high rate water wash, the filter media expansion was measured using a Secchi type disk to detect the top of the expanded anthracite media. The measured expansion for the west filter cell was 5 inches, and the measured expansion for the east cell was 4.5 inches. Based on a total filter media depth of 30 inches, the bed expansion was approximately 17 percent for the west cell and 15 percent for the east cell. To achieve good cleaning of the filter media during backwash, a bed expansion of 20 percent or greater is typically recommended. The design engineer for the filters commented during the study that the backwash pumping rate was currently limited to 90 percent capacity due to a pump vibration problem. Once this issue is resolved, slightly higher bed expansion should be achievable. This special study was only conducted on both cells of Filter 18 during September water temperatures. Plant operators are encouraged to complete this study on all the filters to establish baseline information, and conducting this study on a routine basis is considered an essential component of a filter maintenance program. Water temperatures in Pennsylvania change significantly throughout the year, and these changes in temperatures directly impact water density, which in turn impacts bed expansion. Other filter plants in Pennsylvania have documented that percent bed expansion increases in winter and decreases in summer. Special Study 2: Filter 18 Backwash Cleaning Efficiency The efficiency of the backwash for cleaning a filter was assessed by collecting grab samples from the wash water trough during backwash and measuring turbidity with a Hach portable 2100Q turbidimeter. 11/3/ Final PWSA CPE Report

30 Photo of Initial Grab Samples from Filter 18 Backwash Troughs The results of the grab sample analyses for Filter 18 are shown in the turbidity trend lines in Figure 9. The trend lines for both filters are similar. At the beginning of the backwash the turbidity of waste water exiting via the filter backwash trough was between 330 and 360 NTU. At 5 minutes into the backwash, the high flow rate was reduced to achieve an extended terminal sub fluidization wash (ETSW) rate where the media has minimal fluidization. During this time of the backwash, the media level was checked, and minimal media fluidization was confirmed with the bed expansion tool. At the transition from high wash to ETSW, the turbidity of the waste wash water had decreased to between 5 and 6 NTU for both cells. The backwash continued for approximately 10 minutes, which was slightly greater than the theoretical detention time to replace the volume of water within and above the media. At the end of the backwash the turbidity had been reduced to 0.7 NTU. The results of this study indicate that the filter was being adequately cleaned, and the turbidity at the end of ETSW was within a range that would support a short filter ripening period. Similar to the bed expansion study above, plant operators are encouraged to complete this study on all the filters to establish baseline information. Conducting this study on a routine basis provides useful information on the backwash efficiency and condition of each individual filter and filter cell. It can also be used to evaluate the impacts of seasonal variations in filter performance; which could ultimately provide operators with insights that may be applied to shorten the filter ripening time. 11/3/ Final PWSA CPE Report
31

32 FIGURE 10. Example Filter 18 Filter Flow Anomaly during Backwash Event Special Study 3: Post Backwash Turbidity Recovery The performance of filters following backwash is critical because a long filter ripening period can result in the passage of pathogens (indicated by high turbidity levels) into the finished water. Even relatively low levels of turbidity can result in large numbers of particles, such as Cryptosporidium, passing through filters during this period. In addition, plants that are striving to achieve the filter effluent turbidity optimization goal of 0.10 NTU often experience their highest daily turbidity level during a filter ripening period. The Aspinwall plant has filter to waste capability; however, use of this function was only implemented just prior to the time that the CPE was conducted. In addition, the use of the ETSW as part of the filter backwash procedure is also very effective for reducing filter ripening times. This practice was also implemented just prior to the CPE. The post backwash recovery performance for Filter 18 was recorded from the continuous filter turbidimeter by the CPE team. This turbidimeter currently represents the performance of only one of the two cells on filter 18. With the current sampling location, the monitoring does accurately monitor performance during filter to waste. The post-backwash recovery performance for Filter 18 is shown in Figure 11. For this backwash, the filter to waste period occurred for about 55 minutes, and during this period the turbidity was relatively stable with values ranging from 0.05 to 0.07 NTU. When the filter was returned to service, the turbidity was also stable as indicated by turbidity values in the 0.06 to 0.07 NTU range. Results from this backwash indicate that the combination of including the ETSW step at the end of filter backwash with filter to 11/3/ Final PWSA CPE Report
33
34 combined effluent (i.e. both filter cells) was disconnected early due to the visual observation that excessive sediment collected in the filter housing (see photo on page 35). The tap for this sample was positioned at the bottom of the Filter 4 effluent pipe at a location which included flow from both the west and east filter cells. Some of the sediment captured within the MPA filter and housing appeared to be rust, while some appeared to be sand and anthracite. It is possible that some of the filter media was present from the recent filter renovations, and media replacement. However, if the presence of filter media within the filter effluent line were to persist, this would be an indication of a potential underdrain integrity issue. Therefore, PWSA should visually inspect the condition of each filter following backwash to insure depressions are not present across the filter surface. The lab was not able to definitively identify the cause of the brown discoloration of the cartridge; but, this type of discoloration is not typically present when pretreatment processes are optimized. To further evaluate performance of Filter 4, and determine the impact of sample location, another MPA sample filter was connected to a different tap on the effluent line of the West half of Filter 4. The same brown color was noted, but to a lesser degree. Significantly less inorganic sediment was noted as well. Visual observation of the MPA cartridge resulted in valuable discussion with PWSA staff regarding the optimal sample tap location within the circumference of the filter effluent pipe. In summary, Department staff encouraged PWSA to reference the turbidimeter manufacturer sample tap location guidance. Everyone agreed that the bottom of the pipe should not be used for future sample tap locations. Overall, the results of both Filter 4 effluent MPA s were rated acceptable by lab staff due to the determination that particulates were inorganic in nature, and the fact that no cysts or oocysts were identified and the sample. Complete MPA sample results are attached at the end of this CPE report. 11/3/ Final PWSA CPE Report
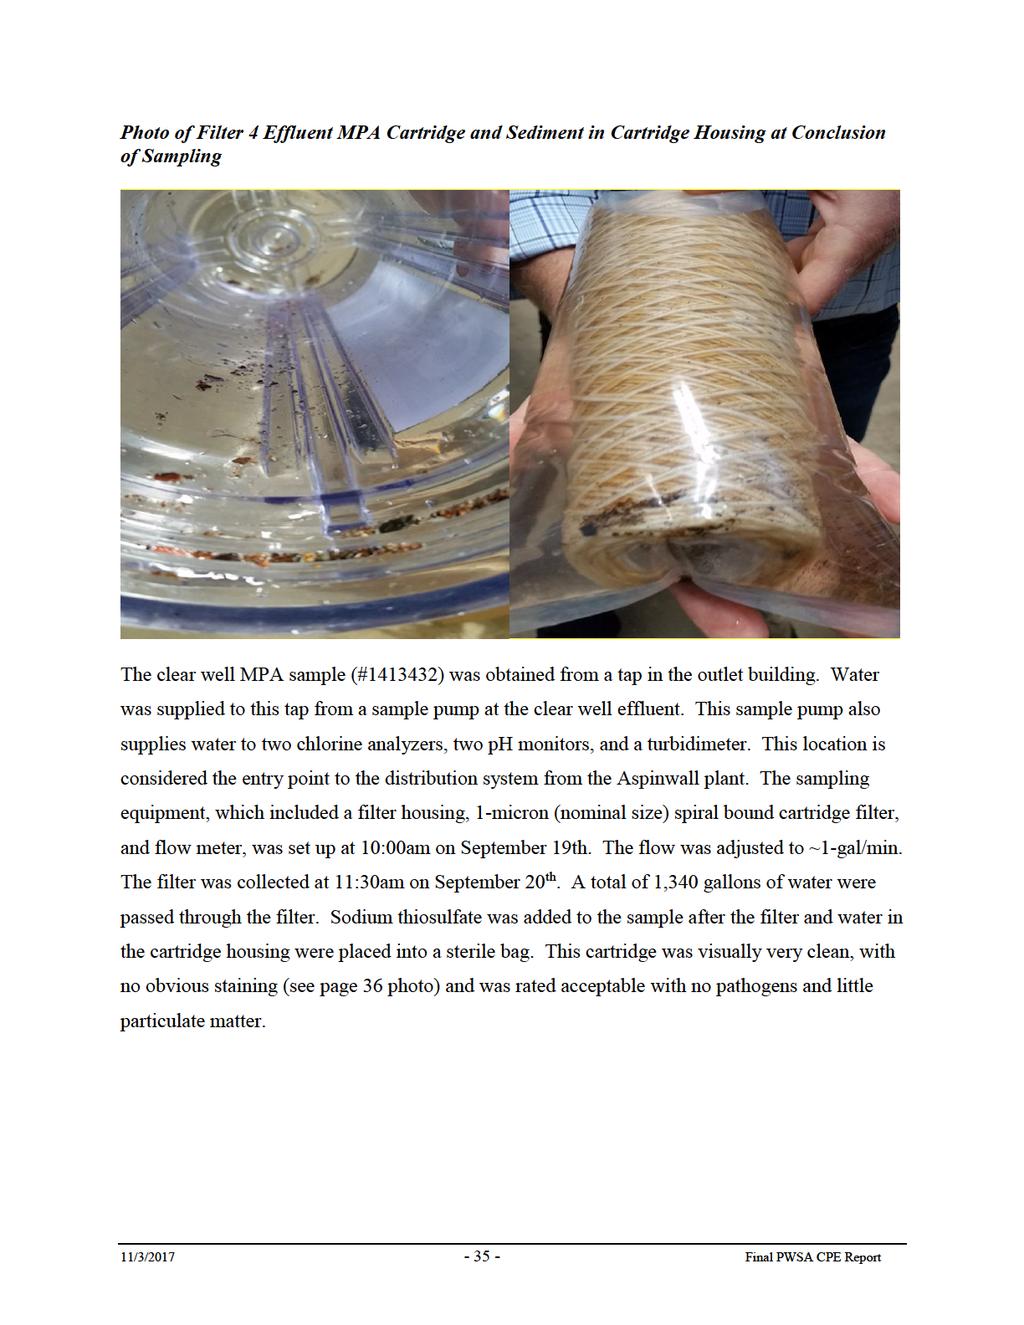
35

36 Photo of Clear Well Effluent MPA Cartridge at Conclusion of Sampling Special Study 5: Turbidity Data Integrity Assessment A series of special studies were conducted to assess the integrity of the turbidity data being collected from the individual filters and combined filter sample locations. This series of studies focused on turbidimeter flows, turbidimeter operation and settings and the impact of these factors on data quality. A summary of each study (5A through 5D) which contributed to the overall assessment of turbidity data integrity follows: 11/3/ Final PWSA CPE Report
37 Special Study 5A: Online Turbidimeter Flow Rate and Sample Detention Time Assessment To assess the flow rate through the online Hach 1720E turbidimeters located at the IFE, CFE, settled and clarified as well as the Surface Scatter-7 raw water turbidimeter, the CPE team used a graduated cylinder and a stop watch to measure the flow rates from drain lines. The Filter 9 turbidimeter (2650 ml/min), Filter 16 turbidimeter (2800 ml/min), CFE north turbidimeter (880 ml/min), CFE south turbidimeter (1500 ml/min), raw Surface Scatter 7 turbidimeter (2800 ml/min), and clarified turbidimeter (1450 ml/min) exceeded the manufacturer s recommended flow rate range of 250 to 750 ml/minute, as shown in Figure 12. To obtain the most accurate turbidity data, it is critical that the flow rate is consistently maintained as per the manufacturer s recommendations. FIGURE 12. Turbidimeter Flow Rates vs. Manufacturer Specifications. *Note that the recommended flow rate for the surface scatter 7 is between 1 L/min and 2 L/min Additionally, the CPE team calculated the sample line detention time of the online Hach 1720E turbidimeters on filters 16, Filter 9, CFE north, CFE south, settled, raw water (Surface Scatter 7) 11/3/ Final PWSA CPE Report
38 and clarified. The length of piping from the sample ports to the influent ports of the on-line turbidimeters were measured with a tape measure. Using the calculated sample pipe volume and flow rates from the sample ports to the turbidimeters, a detention time was calculated for each turbidimeter as listed Figure 13. The detention times varied between 0 (negligible) and 7.73 minutes. Detention times for Filter 9, Filter 16, and the Settled turbidimeters were one minute or less allowing rapid responses to water quality changes. Raw, clarified, CFE north and CFE south turbidimeter sample lines had greater than one minute sample line detention times. Overall filter plant staff should always attempt to mount all online turbidimeters as close as possible to their respective sampling location. FIGURE 13. Turbidimeter Sample Detention Time Check. 11/3/ Final PWSA CPE Report
39 Special Study 5B: Online Turbidimeter Settings Check The CPE team checked the settings on the online Hach 1720E turbidimeter controllers, and the findings are summarized in Table 8. An output span of 0-1 NTU for IFE and CFE turbidimeters is not sufficient to determine regulatory compliance. The state of Pennsylvania Safe Drinking Water Act Title 25 Chapter 109 requires that accurate filter water turbidity data be recorded and reported. Additionally, specific actions are required in Ch. 109 whenever IFE turbidity exceeds 1 NTU or 2 NTU and when the CFE turbidity exceeds 1 NTU. Therefore, PWSA is required, for regulatory IFE and CFE turbidity data, to establish a method to record actual turbidity spikes regardless of their magnitude. According to raw and clarified turbidity data provided by PWSA, raw turbidity appears to be capped at 100 NTU while clarified turbidity appears to be capped at 10 NTU, and settled turbidities appear to be capped at 5 NTU. Since process controls and consultant studies may be based on raw and clarified water turbidities, it is also important to accurately record the magnitude of turbidity spikes for raw, clarified, and settled water. Also, differences between the turbidimeter output span settings and SCADA data should be investigated to verify data integrity. Currently the 1720E turbidimeters are set to hold outputs when communication is lost with the controller. The error hold mode Transfer Outputs setting allows the operator to send a set value (0-20 NTU) which can be used as a tool to more clearly identify when communication has been lost which may initiate manual verification and investigation. TABLE 8. Turbidimeter Settings Turbidimeter Location Raw, clarified, settled, CFE north (even), CFE south (odd), IFE 9 and IFE 16 Turbidimeter Model Raw-Surface Scatter 7 All others 1720 E Controller Model and Data Logging Setting (1) Signal Averaging (2) Bubble Reject (3) SC-100 (clarified, CFE south, IFE 16). All others SC 200 Time & date setting correct; 15 minutes All at 30 seconds On 11/3/ Final PWSA CPE Report
40 Turbidimeter Location Output Span (4) Error Hold Mode (5) Raw, clarified, settled, CFE north (even), CFE south (odd), IFE 9 and IFE 16 Raw-0-10,000 NTU Clarified-0 to 100 NTU Settled- 0 to 5 NTU CFE and IFE- 0-1 NTU All set to hold outputs (1) Check to see if current date and time are correct. Check frequency of data logging. Default is 15 minutes for Hach models. (2) Default for Hach models is 30 seconds. This is acceptable in most cases. (3) Default is On for Hach models. This is acceptable in most cases. (4) The output span should be set to record accurate data to SCADA. Accessing output span for Hach SC200 controller: Menu/SC200 setup/output setup (select 1 or 2; select Source to see which turbidimeter is highlighted and then Back button)/activation (low value; high value). (5) Specific to Hach 1720E and FilterTrak 660 models. Default is to hold outputs and send last known value to SCADA when turbidimeter loses communication with controller. Better option is Transfer Outputs (TO) to send an operator-selected value to SCADA (e.g., 0, 20) to make operator aware of problem. Special Study 5C: Online Turbidimeter Data Spike Investigations As part of data integrity review, the CPE team reviewed IFE turbidity spikes using data from September 2016 to September 2017 to document data integrity procedures used by plant staff. Since the water system was using two different CFE meters to monitor composite IFEs from the north (even) and south (odd) filter galleries, the team also investigated a turbidity spike which was recorded on one CFE turbidimeter but not the other. Figure 14 shows the investigation of an IFE turbidity spike and Figure 15 shows the comparison between the CFE meters. Figure 14 shows an abrupt increase in the Filter 12 s IFE turbidity recorded by the SCADA system on January 24, If turbidity is high, operators report the value they see on the turbidimeter's controller (instead of the SCADA screen) and report it every 4 hours on the monthly operational report (MOR). The first two MOR turbidity values recorded on January 24 th indicated a lower turbidity value measured at the meter than what the SCADA system was recording. The next two MOR values from January 25 th show the same turbidity value as the SCADA recorded. There was a lack of available information to document this elevated turbidity 11/3/ Final PWSA CPE Report
41 event so it remains unclear whether the turbidity values recorded during this period were a result of a filter performance problem, data integrity issue, or combination of both. In either case, additional follow-up to this event is warranted and to document any actions taken to address the turbidity event. FIGURE 14. Filter 12 IFE Turbidity Profile January th 2017 The CFE team graphed maximum daily CFE turbidity obtained from the north (even) and south (odd) composite turbidimeters for the month of August 2017 and identified turbidity spikes. Figure 15 shows north and south CFE turbidity every minute for August 31 st when the turbidity spiked. SCADA data recorded for the north CFE was higher than the south CFE on August 31 st for approximately one hour, however MOR data did not confirm a difference between north and 11/3/ Final PWSA CPE Report
42 south CFE turbidity data. The MOR data indicated a difference between the turbidimeter controller reading and data recorded by SCADA. When assessing plant performance relative to meeting the turbidity optimization goals, the highest turbidity values that occur each day should be recorded. These examples are provided to demonstrate how performance can be significantly different based on how data is collected, graphed, and interpreted. FIGURE 15. North and South CFE Turbidity Comparison August 31, 2017 Special Study 5D: Online Turbidimeter Verification A comparison study of the turbidity readings from a Hach 2100Q portable turbidimeter (provided by the CPE team), the plant Hach TU 5200 benchtop turbidimeter, Surface Scatter 7 on the raw, and the Hach 1720E continuous turbidimeters on the clarified, settled, combined (north and south), and Filter 9 and 16 effluents was conducted by taking grab samples from the 11/3/ Final PWSA CPE Report
43 drain lines of the continuous turbidimeters or other locations as available. Collecting samples from the turbidimeter drain line is usually not recommended due to the potential for picking up particles from the line but there was not a better sampling location for some of the meters. An optimum grab sampling setup would include a sample tap (i.e., T or Y configuration) off the feed line to the turbidimeter. Results of the comparative study for the raw, clarified, and settled waters are summarized in Figure 16. Results of the comparative study for the north and south CFEs, and Filter 9 and 16 turbidimeters are summarized in Figure 17. Readings from the portable and benchtop turbidimeters are expected to be slightly higher than the continuous instruments due to sample handling, use of a sample cell, and stray light potential related to the portable and bench meters, but readings should be within 10 percent of the raw, clarified and settled meters and +/ NTU of the online IFE and CFE meters. Figure 16 indicates, the raw water grab sample readings analyzed by the portable turbidimeters were within acceptable ranges for those two portable turbidimeters, but outside the range when compared to the on-line meter. The clarified water grab sample readings for all the meters were within acceptable ranges. The settled water grab sample readings analyzed by the portable, benchtop and on-line meters were outside the acceptable range but the grab sample location was in the lab while the on-line meter sample tap location is at the settled water line upstream of the filters which may indicate different water quality between the two locations. Figure 17 indicates, the CFE and IFE grab sample readings analyzed by the benchtop and portable turbidimeters from the north and south CFEs and filters 9 and 16 IFEs. All the values from the grab samples were higher than the on-line instrument values. Values from the benchtop and portable meters were outside the acceptable range for the South CFE and both IFE samples. The IFE grab samples were not collected from the same tap as the on-line instruments which may contribute to the disparity when comparing the values. The north CFE grab sample was taken from a hose two feet from the turbidimeter; the IFE grab samples were taken at a tap associated with the flow meter. Currently, the taps for the on-line IFE turbidimeters only provide water from the west cell of the filters which may not be representative of the turbidity from both the east and west filter cells combined. The grab sample tap location included both cells but was from a tap associated with the filter flow meter. 11/3/ Final PWSA CPE Report
 which would trigger additional investigation if the values vary.")
44 PWSA currently conducts turbidity comparisons of their on-line turbidimeters with grab samples obtained daily from the raw, settled, and both CFE locations and measured on the benchtop meter. Both the on-line and benchtop turbidity values are recorded on a lab sheet. However, there are no established percent difference (i.e. >15 percent) which would trigger additional investigation if the values vary. PWSA staff are encouraged to assess their current IFE and CFE grab sample locations and consider the benefits of establishing a more representative grab sample location; more specifically, installation of a Y or T splitter just upstream of the turbidimeter influent location would enable a grab sample representative of water entering the turbidimeter. Conducting weekly verification of IFE and CFE turbidimeters helps to ensure that sound data is being used to assess performance. But, it is necessary to first establish representative sample taps and a repeatable comparison sampling SOP which includes specific trigger points and follow up actions. Figure 16. Raw, Settled, & Clarified Turbidity Comparison 11/3/ Final PWSA CPE Report
45
46

47
48 operators do not account for the change in specific gravity and percent weight in their calculations when they receive a new batch of chemical. This created a discrepancy of 1.7 mg/l in the calculated dose on September 20th; the operator calculated dose was 32.3 mg/l, and the CPE team calculated dose was 34 mg/l Special Study 8: Coordinated Water Quality Grab Sampling Several members of the CPE team worked together on a coordinated grab sample event. Samples were collected between 11:20am and 12:00pm on September 20, 2017 in an attempt to capture a snapshot in time of water quality at specific locations throughout the filter plant. Following the flow of water through the filter plant, representative samples were collected from raw water, recycle tank, rapid mix chamber, combined clarifier effluent, west sedimentation basin, east sedimentation basin, north CFE, south CFE, and clear well effluent. Each sample location was analyzed by the PA DEP Bureau of Laboratories (BOL) for multiple parameters. Results are summarized in Table 11 and associated Figure 18. This data indicates that on September 20, 2017, all parameters evaluated met applicable Safe Drinking Water standards at the clear well outlet to the distribution system. Raw Recycled Rapid Mix Combined Clarified West Sed Basin East Sed North CFE South CFE Clear Well Outlet MCL/MRDL Alkalinity UC mg/l Aluminum ug/l Calcium UC mg/l Hardness UC mg/l Iron mg/l Bromide UC ug/l Magnesium Total UC mg/l Manganese Total ug/l ph Electronic Sodium UC mg/l Temperature UC TDS mg/l Sulfate mg/l Table 11. Coordinated Water Quality Grab Sample Results In Table 11, UC indicates Unregulated Contaminant; concentrations / values that were reported with a "<" qualifier were assigned a "0" concertation. Fluoride and color were analyzed but reported with "non-detections" and not included in this table. Please note that 39.6 mg/l 11/3/ Final PWSA CPE Report
49 sodium was measured at the clear well outlet. In 2003 EPA published a document titled Drinking Water Advisory: Consumer Acceptability Advice and Health Effects Analysis on Sodium (EPA 822-R ). The document provides guidance on concentrations at which problems with taste would likely occur (30-60 mg/l). It also re-affirms a guidance level for sodium in drinking water of 20 mg/l for those individuals restricted to a total sodium intake of 500 mg/day. Sodium is considered an unregulated contaminant; PWSA should consider further evaluation of the sodium levels entering the distribution system and determine if a reduction in sodium levels may be achieved as treatment processes are optimized. Figure 18. Water Quality Grab Sample Graph This type of special study can provide valuable data relative to the stability or instability of water chemistry as it passes through each treatment process along with the associated removal percentages. Figure 18 provides an overall summary; however, the true value of the special study lies in more closely evaluating (adjusting graphical scale) each individual water quality 11/3/ Final PWSA CPE Report

50 parameter at each unit process. For example, Figure 19 indicates a total manganese baseline raw water concentration of 57 ug/l, followed by a peak of 523 ug/l within the recycle tank, 367 ug/l at the point of rapid mix, and significant reduction to 16ug/L at the combined clarifier effluent. Figure 19 shows increases in total manganese through the sedimentation basin, with a sedimentation basin effluent of approximately 40 ug/l. PWSA should also note that hardness, calcium, bromide, total dissolved solids, sodium, sulfate, and magnesium also increased, to some extent, in the settling basins. Additional monitoring should occur to further evaluate these trends. Documentation of significant increases may indicate recontamination as a result of surface run-off and/or solids leaching/resuspension. PWSA staff report that solids have not been removed from the sedimentation basin for approximately 25 years. Zero total manganese was detected in the north CFE, south CFE, and clear well outlet. In this example, the information can be useful for assessing the effectiveness of potassium permanganate and chlorine oxidation of manganese through the treatment processes as well as the impact of manganese recycle through wash water return. Figure 19. Total Manganese Trend 11/3/ Final PWSA CPE Report
51 MAJOR UNIT PROCESS EVALUATION Major unit processes were assessed with respect to their capability to meet the optimized settled and filtered water goals as well as the disinfection goals based on CT (residual concentration multiplied by contact time prior to the first customer). The capability of each individual unit process was also assessed to verify its ability to provide consistent optimized performance. This level of plant performance is considered necessary to help ensure removal or inactivation of pathogens. Calculation of plant disinfection capability was based on chlorine CT values outlined in the USEPA Guidance Manual 4 for meeting both filtration and disinfection requirements. Since the treatment processes of the plant must provide multiple effective barriers at all times, a peak instantaneous operating flow was determined. The peak instantaneous operating flow represents conditions when the treatment processes are the most vulnerable to the passage of parasitic cysts and microorganisms. If the treatment processes are adequate at the peak instantaneous flow, then the major unit processes should be capable of providing the necessary effective barriers at lower flow rates. The maximum operating flow rate of 62,500 gpm (90 MGD) was selected by the CPE team as the peak instantaneous operating flow rate. The peak instantaneous flow corresponds to the maximum number of pumps that would operate at any given time. The plant achieves various flow rates by operating various combinations of pumps at various stations. During winter months, flow rates have approached 62,500 gpm when multiple line breaks occurred in the distribution system. Unit process capability was assessed using a performance potential graph, where the projected treatment capability of each major unit process was compared against the peak instantaneous operating flow rate. The Major Unit Process Evaluation graph developed for the PWSA Aspinwall WTP is shown in Figure Guidance Manual for Compliance with the Filtration and Disinfection Requirements for Public Water Systems Using Surface Water Sources, USEPA, Office of Drinking Water, Washington, D.C. (1989), revised /3/ Final PWSA CPE Report


52 Figure 20. Major Unit Process Evaluation Graph 11/3/ Final PWSA CPE Report
53 The unit processes evaluated during the CPE are shown along the vertical axis. The horizontal bars on the graph represent the projected peak capability of each unit process that would support achievement of optimized process performance. These capabilities were projected based on several factors including the combination of treatment processes at the plant, the CPE team s experience with other similar processes, raw water quality, industry guidelines, the PWSA Aspinwall WTP design, and regulatory standards. Each unit process can fall into one of three categories: Type 1: Where the bar for the unit process exceeds the peak instantaneous flow (> 100 percent of peak flow), the plant should be expected to achieve the performance goals. Type 2: Type 3: If the bar for the unit process falls short but close to the peak instantaneous flow (80 to 100 percent of peak flow), then operational adjustments may still allow the plant to achieve the performance goals. If the bar for a particular unit process falls far short of the peak instantaneous flow (< 80 percent of peak flow), then it may not be possible to achieve the performance goals with the existing unit process. The shortest bar represents the most limiting unit process relative to achieving optimized plant performance. The major unit processes evaluated included flocculation, clarification, sedimentation, filtration, and disinfection. Flocculation and clarification is achieved with four flocculation and clarification basins, operated in parallel. Each basin includes two, 2-stage flocculators and a conventional sedimentation basin. The flocculators are operated at constant speed. Basin #3 had been out of service for several months, so two flocculators and one clarifier were not considered in the major unit process evaluation. A third flocculator was also not operating at the time of the CPE, but it was assumed to be functional in the major unit process evaluation because it would typically be running under normal conditions. Based upon the flocculation unit design (i.e., a minimum water temperature 5 C and multiple stage mixing), a hydraulic detention time (HDT) of 20 minutes was selected to rate 11/3/ Final PWSA CPE Report.docx
54 the process. The combined flocculation basin volume was approximately 1,157,635 gallons (not including two of the eight flocculation units since Basin #3 was out of service). The resulting rating of the flocculation process was 83.3 MGD (Vol/HDT x 1440/10 6 ). This was less than the peak instantaneous flow rate of 90 MGD and identifies the flocculation process as a Type 2 process. The total surface area of three of the four conventional clarifiers was 29,160 ft 2 with an average water depth greater than 14 feet. The CPE team assigned a surface overflow rating of 0.7 gpm/ft 2. Based on this information, the total rated capability for the clarification unit process was 29.4 MGD. This was considerably less than the peak instantaneous flow rate and results in categorizing clarification as a Type 3 process. Settled water from the clarifiers was gravity fed into a central receiving basin and distributed into the east and west sedimentation basins, operating in parallel. The total surface area for both basins was 1,000,000 ft 2. Water flowed approximately 1,400 feet across each basin into an effluent conduit surrounded by mud walls, located on the bottom of the basin at the other end. The CPE assigned a surface overflow rate of 0.5 gpm/ft 2 to each basin because the effluent orifice was located at the bottom of the basin. Based on this information, the total rated capability for the sedimentation process was 720 MGD. This was considerably greater than the peak instantaneous flow rate, which identifies sedimentation as a Type 1 process. Filtration was performed using eighteen dual-media, rapid rate filters each containing two cells. The dimensions of each cell were 57 by 18 feet, or 1,140 ft 2 each. With one filter out of service, the surface area of seventeen filters was 38,760 ft 2. The PA DEP permitted a hydraulic loading rate of 2 gpm/ft 2 for the Aspinwall filters, which was used in the evaluation. Based on this information, total rated capacity of the filtration process was MGD. The filtration process rating was above the reported peak instantaneous flow and the filters are therefore rated a Type 1 process. The disinfection process was assessed based on the PA DEP requirements for inactivation of 1- log (90 percent) of Giardia cysts and 4 log (99.99 percent) of viruses (in addition to adequate turbidity removal via pretreatment and filtration). For disinfection with chlorine, the Giardia inactivation requirement is more stringent than the virus disinfection requirement. As 11/3/ Final PWSA CPE Report.docx
55 such, Giardia inactivation was used as the basis for the chlorine disinfection evaluation. The point of chlorine addition at the PWSA Aspinwall plant was in the combined filter effluent line at the filter pipe gallery, so the only contact time for the chlorine is in the clear well. The residual disinfectant concentration (C), in mg/l, multiplied by the effective time the water is in contact with the disinfectant (T), in minutes, comprises CT. For disinfection in the clear well, a required CT value of 85.5 mg/l-min was obtained from the USEPA Guidance Manual 3 using a chlorine residual of 0.6 mg/l, a maximum ph of 8.5, and a worst-case temperature of 5 C. These criteria were selected based on a review of historical data at the clear well effluent. Although chlorine residuals of less than 0.6 mg/l were observed on many of the days reviewed by the CPE team, PWSA staff were using a higher baffling factor prior to April Using the PA DEP established baffling factor of 0.3 means that chlorine residual level will need to be maintained at a higher level than in the past to maintain the required inactivation ratio. The total volume of the clear well was calculated at 31,265,000 gallons assuming a minimum water level of 13.5 feet. The volume calculation accounted for the reduction in volume due to structural columns within the clear well. Based on this information, the total rated capacity of the disinfection process was 91.5 MGD, which was slightly greater than the peak instantaneous flow rate. As a result, disinfection is considered a Type 1 process The major unit process evaluation shows that the Aspinwall plant s major unit processes should not limit the ability of plant operators to achieve turbidity and disinfection optimization goals under current flow conditions. The flocculation process is rated Type 2; however, routine preventative maintenance combined with good operational practices and application of optimization skills could help to offset this rating. The clarification process is rated Type 3, but this process is followed by the sedimentation process which is rated Type 1. The combined use of both settling processes, routine preventative maintenance of these units, and application of good operational skills will be critical to consistently achieving settled water optimization goals and protecting the newly renovated filters. 11/3/ Final PWSA CPE Report.docx
56 PERFORMANCE-LIMITING FACTORS The areas of design, operation, maintenance, and administration were evaluated to identify factors that limit performance. These evaluations, and the resultant list of what appeared to be performance limiting factors, were based on information obtained from the plant tour, interviews, performance and design assessments, special studies, and the best professional judgment of the CPE team. Each of the factors was assessed for a possible classification as A, B, or C according to the following guidelines: A B C Major effect on a long term repetitive basis Moderate effect on a routine basis, or major effect on a periodic basis Minor effect After lengthy discussion by the CPE team, the performance-limiting factors identified were prioritized as to their relative impact on performance, and they are summarized in Table 12 below. While developing the list of factors limiting performance, over 50 potential factors were reviewed, and their impact on the performance of the Aspinwall WTP was assessed to the best of the team s ability using available information. Each of the factors along with specific examples of why the factor was identified are described in this section. 11/3/ Final PWSA CPE Report.docx
57 TABLE 12. Summary of Performance Limiting Factors Rank Rating Performance Limiting Factor Category 1 A Policies Administrative 2 A Supervision Administrative 3 A Representative Sampling Operations 4 A Application of Concepts and Testing to Process Control Operations 5 A Maintenance Preventative/Corrective Maintenance 6 A Planning Administrative 7 A Complacency Administrative 8 A Reliability Administrative 9 B Disinfection Design 10 B Compensation Administrative 11 B Reserves Administrative 12 B Chemical Storage and Feed Facilities Design 13 B Clarification/Sedimentation Design 14 B Process Controllability and Instrumentation/Automation Design 15 C Operational Guidelines Operations 16 C Work Environment Administrative 17 C Intake Structure Design 11/3/ Final PWSA CPE Report.docx
58 Policies Administration (A) Existing policies or the lack of policies appear to hinder staff members from making all necessary operational, maintenance, and management decisions to support optimized plant performance. Examples of this performance limiting factor include: It does not appear that a clear policy to meet a full range of water quality optimization goals has been established and communicated to staff at all levels. Vacancies in key management positions are affecting workloads, impacting stability and communication within the organization. This leads to uncertainty which hinders the ability of plant personnel to set priorities necessary to achieve and maintain optimal water quality. Reference the organizational chart in Attachment 1. The existing policy requiring residency within the Pittsburgh city limits for all PWSA employees limits the pool of available candidates, and sometimes results in highly qualified candidates declining job offers. Ultimately, some positions remain vacant because of the residency requirement. The policy that only lab staff can establish process control setpoints (e.g. ferric chloride dosage) has diminished the role that properly certified operators can and should play in maintaining optimal water quality. Lab staff are currently relied upon for process control oversight, but a previous policy has reduced lab staffing from ten to four. Operator certification does not appear to be adequately incentivized for existing staff, or required for new hires. 11/3/ Final PWSA CPE Report.docx
59 Supervision Administration (A) This factor refers to management styles, organizational capabilities, or communication practices at any management level which appear to adversely impact the plant performance. Examples of this performance limiting factor include: The Director of Water Production position is vacant. An optimization champion (i.e. someone who understands safe drinking water requirements and can establish optimized performance goals) is needed for this position. This vacancy has also resulted in a lack of clearly defined roles and responsibilities which impacts completion of specific tasks required to support optimal performance. Reference the organizational chart in Attachment 1 Simultaneous compliance does not appear to be a priority; the primary focus is THM precursor removal and DBP control, with limited focus directed towards turbidity optimization of each unit process Operators are not involved with water quality process control decisions, which limits their review and ownership of turbidity and disinfectant residual compliance data. Improperly certified operators routinely make process control decisions relative to water quantity. Compartmentalization of duties within the organization has impacted the overall ability to make efficient and timely decisions. Roles and responsibilities are not clearly defined, leading to uncertainty regarding who has primary responsibility for completion of certain tasks. There is a reliance on consultant recommendations with limited input or involvement from plant staff to develop process control related special studies in the plant. Communication practices are not ensuring plant staff awareness or actively soliciting their input for prioritizing and developing consultant s studies or specific projects. An in-house training program has not been established but is desired by operational staff. 11/3/ Final PWSA CPE Report.docx
60 Representative Sampling Operations (A) Accurately assessing plant performance requires sampling and instrument settings that can capture process performance. Some examples of representative sampling issues that were identified during the CPE include: A method to assess turbidity spikes and understand when individual filters are online (vs. offline) has not been established, which compromises associated turbidity data integrity. Verification of massive amounts of critical water quality/compliance data by only one individual reduces responsibility of shift operators to routinely vet turbidity/chlorine data in a timely manner. Current IFE online turbidimeter sample tap location does not monitor both sides of each individual filter, compromising critical regulatory and process control data. IFE flow records for some filters indicate up to approximately 1872 gpm of flow during periods when those filters should be offline for backwash. This appears to indicate an unresolved problem with the flow meter calibration and/or electrical noise and/or valves not fully closing. Grab sample taps for individual filters are not representative of water quality from each filter cell and filter to waste turbidity. IFE and CFE turbidimeters were capped at 1 NTU limiting the ability to assess magnitude of turbidity spikes for process control and regulatory compliance. Filter to waste step was not consistently utilized prior to the CPE. Flow rates for turbidimeters evaluated by the CPE team were not within the manufacturer recommended range (i.e. significantly higher). Constant head levels for the CL-17 chlorine analyzer evaluated by the CPE team were not within the manufacturer-recommended range. 11/3/ Final PWSA CPE Report.docx
61 Clarifier and sedimentation basin turbidity data provided was capped at a maximum 10 NTU and 5 NTU respectively. Individual clarifiers and individual sedimentation basin effluent turbidities are not monitored. The continuous online raw water turbidimeter is not representative of Allegheny river turbidity because it draws a sample after the point of potassium permanganate injection. Application of Concepts and Testing to Process Control Operations (A) Process control by plant staff is a key activity required to consistently achieve compliance requirements and optimization goals. Examples of useful process control activities that are not being completed and operational practices that do not support good process control include: Ferric chloride dosage rates are rarely adjusted due to the perception that the Allegheny river is a stable source, and the perception that the practice of enhanced coagulation does not require close control of the coagulant dose. Process control tools, such as jar testing, streaming current monitor or zeta potential, are not utilized to optimize coagulant and polymer doses; historical ferric chloride dosage data are not routinely utilized to guide current dosing strategies. Giardia inactivation ratios reported by PWSA for the Aspinwall WTP were consistently higher than those calculated by the CPE team. PWSA s method of determining minimum chlorine residual and minimum clear well volume data for use in the CT calculation did not appear to be accurate. Operators do not have access to an accurate method to verify actual verses theoretical ferric chloride dosages. During a special study, CPE team members calculated a dose of 18.1 mg/l using the coagulant feed pump calibration cylinder; in comparison, operators calculated a ferric dosage of 32 mg/l using SCADA data. Operators believe 11/3/ Final PWSA CPE Report.docx
62 this calibration cylinder is inaccurate due to the plumbing configuration; but, this theory needs to be evaluated further. Operators do not have access to accurate plant flow rate data to calculate ferric chloride dosages via SCADA. Neither clarifier sludge depth nor sludge density are tested; this type of testing could potentially enhance performance and reduce clarifier breakdowns / maintenance. The impact of elevated ferric chloride dose on sludge production and clarifier maintenance has not yet been assessed. Clarification followed by sedimentation has resulted in a false sense of security; clarified and settled water spikes are not investigated to optimize multiple barrier performance. Routine secondary verifications of the individual filter turbidimeters are not conducted (although turbidimeters are calibrated quarterly via a primary standard). Turbidimeter comparisons are conducted, but the data are not utilized to assess accuracy of the on-line meters. An SOP has not been established to test new filter media (AWWA B-100 analysis) to establish baseline condition and/or monitor change in condition with age. Long-term analysis of water quality data trends is not occurring in-house or routinely, resulting in limited data-based decision making Plant staff are not involved in the design of, or conducting, special studies (e.g., optimizing permanganate feed locations, individual clarifier basin performance study, filter backwash evaluation, in-plant DBP formation) Staff appear to accept preliminary process control modification recommendations from consultants without thorough consideration of unintended process control impacts (e.g. considering stopping raw water potassium permanganate feed and 11/3/ Final PWSA CPE Report.docx
63 relying on Mn removal via filtration process). Some recommendations may be based on plant data that is not representative, due to previously listed data quality concerns. The impacts of filter backwash recycle on pretreatment processes or finished water quality have not been studied. See recycle tank manganese residual (Figure 19) Staff were uncertain if east and west raw water intake structures allowed flexibility to draw water from different depths within the river to target the best available source water quality. Therefore, this is not a process control consideration. Maintenance (Preventative/Corrective) Maintenance (A) Overall, the frequency and pace of emergencies has resulted in operations and maintenance staff that are constantly in triage mode, with little to no time to conduct proactive preventative maintenance. Examples of specific maintenance concerns are listed below: Clear well maintenance and cleaning has not been performed and could lead to water quality issues or failure. Lack of routine removal of sludge from flocculators and clarifiers appears to be contributing to routine breakdowns. Apparent lack of maintenance resources results in one of four clarifiers remaining offline for extended periods of time. Accumulation of sludge in the sedimentation basins reduces basin volume, likely contributing to intermittent settled turbidity spikes, increase in some secondary contaminants as listed in Table 11, and the presence of debris within the filters which may ultimately result in filter short-circuiting. Line clogging (e.g., hypochlorite, soda ash) requires frequent maintenance and/or the utility to bring chemicals close to the injection point. 11/3/ Final PWSA CPE Report.docx
64 The plant flow meters are not calibrated and data are not accurately transmitted to the SCADA system, making it difficult to accurately calculate and control chemical feed rates or perform water accounting. Sedimentation basin effluent weir, location, condition and maintenance history appear to be unknown to utility staff. The raw water intake valves do not appear to be adjustable (i.e., stuck in their current percent open position), limiting flexibility to adjust water contributions from both East and West intakes. Lack of a comprehensive work order system limits the ability to accurately track all equipment in need of repair. Planning Administration (A) The lack of long-range planning by a utility can have negative impacts on the future operations and performance of a WTP. Current performance problems at the Aspinwall WTP have been caused in part by a lack of planning in the past. The following examples were identified during the CPE: A lack of prior long-range planning to build and maintain a sustainable water system infrastructure has impacted plant performance. Current management has developed a long-range plan to begin addressing this factor, but it has not yet been fully implemented. A lack of prior planning to generate income sufficient to sustain a WTP capable of achieving optimal performance goals has impacted performance of the Aspinwall plant. Current management has developed a plan to address this issue but it has not yet been fully implemented. 11/3/ Final PWSA CPE Report.docx
65 Complacency Administration (A) The design of the Aspinwall WTP provides ample capacity to meet the existing demand flow which contributes to a sense of complacency within the water utility. Some examples that were identified during the CPE include: Staff do not adjust coagulant dosage and clarifiers are not optimized for particle removal, due to a reliance on the sedimentation basins and a perceived stable source. The perception that the sedimentation ponds will be able to effectively remove pathogens from all types of incoming water quality challenges has also allowed for the process control emphasis to be placed almost exclusively on DBP and TOC control. PWSA has not adequately reinvested in its aging infrastructure, which has resulted in breakdowns that impact water quality and redirect operator time and attention. Some infrastructure breakdowns have gone unaddressed for extended periods of time. Maintenance staff cannot keep up with all needed repairs, and limitations force them to deal with the emergency of the week, while other important repairs are on hold for extended periods of time. Reliability Administration (A) Inadequate facilities, equipment and the depth of staff capability present potential weak links within the water utility to achieve and sustain optimized performance. Some examples of this factor that were identified during the CPE include: The existing clear-well lacks redundant components and cannot be taken out of service for maintenance. The ability to apply adequate disinfection is at risk if there is failure of the current clear-well configuration. Redacted-Security Issue 11/3/ Final PWSA CPE Report.docx
66 Some unit processes are not operating, with no identifiable schedule to be placed back in service. In addition, some equipment and instrumentation is not providing reliable information needed for optimal particulate removal: Three flocculators are out of service. One clarification basin is not operational. Raw water flow readings are inaccurate. IFE turbidity data is not reliably reflecting individual filter performance. The overall depth of staff capability is not sufficient to consistently and reliably meet optimization goals. For example, maintenance staffing levels are insufficient to ensure that current unit processes are operational. The laboratory is also understaffed and there is a lack of certified operators to support optimal performance of a WTP of this size. Compartmentalization of staff duties also limits the depth of staff capability and the engineering department, along with other staff departments are dependent on outside consultants. Disinfection Barrier Design (B) Due to the age of the clear well, structural issues with the potential to compromise the disinfection barrier are developing; significant rehabilitation or replacement of the clear well will be necessary to maintain the integrity of the disinfection process. The lack of redundancy for the clear well does not currently allow it to be taken out of service for maintenance, repair, or replacement. The clear well inlet and outlet wet wells share a common wall and are covered by improperly sealed hatches that could potentially allow the introduction of contaminants such as dust, debris, insects, etc. Due to hydraulic limitations, the clear well water level cannot be lowered below 7.5 feet. 11/3/ Final PWSA CPE Report.docx
67 Compensation Administration (B) The current compensation structure appears to hinder PWSA s ability to retain or develop staff with the necessary qualifications and abilities to pursue optimized WTP performance. Some examples of this factor that were identified during the CPE include: It has been difficult to compete with surrounding utilities for the best available staff, therefore hindering the ability of PWSA to hire highly qualified individuals with skill sets necessary to optimize performance. This has also impeded the ability to manage the water system without relying on outside consultants. Historically, minimal incentives for operators to pursue certification appears to have contributed to the current lack of depth in staff capability. For example, a lack of compensation to attend training did not promote the importance of training and certification. Not until recently have staff been allowed overtime to attend training and this has not yet been fully realized by staff. Reserves Administration (B) It appears that PWSA financial reserves have not been maintained to adequately cover unexpected expenses or fund needed facility replacement costs. Some potential examples of this factor that were identified during the CPE include: Revenues have been impacted by water accountability inaccuracies that have affected collections (e.g. plant and customer meters and billing software). High (>50percent) unaccounted for water also significantly reduces revenue. Reserves for capital replacement have not been adequately developed and do not currently cover needs, resulting in emergency breakdowns that have affected performance. Policies to use PWSA revenue for other city priorities, not necessarily benefiting the water system, appear to have contributed to a lack of reserves, including: 11/3/ Final PWSA CPE Report.docx
68 Providing free water for certain city needs. Contributing funding for city projects outside PWSA. The terms of the ALCOSAN contract requires PWSA to perform revenue collection and payment to ALCOSAN for sewer accounts. PWSA must compensate ALCOSAN regardless of whether the customer pays water or sewer charges to PWSA. The terms of the PWSA lease agreement requires payment of $130M (water) and $100M (sewer) to the city of Pittsburgh. A long-standing policy to subsidize Pittsburgh customers receiving water from Pennsylvania American Water Company (PAWC) reportedly costs PWSA $5M annually, which is paid to PAWC. This amount makes up the difference between what PAWC charges its customers as compared to the PWSA water rates. The debt at the time of the CPE, in the amount of $750M, results in $0.40 of each revenue $1.00 directed toward paying debt. This reduces the revenues available for reserves. Chemical Storage and Feed Facilities Design (B) Chemical storage space for ferric chloride is limited, resulting in the need for frequent (daily or twice weekly) deliveries. The plant has had to reduce the coagulant dose at certain times to get by until the next delivery. Due to lack of storage, railcars sit full of chemicals with no secondary containment. The current condition of sodium hypochlorite piping facilities requires the utility to truck chemical to the filter effluent injection point. 11/3/ Final PWSA CPE Report.docx
69 Clarification/Sedimentation Design (B) The clarifier capacity is inadequate, resulting in high surface loading rate and floc carryover. Redacted-Security Issue Process Controllability and Instrumentation/Automation Design (B) Chemical feed rates must be changed manually and do not automatically adjust to account for changes in plant flow rate, e.g., the chemical feed pumps are not flowpaced. Raw water pumping flow requires a manual change. This lack of automation/controllability requires a dedicated operator to staff the chemical feed building and a dedicated engineer to staff the Ross Pump Station around the clock. Redacted-Security Issue Operational Guidelines/ Procedures Operations (C) Standard operating procedures (SOPs), or operational guidelines, are developed for certain plant activities; however, they are not posted at critical locations (where they would be utilized/quickly referenced) within the plant. Additionally, SOPs have not been established to adjust pretreatment to accommodate for seasonal temperature changes (e.g. floc speeds and associated mixing energy relative to water density). 11/3/ Final PWSA CPE Report.docx
70 Work Environment Administration (C) Overall work environment has impacted plant performance by impeding routine activities needed to support process control decisions. Some examples of this factor that were identified during the CPE include: Electrical, and other safety issues at the plant, have resulted in a dangerous work environment and necessitated extra resources for emergency repairs and to address this overall issue. The filter decks do not have hand rails which could present a safety hazard when operators try to observe a backwash or conduct special studies such as bed expansion measurements. Intake Structure Design (C) Redacted-Security Issue The east and west intakes are located very close to one another, which provides limited resiliency. There does not appear to be functional capability to feed potassium permanganate at the west intake, potentially limiting contact time for oxidation. 11/3/ Final PWSA CPE Report.docx
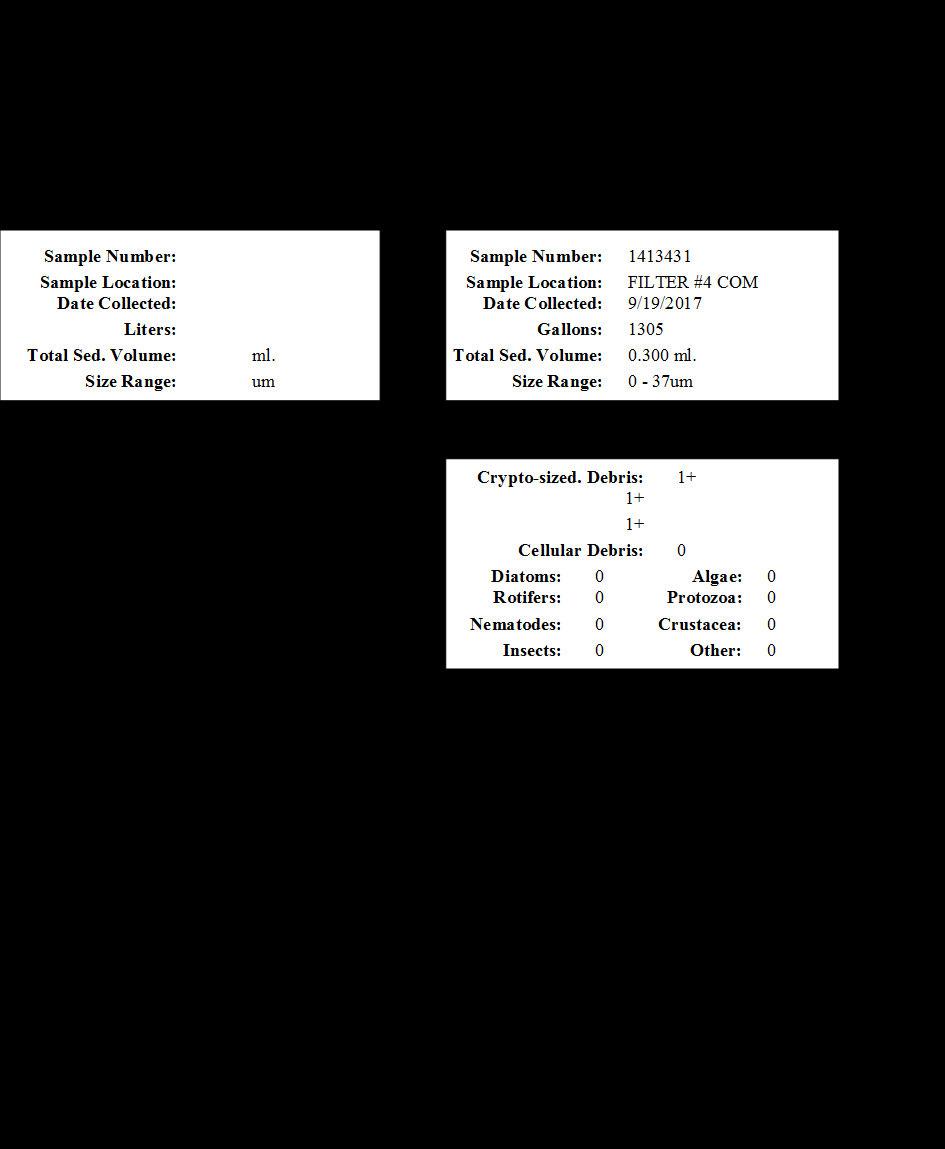

71 11/3/ Final PWSA CPE Report.docx
72 11/3/ Final PWSA CPE Report.docx
73

74 11/3/ Final PWSA CPE Report.docx

75 11/3/ Final PWSA CPE Report.docx
Renovation of the Filters at the Soldier Canyon Filter Plant in Fort Collins, Colorado
 JUST ADD WATER Renovation of the Filters at the Soldier Canyon Filter Plant in Fort Collins, Colorado Thomas M. Getting, P.E., DEE, Filtration Product Manager John Geibel, P.E., Chief Engineer Michael
Lake County WTP Improvements and Capacity Increase. OTCO 9 th Annual Water and Wastewater Workshop. Nick Pizzi Aqua Serv
 1 Lake County WTP Improvements and Capacity Increase OTCO 9 th Annual Water and Wastewater Workshop 7.31.2013 Nick Pizzi Aqua Serv Rick Douglas Lake County Presentation Agenda Some topics we will cover:
DEPARTMENT OF ENVIRONMENTAL PROTECTION Bureau of Water Standards and Facility Regulation. Guidance for Filter Plant Performance Evaluations
 DEPARTMENT OF ENVIRONMENTAL PROTECTION Bureau of Water Standards and Facility Regulation DOCUMENT NUMBER: 383-3120-106 TITLE: EFFECTIVE DATE: AUTHORITY: POLICY: PURPOSE: APPLICABILITY: DISCLAIMER: Guidance
Reclamation of Sand Filter Backwash Effluent using HYDRAcap LD Capillary UF Membrane Technology
 Reclamation of Sand Filter Backwash Effluent using HYDRAcap LD Capillary UF Membrane Technology By Mark Wilf, Ph. D., Graeme Pearce Ph. D., of Hydranautics, Oceanside, CA, and Julie Allam MSc., Javier
Optimizing the Ballasted Sedimentation Process at the Anacortes Water Treatment Plant Jeff Marrs Plant Manager Greg Pierson - HDR
 Optimizing the Ballasted Sedimentation Process at the Anacortes Water Treatment Plant Jeff Marrs Plant Manager Greg Pierson - HDR 2014 HDR, Inc., all rights reserved. Presentation Overview Project drivers
Improved Membrane Design Addresses Integrity Issues for the City of Yuba City Water Treatment Plant
 Improved Membrane Design Addresses Integrity Issues for the City of Yuba City Water Treatment Plant Richard Stratton, PE HDR Engineering Acknowledgements City of Yuba City - John Westhouse, Plant Supervisor
November 28, Dear Mr. Bechtold:
 4000 Hollywood Boulevard Seventh Floor, North Tower Hollywood, Florida 33021 (954) 987-0066 Fax: (954) 987-2949 November 28, 2012 Wastewater Compliance and Enforcement Section FLORIDA DEPARTMENT OF ENVIRONMENTAL
Partnership for Safe Water. Phase III Self-Assessment Template
 Partnership for Safe Water Phase III Self-Assessment Template Disclaimer: The information in this template is intended to provide you with a structured format for tackling the Phase III Self-Assessment.
Riverbank Filtration A Ground-Water Perspective
 Riverbank Filtration A Ground-Water Perspective W I L L I A M D. G O L L N I T Z S U P E R I N T E N D E N T O F W A T E R P U R I F I C A T I O N C I T Y O F L O R A I N, O H E A R T H W O R K S W A T
How Far Can You Push Your Filters? Optimization Lessons
 How Far Can You Push Your Filters? Optimization Lessons Marvin Gnagy, P.E. President PMG Consulting, Inc. 51 st OTCO Water Workshop March 6, 2013 Agenda Two recent filter optimization projects Initial
Separations Overview TDRL Seminar
 Separations Overview TDRL Seminar Presented by: Infilco Degremont North American Footprint 5 companies 471 employees ANDERSON DUNDAS, ON 60 EMPLOYEES DEGREMONT LTD MONTREAL, QC 27 EMPLOYEES WPT SALT LAKE
Tampa Bay Water (TBW) is a regional
 is a regional") FWRJ Enhanced Residuals Treatment Helps Tampa Bay Water Regional Surface Water Treatment Plant Achieve Total Recycling Tony Pevec and Richard D. Moore Tampa Bay Water (TBW) is a regional water supply authority
FWRJ Enhanced Residuals Treatment Helps Tampa Bay Water Regional Surface Water Treatment Plant Achieve Total Recycling Tony Pevec and Richard D. Moore Tampa Bay Water (TBW) is a regional water supply authority
Comparison of Water Quality Parameters
 Name: Date: Comparison of Quality Parameters High School Environmental Science AP Module 2 Regional Reclamation Facility NGSSS Big Idea: Standard 1 Nature of Science Benchmark Code & Description: SC.912.N.1.1
SUSTAINABLE SOLUTIONS AND COST-SAVING APPLICATIONS FOR SMALL WATER SYSTEMS: CASE STUDIES
 1 SUSTAINABLE SOLUTIONS AND COST-SAVING APPLICATIONS FOR SMALL WATER SYSTEMS: CASE STUDIES 2010 GWPC Water/Energy Sustainability Symposium And Annual Forum Pittsburgh, PA September 26-29, 2010 PRESENTERS
Proposed Revised Total Coliform Rule (RTCR)
") Proposed Revised Total Coliform Rule (RTCR) Technical Advisory Committee for Small Water Systems Meeting June 18, 2014 1 Meeting Objectives Review key provisions of the pre-proposed Revised Total Coliform
Proposed Revised Total Coliform Rule (RTCR) Technical Advisory Committee for Small Water Systems Meeting June 18, 2014 1 Meeting Objectives Review key provisions of the pre-proposed Revised Total Coliform
Water Treatment Overview. Gabe Sasser December 2016
 Water Treatment Overview Gabe Sasser December 2016 Topics of Discussion Source Water Information Treatment Plants (History and Capacity) Water Quality Water Treatment Process Distribution System Conservation
Water Treatment Plant Startup Issues and Considerations
 Water Treatment Plant Startup Issues and Considerations Joe Guistino, Coastside County Water District Aileen Kondo, Kennedy/Jenks Consultants California-Nevada Section AWWA Annual Fall Conference 2 October
Optimizing Dual Media Filtration for Particulate Removal
 Leopold, a Xylem Brand White Paper Optimizing Dual Media Filtration for Particulate Removal Thomas L. Yohe, Ph.D.,Vice President, Water Quality John Heichel, Manager of Process Control Bernard Stromberg,
STREAMING CURRENT MONITOR FOR COAGULANT OPTIMIZATION IN WATER TREATMENT PLANTS - LAP EXPERIENCE
 STREAMING CURRENT MONITOR FOR COAGULANT OPTIMIZATION IN WATER TREATMENT PLANTS - LAP EXPERIENCE DECEMBER 15, 2015 (TUESDAY) 9.30 am BORNEO WATER & WASTE WATER EXHIBITION 2015 PRESENTATION OVERVIEW Introduction
Membrane Systems. Featuring Aqua MultiBore Membranes
 Membrane Systems Featuring Aqua MultiBore Membranes Aqua-Aerobic Membrane Systems Featuring Aqua MultiBore Membranes For nearly 50 years, Aqua-Aerobic Systems has provided thousands of customers with adaptive
Your Water Treatment Technology Partners for Wash Water & Industrial Water Treatment. Design Supply Integration Installation Maintenance
 Your Water Treatment Technology Partners for Wash Water & Industrial Water Treatment Design Supply Integration Installation Maintenance The Challenge for Businesses that Use Water PUBLIC HEALTH EPA state
Integrating Ozone and Ion Exchange into a 40 Year Old Lime Softening Plant
 Integrating Ozone and Ion Exchange into a 40 Year Old Lime Softening Plant City of Columbus Division of Water: Matt Steele CH2M HILL: Enoch Nicholson DRWP Source Water and Treatment DRWP Overview Current
Alternative Filter Media for Potable Water Treatment
 Alternative Filter Media for Potable Water Treatment M.E. Steele*, M.J. Chipps*, R. Bayley*, A. Mikol** & C.S.B. Fitzpatrick** * Thames Water Research & Development ** Department of Civil & Environmental
Jungzhina Water Treatment Plant Thimpu, Bhutan
 Jungzhina Water Treatment Plant Thimpu, Bhutan 1. Background Information Thimphu, the capital and the largest city of Bhutan, is situated in the western central part of the country. The water supply for
Removing Heavy Metals from Wastewater
 Removing Heavy Metals from Wastewater Engineering Research Center Report David M. Ayres Allen P. Davis Paul M. Gietka August 1994 1 Removing Heavy Metals From Wastewater Introduction This manual provides
OPERATOR CERTIFICATION EXAMINATION REGISTRATION PA Certification to Operate Water or Wastewater Systems PRINT CLEARLY
 3900-FM-BSDW0109 9/2012 COMMONWEALTH OF PENNSYLVANIA DEPARTMENT OF ENVIRONMENTAL PROTECTION STATE BOARD FOR CERTIFICATION OF WATER AND WASTEWATER SYSTEMS OPERATORS OPERATOR CERTIFICATION EXAMINATION REGISTRATION
BEING GOOD STEWARDS: IMPROVING EFFLUENT QUALITY ON A BARRIER ISLAND. 1.0 Executive Summary
 BEING GOOD STEWARDS: IMPROVING EFFLUENT QUALITY ON A BARRIER ISLAND Brett T. Messner, PE, Tetra Tech, Inc., 201 E Pine St, Suite 1000, Orlando, FL 32801 Brett.Messner@tetratech.com, Ph: 239-851-1225 Fred
Evaluation of MF/UF Technology on the Nooksack River for Drinking Water Production
 Evaluation of MF/UF Technology on the Nooksack River for Drinking Water Production PNWS SECTION AWWA 2008 Dan Hugaboom Acknowledgements 1. City of Lynden a. Tami Adams b. Rick Stroebel c. Duane Huskey
CITY OF LONDON ENVIRONMENTAL & ENGINEERING SERVICES DEPARTMENT WASTEWATER TREATMENT OPERATIONS GREENWAY POLLUTION CONTROL CENTRE 2013 ANNUAL REPORT
 CITY OF LONDON ENVIRONMENTAL & ENGINEERING SERVICES DEPARTMENT WASTEWATER TREATMENT OPERATIONS GREENWAY POLLUTION CONTROL CENTRE 2013 ANNUAL REPORT FEBRUARY 2014 SUMMARY This annual report is in response
Removal of Manganese by Microfiltration in a Water Treatment Plant*
 Removal of Manganese by Microfiltration in a Water Treatment Plant* Carl Schneider, Ph.D., P.E., Senior Process Engineer Wiedeman & Singleton, Inc., Atlanta, GA Peter Johns, P.E., Vice-President Wiedeman
The OWASA UNC Reclaimed Water System: A Progress Review
 The OWASA UNC Reclaimed Water System: A Progress Review 2016 NC WRRI Conference March 17, 2016 Pat Davis A public, non-profit agency providing water, sewer & reclaimed water services to the Carrboro-Chapel
Performance of GAC Filter-Adsorbers for Herbicide and DBP Control at Higginsville,, MO
 Performance of GAC Filter-Adsorbers for Herbicide and DBP Control at Higginsville,, MO Robert L. Segar Jr., Ph.D., P.E. Department of Civil and Environmental Engineering University of Missouri-Columbia
Evaluation of Conventional Activated Sludge Compared to Membrane Bioreactors
 Evaluation of Conventional Activated Sludge Compared to Membrane Bioreactors Short Course on Membrane Bioreactors 3/22/06 R. Shane Trussell, Ph.D., P.E. shane@trusselltech.com Outline Introduction Process
Ann Arbor Wastewater Treatment Plant Facilities Renovations Project October 2017
 Ann Arbor Wastewater Treatment Plant Facilities Renovations Project October 2017 The Facilities Master Plan was completed in 2004 and identified the need for improvements to the City of Ann Arbor s Wastewater
ATTACHMENT A TO THE AGREEMENT FOR ENGINEERING SERVICES. Project: Chloramine Replacement Alternative Evaluation
 ATTACHMENT A TO THE AGREEMENT FOR ENGINEERING SERVICES Owner: Board of Public Works, City of Hannibal, Missouri Project: Chloramine Replacement Alternative Evaluation DESCRIPTION OF SCOPE OF SERVICES On
Introduction; Objectives; m,,^ Work Plan; [ H0 «fljaim «BW»* * Analytical Schedule; Evaluation Criteria.
 1 NSF EQUIPMENT VERIFICATION TESTING PLAN 2 BAG FILTERS AND CARTRIDGE FILTERS 3 4 5 APPLICATION OF THIS VERD7ICATION TESTING PLAN 6 7 This document is the NSF Equipment Verification Testing Plan for evaluation
Granular Activated Carbon System
 Granular Activated Carbon System Eliminating Use of Chloramines March 22, 2017 www.jacobs.com worldwide The Jacobs Team Mike McCarty, PE Project Manager Tobin Lichti, PE Water Treatment Engineer Russ Dahmer,
OPERATION OF AN STP FOR RECYCLED WATER PRODUCTION PLANT. Iain Fairbairn. Iain Fairbairn, Plant Manager, Sydney Water
 Winner of the Actizyme Prize for Best Paper at the NSW Operators Conference held in October 2005 OPERATION OF AN STP FOR RECYCLED WATER PRODUCTION PLANT Paper Presented by : Iain Fairbairn Author: Iain
LT1ESWTR Disinfection Profiling and Benchmarking
 LT1ESWTR Disinfection Profiling and Benchmarking Technical Guidance Manual Log Inactivation 1.400 1.200 1.000 0.800 0.600 0.400 0.200 0.000 Log Inactivation 0 4 8 12 16 20 24 28 32 36 40 44 48 52 Week
Innovative Approach to Expanding the Olentangy WTP
 Innovative Approach to Expanding the Olentangy WTP September 28, 2017 Spencer Sheldon, WTP Superintendent Bret M. Casey, P.E., BCEE Who is Del-Co Water? Member owned 501-(c) Non-Profit Corporation Governed
Drinking Water Audit Report
 Drinking Water Audit Report County: Offaly County Council Date of Audit: 18/11/16 Plant(s) visited: Tullamore Public Water Supply Clonaslee WTP Date of issue of Audit Report: File Reference: 23/11/16 DW2007/343
Case Study: City of Brantford. Controlling Industrial Discharges to Improve Plant Performance
 Case Study: City of Brantford Controlling Industrial Discharges to Improve Plant Performance Tim Howarth City of Brantford, Gerry Wheeler Global Facilitation Inc., Dave Chapman CPO Inc. Introduction: In
HAZARD ANALYSIS AND CRITICAL CONTROL POINTS FOR WATER SUPPLIES. Kevin Hellier. Melbourne Water Corporation
 HAZARD ANALYSIS AND CRITICAL CONTROL POINTS FOR WATER SUPPLIES Paper Presented by : Kevin Hellier Authors: Kevin Hellier, Water Quality Engineer Melbourne Water Corporation 63 rd Annual Water Industry
Treatment Processes for Potable Water
 Treatment Processes for Potable Water Drinking Water Potable water is water that is free of harmful chemicals, microorganisms, and other contaminants and is safe to drink Drinking water also should be
AD26 Systems for Iron, Manganese, Sulfide and Arsenic Removal
 AD26 Systems for Iron, Manganese, Sulfide and Arsenic Removal Technical Bulletin 2004-02 rev0707 Q: What is the AdEdge AD26 System? A: The AD26 system is a pre-engineered, packaged treatment system specifically
EVENT-BASED PATHOGEN ASSESSMENT IN A DEGRADED CATCHMENT. Heidi Josipovic. North East Water
 EVENT-BASED PATHOGEN ASSESSMENT IN A DEGRADED CATCHMENT Paper Presented by: Heidi Josipovic Author: Heidi Josipovic, Systems Optimisation Project Officer, North East Water 77 th Annual WIOA Victorian Water
Kamloops Centre for Water Quality: Membrane Technology Ensures Water Safety
 Kamloops Centre for Water Quality: Membrane Technology Ensures Water Safety History of Water Treatment in Kamloops The waters of the North and South Thompson Rivers that meet in Kamloops, British Columbia,
Ultrafiltration Technical Manual
 Ultrafiltration Technical Manual Copyright by: inge AG Flurstraße 17 86926 Greifenberg (Germany) Tel.: +49 (0) 8192 / 997 700 Fax: +49 (0) 8192 / 997 999 E-Mail: info@inge.ag Internet: www.inge.ag Contents
Wastewater Flow Monitoring Services
 Wastewater Flow Monitoring Services For San Gabriel, CA July 13, 2015 through July 21, 2015 Revised October 9, 2015 Leaders in Sewer Flow Monitoring Services 601 N. Parkcenter Dr., Suite 209 Santa Ana,
FAYOUM CITY SEWAGE TREATMENT PLANT, DEVELOPMENT STAGES, CASE STUDY
 FAYOUM CITY SEWAGE TREATMENT PLANT, DEVELOPMENT STAGES, CASE STUDY Ahmed El-Zayat, Environmental Engineering Group, Egypt Emaill: ahmed_el_zayat@yahoo.com Introduction This case study focuses on three
Method Measurement of Enterovirus and Norovirus Occurrence in Water by Culture and RT-qPCR. EPA/600/R-10/181 December 2010
 EPA/600/R-10/181 December 2010 www.epa.gov/ord Method 1615 Measurement of Enterovirus and Norovirus Occurrence in Water by Culture and RT-qPCR Office of Research and Development National Exposure Research
Iron/Manganese Package Plant Pre-Engineered Ground Water Treatment. Village of Bolivar, NY
 Iron/Manganese Package Plant Pre-Engineered Ground Water Treatment Village of Bolivar, NY Fe/Mn Removal/Village of Bolivar, NY Presentation Outline Fe/Mn Overview Treatment Options Village of Bolivar Challenge
Agenda. Pretreatment Background Typical Contaminants Practical Examples Methods of Treatment and References
 Pretreatment of Seawater for Desalination Plants Richard Dixon, ITT Agenda Pretreatment Background Typical Contaminants Practical Examples Methods of Treatment and References 2 Typical Constituents in
Copies: Mark Hildebrand (NCA) ARCADIS Project No.: April 10, Task A 3100
 ARCADIS Project No.: April 10, Task A 3100") MEMO To: Jeff Pelz (West Yost) Kathryn Gies (West Yost) Copies: Mark Hildebrand (NCA) ARCADIS U.S., Inc. 200 Harvard Mills Square Suite 430 Wakefield Massachusetts 01880 Tel 781 224 4488 Fax 781 224 3033
MEMO To: Jeff Pelz (West Yost) Kathryn Gies (West Yost) Copies: Mark Hildebrand (NCA) ARCADIS U.S., Inc. 200 Harvard Mills Square Suite 430 Wakefield Massachusetts 01880 Tel 781 224 4488 Fax 781 224 3033
Anaerobic Digestion- opportunities to optimize the process
 Northeast Residuals and Biosolids Conference 2016, Cromwell, Connecticut Anaerobic Digestion- opportunities to optimize the process October13, 2016 Acknowledgements Brown and Caldwell Tom Chapman (Tucson),
Pilot Testing Reveals Alternative Methods to Meet Wisconsin s Low Level Phosphorus Limits
 Pilot Testing Reveals Alternative Methods to Meet Wisconsin s Low Level Phosphorus Limits Rachel M. Lee 1*, Jane M. Carlson 1, Jeremy Bril 2, Jeremy Cramer 3, Jeff Harenda 4 1 Strand Associates, Inc.,
Sulaibiya world s largest membrane water reuse project
 Water Technologies & Solutions technical paper Sulaibiya world s largest membrane water reuse project background In May 2001, a consortium including Mohammed Abdulmohsin Al-Kharafi and Sons (The Kharafi
SCARCE RAW WATER RESOURCES
 24 WATER RECLAMATION The Goreangab Water Reclamation Plant in Windhoek is internationally renowned as the first and only plant in the world to reclaim domestic sewage for potable use as a supplement to
REAL WORLD APPLICATIONS OF USING DYNAMIC SIMULATION SOFTWARE TO OPTIMIZE WATER TREATMENT PLANT PROCESS OPERATIONS
 REAL WORLD APPLICATIONS OF USING DYNAMIC SIMULATION SOFTWARE TO OPTIMIZE WATER TREATMENT PLANT PROCESS OPERATIONS (FRIT05) OCTOBER 30, 2015 Authors: Matt Ridens/CH2M, Jason Curl/CH2M Overview Drivers for
CITY OF ST. LOUIS Water Quality Report 2016
 CITY OF ST. LOUIS Water Quality Report 2016 In compliance with the Safe Drinking Water Act, the City of St. Louis Water Division is delivering this Water Quality Report to all its customers who receive
INDUSTRIAL FILTRATION EQUIPMENT LWS Filter Series
 INDUSTRIAL FILTRATION EQUIPMENT LWS Filter Series (Single, Twin, Triple or Quadruple Demand Systems) 1 P age filtration equipment can be engineered to solve complex commercial and industrial water treatment
For Safe and Delicious Water
 RESIDUAL CHLORINE ANALYZER 400G NON-REAGENT FREE CHLORINE ANALYZER FC400G 400G RESIDUAL CHLORINE ANALYZER FC400G NON-REAGENT FREE CHLORINE ANALYZER Bulletin 12F01A01-01E www.yokogawa.com/an/ For Safe and
Partnership for Safe Water
 Partnership for Safe Water Working Together to Protect America s Drinking Water December 2011 Volume 16, Issue 3 The Partnership s mission is to improve the quality of drinking water delivered to customers
A NEW METHOD FOR EVALUATING PRIMARY CLARIFIERS Alex Ekster and Cristina Pena San Jose/Santa Clara Water Pollution Control Plant City of San Jose
 A NEW METHOD FOR EVALUATING PRIMARY CLARIFIERS Alex Ekster and Cristina Pena San Jose/Santa Clara Water Pollution Control Plant City of San Jose ABSTRACT A new method has been developed for evaluating
Tara Water Works Operation and Maintenance Annual Report February 2017
 Tara Water Works 13-028 2016 Operation and Maintenance Annual Report February 2017 Prepared for: Municipality of Arran-Elderslie PO Box 70, 1925 Bruce Road 10 Chesley, ON N0G 1L0 Prepared By: GSS Engineering
Side by Side Piloting of Process Alternatives Yields Direct Performance Comparison
 OBG PRESENTS: OBG PRESENTS: Side by Side Piloting of Process Alternatives Yields Direct Performance Comparison LORI W. REID, P.E. New York State AWWA Spring Meeting, April 26, 2017 Outline Background Project
Key words: Integrated Membrane System, IMS, Seawater Reverse Osmosis, SWRO, SW30HRLE- 400, Ultrafiltration, UF, ZeeWeed 1000
 Yuhuan Power Plant Seawater Desalination System: Integrated Membrane System Introduction and Operation Performance Analysis Jinsheng Liu a, Shenglin Pang a, Minjia Zhao b, Zhuodan Liao b, Jia Ning b a
FILTRATION INDUSTRY -An Overview
 FILTRATION INDUSTRY -An Overview Introduction The term filtration, as applied to water treatment, refers to the removal of suspended solids from water. In most cases it is the last stage in the pre treatment
Startup and Performance of the World s first Large Scale Primary Dissolved Air Floatation Clarifier ABSTRACT KEYWORDS INTRODUCTION
 Startup and Performance of the World s first Large Scale Primary Dissolved Air Floatation Clarifier Bruce R. Johnson 1 *, Jennifer Phillips 2, Tim Bauer 3, Greg Smith 4, George Smith 5, John Sherlock 6
Engineered Media for Municipal and Industrial Applications
 Engineered Media for Municipal and Industrial Applications A Higher Level of Filtration Performance PERF Fairmount Water Solutions Is Raising the Bar on Filtration Media Performance Fairmount Water Solutions
Chlorate Working Group
 Chlorate Working Group Drinking Water Treatment V0 1 May 2016 Why Our journey Jan 2015: 23,000 people on a BWN 121 WSZs on RAL The Challenge 49% UFW Over 33% of our WTPs do not have 15% headroom What brought
Hybrid Filtration. Utilizes the Benefits of Continuous and Traditional Filters without any of the Drawbacks
 Hybrid Filtration Utilizes the Benefits of Continuous and Traditional Filters without any of the Drawbacks Operates Based on Solids Instead of Hydraulics Like Continuous Filters Doesn t Require Ancillary
East Coast P Removal Technology Performance Summary
 East Coast P Removal Technology Performance Summary Charles B. Bott Hampton Roads Sanitation District NonReactive Phosphorus Workshop Spokane, Washington August 11 12, 2009 Acknowledgements Numerous slides
UTILITIES KINGSTON DRINKING WATER QUALITY MANAGEMENT SYSTEM OPERATIONAL PLANS DOCUMENT NO:
 tro lle d on nc U op y C TABLE OF CONTENTS DEFINITIONS... 4 1. INTRODUCTION TO THE QUALITY MANAGEMENT SYSTEM... 7 2. QUALITY MANAGEMENT SYSTEM POLICY... 8 3. COMMITMENT AND ENDORSEMENT... 8 4. QUALITY
SESSION 7. High Turbidity Event Panel Discussion Contingency Plans and Lessons Learned
 SESSION 7 High Turbidity Event Panel Discussion Contingency Plans and Lessons Learned Not Submitted Paul Zalenka City of Phoenix Ken Simpson City of Tempe Mr. Simpson is an AZ native, spent 16 years in
Hollow Fiber and Tubular UF Pilot Testing Procedures & Case Studies
 CROWN Solutions, Inc. Dave Christophersen, 5.5.04 Hollow Fiber and Tubular UF Pilot Testing Procedures & Case Studies Several membrane technologies are available to use for industrial water preparation
MRI Wastewater Inclined Plate Settlers Performance Advantages
 MRI Wastewater Inclined Plate Settlers Performance Advantages Suitable for municipal or industrial applications, performance advantages include: Smaller basin footprint than open clarifiers Significantly
WEFTEC.06. **Cobb County Water System, Marietta, Georgia
 CHEMICALLY ENHANCED PRIMARY TREATMENT FOR A LARGE WATER RECLAMATION FACILITY ON A CONSTRICTED SITE - CONSIDERATIONS FOR DESIGN, START-UP, AND OPERATION ABSTRACT Jeffrey A. Mills, P.E., BCEE,* Roderick
A COMPARATIVE PERFORMANCE STUDY OF TWO TYPES OF CLOTH FILTER MEDIA APPLIED IN MUNICIPAL WASTEWATER TREATMENT
 A COMPARATIVE PERFORMANCE STUDY OF TWO TYPES OF CLOTH FILTER MEDIA APPLIED IN MUNICIPAL WASTEWATER TREATMENT Hui Lin, P.E., Matthew Castillo, Lloyd W. Johnson, P.E., MPD Aqua-Aerobic Systems, Inc., 6306
Annual Report. December 2010 November Bradley Cole 2/7/2012
 Annual Report December 2010 November 2011 Bradley Cole 2/7/2012 CH2M HILL annual report to the Board of Directors of the Pine-Strawberry Water Improvement District. This annual report provides an overview
New Horizons for Slow Sand Filtration. Dr. David H. Manz, P. Eng.
 New Horizons for Slow Sand Filtration Dr. David H. Manz, P. Eng. Published in the Proceedings of the Eleventh Canadian National Conference and Second Policy Forum on Drinking Water and the Biennial Conference
AUTOMATED REPORTING FOR WATER TREATMENT & DISTRIBUTION SYSTEMS
 AUTOMATED REPORTING FOR WATER TREATMENT & DISTRIBUTION SYSTEMS Annual Conference May 3, 2015 Presented by: Zane Spencer, PT P.Tech.(Eng.) Controls Technologist MPE Engineering Ltd. Presentation Agenda
Ceramic Ultra Filtration with Zero Liquid Discharge Better Water, Safer Water, Lower Cost. Purification Capability. Applications
 Ceramic Ultra Filtration with Zero Liquid Discharge Better Water, Safer Water, Lower Cost Cuf is a 5 th Generation Ceramic Membrane Process with proven performance and represents a quantum leap forward
ARSENIC IN DRINKING WATER
 ARSENIC IN DRINKING WATER Treatment Technologies: Removal Background In water, the most common valence states of arsenic are As(V), or arsenate, which is more prevalent in aerobic surface waters and As(III),
WASTEWATER TREATMENT DURING TUNNEL CONSTRUCTION ON BUREAU OF RECLAMATION PROJECTS. By Dr. John C. Peters* INTRODUCTION
 WASTEWATER TREATMENT DURING TUNNEL CONSTRUCTION ON BUREAU OF RECLAMATION PROJECTS By Dr. John C. Peters* INTRODUCTION In recent years, a number of papers have been written concerned with water pollution
OPERATORS PERSPECTIVE : OPTIMISATION OF A NEW PACKAGE WATER TREATMENT PLANT. Melina Entwistle. North East Water Authority
 OPERATORS PERSPECTIVE : OPTIMISATION OF A NEW PACKAGE WATER TREATMENT PLANT Paper Presented by : Melina Entwistle Author: Melina Entwistle, Water and Wastewater Treatment Operator, North East Water Authority
Online THM Analyzer Integral to City of Benicia s Stage 2 DBPR Compliance Strategy
 Online THM Analyzer Integral to City of Benicia s Stage 2 DBPR Compliance Strategy Author: Scott Rovanpera, Superintendent, City of Benicia Water Treatment Plant, srovanpera@ci.benicia.ca.us or Tel: +1
ANNUAL PLATTE RIVER SURFACE WATER FLOW SUMMARY
 ANNUAL PLATTE RIVER SURFACE WATER FLOW SUMMARY 4/3/213 Platte River Recovery Implementation Program 213 ANNUAL SURFACE WATER FLOW SUMMARY DRAFT Prepared by staff of the Platte River Recovery Implementation
Technical Service Bulletin October 2013 TSB
 Technical Service Bulletin October 2013 TSB 139.03 Data Logging, Normalization and erformance Analysis for HYDRAcap Systems. This Technical Service Bulletin provides information for manual data logging,
Section 11: Water treatment and related matters
 SEC TION 11: WATER TREATMENT AND RELATED MATTERS 11 Section 11 Section 11: Water treatment and related matters Summary of Section 11 Describes the importance of quality assurance systems including written
OPTIMISING FILTRATION AT DUNGOG WTP. David Turner. Hunter Water Australia
 OPTIMISING FILTRATION AT DUNGOG WTP Paper Presented by: David Turner Author: David Turner, Operations Support Manager, Darren Bailey, Treatment Operations Manager, Hunter Water Australia 7 th Annual WIOA
CHAPTER 10 PRELIMINARY TREATMENT
 CHAPTER 10 PRELIMINARY TREATMENT TM 5-814-3/AFM 88-11, Volume III 10-1. General considerations. Preliminary treatment of wastewater includes screening, grinding, grit removal, flotation, equilization,
San Antonio Water System Mitchell Lake Constructed Wetlands Below the Dam Preliminary Hydrologic Analysis
 San Antonio Water System enhancement. This recommendation was based on limited water quality data provided by SAWS and using a free-water surface constructed wetland with approximately 112 acres of wetted
Pulp and Paper Mill Southeastern United States
 Comprehensive Aerated Stabilization Basin Evaluation Pulp and Paper Mill Southeastern United States Conducted by: Michael H. Foster Beth Guidotti Todd Talley Christopher Agosta Environmental Business Specialists,
September 26, RE: Waste Water Treatment System. Dear Mr. Starks:
 September 26, 2008 Leon Starks, Director of Maintenance Arkansas Department of Correction East Arkansas Regional Unit 7800 Correction Circle Pine Bluff, Arkansas 71603 RE: Waste Water Treatment System
NITROGEN REDUCTION IN RECIRCULATING BIOFILTER TREATMENT CONCEPTS. David Venhuizen 1
 NITROGEN REDUCTION IN RECIRCULATING BIOFILTER TREATMENT CONCEPTS David Venhuizen 1 Since the recirculation concept was first proposed by Hines and Favreau in the 1970 s, recirculating biofilters utilizing
Coagulation and Flocculation: Color Removal
 Coagulation and Flocculation: Color Removal Submitted to: Dr. Hashsham Research Complex Engineering Department of Civil and Environmental Engineering Michigan State University East Lansing, MI 48824 Authors
EVALUATING NANOFILTRATION, REVERSE OSMOSIS, AND ION EXCHANGE TO MEET CONSUMPTIVE USE CONSTRAINTS AND FINISHED WATER QUALITY GOALS FOR BROWARD COUNTY
 EVALUATING NANOFILTRATION, REVERSE OSMOSIS, AND ION EXCHANGE TO MEET CONSUMPTIVE USE CONSTRAINTS AND FINISHED WATER QUALITY GOALS FOR BROWARD COUNTY Frank A. Brinson, P.E., DEE, CDM, Fort Lauderdale, FL
NIPPON PAPER RO SYSTEM + 2 Others
 NIPPON PAPER RO SYSTEM + 2 Others 1 March 2014 Greg Wyrick District Account Manager John Zora District Account Manager 2 Purpose: Review the design, function, layout, and operation of the RO system. Process:
Module 1: General Overview
 Module 1: General Overview Revised January 2006 This course includes content developed by the Pennsylvania Department of Environmental Protection (Pa. DEP) in cooperation with the following contractors,