APPENDIX C PRELIMINARY HYDROLOGY AND WATER QUALITY STUDY (BWE 2017)
|
|
|
- Oscar Sims
- 6 years ago
- Views:
Transcription
1 UC San Diego Voigt Parking Structure Draft Initial Study and Mitigated Negative Declaration October 2017 APPENDIX C PRELIMINARY HYDROLOGY AND WATER QUALITY STUDY (BWE 2017)
2 UC San Diego Voigt Parking Structure Draft Initial Study and Mitigated Negative Declaration October 2017 This page intentionally left blank

3 PRELIMINARY HYDROLOGY AND WATER QUALITY STUDY Voigt Parking Structure CEQA Submittal UCSD Campus Voigt Drive At Engineer Lane La Jolla, California Prepared By: 9449 Balboa Ave., Suite 270 San Diego, CA Date: July 3, 2017
4 Table of Contents 1. Purpose Project Description Existing Conditions Proposed Improvements Soil Characteristics Calculations a. IMPERVIOUS AND PERVIOUS AREAS: b. RUNOFF COEFFICIENT: c. PEAK FLOW RATES: Stormwater Quality Control Pollutants And Conditions Of Concern Post-Construction Stormwater Bmps In New & Redevelopment Projects Conclusions References Appendices Site Vicinity Map Appendix A Hydrology Exhibits... Appendix B Hydrology Calculations Appendix C Hydrologic Information..... Appendix D 303(d) Impaired Waters Information. Appendix E BMP Design Calculations Appendix F BMP Fact Sheets.... Appendix G
5 1. Purpose The purpose of this hydrology and water quality study is to analyze the existing and proposed drainage patterns and peak flow rates associated with the proposed Voigt Parking Structure project. The 10 year, 6-hr storm is the design storm frequency used for this study. This design criteria satisfies the minimum requirements of UCSD s Drainage Design Guidelines. The basic design criteria and objectives used in this study are to; Analyze the peak flow rate of the 10 year, 6-hour storm frequency at each outlet location Design stormwater best management practices (BMPs) to maintain the 10 year, 6-hour frequency peak flow rate from this development. Analyze and ensure the proposed development is able to bypass the peak flow rate of the 100 year 6-hour frequency storm. This hydrology study is prepared based on the UCSD Drainage Design Policy and utilizing the County of San Diego Hydrology Manual (2003 edition). 2. Project Description The proposed Voigt Parking Structure is located within the limits of the City of San Diego on the University of California San Diego campus. The project site is located at the corner of Voigt Drive and Engineer Lane with associated circulation and public realm improvements extending outward from the site. The project consists of the a proposed parking structure southwest of the intersection of Voigt Drive and Engineer Lane, bike and pedestrian paths from the Price Center to Warren Mall, and pedestrian and bike paths from the proposed parking structure to Hopkins Lane. The project s total disturbed area is approximately 6.6 acres. 3. Existing Conditions Existing improvements at the site of the proposed parking structure include Parking Lot P503, Engineer Lane, and associated sidewalks and landscaping. An asphalt path currently extends from Warren Mall to Hopkins Lane. This area drains to an analysis point at the boundary in the unnamed canyon to the west of Parking Lot P503. The area between Warren Mall and the Price Center contains concrete, asphalt, and paver walkways which flow to a single analysis point in the unnamed canyon. The runoff from the entire project site discharges to an unnamed canyon between Voigt Drive and the Geisel Library. The unnamed canyon ultimately discharges to 1
6 Los Penasquitos Lagoon. See the Existing Condition Hydrology Maps in Appendix B for basin delineations. 4. Proposed Improvements Drainage basins and analysis points for the proposed condition match that in the existing condition to the maximum extent practical. The proposed development will mitigate the 10-year, 6-hour storm and will have the capacity to bypass the 100-year, 6-hour storm. The proposed development generally maintains existing flow patterns and peak flow rates of the existing conditions. Because the peak flow rate from the overall site is mitigated, the project will not create adverse impacts to the existing receiving storm drain system and downstream properties. Proposed improvements include a 1.7 acre Parking Structure, adjacent and rooftop pedestrian paths, improvements along Engineer Lane, and pedestrian and bicycle paths extending from Warren Mall to Hopkins Lane. Approximately 70% of the Parking Structure s roof level will be covered by landscaping and decomposed granite (DG). Proposed public realm improvements include bicycle and pedestrian paths from Warren Mall to the Price Center, as well as adjacent landscaping improvements. Peak flow mitigation will be achieved by routing runoff from the parking structure to biofiltration planters on the structure s western exterior face, and at the bottom of the two light-wells. These planters will detain runoff from the 10-year, 6-hour storm before flowing to planters below, and eventually the unnamed canyon. The proposed site complies with water balance requirements through the use of site design measures. Approximately 2000 square-feet of amended soil areas are proposed between the parking structure and Engineer Lane to meet the requirements of the water balance calculator. The peak flow rate for the 10 year 6 hour storm frequency will be mitigated by biofiltration planters staggered along the western face of the parking structure. See the Proposed Condition Hydrology Maps in Appendix B for basin delineations. 5. Soil Characteristics The site is comprised of hydrologic soil group D based on the County of San Diego Soil Hydrologic Group Maps. Therefore, this hydrology analysis is performed by using design parameter for soil type D. 2
7 6. Calculations 6.a. Impervious and Pervious Areas: The pervious and impervious areas are summarized for both the existing and proposed conditions in Table 6-1. Table 6-1. Voigt Parking Structure Impervious area Area (Acres) Percent Impervious Area Percent Pervious Area Total Impervious (Ai) Pervious (Ap) Existing % 73.2% Proposed % 59.8% % Change 0.0% 50.1% -18.3% Impervious area increases by approximately 39,200 SF in the proposed condition. 6.b. Runoff Coefficient: The runoff coefficient for the site is calculated by using equation provided in Section of the County of San Diego Hydrology Manual. The runoff coefficient C is calculated using the following formula; C = 0.90 x (% Impervious) + Cp x (1 - % Impervious) Where, Cp = Pervious Coefficient Runoff Value for the soil type shown in Table 3-1 as Undisturbed Natural Terrain/Permanent Open Space. Cp = 0.35 is used for Soil Type D For this site, the existing and proposed runoff coefficients (C) are calculated to be 0.50 and 0.57 respectively. Calculations are provided in Appendix C. 6.c. Peak Flow Rates: The rational method estimates the peak rate of runoff as a function of the Runoff Coefficient (C), tributary areas (A), and the Rainfall intensity (I) for a duration equal to the time of concentration (Tc) as follows; Q = CIA 3
8 Where, Q = Peak Runoff rate (cfs) C = Runoff Coefficient I = Rainfall Intensity (in/hr) A = Tributary Area (acres) The 2004 LRDP Environmental Impact Report requires that all developments that will increase impervious surfaces by 10,000 square feet or more shall maintain the peak flow rate for the 10-year, 6-hour storm event. A peak flow rate analysis for the 10-year, 6-hour frequency storm is performed by utilizing the rational method formula. Time of concentrations (Tc) for are determined by utilizing the CivilD computer program. The peak flow rates at each drainage analysis/discharge point are tabulated below for the comparison purposes. See Appendices B, and C for details. Table 6-2. Peak Flow Summary For Voigt Parking Structure Existing Condition Area (acres) Proposed Condition Existing Condition 10 yr, 6-hr Flow Rate (cfs) Proposed Condition (Unmitigated) Proposed Condition (Mitigated) Runoff Exit Point Runoff Exit Point Total The peak flow rate of the 10 yr, 6-hr frequency storm at Runoff Exit Point 1 is reduced from 9.78 to 6.58 cfs. Peak flow rate mitigation is achieved by routing runoff through seven biofiltration planters on the western exterior and within the parking structure s light-wells. Runoff Exit Point 2 experiences an increase in the 10 year, 6 hour peak flow rate due to an increase in area between the existing and proposed conditions, but this increase is offset by reduced runoff at Runoff Exit Point 1. The overall site experiences a reduction of the 10 year, 6 hour peak flow rate from cfs to 7.57 cfs. The peak flow rate mitigation though detention is summarized in Table 6-3, and the detention basin sizing is summarized in Table 6-4. The routing of peak flow rates through the biofiltration planters is analyzed with Hydraflow Hydrographs Express Extension for AutoCad Civil 3D. Inflow hydrographs, basin geometries, and the hydraulic performances of the outlet structures are utilized as input for the model. Peak inflow hydrographs for the basins are developed utilizing the Rick Engineering Rational Hydrograph Generator. Civil-D results and other hydrologic information such as discharge rates, rainfall depths, runoff coefficients and time of 4
9 Detention Basin # concentrations are analyzed to develop a hydrograph. The inflow hydrograph is then manually entered into the Hydraflow Hydrographs software to determine the peak flow rate attenuation achieved by the biofiltration planter. The five planters proposed on the western exterior wall of the parking structure are designed with 1.9 of ponding depth, 0.5 of freeboard, 18 soil media, and 6 gravel. The two planters in the bottom of the two light-wells are designed with a 2.9 of ponding, 0.5 of freeboard, 18 soil media, and 6 gravel. Table 6-3. Peak Flow Reduction Through Detention Peak Flow Rate (cfs) Reduction Detention Unmitigated Mitigated (CFS) Basin # 10 yr- 100 yr- 10 yr- 100 yr- 10 yr- 100 yr- 6hr 6hr 6hr 6hr 6hr 6hr Total Analysis/Runoff Exit Point Table 6-4. Detention Basin Sizing Summary Bottom Area (SF) Outlet Type Weir Length (FT) Media+Gravel Storage Detention Volume (cf) Calculated Net Required Ponding Depth (FT) Total Depth Weir Riser N/A Weir Weir Weir Weir Riser N/A 280 2,600 2, Total 525 4,813 4,288 Note: -Soil media and gravel are assumed to have porosities of 0.1 and 0.4 respectively. -Total Depth includes ponding depth, 0.5 of freeboard, 1.5 of soil media, and 0.5 of gravel. -Ponding Depth is measured from the top of the soil media to the weir or riser crest. 5
10 7. Stormwater Quality Control UCSD has obtained water quality coverage under the U.S. Environmental Protection Agency s (EPA) Phase II Small Municipal Separate Storm Sewer System (MS4) rule. The EPA Storm Water Phase II Rule establishes a storm water management program for small and non-traditional municipal separate storm sewer systems (MS4s), such as Universities and State & federal Agencies. NPDES Phase II regulations require operators of small MS4s to develop, implement, and enforce a storm water management program designed to: Reduce the discharge of pollutants to the Maximum Extent Practicable (MEP); Protect water quality; and Satisfy the appropriate water quality requirements of the CWA and Regional Water Quality Control Board (RWQCB) Basin Plans. As a requirement of the Phase II Rule, UCSD has prepared a Storm Water Management Plan (SWMP) that outlines the Minimum Control Measures to be implemented within the campus facility. The term Minimum Control Measures is used by the EPA for the six MS4 program elements aimed at achieving improved water quality through NPDES Phase II requirements listed below: 1) Public Education and Outreach on Stormwater Impacts 2) Public Involvement/Participation 3) Illicit Discharge Detection and Elimination, 4) Pollution Prevention/ Good House Keeping 5) Construction Site Runoff Control, 6) Post Construction Storm Water Management in New Development and Redevelopment This report will focus primarily on how Post Construction Storm Water Management is implemented into the project design using site design, source control, and structural pollutant control BMPs. The intent of this program is to develop, implement, and enforce a program to address discharges of post-construction storm water runoff from new development and redevelopment areas. The Post Construction Stormwater Management strategies implemented to this project is further discussed in Section Pollutants and Conditions of Concern Watershed Contribution The UCSD Campus is located within the Los Penasquitos Hydrologic Unit (HU ) of the San Diego Region. The Penasquitos Hydrologic Unit is comprised of five hydrologic areas (HAs) and UCSD is located within three: the Miramar Reservoir HA (906.10), the Scripps HA (906.30), and the Miramar HA (906.40). The runoff originating from the site drains north into Los Penasquitos Lagoon via Soledad Canyon which is located within Miramar Reservoir HA (906.10). As a result of this, 6
11 the receiving water risk for the site is high for sediment. The Los Penasquitos Lagoon is impaired by sediment. The specific drainage basins that are relevant to the hydrology of the site are 1100 and According to the UCSD 2004 LRDP Hydrology Study, these drainage basins drain northerly toward Los Penasquitos Lagoon (see figure in appendix D for details). 303(d) Status Site storm runoff ultimately discharges into Los Penasquitos Lagoon. According to the California (d) list, the following impairments have been found in the receiving water bodies for the site runoff. Soledad Canyon: Sediment Toxicity, Selenium Los Penasquitos Lagoon: Sedimentation/Siltation Pacific Ocean Shoreline, Miramar Reservoir HA, at Los Penasquitos River Mouth: Total Coliform See Appendix E for details Impact to Hydrologic Regime The proposed hydrologic regime or drainage pattern for the site will change slightly due to the proposed improvements, but will maintain the existing discharge locations. Similarly, all drainage basins are required to maintain the same 10-year, 6-hour peak flow rate as in the existing condition, and therefore adverse impact to the hydrologic regime is not anticipated to result from this development. Anticipated Pollutants The following list of anticipated and potential pollutants of concern are developed from Table 2-1 (Table 8-1 of this report), of the County of San Diego SUSMP Manual (2011). Project Category(ies) Commercial Development, Hillside Development, Parking Lot, General Pollutants Anticipated Pollutants Sediment Nutrients Heavy Metals Trash & Debris Oxygen Demanding Substances Oil & Grease Potential Pollutants Organic Compounds Bacteria & Viruses Anticipated pollutants likely to be generated from this site is evaluated with the known impairments of the receiving water bodies to determine the primary pollutants 7
12 of concern for the site. Sediment is likely to be generated from the site and the receiving water body (Los Penasquitos Lagoon) is also impaired with sediment. Therefore, sediment is considered as primary pollutant of concern for this site. Table 8-1: Anticipated and potential pollutants by project type (Reproduced from Table 2-1 of the County of San Diego SUSMP, 2011) General Pollutant Categories Priority Project Categories Sediment Nutrients Detached Residential Development Heavy Metals Organic Compounds Trash & Debris Oxygen Demanding Substances Oil & Grease Bacteria & Viruses Pesticides X X X X X X X Attached Residential Development X X X P(1) P(2) P X Commercial Development >one acre Heavy Industry Automotive Repair Shops P(1) P(1) X P(2) X P(5) X P(3) P(5) X X X X X X X X(4)(5) X X Restaurants X X X X P(1) Hillside Development >5,000 ft2 X X X X X X Parking Lots P(1) P(1) X X P(1) X P(1) Retail Gasoline Outlets Streets, Highways & Freeways X X X X X X P(1) X X(4) X P(5) X X P(1) X = anticipated P = potential (1) A potential pollutant if landscaping exists on-site. (2) A potential pollutant if the project includes uncovered parking areas. (3) A potential pollutant if land use involves food or animal waste products. (4) Including petroleum hydrocarbons. (5) Including solvents. 8
13 9. Post-Construction Stormwater BMPs in New & Redevelopment Projects The project creates more than 5,000 sf of impervious area. Therefore, a Post-Construction Storm Water Management Plan which includes Site Design, Source Control, and Treatment Control/baseline hydromodification BMPs is implemented. UCSD Post- Construction Management Checklists are also included in Appendix F of this report. Site Design Measures (BMPs): Site design BMPs aim to treat and control runoff volume. These BMPs preserve natural areas and minimize development impact through improvements such as porous pavement, rooftop and impervious area disconnection, and vegetated swales. Table 9-1 lists the practices that will be implemented for the proposed development. Table 9-1 Stream Setbacks & Buffer Soil Quality Improvement & Maintenance Porous Pavement Vegetated Swales Tree Planting and Preservation Rooftop & Impervious Area Disconnection Green Roofs Rain Barrels & Cisterns Native or drought tolerant plants will be utilized to the maximum extent feasible. Soil compaction will be minimized within the landscape areas. The runoff originating from impervious areas is discharged into adjacent landscaping prior to discharging to the storm drain system. The parking structure roof runoff is discharged into proposed smaller detention basins before being conveyed offsite. Green Roof credit and impervious area disconnection measures are utilized to the maximum extent feasible. Source Control Measures Source-control measures reduce the amount of runoff from the site and prevent pollutants from contaminating the site s runoff. Source-control BMPs are often the most effective to address non-storm (dry-weather) flows. Table 9-2 lists source-control BMPs and indicates the practices that will be implemented at the project site. 9
14 Table 9-2 Source-control BMP alternatives Housekeeping for outdoor work area Spill control and cleanup for outdoor spills or leaks Marine activities Loading dock management Outdoor washing/cleaning Fueling operations Maintenance on equipment containing water (e.g., eyewash showers, boiler drain lines, condensate drain lines, rooftop equipment, and drainage sumps Equipment, vehicle, and boat maintenance Trash management Hazardous materials management Hazardous waste management Potable water system flushing Fire sprinkler and hydrant testing/flushing Landscape management: irrigation runoff, erosion, gen waste Food service management Sanitary sewer overflows/line blockage Onsite transportation of materials/waste Surface cleaning/pressure washing Outdoor painting and sandblasting Storm water conveyance system management to prevent improper discharge into storm drains Non-storm water discharges Integrated pest management Building repairs and remodeling Parking lot and storage area management Pools, decorative fountains, and other water features See Post Construction Stormwater Management Checklist in Appendix F for details. Structural Treatment Control Measures are required only if the site design measures cannot fully meet the water balance requirement. This development is able to meet the water balance requirements by using source control measures, and therefore no postconstruction treatment control measures are necessary. Seven biofiltration planters are proposed for peak flow rate attenuation, however, these planters are not required or designed to provide treatment control. 10
15 10. Conclusions The proposed construction of the UCSD Parking Structure and its associated pedestrian circulation improvements will mitigate water quantity and quality impacts to the maximum extent practical through the use of Best Management Practices. The existing drainage system and flow pattern will not be significantly altered in the proposed condition. The existing receiving system will continue to receive runoff from the site through multiple discharge points. The peak flow rates resulting from the 10 year, 6 hour storm in the existing and proposed conditions are calculated and compared to determine the impact due to the redevelopment. Seven new biofiltration planters are proposed to mitigate the drainage impacts due to the development. Peak flow rates due to 10 year 6-hour storm event are routed through the planters to determine the required mitigation. The cumulative peak flow rate mitigated by the planters is calculated to be 3.20 cfs for the 10 year, 6-hour storm event. As a result, the total peak flow rate from the site will be reduced from to 7.57 cfs, which is 0.20 cfs less than existing conditions. No adverse impact to the receiving drainage system is anticipated because the proposed peak flow rate will be less than existing. The site is designed to meet the water balance requirements by utilizing source control and site design BMPs. As a result, storm water treatment/baseline hydromodification measures are not required for this site. The proposed biofiltration planters are provided solely to control the peak flow rate of the 10 year, 6 hour storm event. The downstream drainage system is assumed to have capacity to convey runoff from the peak 100 year storm event. Therefore, offsite drainage analysis is not performed. The site is also designed to bypass the peak flow rate due to 100 year storm event. 11
16 11. References County of San Diego SUSMP: Standard Urban Stormwater Mitigation Plan Requirements for Development Application (2011) UC San Diego Storm Water Management Plan (December, 2011). County of San Diego Hydrology Manual (2003) County of San Diego, Department of Planning and Land Use. (December 31, 2007) Low Impact Development Handbook. Stormwater Management Strategies. UCSD Design Guidelines (9/29/2009) California Stormwater BMP Handbook New Development and Redevelopment (2003) UCSD 2004 Long Range Development Plan (LRDP) Final EIR 12
17 APPENDIX A: Site Vicinity Map 19
18 20
19 APPENDIX B: Hydrology Exhibits 20
20
21
22 UP DN MATTHEWS LANE PLANTER PLANTER PLANTER PLANTER OPEN ELEC. EQUIPMENT DUMPSTER BRIDGE DN DN DN DN DN PLANTER DN DN PLANTER OUTSIDE PATIO RAMP UP UP UP DN DN
23
24 ING LOAD E ZON
25 DN UP DUMPSTER ELEC. EQUIPMENT BRIDGE DN PLANTER PLANTER PLANTER PLANTER PLANTER PLANTER OPEN DN DN DN DN DN DN DN DN DN DN DN PLANTER PLANTER RAMP UP UP UP UP OUTSIDE PATIO DN DN DN UP DUMPSTER ELEC. EQUIPMENT BRIDGE DN PLANTER PLANTER PLANTER PLANTER PLANTER PLANTER OPEN DN DN DN DN DN DN DN DN DN DN DN PLANTER PLANTER RAMP UP UP UP UP OUTSIDE PATIO DN DN MATTHEWS LANE
26 APPENDIX C: Hydrology Calculations
27
28 Runoff Coefficient Calculation (Existing Condition) Project: UCSD Voigt Parking Structure Soil Type: D C = 0.90 (% Impervious) + Cp (1 - % Impervious) Cp= 0.35 (per Table 3-1, County of San Diego Hydrology Manual, Soil Class D) Basin # Total Area (ac) Area (Acres) Imp. Area (Ai) %imp *Runoff Coef. (C ) C x A Weighted C-Factor **Equivalent Land Use (from Table 3-1) A B C Total Residential, Low Density 2.9 DU/A *The composite runoff coefficient (C) is calculated for entire site by using the following equation: C = 0.90 (% Impervious) + Cp (1 - % Impervious); Cp = 0.35 per Table 3-1 of the County Hydrology Manual = Pervious Coefficient Runoff Value for the soil type D (shown in Table 3-1 as Undisturbed Natural Terrain/Permanenet Open Space, 0% Impervious) **Equivalent Land Use type is determined to be used as an input to the CivilD software for initial basin analysis only because the calculated C value cannot be entered as is.
29
30 UCSD10YREX1.out San Diego County Rational Hydrology Program CIVILCADD/CIVILDESIGN Engineering Software,(c) Version 7.9 Rational method hydrology program based on San Diego County Flood Control Division 2003 hydrology manual Rational Hydrology Study Date: 06/30/ UCSD VOIGT PARKING STRUCTURE EXISTING CONDITION HYDROLOGY ANALYSIS EXIT POINT ********* Hydrology Study Control Information ********** Program License Serial Number Rational hydrology study storm event year is 10.0 English (in-lb) input data Units used Map data precipitation entered: 6 hour, precipitation(inches) = hour precipitation(inches) = P6/P24 = 57.7% San Diego hydrology manual 'C' values used Process from Point/Station to Point/Station **** INITIAL AREA EVALUATION **** Decimal fraction soil group A = Decimal fraction soil group B = Decimal fraction soil group C = Decimal fraction soil group D = [LOW DENSITY RESIDENTIAL ] (2.0 DU/A or Less ) Impervious value, Ai = Sub-Area C Value = Initial subarea total flow distance = (Ft.) Highest elevation = (Ft.) Lowest elevation = (Ft.) Elevation difference = (Ft.) Slope = % Top of Initial Area Slope adjusted by User to % Bottom of Initial Area Slope adjusted by User to % INITIAL AREA TIME OF CONCENTRATION CALCULATIONS: The maximum overland flow distance is (Ft) for the top area slope value of %, in a development type of 2.0 DU/A or Less In Accordance With Figure 3-3 Initial Area Time of Concentration = 3.79 minutes TC = [1.8*(1.1-C)*distance(Ft.)^.5)/(% slope^(1/3)] TC = [1.8*( )*( ^.5)/( ^(1/3)]= 3.79 The initial area total distance of (Ft.) entered leaves a remaining distance of (Ft.) Using Figure 3-4, the travel time for this distance is 0.08 minutes for a distance of (Ft.) and a slope of % Page 1
31 UCSD10YREX1.out with an elevation difference of 2.80(Ft.) from the end of the top area Tt = [11.9*length(Mi)^3)/(elevation change(ft.))]^.385 *60(min/hr) = Minutes Tt=[(11.9*0.0019^3)/( 2.80)]^.385= 0.08 Total initial area Ti = 3.79 minutes from Figure 3-3 formula plus 0.08 minutes from the Figure 3-4 formula = 3.87 minutes Calculated TC of minutes is less than 5 minutes, resetting TC to 5.0 minutes for rainfall intensity calculations Rainfall intensity (I) = 3.952(In/Hr) for a 10.0 year storm Effective runoff coefficient used for area (Q=KCIA) is C = Subarea runoff = 0.345(CFS) Total initial stream area = 0.190(Ac.) Process from Point/Station to Point/Station **** IRREGULAR CHANNEL FLOW TRAVEL TIME **** Estimated mean flow rate at midpoint of channel = 1.104(CFS) Depth of flow = 0.112(Ft.), Average velocity = 2.941(Ft/s) ******* Irregular Channel Data *********** Information entered for subchannel number 1 : Point number 'X' coordinate 'Y' coordinate Manning's 'N' friction factor = Sub-Channel flow = 1.104(CFS) ' ' flow top width = 6.713(Ft.) ' ' velocity= 2.941(Ft/s) ' ' area = 0.375(Sq.Ft) ' ' Froude number = Upstream point elevation = (Ft.) Downstream point elevation = (Ft.) Flow length = (Ft.) Travel time = 0.83 min. Time of concentration = 4.70 min. Depth of flow = 0.112(Ft.) Average velocity = 2.941(Ft/s) Total irregular channel flow = 1.104(CFS) Irregular channel normal depth above invert elev. = 0.112(Ft.) Average velocity of channel(s) = 2.941(Ft/s) Adding area flow to channel Calculated TC of minutes is less than 5 minutes, resetting TC to 5.0 minutes for rainfall intensity calculations Rainfall intensity (I) = 3.952(In/Hr) for a 10.0 year storm User specified 'C' value of given for subarea Rainfall intensity = 3.952(In/Hr) for a 10.0 year storm Effective runoff coefficient used for total area (Q=KCIA) is C = CA = Subarea runoff = 1.581(CFS) for 0.800(Ac.) Total runoff = 1.926(CFS) Total area = 0.990(Ac.) Depth of flow = 0.138(Ft.), Average velocity = 3.380(Ft/s) Process from Point/Station to Point/Station **** IRREGULAR CHANNEL FLOW TRAVEL TIME **** Depth of flow = 0.159(Ft.), Average velocity = 2.536(Ft/s) Page 2
32 UCSD10YREX1.out ******* Irregular Channel Data *********** Information entered for subchannel number 1 : Point number 'X' coordinate 'Y' coordinate Manning's 'N' friction factor = Sub-Channel flow = 1.926(CFS) ' ' flow top width = 9.546(Ft.) ' ' velocity= 2.537(Ft/s) ' ' area = 0.759(Sq.Ft) ' ' Froude number = Upstream point elevation = (Ft.) Downstream point elevation = (Ft.) Flow length = (Ft.) Travel time = 0.58 min. Time of concentration = 5.27 min. Depth of flow = 0.159(Ft.) Average velocity = 2.536(Ft/s) Total irregular channel flow = 1.926(CFS) Irregular channel normal depth above invert elev. = Average velocity of channel(s) = 2.536(Ft/s) 0.159(Ft.) Process from Point/Station to Point/Station **** CONFLUENCE OF MINOR STREAMS **** Along Main Stream number: 1 in normal stream number 1 Stream flow area = 0.990(Ac.) Runoff from this stream = 1.926(CFS) Time of concentration = 5.27 min. Rainfall intensity = 3.818(In/Hr) Process from Point/Station to Point/Station **** INITIAL AREA EVALUATION **** Decimal fraction soil group A = Decimal fraction soil group B = Decimal fraction soil group C = Decimal fraction soil group D = [LOW DENSITY RESIDENTIAL ] (2.0 DU/A or Less ) Impervious value, Ai = Sub-Area C Value = Initial subarea total flow distance = (Ft.) Highest elevation = (Ft.) Lowest elevation = (Ft.) Elevation difference = 5.500(Ft.) Slope = % INITIAL AREA TIME OF CONCENTRATION CALCULATIONS: The maximum overland flow distance is (Ft) for the top area slope value of 8.59 %, in a development type of 2.0 DU/A or Less In Accordance With Figure 3-3 Initial Area Time of Concentration = 5.62 minutes TC = [1.8*(1.1-C)*distance(Ft.)^.5)/(% slope^(1/3)] TC = [1.8*( )*( ^.5)/( 8.594^(1/3)]= 5.62 Rainfall intensity (I) = 3.663(In/Hr) for a 10.0 year storm Page 3
33 UCSD10YREX1.out Effective runoff coefficient used for area (Q=KCIA) is C = Subarea runoff = 0.101(CFS) Total initial stream area = 0.060(Ac.) Process from Point/Station to Point/Station **** IRREGULAR CHANNEL FLOW TRAVEL TIME **** Estimated mean flow rate at midpoint of channel = 0.649(CFS) Depth of flow = 0.116(Ft.), Average velocity = 4.806(Ft/s) ******* Irregular Channel Data *********** Information entered for subchannel number 1 : Point number 'X' coordinate 'Y' coordinate Manning's 'N' friction factor = Sub-Channel flow = 0.649(CFS) ' ' flow top width = 2.324(Ft.) ' ' velocity= 4.806(Ft/s) ' ' area = 0.135(Sq.Ft) ' ' Froude number = Upstream point elevation = (Ft.) Downstream point elevation = (Ft.) Flow length = (Ft.) Travel time = 0.70 min. Time of concentration = 6.33 min. Depth of flow = 0.116(Ft.) Average velocity = 4.806(Ft/s) Total irregular channel flow = 0.649(CFS) Irregular channel normal depth above invert elev. = 0.116(Ft.) Average velocity of channel(s) = 4.806(Ft/s) Adding area flow to channel Rainfall intensity (I) = 3.395(In/Hr) for a 10.0 year storm User specified 'C' value of given for subarea Rainfall intensity = 3.395(In/Hr) for a 10.0 year storm Effective runoff coefficient used for total area (Q=KCIA) is C = CA = Subarea runoff = 1.096(CFS) for 0.650(Ac.) Total runoff = 1.197(CFS) Total area = 0.710(Ac.) Depth of flow = 0.146(Ft.), Average velocity = 5.601(Ft/s) Process from Point/Station to Point/Station **** IRREGULAR CHANNEL FLOW TRAVEL TIME **** Estimated mean flow rate at midpoint of channel = 1.657(CFS) Depth of flow = 0.149(Ft.), Average velocity = 2.473(Ft/s) ******* Irregular Channel Data *********** Information entered for subchannel number 1 : Point number 'X' coordinate 'Y' coordinate Manning's 'N' friction factor = Sub-Channel flow = 1.657(CFS) Page 4
34 UCSD10YREX1.out ' ' flow top width = 8.967(Ft.) ' ' velocity= 2.473(Ft/s) ' ' area = 0.670(Sq.Ft) ' ' Froude number = Upstream point elevation = (Ft.) Downstream point elevation = (Ft.) Flow length = (Ft.) Travel time = 0.96 min. Time of concentration = 7.29 min. Depth of flow = 0.149(Ft.) Average velocity = 2.473(Ft/s) Total irregular channel flow = 1.657(CFS) Irregular channel normal depth above invert elev. = 0.149(Ft.) Average velocity of channel(s) = 2.473(Ft/s) Adding area flow to channel Rainfall intensity (I) = 3.100(In/Hr) for a 10.0 year storm User specified 'C' value of given for subarea Rainfall intensity = 3.100(In/Hr) for a 10.0 year storm Effective runoff coefficient used for total area (Q=KCIA) is C = CA = Subarea runoff = 0.826(CFS) for 0.600(Ac.) Total runoff = 2.023(CFS) Total area = 1.310(Ac.) Depth of flow = 0.161(Ft.), Average velocity = 2.599(Ft/s) Process from Point/Station to Point/Station **** SUBAREA FLOW ADDITION **** Rainfall intensity (I) = 3.100(In/Hr) for a 10.0 year storm User specified 'C' value of given for subarea Time of concentration = 7.29 min. Rainfall intensity = 3.100(In/Hr) for a 10.0 year storm Effective runoff coefficient used for total area (Q=KCIA) is C = CA = Subarea runoff = 0.667(CFS) for 0.430(Ac.) Total runoff = 2.690(CFS) Total area = 1.740(Ac.) Process from Point/Station to Point/Station **** SUBAREA FLOW ADDITION **** Rainfall intensity (I) = 3.100(In/Hr) for a 10.0 year storm User specified 'C' value of given for subarea Time of concentration = 7.29 min. Rainfall intensity = 3.100(In/Hr) for a 10.0 year storm Effective runoff coefficient used for total area (Q=KCIA) is C = CA = Subarea runoff = 1.705(CFS) for 1.100(Ac.) Total runoff = 4.395(CFS) Total area = 2.840(Ac.) Process from Point/Station to Point/Station **** CONFLUENCE OF MINOR STREAMS **** Along Main Stream number: 1 in normal stream number 1 Stream flow area = 2.840(Ac.) Runoff from this stream = 4.395(CFS) Time of concentration = Rainfall intensity = 7.29 min (In/Hr) Page 5
35 UCSD10YREX1.out Process from Point/Station to Point/Station **** INITIAL AREA EVALUATION **** Decimal fraction soil group A = Decimal fraction soil group B = Decimal fraction soil group C = Decimal fraction soil group D = [LOW DENSITY RESIDENTIAL ] (2.0 DU/A or Less ) Impervious value, Ai = Sub-Area C Value = Initial subarea total flow distance = (Ft.) Highest elevation = (Ft.) Lowest elevation = (Ft.) Elevation difference = 5.200(Ft.) Slope = % INITIAL AREA TIME OF CONCENTRATION CALCULATIONS: The maximum overland flow distance is (Ft) for the top area slope value of 5.20 %, in a development type of 2.0 DU/A or Less In Accordance With Figure 3-3 Initial Area Time of Concentration = 6.65 minutes TC = [1.8*(1.1-C)*distance(Ft.)^.5)/(% slope^(1/3)] TC = [1.8*( )*( ^.5)/( 5.200^(1/3)]= 6.65 Rainfall intensity (I) = 3.288(In/Hr) for a 10.0 year storm Effective runoff coefficient used for area (Q=KCIA) is C = Subarea runoff = 0.182(CFS) Total initial stream area = 0.120(Ac.) Process from Point/Station to Point/Station **** IRREGULAR CHANNEL FLOW TRAVEL TIME **** Estimated mean flow rate at midpoint of channel = 0.681(CFS) Depth of flow = 0.124(Ft.), Average velocity = 2.636(Ft/s) ******* Irregular Channel Data *********** Information entered for subchannel number 1 : Point number 'X' coordinate 'Y' coordinate Manning's 'N' friction factor = Sub-Channel flow = 0.681(CFS) ' ' flow top width = 4.149(Ft.) ' ' velocity= 2.636(Ft/s) ' ' area = 0.258(Sq.Ft) ' ' Froude number = Upstream point elevation = (Ft.) Downstream point elevation = (Ft.) Flow length = (Ft.) Travel time = 1.10 min. Time of concentration = 7.75 min. Depth of flow = 0.124(Ft.) Average velocity = 2.636(Ft/s) Total irregular channel flow = 0.681(CFS) Irregular channel normal depth above invert elev. = Average velocity of channel(s) = 2.636(Ft/s) Page (Ft.)
36 UCSD10YREX1.out Adding area flow to channel Rainfall intensity (I) = 2.979(In/Hr) for a 10.0 year storm User specified 'C' value of given for subarea Rainfall intensity = 2.979(In/Hr) for a 10.0 year storm Effective runoff coefficient used for total area (Q=KCIA) is C = CA = Subarea runoff = 0.966(CFS) for 0.660(Ac.) Total runoff = 1.148(CFS) Total area = 0.780(Ac.) Depth of flow = 0.151(Ft.), Average velocity = 3.003(Ft/s) Process from Point/Station to Point/Station **** IRREGULAR CHANNEL FLOW TRAVEL TIME **** Estimated mean flow rate at midpoint of channel = 1.545(CFS) Depth of flow = 0.351(Ft.), Average velocity = 3.136(Ft/s) ******* Irregular Channel Data *********** Information entered for subchannel number 1 : Point number 'X' coordinate 'Y' coordinate Manning's 'N' friction factor = Sub-Channel flow = 1.545(CFS) ' ' flow top width = 2.807(Ft.) ' ' velocity= 3.136(Ft/s) ' ' area = 0.493(Sq.Ft) ' ' Froude number = Upstream point elevation = (Ft.) Downstream point elevation = (Ft.) Flow length = (Ft.) Travel time = 0.48 min. Time of concentration = 8.23 min. Depth of flow = 0.351(Ft.) Average velocity = 3.136(Ft/s) Total irregular channel flow = 1.545(CFS) Irregular channel normal depth above invert elev. = 0.351(Ft.) Average velocity of channel(s) = 3.136(Ft/s) Adding area flow to channel Rainfall intensity (I) = 2.866(In/Hr) for a 10.0 year storm User specified 'C' value of given for subarea Rainfall intensity = 2.866(In/Hr) for a 10.0 year storm Effective runoff coefficient used for total area (Q=KCIA) is C = CA = Subarea runoff = 0.730(CFS) for 0.540(Ac.) Total runoff = 1.878(CFS) Total area = 1.320(Ac.) Depth of flow = 0.378(Ft.), Average velocity = 3.293(Ft/s) Process from Point/Station to Point/Station **** PIPEFLOW TRAVEL TIME (Program estimated size) **** Upstream point/station elevation = (Ft.) Downstream point/station elevation = (Ft.) Pipe length = 47.60(Ft.) Slope = Manning's N = No. of pipes = 1 Required pipe flow = 1.878(CFS) Nearest computed pipe diameter = 9.00(In.) Calculated individual pipe flow = 1.878(CFS) Page 7
37 UCSD10YREX1.out Normal flow depth in pipe = 4.23(In.) Flow top width inside pipe = 8.98(In.) Critical Depth = 7.51(In.) Pipe flow velocity = 9.20(Ft/s) Travel time through pipe = 0.09 min. Time of concentration (TC) = 8.31 min. Process from Point/Station to Point/Station **** SUBAREA FLOW ADDITION **** Rainfall intensity (I) = 2.847(In/Hr) for a 10.0 year storm User specified 'C' value of given for subarea Time of concentration = 8.31 min. Rainfall intensity = 2.847(In/Hr) for a 10.0 year storm Effective runoff coefficient used for total area (Q=KCIA) is C = CA = Subarea runoff = 0.500(CFS) for 0.360(Ac.) Total runoff = 2.378(CFS) Total area = 1.680(Ac.) Process from Point/Station to Point/Station **** PIPEFLOW TRAVEL TIME (Program estimated size) **** Upstream point/station elevation = (Ft.) Downstream point/station elevation = (Ft.) Pipe length = 22.00(Ft.) Slope = Manning's N = No. of pipes = 1 Required pipe flow = 2.378(CFS) Nearest computed pipe diameter = 6.00(In.) Calculated individual pipe flow = 2.378(CFS) Normal flow depth in pipe = 4.20(In.) Flow top width inside pipe = 5.50(In.) Critical depth could not be calculated. Pipe flow velocity = 16.23(Ft/s) Travel time through pipe = 0.02 min. Time of concentration (TC) = 8.34 min. Process from Point/Station to Point/Station **** PIPEFLOW TRAVEL TIME (Program estimated size) **** Upstream point/station elevation = (Ft.) Downstream point/station elevation = (Ft.) Pipe length = 80.00(Ft.) Slope = Manning's N = No. of pipes = 1 Required pipe flow = 2.378(CFS) Nearest computed pipe diameter = 9.00(In.) Calculated individual pipe flow = 2.378(CFS) Normal flow depth in pipe = 5.65(In.) Flow top width inside pipe = 8.70(In.) Critical Depth = 8.19(In.) Pipe flow velocity = 8.15(Ft/s) Travel time through pipe = 0.16 min. Time of concentration (TC) = 8.50 min. Process from Point/Station to Point/Station **** SUBAREA FLOW ADDITION **** Rainfall intensity (I) = 2.807(In/Hr) for a 10.0 year storm Page 8
38 UCSD10YREX1.out User specified 'C' value of given for subarea Time of concentration = 8.50 min. Rainfall intensity = 2.807(In/Hr) for a 10.0 year storm Effective runoff coefficient used for total area (Q=KCIA) is C = CA = Subarea runoff = 0.233(CFS) for 0.190(Ac.) Total runoff = 2.611(CFS) Total area = 1.870(Ac.) Process from Point/Station to Point/Station **** SUBAREA FLOW ADDITION **** Rainfall intensity (I) = 2.807(In/Hr) for a 10.0 year storm User specified 'C' value of given for subarea Time of concentration = 8.50 min. Rainfall intensity = 2.807(In/Hr) for a 10.0 year storm Effective runoff coefficient used for total area (Q=KCIA) is C = CA = Subarea runoff = 0.449(CFS) for 0.320(Ac.) Total runoff = 3.060(CFS) Total area = 2.190(Ac.) Process from Point/Station to Point/Station **** PIPEFLOW TRAVEL TIME (Program estimated size) **** Upstream point/station elevation = (Ft.) Downstream point/station elevation = (Ft.) Pipe length = (Ft.) Slope = Manning's N = No. of pipes = 1 Required pipe flow = 3.060(CFS) Nearest computed pipe diameter = 9.00(In.) Calculated individual pipe flow = 3.060(CFS) Normal flow depth in pipe = 4.11(In.) Flow top width inside pipe = 8.97(In.) Critical depth could not be calculated. Pipe flow velocity = 15.56(Ft/s) Travel time through pipe = 0.12 min. Time of concentration (TC) = 8.62 min. Process from Point/Station to Point/Station **** PIPEFLOW TRAVEL TIME (Program estimated size) **** Upstream point/station elevation = (Ft.) Downstream point/station elevation = (Ft.) Pipe length = (Ft.) Slope = Manning's N = No. of pipes = 1 Required pipe flow = 3.060(CFS) Nearest computed pipe diameter = 12.00(In.) Calculated individual pipe flow = 3.060(CFS) Normal flow depth in pipe = 5.81(In.) Flow top width inside pipe = 11.99(In.) Critical Depth = 8.99(In.) Pipe flow velocity = 8.12(Ft/s) Travel time through pipe = 0.23 min. Time of concentration (TC) = 8.85 min. Process from Point/Station to Point/Station **** SUBAREA FLOW ADDITION **** Page 9
39 UCSD10YREX1.out Rainfall intensity (I) = 2.735(In/Hr) for a 10.0 year storm User specified 'C' value of given for subarea Time of concentration = 8.85 min. Rainfall intensity = 2.735(In/Hr) for a 10.0 year storm Effective runoff coefficient used for total area (Q=KCIA) is C = CA = Subarea runoff = 0.222(CFS) for 0.220(Ac.) Total runoff = 3.282(CFS) Total area = 2.410(Ac.) Process from Point/Station to Point/Station **** PIPEFLOW TRAVEL TIME (Program estimated size) **** Upstream point/station elevation = (Ft.) Downstream point/station elevation = (Ft.) Pipe length = (Ft.) Slope = Manning's N = No. of pipes = 1 Required pipe flow = 3.282(CFS) Nearest computed pipe diameter = 9.00(In.) Calculated individual pipe flow = 3.282(CFS) Normal flow depth in pipe = 5.13(In.) Flow top width inside pipe = 8.91(In.) Critical depth could not be calculated. Pipe flow velocity = 12.61(Ft/s) Travel time through pipe = 0.38 min. Time of concentration (TC) = 9.23 min. Process from Point/Station to Point/Station **** CONFLUENCE OF MINOR STREAMS **** Along Main Stream number: 1 in normal stream number 2 Stream flow area = 2.410(Ac.) Runoff from this stream = 3.282(CFS) Time of concentration = 9.23 min. Rainfall intensity = 2.661(In/Hr) Summary of stream data: Stream Flow rate TC Rainfall Intensity No. (CFS) (min) (In/Hr) Qmax(1) = * * 4.395) * * 3.282) + = Qmax(2) = * * 4.395) * * 3.282) + = Total of 2 streams to confluence: Flow rates before confluence point: Maximum flow rates at confluence using above data: Area of streams before confluence: Results of confluence: Total flow rate = 7.054(CFS) Time of concentration = min. Effective stream area after confluence = 5.250(Ac.) Page 10
40 UCSD10YREX1.out End of computations, total study area = (Ac.) Page 11
41 UCSD10YREX2.out San Diego County Rational Hydrology Program CIVILCADD/CIVILDESIGN Engineering Software,(c) Version 7.9 Rational method hydrology program based on San Diego County Flood Control Division 2003 hydrology manual Rational Hydrology Study Date: 06/30/ UCSD VOIGT PARKING STRUCTURE EXISTING CONDITION HYDROLOGY ANALYSIS RUNOFF EXIT POINT ********* Hydrology Study Control Information ********** Program License Serial Number Rational hydrology study storm event year is 10.0 English (in-lb) input data Units used Map data precipitation entered: 6 hour, precipitation(inches) = hour precipitation(inches) = P6/P24 = 57.7% San Diego hydrology manual 'C' values used Process from Point/Station to Point/Station **** INITIAL AREA EVALUATION **** Decimal fraction soil group A = Decimal fraction soil group B = Decimal fraction soil group C = Decimal fraction soil group D = [LOW DENSITY RESIDENTIAL ] (2.0 DU/A or Less ) Impervious value, Ai = Sub-Area C Value = Initial subarea total flow distance = (Ft.) Highest elevation = (Ft.) Lowest elevation = (Ft.) Elevation difference = 8.000(Ft.) Slope = % Top of Initial Area Slope adjusted by User to % Bottom of Initial Area Slope adjusted by User to % INITIAL AREA TIME OF CONCENTRATION CALCULATIONS: The maximum overland flow distance is (Ft) for the top area slope value of 5.00 %, in a development type of 2.0 DU/A or Less In Accordance With Figure 3-3 Initial Area Time of Concentration = 6.74 minutes TC = [1.8*(1.1-C)*distance(Ft.)^.5)/(% slope^(1/3)] TC = [1.8*( )*( ^.5)/( 5.000^(1/3)]= 6.74 The initial area total distance of (Ft.) entered leaves a remaining distance of (Ft.) Using Figure 3-4, the travel time for this distance is 0.62 minutes for a distance of (Ft.) and a slope of 5.00 % Page 1
42 UCSD10YREX2.out with an elevation difference of 3.25(Ft.) from the end of the top area Tt = [11.9*length(Mi)^3)/(elevation change(ft.))]^.385 *60(min/hr) = Minutes Tt=[(11.9*0.0123^3)/( 3.25)]^.385= 0.62 Total initial area Ti = 6.74 minutes from Figure 3-3 formula plus 0.62 minutes from the Figure 3-4 formula = 7.35 minutes Rainfall intensity (I) = 3.082(In/Hr) for a 10.0 year storm Effective runoff coefficient used for area (Q=KCIA) is C = Subarea runoff = 0.241(CFS) Total initial stream area = 0.170(Ac.) Process from Point/Station to Point/Station **** SUBAREA FLOW ADDITION **** Rainfall intensity (I) = 3.082(In/Hr) for a 10.0 year storm User specified 'C' value of given for subarea Time of concentration = 7.35 min. Rainfall intensity = 3.082(In/Hr) for a 10.0 year storm Effective runoff coefficient used for total area (Q=KCIA) is C = CA = Subarea runoff = 0.123(CFS) for 0.080(Ac.) Total runoff = 0.364(CFS) Total area = 0.250(Ac.) Process from Point/Station to Point/Station **** CONFLUENCE OF MINOR STREAMS **** Along Main Stream number: 1 in normal stream number 1 Stream flow area = 0.250(Ac.) Runoff from this stream = 0.364(CFS) Time of concentration = 7.35 min. Rainfall intensity = 3.082(In/Hr) Process from Point/Station to Point/Station **** INITIAL AREA EVALUATION **** Decimal fraction soil group A = Decimal fraction soil group B = Decimal fraction soil group C = Decimal fraction soil group D = [LOW DENSITY RESIDENTIAL ] (2.0 DU/A or Less ) Impervious value, Ai = Sub-Area C Value = Initial subarea total flow distance = (Ft.) Highest elevation = (Ft.) Lowest elevation = (Ft.) Elevation difference = (Ft.) Slope = % INITIAL AREA TIME OF CONCENTRATION CALCULATIONS: The maximum overland flow distance is (Ft) for the top area slope value of %, in a development type of 2.0 DU/A or Less In Accordance With Figure 3-3 Initial Area Time of Concentration = 5.10 minutes TC = [1.8*(1.1-C)*distance(Ft.)^.5)/(% slope^(1/3)] TC = [1.8*( )*( ^.5)/( ^(1/3)]= 5.10 The initial area total distance of (Ft.) entered leaves a remaining distance of (Ft.) Page 2
43 UCSD10YREX2.out Using Figure 3-4, the travel time for this distance is 0.49 minutes for a distance of (Ft.) and a slope of % with an elevation difference of 8.51(Ft.) from the end of the top area Tt = [11.9*length(Mi)^3)/(elevation change(ft.))]^.385 *60(min/hr) = Minutes Tt=[(11.9*0.0140^3)/( 8.51)]^.385= 0.49 Total initial area Ti = 5.10 minutes from Figure 3-3 formula plus 0.49 minutes from the Figure 3-4 formula = 5.60 minutes Rainfall intensity (I) = 3.674(In/Hr) for a 10.0 year storm Effective runoff coefficient used for area (Q=KCIA) is C = Subarea runoff = 0.270(CFS) Total initial stream area = 0.160(Ac.) Process from Point/Station to Point/Station **** CONFLUENCE OF MINOR STREAMS **** Along Main Stream number: 1 in normal stream number 2 Stream flow area = 0.160(Ac.) Runoff from this stream = 0.270(CFS) Time of concentration = 5.60 min. Rainfall intensity = 3.674(In/Hr) Summary of stream data: Stream Flow rate TC Rainfall Intensity No. (CFS) (min) (In/Hr) Qmax(1) = * * 0.364) * * 0.270) + = Qmax(2) = * * 0.364) * * 0.270) + = Total of 2 streams to confluence: Flow rates before confluence point: Maximum flow rates at confluence using above data: Area of streams before confluence: Results of confluence: Total flow rate = 0.591(CFS) Time of concentration = min. Effective stream area after confluence = 0.410(Ac.) Process from Point/Station to Point/Station **** CONFLUENCE OF MINOR STREAMS **** Along Main Stream number: 1 in normal stream number 1 Stream flow area = 0.410(Ac.) Runoff from this stream = 0.591(CFS) Time of concentration = 7.35 min. Rainfall intensity = 3.082(In/Hr) Page 3
44 UCSD10YREX2.out Process from Point/Station to Point/Station **** INITIAL AREA EVALUATION **** Decimal fraction soil group A = Decimal fraction soil group B = Decimal fraction soil group C = Decimal fraction soil group D = [LOW DENSITY RESIDENTIAL ] (2.0 DU/A or Less ) Impervious value, Ai = Sub-Area C Value = Initial subarea total flow distance = (Ft.) Highest elevation = (Ft.) Lowest elevation = (Ft.) Elevation difference = 6.000(Ft.) Slope = % INITIAL AREA TIME OF CONCENTRATION CALCULATIONS: The maximum overland flow distance is (Ft) for the top area slope value of %, in a development type of 2.0 DU/A or Less In Accordance With Figure 3-3 Initial Area Time of Concentration = 3.83 minutes TC = [1.8*(1.1-C)*distance(Ft.)^.5)/(% slope^(1/3)] TC = [1.8*( )*( ^.5)/( ^(1/3)]= 3.83 Calculated TC of minutes is less than 5 minutes, resetting TC to 5.0 minutes for rainfall intensity calculations Rainfall intensity (I) = 3.952(In/Hr) for a 10.0 year storm Effective runoff coefficient used for area (Q=KCIA) is C = Subarea runoff = 0.164(CFS) Total initial stream area = 0.090(Ac.) Process from Point/Station to Point/Station **** CONFLUENCE OF MINOR STREAMS **** Along Main Stream number: 1 in normal stream number 2 Stream flow area = 0.090(Ac.) Runoff from this stream = 0.164(CFS) Time of concentration = 3.83 min. Rainfall intensity = 3.952(In/Hr) Summary of stream data: Stream Flow rate TC Rainfall Intensity No. (CFS) (min) (In/Hr) Qmax(1) = * * 0.591) * * 0.164) + = Qmax(2) = * * 0.591) * * 0.164) + = Total of 2 streams to confluence: Flow rates before confluence point: Maximum flow rates at confluence using above data: Area of streams before confluence: Results of confluence: Page 4
45 UCSD10YREX2.out Total flow rate = 0.719(CFS) Time of concentration = min. Effective stream area after confluence = End of computations, total study area = 0.500(Ac.) (Ac.) Page 5
46
47 Runoff Coefficient Calculation (Proposed Condition) Project: UCSD Voigt Parking Structure Soil Type: D C = 0.90 (% Impervious) + Cp (1 - % Impervious) Cp= 0.35 (per Table 3-1, County of San Diego Hydrology Manual, Soil Class D) Basin # Total Area (ac) Area (Acres) Imp. Area (Ai) %imp *Runoff Coef. (C ) C x A Weighted C-Factor **Equivalent Land Use (from Table 3-1) A B C Total Residential, 7.3 DU/A or Less *The composite runoff coefficient (C) is calculated for entire site by using the following equation: C = 0.90 (% Impervious) + Cp (1 - % Impervious); Cp = 0.35 per Table 3-1 of the County Hydrology Manual = Pervious Coefficient Runoff Value for the soil type D (shown in Table 3-1 as Undisturbed Natural Terrain/Permanenet Open Space, 0% Impervious) **Equivalent Land Use type is determined to be used as an input to the CivilD software for initial basin analysis only because the calculated C value cannot be entered as is.
48
49 UCSD10YRpr1.out San Diego County Rational Hydrology Program CIVILCADD/CIVILDESIGN Engineering Software,(c) Version 7.9 Rational method hydrology program based on San Diego County Flood Control Division 2003 hydrology manual Rational Hydrology Study Date: 06/30/ UCSD VOIGT PARKING STRUCTURE PROPOSED CONDITION HYDROLOGY ANALYSIS EXIT POINT ********* Hydrology Study Control Information ********** Program License Serial Number Rational hydrology study storm event year is 10.0 English (in-lb) input data Units used Map data precipitation entered: 6 hour, precipitation(inches) = hour precipitation(inches) = P6/P24 = 57.7% San Diego hydrology manual 'C' values used Process from Point/Station to Point/Station **** INITIAL AREA EVALUATION **** Decimal fraction soil group A = Decimal fraction soil group B = Decimal fraction soil group C = Decimal fraction soil group D = [MEDIUM DENSITY RESIDENTIAL ] (7.3 DU/A or Less ) Impervious value, Ai = Sub-Area C Value = Initial subarea total flow distance = (Ft.) Highest elevation = (Ft.) Lowest elevation = (Ft.) Elevation difference = 2.200(Ft.) Slope = % INITIAL AREA TIME OF CONCENTRATION CALCULATIONS: The maximum overland flow distance is (Ft) for the top area slope value of 2.00 %, in a development type of 7.3 DU/A or Less In Accordance With Figure 3-3 Initial Area Time of Concentration = 6.77 minutes TC = [1.8*(1.1-C)*distance(Ft.)^.5)/(% slope^(1/3)] TC = [1.8*( )*( ^.5)/( 2.000^(1/3)]= 6.77 The initial area total distance of (Ft.) entered leaves a remaining distance of (Ft.) Using Figure 3-4, the travel time for this distance is 0.48 minutes for a distance of (Ft.) and a slope of 2.00 % with an elevation difference of 0.60(Ft.) from the end of the top area Tt = [11.9*length(Mi)^3)/(elevation change(ft.))]^.385 *60(min/hr) Page 1
50 UCSD10YRpr1.out = Minutes Tt=[(11.9*0.0057^3)/( 0.60)]^.385= 0.48 Total initial area Ti = 6.77 minutes from Figure 3-3 formula plus 0.48 minutes from the Figure 3-4 formula = 7.26 minutes Rainfall intensity (I) = 3.108(In/Hr) for a 10.0 year storm Effective runoff coefficient used for area (Q=KCIA) is C = Subarea runoff = 0.337(CFS) Total initial stream area = 0.190(Ac.) Process from Point/Station to Point/Station **** CONFLUENCE OF MINOR STREAMS **** Along Main Stream number: 1 in normal stream number 1 Stream flow area = 0.190(Ac.) Runoff from this stream = 0.337(CFS) Time of concentration = 7.26 min. Rainfall intensity = 3.108(In/Hr) Process from Point/Station to Point/Station **** INITIAL AREA EVALUATION **** Decimal fraction soil group A = Decimal fraction soil group B = Decimal fraction soil group C = Decimal fraction soil group D = [MEDIUM DENSITY RESIDENTIAL ] (7.3 DU/A or Less ) Impervious value, Ai = Sub-Area C Value = Initial subarea total flow distance = (Ft.) Highest elevation = (Ft.) Lowest elevation = (Ft.) Elevation difference = 1.520(Ft.) Slope = % INITIAL AREA TIME OF CONCENTRATION CALCULATIONS: The maximum overland flow distance is (Ft) for the top area slope value of 2.00 %, in a development type of 7.3 DU/A or Less In Accordance With Figure 3-3 Initial Area Time of Concentration = 6.77 minutes TC = [1.8*(1.1-C)*distance(Ft.)^.5)/(% slope^(1/3)] TC = [1.8*( )*( ^.5)/( 2.000^(1/3)]= 6.77 Rainfall intensity (I) = 3.250(In/Hr) for a 10.0 year storm Effective runoff coefficient used for area (Q=KCIA) is C = Subarea runoff = 0.315(CFS) Total initial stream area = 0.170(Ac.) Process from Point/Station to Point/Station **** SUBAREA FLOW ADDITION **** Rainfall intensity (I) = 3.250(In/Hr) for a 10.0 year storm User specified 'C' value of given for subarea Time of concentration = 6.77 min. Rainfall intensity = 3.250(In/Hr) for a 10.0 year storm Effective runoff coefficient used for total area (Q=KCIA) is C = CA = Subarea runoff = 0.315(CFS) for 0.170(Ac.) Total runoff = 0.630(CFS) Total area = 0.340(Ac.) Page 2
51 UCSD10YRpr1.out Process from Point/Station to Point/Station **** SUBAREA FLOW ADDITION **** Rainfall intensity (I) = 3.250(In/Hr) for a 10.0 year storm User specified 'C' value of given for subarea Time of concentration = 6.77 min. Rainfall intensity = 3.250(In/Hr) for a 10.0 year storm Effective runoff coefficient used for total area (Q=KCIA) is C = CA = Subarea runoff = 0.074(CFS) for 0.040(Ac.) Total runoff = 0.704(CFS) Total area = 0.380(Ac.) Process from Point/Station to Point/Station **** CONFLUENCE OF MINOR STREAMS **** Along Main Stream number: 1 in normal stream number 2 Stream flow area = 0.380(Ac.) Runoff from this stream = 0.704(CFS) Time of concentration = 6.77 min. Rainfall intensity = 3.250(In/Hr) Summary of stream data: Stream Flow rate TC Rainfall Intensity No. (CFS) (min) (In/Hr) Qmax(1) = * * 0.337) * * 0.704) + = Qmax(2) = * * 0.337) * * 0.704) + = Total of 2 streams to confluence: Flow rates before confluence point: Maximum flow rates at confluence using above data: Area of streams before confluence: Results of confluence: Total flow rate = 1.018(CFS) Time of concentration = min. Effective stream area after confluence = 0.570(Ac.) Process from Point/Station to Point/Station **** SUBAREA FLOW ADDITION **** Rainfall intensity (I) = 3.250(In/Hr) for a 10.0 year storm User specified 'C' value of given for subarea Time of concentration = 6.77 min. Rainfall intensity = 3.250(In/Hr) for a 10.0 year storm Effective runoff coefficient used for total area (Q=KCIA) is C = CA = Page 3
52 UCSD10YRpr1.out Subarea runoff = 0.297(CFS) for 0.140(Ac.) Total runoff = 1.315(CFS) Total area = 0.710(Ac.) Process from Point/Station to Point/Station **** IRREGULAR CHANNEL FLOW TRAVEL TIME **** Estimated mean flow rate at midpoint of channel = 1.584(CFS) Depth of flow = 0.127(Ft.), Average velocity = 3.262(Ft/s) ******* Irregular Channel Data *********** Information entered for subchannel number 1 : Point number 'X' coordinate 'Y' coordinate Manning's 'N' friction factor = Sub-Channel flow = 1.584(CFS) ' ' flow top width = 7.633(Ft.) ' ' velocity= 3.262(Ft/s) ' ' area = 0.486(Sq.Ft) ' ' Froude number = Upstream point elevation = (Ft.) Downstream point elevation = (Ft.) Flow length = (Ft.) Travel time = 0.40 min. Time of concentration = 7.18 min. Depth of flow = 0.127(Ft.) Average velocity = 3.262(Ft/s) Total irregular channel flow = 1.584(CFS) Irregular channel normal depth above invert elev. = 0.127(Ft.) Average velocity of channel(s) = 3.262(Ft/s) Adding area flow to channel Rainfall intensity (I) = 3.130(In/Hr) for a 10.0 year storm User specified 'C' value of given for subarea Rainfall intensity = 3.130(In/Hr) for a 10.0 year storm Effective runoff coefficient used for total area (Q=KCIA) is C = CA = Subarea runoff = 0.469(CFS) for 0.290(Ac.) Total runoff = 1.784(CFS) Total area = 1.000(Ac.) Depth of flow = 0.133(Ft.), Average velocity = 3.360(Ft/s) Process from Point/Station to Point/Station **** IRREGULAR CHANNEL FLOW TRAVEL TIME **** Estimated mean flow rate at midpoint of channel = 2.008(CFS) Depth of flow = 0.161(Ft.), Average velocity = 2.582(Ft/s) ******* Irregular Channel Data *********** Information entered for subchannel number 1 : Point number 'X' coordinate 'Y' coordinate Manning's 'N' friction factor = Sub-Channel flow = 2.008(CFS) ' ' flow top width = 9.659(Ft.) Page 4
53 UCSD10YRpr1.out ' ' velocity= 2.582(Ft/s) ' ' area = 0.778(Sq.Ft) ' ' Froude number = Upstream point elevation = (Ft.) Downstream point elevation = (Ft.) Flow length = (Ft.) Travel time = 0.74 min. Time of concentration = 7.92 min. Depth of flow = 0.161(Ft.) Average velocity = 2.582(Ft/s) Total irregular channel flow = 2.008(CFS) Irregular channel normal depth above invert elev. = 0.161(Ft.) Average velocity of channel(s) = 2.582(Ft/s) Adding area flow to channel Rainfall intensity (I) = 2.938(In/Hr) for a 10.0 year storm User specified 'C' value of given for subarea Rainfall intensity = 2.938(In/Hr) for a 10.0 year storm Effective runoff coefficient used for total area (Q=KCIA) is C = CA = Subarea runoff = 0.376(CFS) for 0.290(Ac.) Total runoff = 2.160(CFS) Total area = 1.290(Ac.) Depth of flow = 0.165(Ft.), Average velocity = 2.630(Ft/s) Process from Point/Station to Point/Station **** SUBAREA FLOW ADDITION **** Rainfall intensity (I) = 2.938(In/Hr) for a 10.0 year storm User specified 'C' value of given for subarea Time of concentration = 7.92 min. Rainfall intensity = 2.938(In/Hr) for a 10.0 year storm Effective runoff coefficient used for total area (Q=KCIA) is C = CA = Subarea runoff = 0.184(CFS) for 0.110(Ac.) Total runoff = 2.344(CFS) Total area = 1.400(Ac.) Process from Point/Station to Point/Station **** SUBAREA FLOW ADDITION **** Rainfall intensity (I) = 2.938(In/Hr) for a 10.0 year storm User specified 'C' value of given for subarea Time of concentration = 7.92 min. Rainfall intensity = 2.938(In/Hr) for a 10.0 year storm Effective runoff coefficient used for total area (Q=KCIA) is C = CA = Subarea runoff = 0.184(CFS) for 0.110(Ac.) Total runoff = 2.529(CFS) Total area = 1.510(Ac.) Process from Point/Station to Point/Station **** SUBAREA FLOW ADDITION **** Rainfall intensity (I) = 2.938(In/Hr) for a 10.0 year storm User specified 'C' value of given for subarea Time of concentration = 7.92 min. Rainfall intensity = 2.938(In/Hr) for a 10.0 year storm Effective runoff coefficient used for total area (Q=KCIA) is C = CA = Page 5
54 UCSD10YRpr1.out Subarea runoff = 0.251(CFS) for 0.150(Ac.) Total runoff = 2.780(CFS) Total area = 1.660(Ac.) Process from Point/Station to Point/Station **** CONFLUENCE OF MINOR STREAMS **** Along Main Stream number: 1 in normal stream number 1 Stream flow area = 1.660(Ac.) Runoff from this stream = 2.780(CFS) Time of concentration = 7.92 min. Rainfall intensity = 2.938(In/Hr) Process from Point/Station to Point/Station **** INITIAL AREA EVALUATION **** Decimal fraction soil group A = Decimal fraction soil group B = Decimal fraction soil group C = Decimal fraction soil group D = [MEDIUM DENSITY RESIDENTIAL ] (7.3 DU/A or Less ) Impervious value, Ai = Sub-Area C Value = Initial subarea total flow distance = (Ft.) Highest elevation = (Ft.) Lowest elevation = (Ft.) Elevation difference = 2.650(Ft.) Slope = % INITIAL AREA TIME OF CONCENTRATION CALCULATIONS: The maximum overland flow distance is (Ft) for the top area slope value of 2.00 %, in a development type of 7.3 DU/A or Less In Accordance With Figure 3-3 Initial Area Time of Concentration = 6.77 minutes TC = [1.8*(1.1-C)*distance(Ft.)^.5)/(% slope^(1/3)] TC = [1.8*( )*( ^.5)/( 2.000^(1/3)]= 6.77 The initial area total distance of (Ft.) entered leaves a remaining distance of (Ft.) Using Figure 3-4, the travel time for this distance is 0.74 minutes for a distance of (Ft.) and a slope of 2.00 % with an elevation difference of 1.04(Ft.) from the end of the top area Tt = [11.9*length(Mi)^3)/(elevation change(ft.))]^.385 *60(min/hr) = Minutes Tt=[(11.9*0.0098^3)/( 1.04)]^.385= 0.74 Total initial area Ti = 6.77 minutes from Figure 3-3 formula plus 0.74 minutes from the Figure 3-4 formula = 7.51 minutes Rainfall intensity (I) = 3.040(In/Hr) for a 10.0 year storm Effective runoff coefficient used for area (Q=KCIA) is C = Subarea runoff = 0.624(CFS) Total initial stream area = 0.360(Ac.) Process from Point/Station to Point/Station **** SUBAREA FLOW ADDITION **** Rainfall intensity (I) = 3.040(In/Hr) for a 10.0 year storm User specified 'C' value of given for subarea Time of concentration = 7.51 min. Rainfall intensity = 3.040(In/Hr) for a 10.0 year storm Page 6
55 UCSD10YRpr1.out Effective runoff coefficient used for total area (Q=KCIA) is C = CA = Subarea runoff = 0.572(CFS) for 0.330(Ac.) Total runoff = 1.196(CFS) Total area = 0.690(Ac.) Process from Point/Station to Point/Station **** SUBAREA FLOW ADDITION **** Rainfall intensity (I) = 3.040(In/Hr) for a 10.0 year storm User specified 'C' value of given for subarea Time of concentration = 7.51 min. Rainfall intensity = 3.040(In/Hr) for a 10.0 year storm Effective runoff coefficient used for total area (Q=KCIA) is C = CA = Subarea runoff = 0.087(CFS) for 0.050(Ac.) Total runoff = 1.282(CFS) Total area = 0.740(Ac.) Process from Point/Station to Point/Station **** CONFLUENCE OF MINOR STREAMS **** Along Main Stream number: 1 in normal stream number 2 Stream flow area = 0.740(Ac.) Runoff from this stream = 1.282(CFS) Time of concentration = 7.51 min. Rainfall intensity = 3.040(In/Hr) Summary of stream data: Stream Flow rate TC Rainfall Intensity No. (CFS) (min) (In/Hr) Qmax(1) = * * 2.780) * * 1.282) + = Qmax(2) = * * 2.780) * * 1.282) + = Total of 2 streams to confluence: Flow rates before confluence point: Maximum flow rates at confluence using above data: Area of streams before confluence: Results of confluence: Total flow rate = 4.019(CFS) Time of concentration = min. Effective stream area after confluence = 2.400(Ac.) Process from Point/Station to Point/Station **** IRREGULAR CHANNEL FLOW TRAVEL TIME **** Estimated mean flow rate at midpoint of channel = 4.084(CFS) Depth of flow = 0.224(Ft.), Average velocity = 2.707(Ft/s) Page 7
56 UCSD10YRpr1.out ******* Irregular Channel Data *********** Information entered for subchannel number 1 : Point number 'X' coordinate 'Y' coordinate Manning's 'N' friction factor = Sub-Channel flow = 4.084(CFS) ' ' flow top width = (Ft.) ' ' velocity= 2.707(Ft/s) ' ' area = 1.509(Sq.Ft) ' ' Froude number = Upstream point elevation = (Ft.) Downstream point elevation = (Ft.) Flow length = (Ft.) Travel time = 0.70 min. Time of concentration = 8.62 min. Depth of flow = 0.224(Ft.) Average velocity = 2.707(Ft/s) Total irregular channel flow = 4.084(CFS) Irregular channel normal depth above invert elev. = 0.224(Ft.) Average velocity of channel(s) = 2.707(Ft/s) Adding area flow to channel Rainfall intensity (I) = 2.781(In/Hr) for a 10.0 year storm User specified 'C' value of given for subarea Rainfall intensity = 2.781(In/Hr) for a 10.0 year storm Effective runoff coefficient used for total area (Q=KCIA) is C = CA = Subarea runoff = 0.071(CFS) for 0.180(Ac.) Total runoff = 4.090(CFS) Total area = 2.580(Ac.) Depth of flow = 0.224(Ft.), Average velocity = 2.708(Ft/s) Process from Point/Station to Point/Station **** SUBAREA FLOW ADDITION **** Rainfall intensity (I) = 2.781(In/Hr) for a 10.0 year storm User specified 'C' value of given for subarea Time of concentration = 8.62 min. Rainfall intensity = 2.781(In/Hr) for a 10.0 year storm Effective runoff coefficient used for total area (Q=KCIA) is C = CA = Subarea runoff = 0.159(CFS) for 0.100(Ac.) Total runoff = 4.249(CFS) Total area = 2.680(Ac.) Process from Point/Station to Point/Station **** SUBAREA FLOW ADDITION **** Rainfall intensity (I) = 2.781(In/Hr) for a 10.0 year storm User specified 'C' value of given for subarea Time of concentration = 8.62 min. Rainfall intensity = 2.781(In/Hr) for a 10.0 year storm Effective runoff coefficient used for total area (Q=KCIA) is C = CA = Subarea runoff = 1.982(CFS) for 1.250(Ac.) Total runoff = 6.230(CFS) Total area = 3.930(Ac.) Page 8
57 UCSD10YRpr1.out Process from Point/Station to Point/Station **** CONFLUENCE OF MINOR STREAMS **** Along Main Stream number: 1 in normal stream number 1 Stream flow area = 3.930(Ac.) Runoff from this stream = 6.230(CFS) Time of concentration = 8.62 min. Rainfall intensity = 2.781(In/Hr) Process from Point/Station to Point/Station **** INITIAL AREA EVALUATION **** Decimal fraction soil group A = Decimal fraction soil group B = Decimal fraction soil group C = Decimal fraction soil group D = [MEDIUM DENSITY RESIDENTIAL ] (7.3 DU/A or Less ) Impervious value, Ai = Sub-Area C Value = Initial subarea total flow distance = (Ft.) Highest elevation = (Ft.) Lowest elevation = (Ft.) Elevation difference = 6.200(Ft.) Slope = % Top of Initial Area Slope adjusted by User to % INITIAL AREA TIME OF CONCENTRATION CALCULATIONS: The maximum overland flow distance is (Ft) for the top area slope value of 6.00 %, in a development type of 7.3 DU/A or Less In Accordance With Figure 3-3 Initial Area Time of Concentration = 5.25 minutes TC = [1.8*(1.1-C)*distance(Ft.)^.5)/(% slope^(1/3)] TC = [1.8*( )*( ^.5)/( 6.000^(1/3)]= 5.25 Rainfall intensity (I) = 3.830(In/Hr) for a 10.0 year storm Effective runoff coefficient used for area (Q=KCIA) is C = Subarea runoff = 0.196(CFS) Total initial stream area = 0.090(Ac.) Process from Point/Station to Point/Station **** IRREGULAR CHANNEL FLOW TRAVEL TIME **** Estimated mean flow rate at midpoint of channel = 0.393(CFS) Depth of flow = 0.160(Ft.), Average velocity = 3.086(Ft/s) ******* Irregular Channel Data *********** Information entered for subchannel number 1 : Point number 'X' coordinate 'Y' coordinate Manning's 'N' friction factor = Sub-Channel flow = 0.393(CFS) ' ' flow top width = 1.596(Ft.) ' ' velocity= 3.086(Ft/s) ' ' area = 0.127(Sq.Ft) ' ' Froude number = Page 9
58 UCSD10YRpr1.out Upstream point elevation = (Ft.) Downstream point elevation = (Ft.) Flow length = (Ft.) Travel time = 1.04 min. Time of concentration = 6.29 min. Depth of flow = 0.160(Ft.) Average velocity = 3.086(Ft/s) Total irregular channel flow = 0.393(CFS) Irregular channel normal depth above invert elev. = 0.160(Ft.) Average velocity of channel(s) = 3.086(Ft/s) Adding area flow to channel Rainfall intensity (I) = 3.409(In/Hr) for a 10.0 year storm User specified 'C' value of given for subarea Rainfall intensity = 3.409(In/Hr) for a 10.0 year storm Effective runoff coefficient used for total area (Q=KCIA) is C = CA = Subarea runoff = 0.328(CFS) for 0.180(Ac.) Total runoff = 0.525(CFS) Total area = 0.270(Ac.) Depth of flow = 0.178(Ft.), Average velocity = 3.318(Ft/s) Process from Point/Station to Point/Station **** PIPEFLOW TRAVEL TIME (Program estimated size) **** Upstream point/station elevation = (Ft.) Downstream point/station elevation = (Ft.) Pipe length = 89.50(Ft.) Slope = Manning's N = No. of pipes = 1 Required pipe flow = 0.525(CFS) Nearest computed pipe diameter = 6.00(In.) Calculated individual pipe flow = 0.525(CFS) Normal flow depth in pipe = 2.72(In.) Flow top width inside pipe = 5.97(In.) Critical Depth = 4.43(In.) Pipe flow velocity = 6.07(Ft/s) Travel time through pipe = 0.25 min. Time of concentration (TC) = 6.53 min. Process from Point/Station to Point/Station **** SUBAREA FLOW ADDITION **** Rainfall intensity (I) = 3.326(In/Hr) for a 10.0 year storm User specified 'C' value of given for subarea Time of concentration = 6.53 min. Rainfall intensity = 3.326(In/Hr) for a 10.0 year storm Effective runoff coefficient used for total area (Q=KCIA) is C = CA = Subarea runoff = 1.068(CFS) for 0.570(Ac.) Total runoff = 1.593(CFS) Total area = 0.840(Ac.) Process from Point/Station to Point/Station **** SUBAREA FLOW ADDITION **** Rainfall intensity (I) = 3.326(In/Hr) for a 10.0 year storm User specified 'C' value of given for subarea Time of concentration = 6.53 min. Rainfall intensity = 3.326(In/Hr) for a 10.0 year storm Effective runoff coefficient used for total area Page 10
59 UCSD10YRpr1.out (Q=KCIA) is C = CA = Subarea runoff = 1.422(CFS) for 0.750(Ac.) Total runoff = 3.014(CFS) Total area = 1.590(Ac.) Process from Point/Station to Point/Station **** PIPEFLOW TRAVEL TIME (Program estimated size) **** Upstream point/station elevation = (Ft.) Downstream point/station elevation = (Ft.) Pipe length = 39.00(Ft.) Slope = Manning's N = No. of pipes = 1 Required pipe flow = 3.014(CFS) Nearest computed pipe diameter = 9.00(In.) Calculated individual pipe flow = 3.014(CFS) Normal flow depth in pipe = 5.30(In.) Flow top width inside pipe = 8.86(In.) Critical depth could not be calculated. Pipe flow velocity = 11.12(Ft/s) Travel time through pipe = 0.06 min. Time of concentration (TC) = 6.59 min. Process from Point/Station to Point/Station **** SUBAREA FLOW ADDITION **** Rainfall intensity (I) = 3.307(In/Hr) for a 10.0 year storm User specified 'C' value of given for subarea Time of concentration = 6.59 min. Rainfall intensity = 3.307(In/Hr) for a 10.0 year storm Effective runoff coefficient used for total area (Q=KCIA) is C = CA = Subarea runoff = 0.209(CFS) for 0.120(Ac.) Total runoff = 3.223(CFS) Total area = 1.710(Ac.) Process from Point/Station to Point/Station **** SUBAREA FLOW ADDITION **** Rainfall intensity (I) = 3.307(In/Hr) for a 10.0 year storm User specified 'C' value of given for subarea Time of concentration = 6.59 min. Rainfall intensity = 3.307(In/Hr) for a 10.0 year storm Effective runoff coefficient used for total area (Q=KCIA) is C = CA = Subarea runoff = 0.415(CFS) for 0.220(Ac.) Total runoff = 3.638(CFS) Total area = 1.930(Ac.) Process from Point/Station to Point/Station **** PIPEFLOW TRAVEL TIME (Program estimated size) **** Upstream point/station elevation = (Ft.) Downstream point/station elevation = (Ft.) Pipe length = 86.00(Ft.) Slope = Manning's N = No. of pipes = 1 Required pipe flow = 3.638(CFS) Nearest computed pipe diameter = 12.00(In.) Calculated individual pipe flow = 3.638(CFS) Normal flow depth in pipe = Flow top width inside pipe = 7.82(In.) 11.44(In.) Page 11
60 UCSD10YRpr1.out Critical Depth = 9.76(In.) Pipe flow velocity = 6.72(Ft/s) Travel time through pipe = 0.21 min. Time of concentration (TC) = 6.80 min. Process from Point/Station to Point/Station **** PIPEFLOW TRAVEL TIME (Program estimated size) **** Upstream point/station elevation = (Ft.) Downstream point/station elevation = (Ft.) Pipe length = (Ft.) Slope = Manning's N = No. of pipes = 1 Required pipe flow = 3.638(CFS) Nearest computed pipe diameter = 12.00(In.) Calculated individual pipe flow = 3.638(CFS) Normal flow depth in pipe = 7.17(In.) Flow top width inside pipe = 11.77(In.) Critical Depth = 9.76(In.) Pipe flow velocity = 7.42(Ft/s) Travel time through pipe = 0.37 min. Time of concentration (TC) = 7.18 min. Process from Point/Station to Point/Station **** SUBAREA FLOW ADDITION **** Rainfall intensity (I) = 3.130(In/Hr) for a 10.0 year storm User specified 'C' value of given for subarea Time of concentration = 7.18 min. Rainfall intensity = 3.130(In/Hr) for a 10.0 year storm Effective runoff coefficient used for total area (Q=KCIA) is C = CA = Subarea runoff = 0.090(CFS) for 0.160(Ac.) Total runoff = 3.728(CFS) Total area = 2.090(Ac.) Process from Point/Station to Point/Station **** PIPEFLOW TRAVEL TIME (Program estimated size) **** Upstream point/station elevation = (Ft.) Downstream point/station elevation = (Ft.) Pipe length = 52.00(Ft.) Slope = Manning's N = No. of pipes = 1 Required pipe flow = 3.728(CFS) Nearest computed pipe diameter = 6.00(In.) Calculated individual pipe flow = 3.728(CFS) Normal flow depth in pipe = 4.64(In.) Flow top width inside pipe = 5.02(In.) Critical depth could not be calculated. Pipe flow velocity = 22.90(Ft/s) Travel time through pipe = 0.04 min. Time of concentration (TC) = 7.22 min. Process from Point/Station to Point/Station **** PIPEFLOW TRAVEL TIME (Program estimated size) **** Upstream point/station elevation = (Ft.) Downstream point/station elevation = (Ft.) Pipe length = 67.00(Ft.) Slope = Manning's N = Page 12
61 UCSD10YRpr1.out No. of pipes = 1 Required pipe flow = 3.728(CFS) Nearest computed pipe diameter = 12.00(In.) Calculated individual pipe flow = 3.728(CFS) Normal flow depth in pipe = 7.31(In.) Flow top width inside pipe = 11.71(In.) Critical Depth = 9.87(In.) Pipe flow velocity = 7.44(Ft/s) Travel time through pipe = 0.15 min. Time of concentration (TC) = 7.37 min. Process from Point/Station to Point/Station **** SUBAREA FLOW ADDITION **** Rainfall intensity (I) = 3.078(In/Hr) for a 10.0 year storm User specified 'C' value of given for subarea Time of concentration = 7.37 min. Rainfall intensity = 3.078(In/Hr) for a 10.0 year storm Effective runoff coefficient used for total area (Q=KCIA) is C = CA = Subarea runoff = 0.079(CFS) for 0.080(Ac.) Total runoff = 3.807(CFS) Total area = 2.170(Ac.) Process from Point/Station to Point/Station **** PIPEFLOW TRAVEL TIME (Program estimated size) **** Upstream point/station elevation = (Ft.) Downstream point/station elevation = (Ft.) Pipe length = (Ft.) Slope = Manning's N = No. of pipes = 1 Required pipe flow = 3.807(CFS) Nearest computed pipe diameter = 9.00(In.) Calculated individual pipe flow = 3.807(CFS) Normal flow depth in pipe = 5.65(In.) Flow top width inside pipe = 8.70(In.) Critical depth could not be calculated. Pipe flow velocity = 13.03(Ft/s) Travel time through pipe = 0.37 min. Time of concentration (TC) = 7.74 min. Process from Point/Station to Point/Station **** CONFLUENCE OF MINOR STREAMS **** Along Main Stream number: 1 in normal stream number 2 Stream flow area = 2.170(Ac.) Runoff from this stream = 3.807(CFS) Time of concentration = 7.74 min. Rainfall intensity = 2.982(In/Hr) Summary of stream data: Stream Flow rate TC Rainfall Intensity No. (CFS) (min) (In/Hr) Qmax(1) = * * 6.230) * * 3.807) + = Page 13
62 Qmax(2) = UCSD10YRpr1.out * * 6.230) * * 3.807) + = Total of 2 streams to confluence: Flow rates before confluence point: Maximum flow rates at confluence using above data: Area of streams before confluence: Results of confluence: Total flow rate = 9.781(CFS) Time of concentration = min. Effective stream area after confluence = 6.100(Ac.) End of computations, total study area = (Ac.) Page 14
63 UCSD10YRPr2.out San Diego County Rational Hydrology Program CIVILCADD/CIVILDESIGN Engineering Software,(c) Version 7.9 Rational method hydrology program based on San Diego County Flood Control Division 2003 hydrology manual Rational Hydrology Study Date: 07/03/ UCSD VOIGT PARKING STRUCTURE PROPOSED CONDITION HYDROLOGY ANALYSIS RUNOFF EXIT POINT ********* Hydrology Study Control Information ********** Program License Serial Number Rational hydrology study storm event year is 10.0 English (in-lb) input data Units used Map data precipitation entered: 6 hour, precipitation(inches) = hour precipitation(inches) = P6/P24 = 57.7% San Diego hydrology manual 'C' values used Process from Point/Station to Point/Station **** INITIAL AREA EVALUATION **** Decimal fraction soil group A = Decimal fraction soil group B = Decimal fraction soil group C = Decimal fraction soil group D = [MEDIUM DENSITY RESIDENTIAL ] (7.3 DU/A or Less ) Impervious value, Ai = Sub-Area C Value = Initial subarea total flow distance = (Ft.) Highest elevation = (Ft.) Lowest elevation = (Ft.) Elevation difference = 8.000(Ft.) Slope = % Top of Initial Area Slope adjusted by User to % Bottom of Initial Area Slope adjusted by User to % INITIAL AREA TIME OF CONCENTRATION CALCULATIONS: The maximum overland flow distance is (Ft) for the top area slope value of 5.00 %, in a development type of 7.3 DU/A or Less In Accordance With Figure 3-3 Initial Area Time of Concentration = 5.58 minutes TC = [1.8*(1.1-C)*distance(Ft.)^.5)/(% slope^(1/3)] TC = [1.8*( )*( ^.5)/( 5.000^(1/3)]= 5.58 The initial area total distance of (Ft.) entered leaves a remaining distance of (Ft.) Using Figure 3-4, the travel time for this distance is 0.62 minutes for a distance of (Ft.) and a slope of 5.00 % Page 1
64 UCSD10YRPr2.out with an elevation difference of 3.25(Ft.) from the end of the top area Tt = [11.9*length(Mi)^3)/(elevation change(ft.))]^.385 *60(min/hr) = Minutes Tt=[(11.9*0.0123^3)/( 3.25)]^.385= 0.62 Total initial area Ti = 5.58 minutes from Figure 3-3 formula plus 0.62 minutes from the Figure 3-4 formula = 6.19 minutes Rainfall intensity (I) = 3.442(In/Hr) for a 10.0 year storm Effective runoff coefficient used for area (Q=KCIA) is C = Subarea runoff = 0.334(CFS) Total initial stream area = 0.170(Ac.) Process from Point/Station to Point/Station **** SUBAREA FLOW ADDITION **** Rainfall intensity (I) = 3.442(In/Hr) for a 10.0 year storm User specified 'C' value of given for subarea Time of concentration = 6.19 min. Rainfall intensity = 3.442(In/Hr) for a 10.0 year storm Effective runoff coefficient used for total area (Q=KCIA) is C = CA = Subarea runoff = 0.157(CFS) for 0.080(Ac.) Total runoff = 0.490(CFS) Total area = 0.250(Ac.) Process from Point/Station to Point/Station **** CONFLUENCE OF MINOR STREAMS **** Along Main Stream number: 1 in normal stream number 1 Stream flow area = 0.250(Ac.) Runoff from this stream = 0.490(CFS) Time of concentration = 6.19 min. Rainfall intensity = 3.442(In/Hr) Process from Point/Station to Point/Station **** INITIAL AREA EVALUATION **** Decimal fraction soil group A = Decimal fraction soil group B = Decimal fraction soil group C = Decimal fraction soil group D = [LOW DENSITY RESIDENTIAL ] (2.0 DU/A or Less ) Impervious value, Ai = Sub-Area C Value = Initial subarea total flow distance = (Ft.) Highest elevation = (Ft.) Lowest elevation = (Ft.) Elevation difference = (Ft.) Slope = % Top of Initial Area Slope adjusted by User to % Bottom of Initial Area Slope adjusted by User to % INITIAL AREA TIME OF CONCENTRATION CALCULATIONS: The maximum overland flow distance is (Ft) for the top area slope value of %, in a development type of 2.0 DU/A or Less In Accordance With Figure 3-3 Initial Area Time of Concentration = 5.35 minutes TC = [1.8*(1.1-C)*distance(Ft.)^.5)/(% slope^(1/3)] TC = [1.8*( )*( ^.5)/( ^(1/3)]= 5.35 Page 2
65 UCSD10YRPr2.out The initial area total distance of (Ft.) entered leaves a remaining distance of (Ft.) Using Figure 3-4, the travel time for this distance is 0.48 minutes for a distance of (Ft.) and a slope of % with an elevation difference of 6.70(Ft.) from the end of the top area Tt = [11.9*length(Mi)^3)/(elevation change(ft.))]^.385 *60(min/hr) = Minutes Tt=[(11.9*0.0127^3)/( 6.70)]^.385= 0.48 Total initial area Ti = 5.35 minutes from Figure 3-3 formula plus 0.48 minutes from the Figure 3-4 formula = 5.83 minutes Rainfall intensity (I) = 3.579(In/Hr) for a 10.0 year storm Effective runoff coefficient used for area (Q=KCIA) is C = Subarea runoff = 0.231(CFS) Total initial stream area = 0.140(Ac.) Process from Point/Station to Point/Station **** CONFLUENCE OF MINOR STREAMS **** Along Main Stream number: 1 in normal stream number 2 Stream flow area = 0.140(Ac.) Runoff from this stream = 0.231(CFS) Time of concentration = 5.83 min. Rainfall intensity = 3.579(In/Hr) Summary of stream data: Stream Flow rate TC Rainfall Intensity No. (CFS) (min) (In/Hr) Qmax(1) = * * 0.490) * * 0.231) + = Qmax(2) = * * 0.490) * * 0.231) + = Total of 2 streams to confluence: Flow rates before confluence point: Maximum flow rates at confluence using above data: Area of streams before confluence: Results of confluence: Total flow rate = 0.712(CFS) Time of concentration = min. Effective stream area after confluence = 0.390(Ac.) Process from Point/Station to Point/Station **** CONFLUENCE OF MINOR STREAMS **** Along Main Stream number: 1 in normal stream number 1 Stream flow area = 0.390(Ac.) Runoff from this stream = 0.712(CFS) Time of concentration = 6.19 min. Rainfall intensity = 3.442(In/Hr) Page 3
66 UCSD10YRPr2.out Process from Point/Station to Point/Station **** INITIAL AREA EVALUATION **** Decimal fraction soil group A = Decimal fraction soil group B = Decimal fraction soil group C = Decimal fraction soil group D = [LOW DENSITY RESIDENTIAL ] (2.0 DU/A or Less ) Impervious value, Ai = Sub-Area C Value = Initial subarea total flow distance = (Ft.) Highest elevation = (Ft.) Lowest elevation = (Ft.) Elevation difference = (Ft.) Slope = % Top of Initial Area Slope adjusted by User to % Bottom of Initial Area Slope adjusted by User to % INITIAL AREA TIME OF CONCENTRATION CALCULATIONS: The maximum overland flow distance is (Ft) for the top area slope value of 6.00 %, in a development type of 2.0 DU/A or Less In Accordance With Figure 3-3 Initial Area Time of Concentration = 6.34 minutes TC = [1.8*(1.1-C)*distance(Ft.)^.5)/(% slope^(1/3)] TC = [1.8*( )*( ^.5)/( 6.000^(1/3)]= 6.34 The initial area total distance of (Ft.) entered leaves a remaining distance of (Ft.) Using Figure 3-4, the travel time for this distance is 1.19 minutes for a distance of (Ft.) and a slope of 6.00 % with an elevation difference of 10.08(Ft.) from the end of the top area Tt = [11.9*length(Mi)^3)/(elevation change(ft.))]^.385 *60(min/hr) = Minutes Tt=[(11.9*0.0318^3)/( 10.08)]^.385= 1.19 Total initial area Ti = 6.34 minutes from Figure 3-3 formula plus 1.19 minutes from the Figure 3-4 formula = 7.53 minutes Rainfall intensity (I) = 3.034(In/Hr) for a 10.0 year storm Effective runoff coefficient used for area (Q=KCIA) is C = Subarea runoff = 0.349(CFS) Total initial stream area = 0.250(Ac.) Process from Point/Station to Point/Station **** CONFLUENCE OF MINOR STREAMS **** Along Main Stream number: 1 in normal stream number 2 Stream flow area = 0.250(Ac.) Runoff from this stream = 0.349(CFS) Time of concentration = 7.53 min. Rainfall intensity = 3.034(In/Hr) Summary of stream data: Stream Flow rate TC Rainfall Intensity No. (CFS) (min) (In/Hr) Qmax(1) = * * 0.712) * * 0.349) + = Page 4
67 Qmax(2) = UCSD10YRPr2.out * * 0.712) * * 0.349) + = Total of 2 streams to confluence: Flow rates before confluence point: Maximum flow rates at confluence using above data: Area of streams before confluence: Results of confluence: Total flow rate = 0.999(CFS) Time of concentration = min. Effective stream area after confluence = 0.640(Ac.) End of computations, total study area = (Ac.) Page 5
68
69 UCSD100YRpr1.out San Diego County Rational Hydrology Program CIVILCADD/CIVILDESIGN Engineering Software,(c) Version 7.9 Rational method hydrology program based on San Diego County Flood Control Division 2003 hydrology manual Rational Hydrology Study Date: 07/03/ UCSD VOIGT PARKING STRUCTURE PROPOSED CONDITION HYDROLOGY ANALYSIS RUNOFF EXIT POINT ********* Hydrology Study Control Information ********** Program License Serial Number Rational hydrology study storm event year is English (in-lb) input data Units used Map data precipitation entered: 6 hour, precipitation(inches) = hour precipitation(inches) = P6/P24 = 59.0% San Diego hydrology manual 'C' values used Process from Point/Station to Point/Station **** INITIAL AREA EVALUATION **** Decimal fraction soil group A = Decimal fraction soil group B = Decimal fraction soil group C = Decimal fraction soil group D = [MEDIUM DENSITY RESIDENTIAL ] (7.3 DU/A or Less ) Impervious value, Ai = Sub-Area C Value = Initial subarea total flow distance = (Ft.) Highest elevation = (Ft.) Lowest elevation = (Ft.) Elevation difference = 2.200(Ft.) Slope = % INITIAL AREA TIME OF CONCENTRATION CALCULATIONS: The maximum overland flow distance is (Ft) for the top area slope value of 2.00 %, in a development type of 7.3 DU/A or Less In Accordance With Figure 3-3 Initial Area Time of Concentration = 6.77 minutes TC = [1.8*(1.1-C)*distance(Ft.)^.5)/(% slope^(1/3)] TC = [1.8*( )*( ^.5)/( 2.000^(1/3)]= 6.77 The initial area total distance of (Ft.) entered leaves a remaining distance of (Ft.) Using Figure 3-4, the travel time for this distance is 0.48 minutes for a distance of (Ft.) and a slope of 2.00 % with an elevation difference of 0.60(Ft.) from the end of the top area Tt = [11.9*length(Mi)^3)/(elevation change(ft.))]^.385 *60(min/hr) Page 1
70 UCSD100YRpr1.out = Minutes Tt=[(11.9*0.0057^3)/( 0.60)]^.385= 0.48 Total initial area Ti = 6.77 minutes from Figure 3-3 formula plus 0.48 minutes from the Figure 3-4 formula = 7.26 minutes Rainfall intensity (I) = 4.766(In/Hr) for a year storm Effective runoff coefficient used for area (Q=KCIA) is C = Subarea runoff = 0.516(CFS) Total initial stream area = 0.190(Ac.) Process from Point/Station to Point/Station **** CONFLUENCE OF MINOR STREAMS **** Along Main Stream number: 1 in normal stream number 1 Stream flow area = 0.190(Ac.) Runoff from this stream = 0.516(CFS) Time of concentration = 7.26 min. Rainfall intensity = 4.766(In/Hr) Process from Point/Station to Point/Station **** INITIAL AREA EVALUATION **** Decimal fraction soil group A = Decimal fraction soil group B = Decimal fraction soil group C = Decimal fraction soil group D = [MEDIUM DENSITY RESIDENTIAL ] (7.3 DU/A or Less ) Impervious value, Ai = Sub-Area C Value = Initial subarea total flow distance = (Ft.) Highest elevation = (Ft.) Lowest elevation = (Ft.) Elevation difference = 1.520(Ft.) Slope = % INITIAL AREA TIME OF CONCENTRATION CALCULATIONS: The maximum overland flow distance is (Ft) for the top area slope value of 2.00 %, in a development type of 7.3 DU/A or Less In Accordance With Figure 3-3 Initial Area Time of Concentration = 6.77 minutes TC = [1.8*(1.1-C)*distance(Ft.)^.5)/(% slope^(1/3)] TC = [1.8*( )*( ^.5)/( 2.000^(1/3)]= 6.77 Rainfall intensity (I) = 4.983(In/Hr) for a year storm Effective runoff coefficient used for area (Q=KCIA) is C = Subarea runoff = 0.483(CFS) Total initial stream area = 0.170(Ac.) Process from Point/Station to Point/Station **** SUBAREA FLOW ADDITION **** Rainfall intensity (I) = 4.983(In/Hr) for a year storm User specified 'C' value of given for subarea Time of concentration = 6.77 min. Rainfall intensity = 4.983(In/Hr) for a year storm Effective runoff coefficient used for total area (Q=KCIA) is C = CA = Subarea runoff = 0.483(CFS) for 0.170(Ac.) Total runoff = 0.966(CFS) Total area = 0.340(Ac.) Page 2
71 UCSD100YRpr1.out Process from Point/Station to Point/Station **** SUBAREA FLOW ADDITION **** Rainfall intensity (I) = 4.983(In/Hr) for a year storm User specified 'C' value of given for subarea Time of concentration = 6.77 min. Rainfall intensity = 4.983(In/Hr) for a year storm Effective runoff coefficient used for total area (Q=KCIA) is C = CA = Subarea runoff = 0.114(CFS) for 0.040(Ac.) Total runoff = 1.079(CFS) Total area = 0.380(Ac.) Process from Point/Station to Point/Station **** CONFLUENCE OF MINOR STREAMS **** Along Main Stream number: 1 in normal stream number 2 Stream flow area = 0.380(Ac.) Runoff from this stream = 1.079(CFS) Time of concentration = 6.77 min. Rainfall intensity = 4.983(In/Hr) Summary of stream data: Stream Flow rate TC Rainfall Intensity No. (CFS) (min) (In/Hr) Qmax(1) = * * 0.516) * * 1.079) + = Qmax(2) = * * 0.516) * * 1.079) + = Total of 2 streams to confluence: Flow rates before confluence point: Maximum flow rates at confluence using above data: Area of streams before confluence: Results of confluence: Total flow rate = 1.561(CFS) Time of concentration = min. Effective stream area after confluence = 0.570(Ac.) Process from Point/Station to Point/Station **** SUBAREA FLOW ADDITION **** Rainfall intensity (I) = 4.983(In/Hr) for a year storm User specified 'C' value of given for subarea Time of concentration = 6.77 min. Rainfall intensity = 4.983(In/Hr) for a year storm Effective runoff coefficient used for total area (Q=KCIA) is C = CA = Page 3
72 UCSD100YRpr1.out Subarea runoff = 0.455(CFS) for 0.140(Ac.) Total runoff = 2.017(CFS) Total area = 0.710(Ac.) Process from Point/Station to Point/Station **** IRREGULAR CHANNEL FLOW TRAVEL TIME **** Estimated mean flow rate at midpoint of channel = 2.428(CFS) Depth of flow = 0.149(Ft.), Average velocity = 3.630(Ft/s) ******* Irregular Channel Data *********** Information entered for subchannel number 1 : Point number 'X' coordinate 'Y' coordinate Manning's 'N' friction factor = Sub-Channel flow = 2.428(CFS) ' ' flow top width = 8.960(Ft.) ' ' velocity= 3.630(Ft/s) ' ' area = 0.669(Sq.Ft) ' ' Froude number = Upstream point elevation = (Ft.) Downstream point elevation = (Ft.) Flow length = (Ft.) Travel time = 0.36 min. Time of concentration = 7.14 min. Depth of flow = 0.149(Ft.) Average velocity = 3.630(Ft/s) Total irregular channel flow = 2.428(CFS) Irregular channel normal depth above invert elev. = 0.149(Ft.) Average velocity of channel(s) = 3.630(Ft/s) Adding area flow to channel Rainfall intensity (I) = 4.818(In/Hr) for a year storm User specified 'C' value of given for subarea Rainfall intensity = 4.818(In/Hr) for a year storm Effective runoff coefficient used for total area (Q=KCIA) is C = CA = Subarea runoff = 0.730(CFS) for 0.290(Ac.) Total runoff = 2.746(CFS) Total area = 1.000(Ac.) Depth of flow = 0.156(Ft.), Average velocity = 3.743(Ft/s) Process from Point/Station to Point/Station **** IRREGULAR CHANNEL FLOW TRAVEL TIME **** Estimated mean flow rate at midpoint of channel = 3.095(CFS) Depth of flow = 0.189(Ft.), Average velocity = 2.877(Ft/s) ******* Irregular Channel Data *********** Information entered for subchannel number 1 : Point number 'X' coordinate 'Y' coordinate Manning's 'N' friction factor = Sub-Channel flow = 3.095(CFS) ' ' flow top width = (Ft.) Page 4
73 UCSD100YRpr1.out ' ' velocity= 2.877(Ft/s) ' ' area = 1.076(Sq.Ft) ' ' Froude number = Upstream point elevation = (Ft.) Downstream point elevation = (Ft.) Flow length = (Ft.) Travel time = 0.67 min. Time of concentration = 7.80 min. Depth of flow = 0.189(Ft.) Average velocity = 2.877(Ft/s) Total irregular channel flow = 3.095(CFS) Irregular channel normal depth above invert elev. = 0.189(Ft.) Average velocity of channel(s) = 2.877(Ft/s) Adding area flow to channel Rainfall intensity (I) = 4.548(In/Hr) for a year storm User specified 'C' value of given for subarea Rainfall intensity = 4.548(In/Hr) for a year storm Effective runoff coefficient used for total area (Q=KCIA) is C = CA = Subarea runoff = 0.598(CFS) for 0.290(Ac.) Total runoff = 3.344(CFS) Total area = 1.290(Ac.) Depth of flow = 0.195(Ft.), Average velocity = 2.934(Ft/s) Process from Point/Station to Point/Station **** SUBAREA FLOW ADDITION **** Rainfall intensity (I) = 4.548(In/Hr) for a year storm User specified 'C' value of given for subarea Time of concentration = 7.80 min. Rainfall intensity = 4.548(In/Hr) for a year storm Effective runoff coefficient used for total area (Q=KCIA) is C = CA = Subarea runoff = 0.285(CFS) for 0.110(Ac.) Total runoff = 3.630(CFS) Total area = 1.400(Ac.) Process from Point/Station to Point/Station **** SUBAREA FLOW ADDITION **** Rainfall intensity (I) = 4.548(In/Hr) for a year storm User specified 'C' value of given for subarea Time of concentration = 7.80 min. Rainfall intensity = 4.548(In/Hr) for a year storm Effective runoff coefficient used for total area (Q=KCIA) is C = CA = Subarea runoff = 0.285(CFS) for 0.110(Ac.) Total runoff = 3.915(CFS) Total area = 1.510(Ac.) Process from Point/Station to Point/Station **** SUBAREA FLOW ADDITION **** Rainfall intensity (I) = 4.548(In/Hr) for a year storm User specified 'C' value of given for subarea Time of concentration = 7.80 min. Rainfall intensity = 4.548(In/Hr) for a year storm Effective runoff coefficient used for total area (Q=KCIA) is C = CA = Page 5
74 UCSD100YRpr1.out Subarea runoff = 0.389(CFS) for 0.150(Ac.) Total runoff = 4.304(CFS) Total area = 1.660(Ac.) Process from Point/Station to Point/Station **** CONFLUENCE OF MINOR STREAMS **** Along Main Stream number: 1 in normal stream number 1 Stream flow area = 1.660(Ac.) Runoff from this stream = 4.304(CFS) Time of concentration = 7.80 min. Rainfall intensity = 4.548(In/Hr) Process from Point/Station to Point/Station **** INITIAL AREA EVALUATION **** Decimal fraction soil group A = Decimal fraction soil group B = Decimal fraction soil group C = Decimal fraction soil group D = [MEDIUM DENSITY RESIDENTIAL ] (7.3 DU/A or Less ) Impervious value, Ai = Sub-Area C Value = Initial subarea total flow distance = (Ft.) Highest elevation = (Ft.) Lowest elevation = (Ft.) Elevation difference = 2.650(Ft.) Slope = % INITIAL AREA TIME OF CONCENTRATION CALCULATIONS: The maximum overland flow distance is (Ft) for the top area slope value of 2.00 %, in a development type of 7.3 DU/A or Less In Accordance With Figure 3-3 Initial Area Time of Concentration = 6.77 minutes TC = [1.8*(1.1-C)*distance(Ft.)^.5)/(% slope^(1/3)] TC = [1.8*( )*( ^.5)/( 2.000^(1/3)]= 6.77 The initial area total distance of (Ft.) entered leaves a remaining distance of (Ft.) Using Figure 3-4, the travel time for this distance is 0.74 minutes for a distance of (Ft.) and a slope of 2.00 % with an elevation difference of 1.04(Ft.) from the end of the top area Tt = [11.9*length(Mi)^3)/(elevation change(ft.))]^.385 *60(min/hr) = Minutes Tt=[(11.9*0.0098^3)/( 1.04)]^.385= 0.74 Total initial area Ti = 6.77 minutes from Figure 3-3 formula plus 0.74 minutes from the Figure 3-4 formula = 7.51 minutes Rainfall intensity (I) = 4.661(In/Hr) for a year storm Effective runoff coefficient used for area (Q=KCIA) is C = Subarea runoff = 0.956(CFS) Total initial stream area = 0.360(Ac.) Process from Point/Station to Point/Station **** SUBAREA FLOW ADDITION **** Rainfall intensity (I) = 4.661(In/Hr) for a year storm User specified 'C' value of given for subarea Time of concentration = 7.51 min. Rainfall intensity = 4.661(In/Hr) for a year storm Page 6
75 UCSD100YRpr1.out Effective runoff coefficient used for total area (Q=KCIA) is C = CA = Subarea runoff = 0.877(CFS) for 0.330(Ac.) Total runoff = 1.833(CFS) Total area = 0.690(Ac.) Process from Point/Station to Point/Station **** SUBAREA FLOW ADDITION **** Rainfall intensity (I) = 4.661(In/Hr) for a year storm User specified 'C' value of given for subarea Time of concentration = 7.51 min. Rainfall intensity = 4.661(In/Hr) for a year storm Effective runoff coefficient used for total area (Q=KCIA) is C = CA = Subarea runoff = 0.133(CFS) for 0.050(Ac.) Total runoff = 1.966(CFS) Total area = 0.740(Ac.) Process from Point/Station to Point/Station **** CONFLUENCE OF MINOR STREAMS **** Along Main Stream number: 1 in normal stream number 2 Stream flow area = 0.740(Ac.) Runoff from this stream = 1.966(CFS) Time of concentration = 7.51 min. Rainfall intensity = 4.661(In/Hr) Summary of stream data: Stream Flow rate TC Rainfall Intensity No. (CFS) (min) (In/Hr) Qmax(1) = * * 4.304) * * 1.966) + = Qmax(2) = * * 4.304) * * 1.966) + = Total of 2 streams to confluence: Flow rates before confluence point: Maximum flow rates at confluence using above data: Area of streams before confluence: Results of confluence: Total flow rate = 6.222(CFS) Time of concentration = min. Effective stream area after confluence = 2.400(Ac.) Process from Point/Station to Point/Station **** IRREGULAR CHANNEL FLOW TRAVEL TIME **** Estimated mean flow rate at midpoint of channel = 6.333(CFS) Depth of flow = 0.264(Ft.), Average velocity = 3.020(Ft/s) Page 7
76 UCSD100YRpr1.out ******* Irregular Channel Data *********** Information entered for subchannel number 1 : Point number 'X' coordinate 'Y' coordinate Manning's 'N' friction factor = Sub-Channel flow = 6.333(CFS) ' ' flow top width = (Ft.) ' ' velocity= 3.021(Ft/s) ' ' area = 2.097(Sq.Ft) ' ' Froude number = Upstream point elevation = (Ft.) Downstream point elevation = (Ft.) Flow length = (Ft.) Travel time = 0.63 min. Time of concentration = 8.43 min. Depth of flow = 0.264(Ft.) Average velocity = 3.020(Ft/s) Total irregular channel flow = 6.333(CFS) Irregular channel normal depth above invert elev. = 0.264(Ft.) Average velocity of channel(s) = 3.020(Ft/s) Adding area flow to channel Rainfall intensity (I) = 4.326(In/Hr) for a year storm User specified 'C' value of given for subarea Rainfall intensity = 4.326(In/Hr) for a year storm Effective runoff coefficient used for total area (Q=KCIA) is C = CA = Subarea runoff = 0.140(CFS) for 0.180(Ac.) Total runoff = 6.362(CFS) Total area = 2.580(Ac.) Depth of flow = 0.265(Ft.), Average velocity = 3.024(Ft/s) Process from Point/Station to Point/Station **** SUBAREA FLOW ADDITION **** Rainfall intensity (I) = 4.326(In/Hr) for a year storm User specified 'C' value of given for subarea Time of concentration = 8.43 min. Rainfall intensity = 4.326(In/Hr) for a year storm Effective runoff coefficient used for total area (Q=KCIA) is C = CA = Subarea runoff = 0.247(CFS) for 0.100(Ac.) Total runoff = 6.609(CFS) Total area = 2.680(Ac.) Process from Point/Station to Point/Station **** SUBAREA FLOW ADDITION **** Rainfall intensity (I) = 4.326(In/Hr) for a year storm User specified 'C' value of given for subarea Time of concentration = 8.43 min. Rainfall intensity = 4.326(In/Hr) for a year storm Effective runoff coefficient used for total area (Q=KCIA) is C = CA = Subarea runoff = 3.083(CFS) for 1.250(Ac.) Total runoff = 9.692(CFS) Total area = 3.930(Ac.) Page 8
77 UCSD100YRpr1.out Process from Point/Station to Point/Station **** CONFLUENCE OF MINOR STREAMS **** Along Main Stream number: 1 in normal stream number 1 Stream flow area = 3.930(Ac.) Runoff from this stream = 9.692(CFS) Time of concentration = 8.43 min. Rainfall intensity = 4.326(In/Hr) Process from Point/Station to Point/Station **** INITIAL AREA EVALUATION **** Decimal fraction soil group A = Decimal fraction soil group B = Decimal fraction soil group C = Decimal fraction soil group D = [MEDIUM DENSITY RESIDENTIAL ] (7.3 DU/A or Less ) Impervious value, Ai = Sub-Area C Value = Initial subarea total flow distance = (Ft.) Highest elevation = (Ft.) Lowest elevation = (Ft.) Elevation difference = 6.200(Ft.) Slope = % Top of Initial Area Slope adjusted by User to % INITIAL AREA TIME OF CONCENTRATION CALCULATIONS: The maximum overland flow distance is (Ft) for the top area slope value of 6.00 %, in a development type of 7.3 DU/A or Less In Accordance With Figure 3-3 Initial Area Time of Concentration = 5.25 minutes TC = [1.8*(1.1-C)*distance(Ft.)^.5)/(% slope^(1/3)] TC = [1.8*( )*( ^.5)/( 6.000^(1/3)]= 5.25 Rainfall intensity (I) = 5.872(In/Hr) for a year storm Effective runoff coefficient used for area (Q=KCIA) is C = Subarea runoff = 0.301(CFS) Total initial stream area = 0.090(Ac.) Process from Point/Station to Point/Station **** IRREGULAR CHANNEL FLOW TRAVEL TIME **** Estimated mean flow rate at midpoint of channel = 0.602(CFS) Depth of flow = 0.187(Ft.), Average velocity = 3.434(Ft/s) ******* Irregular Channel Data *********** Information entered for subchannel number 1 : Point number 'X' coordinate 'Y' coordinate Manning's 'N' friction factor = Sub-Channel flow = 0.602(CFS) ' ' flow top width = 1.873(Ft.) ' ' velocity= 3.434(Ft/s) ' ' area = 0.175(Sq.Ft) ' ' Froude number = Page 9
78 UCSD100YRpr1.out Upstream point elevation = (Ft.) Downstream point elevation = (Ft.) Flow length = (Ft.) Travel time = 0.93 min. Time of concentration = 6.18 min. Depth of flow = 0.187(Ft.) Average velocity = 3.434(Ft/s) Total irregular channel flow = 0.602(CFS) Irregular channel normal depth above invert elev. = 0.187(Ft.) Average velocity of channel(s) = 3.434(Ft/s) Adding area flow to channel Rainfall intensity (I) = 5.285(In/Hr) for a year storm User specified 'C' value of given for subarea Rainfall intensity = 5.285(In/Hr) for a year storm Effective runoff coefficient used for total area (Q=KCIA) is C = CA = Subarea runoff = 0.512(CFS) for 0.180(Ac.) Total runoff = 0.813(CFS) Total area = 0.270(Ac.) Depth of flow = 0.210(Ft.), Average velocity = 3.702(Ft/s) Process from Point/Station to Point/Station **** PIPEFLOW TRAVEL TIME (Program estimated size) **** Upstream point/station elevation = (Ft.) Downstream point/station elevation = (Ft.) Pipe length = 89.50(Ft.) Slope = Manning's N = No. of pipes = 1 Required pipe flow = 0.813(CFS) Nearest computed pipe diameter = 6.00(In.) Calculated individual pipe flow = 0.813(CFS) Normal flow depth in pipe = 3.53(In.) Flow top width inside pipe = 5.90(In.) Critical Depth = 5.36(In.) Pipe flow velocity = 6.76(Ft/s) Travel time through pipe = 0.22 min. Time of concentration (TC) = 6.40 min. Process from Point/Station to Point/Station **** SUBAREA FLOW ADDITION **** Rainfall intensity (I) = 5.167(In/Hr) for a year storm User specified 'C' value of given for subarea Time of concentration = 6.40 min. Rainfall intensity = 5.167(In/Hr) for a year storm Effective runoff coefficient used for total area (Q=KCIA) is C = CA = Subarea runoff = 1.660(CFS) for 0.570(Ac.) Total runoff = 2.474(CFS) Total area = 0.840(Ac.) Process from Point/Station to Point/Station **** SUBAREA FLOW ADDITION **** Rainfall intensity (I) = 5.167(In/Hr) for a year storm User specified 'C' value of given for subarea Time of concentration = 6.40 min. Rainfall intensity = 5.167(In/Hr) for a year storm Effective runoff coefficient used for total area Page 10
79 UCSD100YRpr1.out (Q=KCIA) is C = CA = Subarea runoff = 2.209(CFS) for 0.750(Ac.) Total runoff = 4.682(CFS) Total area = 1.590(Ac.) Process from Point/Station to Point/Station **** PIPEFLOW TRAVEL TIME (Program estimated size) **** Upstream point/station elevation = (Ft.) Downstream point/station elevation = (Ft.) Pipe length = 39.00(Ft.) Slope = Manning's N = No. of pipes = 1 Required pipe flow = 4.682(CFS) Nearest computed pipe diameter = 12.00(In.) Calculated individual pipe flow = 4.682(CFS) Normal flow depth in pipe = 5.80(In.) Flow top width inside pipe = 11.99(In.) Critical Depth = 10.78(In.) Pipe flow velocity = 12.46(Ft/s) Travel time through pipe = 0.05 min. Time of concentration (TC) = 6.45 min. Process from Point/Station to Point/Station **** SUBAREA FLOW ADDITION **** Rainfall intensity (I) = 5.140(In/Hr) for a year storm User specified 'C' value of given for subarea Time of concentration = 6.45 min. Rainfall intensity = 5.140(In/Hr) for a year storm Effective runoff coefficient used for total area (Q=KCIA) is C = CA = Subarea runoff = 0.327(CFS) for 0.120(Ac.) Total runoff = 5.010(CFS) Total area = 1.710(Ac.) Process from Point/Station to Point/Station **** SUBAREA FLOW ADDITION **** Rainfall intensity (I) = 5.140(In/Hr) for a year storm User specified 'C' value of given for subarea Time of concentration = 6.45 min. Rainfall intensity = 5.140(In/Hr) for a year storm Effective runoff coefficient used for total area (Q=KCIA) is C = CA = Subarea runoff = 0.645(CFS) for 0.220(Ac.) Total runoff = 5.654(CFS) Total area = 1.930(Ac.) Process from Point/Station to Point/Station **** PIPEFLOW TRAVEL TIME (Program estimated size) **** Upstream point/station elevation = (Ft.) Downstream point/station elevation = (Ft.) Pipe length = 86.00(Ft.) Slope = Manning's N = No. of pipes = 1 Required pipe flow = 5.654(CFS) Nearest computed pipe diameter = 15.00(In.) Calculated individual pipe flow = 5.654(CFS) Normal flow depth in pipe = Flow top width inside pipe = 8.81(In.) 14.77(In.) Page 11
80 UCSD100YRpr1.out Critical Depth = 11.55(In.) Pipe flow velocity = 7.55(Ft/s) Travel time through pipe = 0.19 min. Time of concentration (TC) = 6.64 min. Process from Point/Station to Point/Station **** PIPEFLOW TRAVEL TIME (Program estimated size) **** Upstream point/station elevation = (Ft.) Downstream point/station elevation = (Ft.) Pipe length = (Ft.) Slope = Manning's N = No. of pipes = 1 Required pipe flow = 5.654(CFS) Nearest computed pipe diameter = 15.00(In.) Calculated individual pipe flow = 5.654(CFS) Normal flow depth in pipe = 8.13(In.) Flow top width inside pipe = 14.95(In.) Critical Depth = 11.55(In.) Pipe flow velocity = 8.31(Ft/s) Travel time through pipe = 0.33 min. Time of concentration (TC) = 6.98 min. Process from Point/Station to Point/Station **** SUBAREA FLOW ADDITION **** Rainfall intensity (I) = 4.887(In/Hr) for a year storm User specified 'C' value of given for subarea Time of concentration = 6.98 min. Rainfall intensity = 4.887(In/Hr) for a year storm Effective runoff coefficient used for total area (Q=KCIA) is C = CA = Subarea runoff = 0.168(CFS) for 0.160(Ac.) Total runoff = 5.822(CFS) Total area = 2.090(Ac.) Process from Point/Station to Point/Station **** PIPEFLOW TRAVEL TIME (Program estimated size) **** Upstream point/station elevation = (Ft.) Downstream point/station elevation = (Ft.) Pipe length = 52.00(Ft.) Slope = Manning's N = No. of pipes = 1 Required pipe flow = 5.822(CFS) Nearest computed pipe diameter = 9.00(In.) Calculated individual pipe flow = 5.822(CFS) Normal flow depth in pipe = 4.50(In.) Flow top width inside pipe = 9.00(In.) Critical depth could not be calculated. Pipe flow velocity = 26.38(Ft/s) Travel time through pipe = 0.03 min. Time of concentration (TC) = 7.01 min. Process from Point/Station to Point/Station **** PIPEFLOW TRAVEL TIME (Program estimated size) **** Upstream point/station elevation = (Ft.) Downstream point/station elevation = (Ft.) Pipe length = 67.00(Ft.) Slope = Manning's N = Page 12
81 UCSD100YRpr1.out No. of pipes = 1 Required pipe flow = 5.822(CFS) Nearest computed pipe diameter = 15.00(In.) Calculated individual pipe flow = 5.822(CFS) Normal flow depth in pipe = 8.31(In.) Flow top width inside pipe = 14.91(In.) Critical Depth = 11.72(In.) Pipe flow velocity = 8.34(Ft/s) Travel time through pipe = 0.13 min. Time of concentration (TC) = 7.15 min. Process from Point/Station to Point/Station **** SUBAREA FLOW ADDITION **** Rainfall intensity (I) = 4.813(In/Hr) for a year storm User specified 'C' value of given for subarea Time of concentration = 7.15 min. Rainfall intensity = 4.813(In/Hr) for a year storm Effective runoff coefficient used for total area (Q=KCIA) is C = CA = Subarea runoff = 0.132(CFS) for 0.080(Ac.) Total runoff = 5.953(CFS) Total area = 2.170(Ac.) Process from Point/Station to Point/Station **** PIPEFLOW TRAVEL TIME (Program estimated size) **** Upstream point/station elevation = (Ft.) Downstream point/station elevation = (Ft.) Pipe length = (Ft.) Slope = Manning's N = No. of pipes = 1 Required pipe flow = 5.953(CFS) Nearest computed pipe diameter = 12.00(In.) Calculated individual pipe flow = 5.953(CFS) Normal flow depth in pipe = 6.16(In.) Flow top width inside pipe = 12.00(In.) Critical depth could not be calculated. Pipe flow velocity = 14.66(Ft/s) Travel time through pipe = 0.33 min. Time of concentration (TC) = 7.48 min. Process from Point/Station to Point/Station **** CONFLUENCE OF MINOR STREAMS **** Along Main Stream number: 1 in normal stream number 2 Stream flow area = 2.170(Ac.) Runoff from this stream = 5.953(CFS) Time of concentration = 7.48 min. Rainfall intensity = 4.675(In/Hr) Summary of stream data: Stream Flow rate TC Rainfall Intensity No. (CFS) (min) (In/Hr) Qmax(1) = * * 9.692) * * 5.953) + = Page 13
82 Qmax(2) = UCSD100YRpr1.out * * 9.692) * * 5.953) + = Total of 2 streams to confluence: Flow rates before confluence point: Maximum flow rates at confluence using above data: Area of streams before confluence: Results of confluence: Total flow rate = (CFS) Time of concentration = min. Effective stream area after confluence = 6.100(Ac.) End of computations, total study area = (Ac.) Page 14
83 UCSD100YRPr2.out San Diego County Rational Hydrology Program CIVILCADD/CIVILDESIGN Engineering Software,(c) Version 7.9 Rational method hydrology program based on San Diego County Flood Control Division 2003 hydrology manual Rational Hydrology Study Date: 07/03/ UCSD VOIGT PARKING STRUCTURE PROPOSED CONDITION HYDROLOGY ANALYSIS RUNOFF EXIT POINT ********* Hydrology Study Control Information ********** Program License Serial Number Rational hydrology study storm event year is English (in-lb) input data Units used Map data precipitation entered: 6 hour, precipitation(inches) = hour precipitation(inches) = P6/P24 = 59.0% San Diego hydrology manual 'C' values used Process from Point/Station to Point/Station **** INITIAL AREA EVALUATION **** Decimal fraction soil group A = Decimal fraction soil group B = Decimal fraction soil group C = Decimal fraction soil group D = [MEDIUM DENSITY RESIDENTIAL ] (7.3 DU/A or Less ) Impervious value, Ai = Sub-Area C Value = Initial subarea total flow distance = (Ft.) Highest elevation = (Ft.) Lowest elevation = (Ft.) Elevation difference = 8.000(Ft.) Slope = % Top of Initial Area Slope adjusted by User to % Bottom of Initial Area Slope adjusted by User to % INITIAL AREA TIME OF CONCENTRATION CALCULATIONS: The maximum overland flow distance is (Ft) for the top area slope value of 5.00 %, in a development type of 7.3 DU/A or Less In Accordance With Figure 3-3 Initial Area Time of Concentration = 5.58 minutes TC = [1.8*(1.1-C)*distance(Ft.)^.5)/(% slope^(1/3)] TC = [1.8*( )*( ^.5)/( 5.000^(1/3)]= 5.58 The initial area total distance of (Ft.) entered leaves a remaining distance of (Ft.) Using Figure 3-4, the travel time for this distance is 0.62 minutes for a distance of (Ft.) and a slope of 5.00 % Page 1
84 UCSD100YRPr2.out with an elevation difference of 3.25(Ft.) from the end of the top area Tt = [11.9*length(Mi)^3)/(elevation change(ft.))]^.385 *60(min/hr) = Minutes Tt=[(11.9*0.0123^3)/( 3.25)]^.385= 0.62 Total initial area Ti = 5.58 minutes from Figure 3-3 formula plus 0.62 minutes from the Figure 3-4 formula = 6.19 minutes Rainfall intensity (I) = 5.278(In/Hr) for a year storm Effective runoff coefficient used for area (Q=KCIA) is C = Subarea runoff = 0.511(CFS) Total initial stream area = 0.170(Ac.) Process from Point/Station to Point/Station **** SUBAREA FLOW ADDITION **** Rainfall intensity (I) = 5.278(In/Hr) for a year storm User specified 'C' value of given for subarea Time of concentration = 6.19 min. Rainfall intensity = 5.278(In/Hr) for a year storm Effective runoff coefficient used for total area (Q=KCIA) is C = CA = Subarea runoff = 0.241(CFS) for 0.080(Ac.) Total runoff = 0.752(CFS) Total area = 0.250(Ac.) Process from Point/Station to Point/Station **** CONFLUENCE OF MINOR STREAMS **** Along Main Stream number: 1 in normal stream number 1 Stream flow area = 0.250(Ac.) Runoff from this stream = 0.752(CFS) Time of concentration = 6.19 min. Rainfall intensity = 5.278(In/Hr) Process from Point/Station to Point/Station **** INITIAL AREA EVALUATION **** Decimal fraction soil group A = Decimal fraction soil group B = Decimal fraction soil group C = Decimal fraction soil group D = [LOW DENSITY RESIDENTIAL ] (2.0 DU/A or Less ) Impervious value, Ai = Sub-Area C Value = Initial subarea total flow distance = (Ft.) Highest elevation = (Ft.) Lowest elevation = (Ft.) Elevation difference = (Ft.) Slope = % Top of Initial Area Slope adjusted by User to % Bottom of Initial Area Slope adjusted by User to % INITIAL AREA TIME OF CONCENTRATION CALCULATIONS: The maximum overland flow distance is (Ft) for the top area slope value of %, in a development type of 2.0 DU/A or Less In Accordance With Figure 3-3 Initial Area Time of Concentration = 5.35 minutes TC = [1.8*(1.1-C)*distance(Ft.)^.5)/(% slope^(1/3)] TC = [1.8*( )*( ^.5)/( ^(1/3)]= 5.35 Page 2
85 UCSD100YRPr2.out The initial area total distance of (Ft.) entered leaves a remaining distance of (Ft.) Using Figure 3-4, the travel time for this distance is 0.48 minutes for a distance of (Ft.) and a slope of % with an elevation difference of 6.70(Ft.) from the end of the top area Tt = [11.9*length(Mi)^3)/(elevation change(ft.))]^.385 *60(min/hr) = Minutes Tt=[(11.9*0.0127^3)/( 6.70)]^.385= 0.48 Total initial area Ti = 5.35 minutes from Figure 3-3 formula plus 0.48 minutes from the Figure 3-4 formula = 5.83 minutes Rainfall intensity (I) = 5.489(In/Hr) for a year storm Effective runoff coefficient used for area (Q=KCIA) is C = Subarea runoff = 0.353(CFS) Total initial stream area = 0.140(Ac.) Process from Point/Station to Point/Station **** CONFLUENCE OF MINOR STREAMS **** Along Main Stream number: 1 in normal stream number 2 Stream flow area = 0.140(Ac.) Runoff from this stream = 0.353(CFS) Time of concentration = 5.83 min. Rainfall intensity = 5.489(In/Hr) Summary of stream data: Stream Flow rate TC Rainfall Intensity No. (CFS) (min) (In/Hr) Qmax(1) = * * 0.752) * * 0.353) + = Qmax(2) = * * 0.752) * * 0.353) + = Total of 2 streams to confluence: Flow rates before confluence point: Maximum flow rates at confluence using above data: Area of streams before confluence: Results of confluence: Total flow rate = 1.092(CFS) Time of concentration = min. Effective stream area after confluence = 0.390(Ac.) Process from Point/Station to Point/Station **** CONFLUENCE OF MINOR STREAMS **** Along Main Stream number: 1 in normal stream number 1 Stream flow area = 0.390(Ac.) Runoff from this stream = 1.092(CFS) Time of concentration = 6.19 min. Rainfall intensity = 5.278(In/Hr) Page 3
86 UCSD100YRPr2.out Process from Point/Station to Point/Station **** INITIAL AREA EVALUATION **** Decimal fraction soil group A = Decimal fraction soil group B = Decimal fraction soil group C = Decimal fraction soil group D = [LOW DENSITY RESIDENTIAL ] (2.0 DU/A or Less ) Impervious value, Ai = Sub-Area C Value = Initial subarea total flow distance = (Ft.) Highest elevation = (Ft.) Lowest elevation = (Ft.) Elevation difference = (Ft.) Slope = % Top of Initial Area Slope adjusted by User to % Bottom of Initial Area Slope adjusted by User to % INITIAL AREA TIME OF CONCENTRATION CALCULATIONS: The maximum overland flow distance is (Ft) for the top area slope value of 6.00 %, in a development type of 2.0 DU/A or Less In Accordance With Figure 3-3 Initial Area Time of Concentration = 6.34 minutes TC = [1.8*(1.1-C)*distance(Ft.)^.5)/(% slope^(1/3)] TC = [1.8*( )*( ^.5)/( 6.000^(1/3)]= 6.34 The initial area total distance of (Ft.) entered leaves a remaining distance of (Ft.) Using Figure 3-4, the travel time for this distance is 1.19 minutes for a distance of (Ft.) and a slope of 6.00 % with an elevation difference of 10.08(Ft.) from the end of the top area Tt = [11.9*length(Mi)^3)/(elevation change(ft.))]^.385 *60(min/hr) = Minutes Tt=[(11.9*0.0318^3)/( 10.08)]^.385= 1.19 Total initial area Ti = 6.34 minutes from Figure 3-3 formula plus 1.19 minutes from the Figure 3-4 formula = 7.53 minutes Rainfall intensity (I) = 4.652(In/Hr) for a year storm Effective runoff coefficient used for area (Q=KCIA) is C = Subarea runoff = 0.535(CFS) Total initial stream area = 0.250(Ac.) Process from Point/Station to Point/Station **** CONFLUENCE OF MINOR STREAMS **** Along Main Stream number: 1 in normal stream number 2 Stream flow area = 0.250(Ac.) Runoff from this stream = 0.535(CFS) Time of concentration = 7.53 min. Rainfall intensity = 4.652(In/Hr) Summary of stream data: Stream Flow rate TC Rainfall Intensity No. (CFS) (min) (In/Hr) Qmax(1) = * * 1.092) * * 0.535) + = Page 4
87 Qmax(2) = UCSD100YRPr2.out * * 1.092) * * 0.535) + = Total of 2 streams to confluence: Flow rates before confluence point: Maximum flow rates at confluence using above data: Area of streams before confluence: Results of confluence: Total flow rate = 1.532(CFS) Time of concentration = min. Effective stream area after confluence = 0.640(Ac.) End of computations, total study area = (Ac.) Page 5
88
89 DETENTION BASINS Project: UCSD Voigt Parking Structure Porosity of Gravel = 0.4 Porosity of Soil Media = 0.1 Detention Basin # Bottom Area (SF) Outlet Type Weir Length (FT) Media+Gravel Storage Detention Volume (cf) Calculated Net Required Ponding Depth (FT) Total Basin Depth Weir Riser N/A Weir Weir Weir Weir Riser N/A 280 2,600 2, Total 525 4,813 4,288 -Soil media and gravel are assumed to have porosities of 0.1 and 0.4 respectively. -Ponding Depth is measured from the top of the soil media to the weir or riser crest. -Total Depth includes ponding depth, 0.5 of freeboard, 1.5 of soil media, and 0.5 of gravel.
90 RATIONAL METHOD HYDROGRAPH PROGRAM COPYRIGHT 1992, 2001 RICK ENGINEERING COMPANY RUN DATE 6/30/2017 HYDROGRAPH FILE NAME Text1 TIME OF CONCENTRATION 7 MIN. 6 HOUR RAINFALL 1.5 INCHES BASIN AREA 0.19 ACRES RUNOFF COEFFICIENT 0.57 PEAK DISCHARGE 0.38 CFS TIME (MIN) = 0 DISCHARGE (CFS) = 0 TIME (MIN) = 7 DISCHARGE (CFS) = 0 TIME (MIN) = 14 DISCHARGE (CFS) = 0 TIME (MIN) = 21 DISCHARGE (CFS) = 0 TIME (MIN) = 28 DISCHARGE (CFS) = 0 TIME (MIN) = 35 DISCHARGE (CFS) = 0 TIME (MIN) = 42 DISCHARGE (CFS) = 0 TIME (MIN) = 49 DISCHARGE (CFS) = 0 TIME (MIN) = 56 DISCHARGE (CFS) = 0 TIME (MIN) = 63 DISCHARGE (CFS) = 0 TIME (MIN) = 70 DISCHARGE (CFS) = 0 TIME (MIN) = 77 DISCHARGE (CFS) = 0 TIME (MIN) = 84 DISCHARGE (CFS) = 0 TIME (MIN) = 91 DISCHARGE (CFS) = 0 TIME (MIN) = 98 DISCHARGE (CFS) = 0 TIME (MIN) = 105 DISCHARGE (CFS) = 0 TIME (MIN) = 112 DISCHARGE (CFS) = 0 TIME (MIN) = 119 DISCHARGE (CFS) = 0 TIME (MIN) = 126 DISCHARGE (CFS) = 0 TIME (MIN) = 133 DISCHARGE (CFS) = 0 TIME (MIN) = 140 DISCHARGE (CFS) = 0 TIME (MIN) = 147 DISCHARGE (CFS) = 0 TIME (MIN) = 154 DISCHARGE (CFS) = 0 TIME (MIN) = 161 DISCHARGE (CFS) = 0 TIME (MIN) = 168 DISCHARGE (CFS) = 0 TIME (MIN) = 175 DISCHARGE (CFS) = 0 TIME (MIN) = 182 DISCHARGE (CFS) = 0 TIME (MIN) = 189 DISCHARGE (CFS) = 0 TIME (MIN) = 196 DISCHARGE (CFS) = 0 TIME (MIN) = 203 DISCHARGE (CFS) = 0 TIME (MIN) = 210 DISCHARGE (CFS) = 0 TIME (MIN) = 217 DISCHARGE (CFS) = 0 TIME (MIN) = 224 DISCHARGE (CFS) = 0 TIME (MIN) = 231 DISCHARGE (CFS) = 0.1 TIME (MIN) = 238 DISCHARGE (CFS) = 0.1 TIME (MIN) = 245 DISCHARGE (CFS) = 0.38 TIME (MIN) = 252 DISCHARGE (CFS) = 0.1 TIME (MIN) = 259 DISCHARGE (CFS) = 0 TIME (MIN) = 266 DISCHARGE (CFS) = 0 TIME (MIN) = 273 DISCHARGE (CFS) = 0 TIME (MIN) = 280 DISCHARGE (CFS) = 0 TIME (MIN) = 287 DISCHARGE (CFS) = 0 TIME (MIN) = 294 DISCHARGE (CFS) = 0 TIME (MIN) = 301 DISCHARGE (CFS) = 0 TIME (MIN) = 308 DISCHARGE (CFS) = 0 TIME (MIN) = 315 DISCHARGE (CFS) = 0 TIME (MIN) = 322 DISCHARGE (CFS) = 0 TIME (MIN) = 329 DISCHARGE (CFS) = 0 TIME (MIN) = 336 DISCHARGE (CFS) = 0 TIME (MIN) = 343 DISCHARGE (CFS) = 0 TIME (MIN) = 350 DISCHARGE (CFS) = 0 TIME (MIN) = 357 DISCHARGE (CFS) = 0 TIME (MIN) = 364 DISCHARGE (CFS) = 0 You created this PDF from an application that is not licensed to print to novapdf printer (
91 Watershed Model Schematic Hydraflow Hydrographs Extension for AutoCAD Civil 3D 2015 by Autodesk, Inc. v Analysis Point Detention 1 Project: Det-1 YR 10.gpw Monday, 07 / 3 / 2017
92 Hydrograph Report 2 Hydraflow Hydrographs Extension for AutoCAD Civil 3D 2015 by Autodesk, Inc. v10.4 Monday, 07 / 3 / 2017 Hyd. No. 1 Analysis Point 1 Hydrograph type = Manual Peak discharge = cfs Storm frequency = 10 yrs Time to peak = 4.08 hrs Time interval = 7 min Hyd. volume = 286 cuft Analysis Point 1 Q (cfs) Hyd. No Year Q (cfs) Hyd No. 1 Time (hrs)
93 Hydrograph Report 3 Hydraflow Hydrographs Extension for AutoCAD Civil 3D 2015 by Autodesk, Inc. v10.4 Monday, 07 / 3 / 2017 Hyd. No. 2 Detention 1 Hydrograph type = Reservoir Peak discharge = cfs Storm frequency = 10 yrs Time to peak = 4.32 hrs Time interval = 7 min Hyd. volume = 30 cuft Inflow hyd. No. = 1 - Analysis Point 1 Max. Elevation = ft Reservoir name = Detention 1 Max. Storage = 270 cuft Storage Indication method used. Detention 1 Q (cfs) Hyd. No Year Q (cfs) Time (hrs) Hyd No. 2 Hyd No. 1 Total storage used = 270 cuft
94 Pond Report 4 Hydraflow Hydrographs Extension for AutoCAD Civil 3D 2015 by Autodesk, Inc. v10.4 Monday, 07 / 3 / 2017 Pond No. 1 - Detention 1 Pond Data Pond storage is based on user-defined values. Stage / Storage Table Stage (ft) Elevation (ft) Contour area (sqft) Incr. Storage (cuft) Total storage (cuft) n/a n/a n/a Culvert / Orifice Structures Weir Structures [A] [B] [C] [PrfRsr] [A] [B] [C] [D] Rise (in) Inactive Inactive Inactive Inactive Span (in) = No. Barrels = Invert El. (ft) = Length (ft) = Slope (%) = n/a N-Value = n/a Orifice Coeff. = Multi-Stage = n/a No No No Crest Len (ft) Inactive 1.00 Inactive Inactive Crest El. (ft) = Weir Coeff. = Weir Type = 1 Rect Multi-Stage = Yes No No No Exfil.(in/hr) = (by Wet area) TW Elev. (ft) = 0.00 Note: Culvert/Orifice outflows are analyzed under inlet (ic) and outlet (oc) control. Weir risers checked for orifice conditions (ic) and submergence (s). Stage / Storage / Discharge Table Stage Storage Elevation Clv A Clv B Clv C PrfRsr Wr A Wr B Wr C Wr D Exfil User Total ft cuft ft cfs cfs cfs cfs cfs cfs cfs cfs cfs cfs cfs
95 RATIONAL METHOD HYDROGRAPH PROGRAM COPYRIGHT 1992, 2001 RICK ENGINEERING COMPANY RUN DATE 6/30/2017 HYDROGRAPH FILE NAME Text1 TIME OF CONCENTRATION 7 MIN. 6 HOUR RAINFALL 1.5 INCHES BASIN AREA 0.38 ACRES RUNOFF COEFFICIENT 0.57 PEAK DISCHARGE 0.7 CFS TIME (MIN) = 0 DISCHARGE (CFS) = 0 TIME (MIN) = 7 DISCHARGE (CFS) = 0 TIME (MIN) = 14 DISCHARGE (CFS) = 0 TIME (MIN) = 21 DISCHARGE (CFS) = 0 TIME (MIN) = 28 DISCHARGE (CFS) = 0 TIME (MIN) = 35 DISCHARGE (CFS) = 0 TIME (MIN) = 42 DISCHARGE (CFS) = 0 TIME (MIN) = 49 DISCHARGE (CFS) = 0 TIME (MIN) = 56 DISCHARGE (CFS) = 0 TIME (MIN) = 63 DISCHARGE (CFS) = 0 TIME (MIN) = 70 DISCHARGE (CFS) = 0 TIME (MIN) = 77 DISCHARGE (CFS) = 0 TIME (MIN) = 84 DISCHARGE (CFS) = 0 TIME (MIN) = 91 DISCHARGE (CFS) = 0 TIME (MIN) = 98 DISCHARGE (CFS) = 0 TIME (MIN) = 105 DISCHARGE (CFS) = 0 TIME (MIN) = 112 DISCHARGE (CFS) = 0 TIME (MIN) = 119 DISCHARGE (CFS) = 0 TIME (MIN) = 126 DISCHARGE (CFS) = 0 TIME (MIN) = 133 DISCHARGE (CFS) = 0 TIME (MIN) = 140 DISCHARGE (CFS) = 0 TIME (MIN) = 147 DISCHARGE (CFS) = 0 TIME (MIN) = 154 DISCHARGE (CFS) = 0 TIME (MIN) = 161 DISCHARGE (CFS) = 0 TIME (MIN) = 168 DISCHARGE (CFS) = 0 TIME (MIN) = 175 DISCHARGE (CFS) = 0 TIME (MIN) = 182 DISCHARGE (CFS) = 0 TIME (MIN) = 189 DISCHARGE (CFS) = 0.1 TIME (MIN) = 196 DISCHARGE (CFS) = 0.1 TIME (MIN) = 203 DISCHARGE (CFS) = 0.1 TIME (MIN) = 210 DISCHARGE (CFS) = 0.1 TIME (MIN) = 217 DISCHARGE (CFS) = 0.1 TIME (MIN) = 224 DISCHARGE (CFS) = 0.1 TIME (MIN) = 231 DISCHARGE (CFS) = 0.1 TIME (MIN) = 238 DISCHARGE (CFS) = 0.2 TIME (MIN) = 245 DISCHARGE (CFS) = 0.7 TIME (MIN) = 252 DISCHARGE (CFS) = 0.1 TIME (MIN) = 259 DISCHARGE (CFS) = 0.1 TIME (MIN) = 266 DISCHARGE (CFS) = 0.1 TIME (MIN) = 273 DISCHARGE (CFS) = 0 TIME (MIN) = 280 DISCHARGE (CFS) = 0 TIME (MIN) = 287 DISCHARGE (CFS) = 0 TIME (MIN) = 294 DISCHARGE (CFS) = 0 TIME (MIN) = 301 DISCHARGE (CFS) = 0 TIME (MIN) = 308 DISCHARGE (CFS) = 0 TIME (MIN) = 315 DISCHARGE (CFS) = 0 TIME (MIN) = 322 DISCHARGE (CFS) = 0 TIME (MIN) = 329 DISCHARGE (CFS) = 0 TIME (MIN) = 336 DISCHARGE (CFS) = 0 TIME (MIN) = 343 DISCHARGE (CFS) = 0 TIME (MIN) = 350 DISCHARGE (CFS) = 0 TIME (MIN) = 357 DISCHARGE (CFS) = 0 TIME (MIN) = 364 DISCHARGE (CFS) = 0 You created this PDF from an application that is not licensed to print to novapdf printer (
96 Watershed Model Schematic Hydraflow Hydrographs Extension for AutoCAD Civil 3D 2015 by Autodesk, Inc. v Analysis Point Detention 2 Project: Det-2 YR 10.gpw Monday, 07 / 3 / 2017
97 Hydrograph Report 2 Hydraflow Hydrographs Extension for AutoCAD Civil 3D 2015 by Autodesk, Inc. v10.4 Monday, 07 / 3 / 2017 Hyd. No. 1 Analysis Point 1 Hydrograph type = Manual Peak discharge = cfs Storm frequency = 10 yrs Time to peak = 4.08 hrs Time interval = 7 min Hyd. volume = 798 cuft Analysis Point 1 Q (cfs) Hyd. No Year Q (cfs) Hyd No. 1 Time (hrs)
98 Hydrograph Report 3 Hydraflow Hydrographs Extension for AutoCAD Civil 3D 2015 by Autodesk, Inc. v10.4 Monday, 07 / 3 / 2017 Hyd. No. 2 Detention 2 Hydrograph type = Reservoir Peak discharge = cfs Storm frequency = 10 yrs Time to peak = n/a Time interval = 7 min Hyd. volume = 0 cuft Inflow hyd. No. = 1 - Analysis Point 1 Max. Elevation = ft Reservoir name = Detention 2 Max. Storage = 798 cuft Storage Indication method used. Detention 2 Q (cfs) Hyd. No Year Q (cfs) Time (hrs) Hyd No. 2 Hyd No. 1 Total storage used = 798 cuft
99 Pond Report 4 Hydraflow Hydrographs Extension for AutoCAD Civil 3D 2015 by Autodesk, Inc. v10.4 Monday, 07 / 3 / 2017 Pond No. 1 - Detention 2 Pond Data Pond storage is based on user-defined values. Stage / Storage Table Stage (ft) Elevation (ft) Contour area (sqft) Incr. Storage (cuft) Total storage (cuft) n/a n/a n/a n/a Culvert / Orifice Structures Weir Structures [A] [B] [C] [PrfRsr] [A] [B] [C] [D] Rise (in) = 6.00 Inactive Inactive Inactive Span (in) = No. Barrels = Invert El. (ft) = Length (ft) = Slope (%) = n/a N-Value = n/a Orifice Coeff. = Multi-Stage = n/a Yes No No Crest Len (ft) = 3.14 Inactive Inactive Inactive Crest El. (ft) = Weir Coeff. = Weir Type = 1 Rect Multi-Stage = Yes No No No Exfil.(in/hr) = (by Wet area) TW Elev. (ft) = 0.00 Note: Culvert/Orifice outflows are analyzed under inlet (ic) and outlet (oc) control. Weir risers checked for orifice conditions (ic) and submergence (s). Stage / Storage / Discharge Table Stage Storage Elevation Clv A Clv B Clv C PrfRsr Wr A Wr B Wr C Wr D Exfil User Total ft cuft ft cfs cfs cfs cfs cfs cfs cfs cfs cfs cfs cfs oc s
100 RATIONAL METHOD HYDROGRAPH PROGRAM COPYRIGHT 1992, 2001 RICK ENGINEERING COMPANY RUN DATE 6/30/2017 HYDROGRAPH FILE NAME Text1 TIME OF CONCENTRATION 6 MIN. 6 HOUR RAINFALL 1.5 INCHES BASIN AREA 0.14 ACRES RUNOFF COEFFICIENT 0.57 PEAK DISCHARGE 0.3 CFS TIME (MIN) = 0 DISCHARGE (CFS) = 0 TIME (MIN) = 6 DISCHARGE (CFS) = 0 TIME (MIN) = 12 DISCHARGE (CFS) = 0 TIME (MIN) = 18 DISCHARGE (CFS) = 0 TIME (MIN) = 24 DISCHARGE (CFS) = 0 TIME (MIN) = 30 DISCHARGE (CFS) = 0 TIME (MIN) = 36 DISCHARGE (CFS) = 0 TIME (MIN) = 42 DISCHARGE (CFS) = 0 TIME (MIN) = 48 DISCHARGE (CFS) = 0 TIME (MIN) = 54 DISCHARGE (CFS) = 0 TIME (MIN) = 60 DISCHARGE (CFS) = 0 TIME (MIN) = 66 DISCHARGE (CFS) = 0 TIME (MIN) = 72 DISCHARGE (CFS) = 0 TIME (MIN) = 78 DISCHARGE (CFS) = 0 TIME (MIN) = 84 DISCHARGE (CFS) = 0 TIME (MIN) = 90 DISCHARGE (CFS) = 0 TIME (MIN) = 96 DISCHARGE (CFS) = 0 TIME (MIN) = 102 DISCHARGE (CFS) = 0 TIME (MIN) = 108 DISCHARGE (CFS) = 0 TIME (MIN) = 114 DISCHARGE (CFS) = 0 TIME (MIN) = 120 DISCHARGE (CFS) = 0 TIME (MIN) = 126 DISCHARGE (CFS) = 0 TIME (MIN) = 132 DISCHARGE (CFS) = 0 TIME (MIN) = 138 DISCHARGE (CFS) = 0 TIME (MIN) = 144 DISCHARGE (CFS) = 0 TIME (MIN) = 150 DISCHARGE (CFS) = 0 TIME (MIN) = 156 DISCHARGE (CFS) = 0 TIME (MIN) = 162 DISCHARGE (CFS) = 0 TIME (MIN) = 168 DISCHARGE (CFS) = 0 TIME (MIN) = 174 DISCHARGE (CFS) = 0 TIME (MIN) = 180 DISCHARGE (CFS) = 0 TIME (MIN) = 186 DISCHARGE (CFS) = 0 TIME (MIN) = 192 DISCHARGE (CFS) = 0 TIME (MIN) = 198 DISCHARGE (CFS) = 0 TIME (MIN) = 204 DISCHARGE (CFS) = 0 TIME (MIN) = 210 DISCHARGE (CFS) = 0 TIME (MIN) = 216 DISCHARGE (CFS) = 0 TIME (MIN) = 222 DISCHARGE (CFS) = 0 TIME (MIN) = 228 DISCHARGE (CFS) = 0 TIME (MIN) = 234 DISCHARGE (CFS) = 0.1 TIME (MIN) = 240 DISCHARGE (CFS) = 0.1 TIME (MIN) = 246 DISCHARGE (CFS) = 0.3 TIME (MIN) = 252 DISCHARGE (CFS) = 0 TIME (MIN) = 258 DISCHARGE (CFS) = 0 TIME (MIN) = 264 DISCHARGE (CFS) = 0 TIME (MIN) = 270 DISCHARGE (CFS) = 0 TIME (MIN) = 276 DISCHARGE (CFS) = 0 TIME (MIN) = 282 DISCHARGE (CFS) = 0 TIME (MIN) = 288 DISCHARGE (CFS) = 0 TIME (MIN) = 294 DISCHARGE (CFS) = 0 TIME (MIN) = 300 DISCHARGE (CFS) = 0 TIME (MIN) = 306 DISCHARGE (CFS) = 0 TIME (MIN) = 312 DISCHARGE (CFS) = 0 TIME (MIN) = 318 DISCHARGE (CFS) = 0 TIME (MIN) = 324 DISCHARGE (CFS) = 0 TIME (MIN) = 330 DISCHARGE (CFS) = 0 TIME (MIN) = 336 DISCHARGE (CFS) = 0 TIME (MIN) = 342 DISCHARGE (CFS) = 0 TIME (MIN) = 348 DISCHARGE (CFS) = 0 TIME (MIN) = 354 DISCHARGE (CFS) = 0 TIME (MIN) = 360 DISCHARGE (CFS) = 0 TIME (MIN) = 366 DISCHARGE (CFS) = 0 You created this PDF from an application that is not licensed to print to novapdf printer (
101 Watershed Model Schematic Hydraflow Hydrographs Extension for AutoCAD Civil 3D 2015 by Autodesk, Inc. v Analysis Point Detention Project: Det-3 YR 10.gpw Monday, 07 / 3 / 2017
102 Hydrograph Report 2 Hydraflow Hydrographs Extension for AutoCAD Civil 3D 2015 by Autodesk, Inc. v10.4 Monday, 07 / 3 / 2017 Hyd. No. 1 Analysis Point 1 Hydrograph type = Manual Peak discharge = cfs Storm frequency = 10 yrs Time to peak = 4.10 hrs Time interval = 6 min Hyd. volume = 180 cuft Analysis Point 1 Q (cfs) Hyd. No Year Q (cfs) Hyd No. 1 Time (hrs)
103 Hydrograph Report 3 Hydraflow Hydrographs Extension for AutoCAD Civil 3D 2015 by Autodesk, Inc. v10.4 Monday, 07 / 3 / 2017 Hyd. No. 2 Detention Hydrograph type = Reservoir Peak discharge = cfs Storm frequency = 10 yrs Time to peak = 4.20 hrs Time interval = 6 min Hyd. volume = 10 cuft Inflow hyd. No. = 1 - Analysis Point 1 Max. Elevation = ft Reservoir name = Detention 3 Max. Storage = 176 cuft Storage Indication method used. Detention Q (cfs) Hyd. No Year Q (cfs) Time (hrs) Hyd No. 2 Hyd No. 1 Total storage used = 176 cuft
104 Pond Report 4 Hydraflow Hydrographs Extension for AutoCAD Civil 3D 2015 by Autodesk, Inc. v10.4 Monday, 07 / 3 / 2017 Pond No. 1 - Detention 3 Pond Data Pond storage is based on user-defined values. Stage / Storage Table Stage (ft) Elevation (ft) Contour area (sqft) Incr. Storage (cuft) Total storage (cuft) n/a n/a n/a Culvert / Orifice Structures Weir Structures [A] [B] [C] [PrfRsr] [A] [B] [C] [D] Rise (in) Inactive Inactive Inactive Inactive Span (in) = No. Barrels = Invert El. (ft) = Length (ft) = Slope (%) = n/a N-Value = n/a Orifice Coeff. = Multi-Stage = n/a Yes No No Crest Len (ft) Inactive 1.00 Inactive Inactive Crest El. (ft) = Weir Coeff. = Weir Type = 1 Rect Multi-Stage = Yes No No No Exfil.(in/hr) = (by Wet area) TW Elev. (ft) = 0.00 Note: Culvert/Orifice outflows are analyzed under inlet (ic) and outlet (oc) control. Weir risers checked for orifice conditions (ic) and submergence (s). Stage / Storage / Discharge Table Stage Storage Elevation Clv A Clv B Clv C PrfRsr Wr A Wr B Wr C Wr D Exfil User Total ft cuft ft cfs cfs cfs cfs cfs cfs cfs cfs cfs cfs cfs
105 RATIONAL METHOD HYDROGRAPH PROGRAM COPYRIGHT 1992, 2001 RICK ENGINEERING COMPANY RUN DATE 6/30/2017 HYDROGRAPH FILE NAME Text1 TIME OF CONCENTRATION 5 MIN. 6 HOUR RAINFALL 1.5 INCHES BASIN AREA 0.11 ACRES RUNOFF COEFFICIENT 0.57 PEAK DISCHARGE 0.18 CFS TIME (MIN) = 0 DISCHARGE (CFS) = 0 TIME (MIN) = 5 DISCHARGE (CFS) = 0 TIME (MIN) = 10 DISCHARGE (CFS) = 0 TIME (MIN) = 15 DISCHARGE (CFS) = 0 TIME (MIN) = 20 DISCHARGE (CFS) = 0 TIME (MIN) = 25 DISCHARGE (CFS) = 0 TIME (MIN) = 30 DISCHARGE (CFS) = 0 TIME (MIN) = 35 DISCHARGE (CFS) = 0 TIME (MIN) = 40 DISCHARGE (CFS) = 0 TIME (MIN) = 45 DISCHARGE (CFS) = 0 TIME (MIN) = 50 DISCHARGE (CFS) = 0 TIME (MIN) = 55 DISCHARGE (CFS) = 0 TIME (MIN) = 60 DISCHARGE (CFS) = 0 TIME (MIN) = 65 DISCHARGE (CFS) = 0 TIME (MIN) = 70 DISCHARGE (CFS) = 0 TIME (MIN) = 75 DISCHARGE (CFS) = 0 TIME (MIN) = 80 DISCHARGE (CFS) = 0 TIME (MIN) = 85 DISCHARGE (CFS) = 0 TIME (MIN) = 90 DISCHARGE (CFS) = 0 TIME (MIN) = 95 DISCHARGE (CFS) = 0 TIME (MIN) = 100 DISCHARGE (CFS) = 0 TIME (MIN) = 105 DISCHARGE (CFS) = 0 TIME (MIN) = 110 DISCHARGE (CFS) = 0 TIME (MIN) = 115 DISCHARGE (CFS) = 0 TIME (MIN) = 120 DISCHARGE (CFS) = 0 TIME (MIN) = 125 DISCHARGE (CFS) = 0 TIME (MIN) = 130 DISCHARGE (CFS) = 0 TIME (MIN) = 135 DISCHARGE (CFS) = 0 TIME (MIN) = 140 DISCHARGE (CFS) = 0 TIME (MIN) = 145 DISCHARGE (CFS) = 0 TIME (MIN) = 150 DISCHARGE (CFS) = 0 TIME (MIN) = 155 DISCHARGE (CFS) = 0 TIME (MIN) = 160 DISCHARGE (CFS) = 0 TIME (MIN) = 165 DISCHARGE (CFS) = 0 TIME (MIN) = 170 DISCHARGE (CFS) = 0 TIME (MIN) = 175 DISCHARGE (CFS) = 0 TIME (MIN) = 180 DISCHARGE (CFS) = 0 TIME (MIN) = 185 DISCHARGE (CFS) = 0 TIME (MIN) = 190 DISCHARGE (CFS) = 0 TIME (MIN) = 195 DISCHARGE (CFS) = 0 TIME (MIN) = 200 DISCHARGE (CFS) = 0 TIME (MIN) = 205 DISCHARGE (CFS) = 0 TIME (MIN) = 210 DISCHARGE (CFS) = 0 TIME (MIN) = 215 DISCHARGE (CFS) = 0 TIME (MIN) = 220 DISCHARGE (CFS) = 0 TIME (MIN) = 225 DISCHARGE (CFS) = 0 TIME (MIN) = 230 DISCHARGE (CFS) = 0 TIME (MIN) = 235 DISCHARGE (CFS) = 0 TIME (MIN) = 240 DISCHARGE (CFS) = 0.1 TIME (MIN) = 245 DISCHARGE (CFS) = 0.18 TIME (MIN) = 250 DISCHARGE (CFS) = 0 TIME (MIN) = 255 DISCHARGE (CFS) = 0 TIME (MIN) = 260 DISCHARGE (CFS) = 0 TIME (MIN) = 265 DISCHARGE (CFS) = 0 TIME (MIN) = 270 DISCHARGE (CFS) = 0 TIME (MIN) = 275 DISCHARGE (CFS) = 0 TIME (MIN) = 280 DISCHARGE (CFS) = 0 TIME (MIN) = 285 DISCHARGE (CFS) = 0 TIME (MIN) = 290 DISCHARGE (CFS) = 0 TIME (MIN) = 295 DISCHARGE (CFS) = 0 TIME (MIN) = 300 DISCHARGE (CFS) = 0 TIME (MIN) = 305 DISCHARGE (CFS) = 0 TIME (MIN) = 310 DISCHARGE (CFS) = 0 TIME (MIN) = 315 DISCHARGE (CFS) = 0 TIME (MIN) = 320 DISCHARGE (CFS) = 0 TIME (MIN) = 325 DISCHARGE (CFS) = 0 TIME (MIN) = 330 DISCHARGE (CFS) = 0 TIME (MIN) = 335 DISCHARGE (CFS) = 0 TIME (MIN) = 340 DISCHARGE (CFS) = 0 TIME (MIN) = 345 DISCHARGE (CFS) = 0 TIME (MIN) = 350 DISCHARGE (CFS) = 0 TIME (MIN) = 355 DISCHARGE (CFS) = 0 TIME You (MIN) created = 360 this PDF DISCHARGE from an application (CFS) = 0 that is not licensed to print to novapdf printer (
106 Watershed Model Schematic Hydraflow Hydrographs Extension for AutoCAD Civil 3D 2015 by Autodesk, Inc. v Analysis Point Detention 4/5 Project: Det-4-5 YR 10.gpw Monday, 07 / 3 / 2017
107 Hydrograph Report 2 Hydraflow Hydrographs Extension for AutoCAD Civil 3D 2015 by Autodesk, Inc. v10.4 Monday, 07 / 3 / 2017 Hyd. No. 1 Analysis Point 1 Hydrograph type = Manual Peak discharge = cfs Storm frequency = 10 yrs Time to peak = 4.08 hrs Time interval = 5 min Hyd. volume = 84 cuft Analysis Point 1 Q (cfs) Hyd. No Year Q (cfs) Hyd No. 1 Time (hrs)
108 Hydrograph Report 3 Hydraflow Hydrographs Extension for AutoCAD Civil 3D 2015 by Autodesk, Inc. v10.4 Monday, 07 / 3 / 2017 Hyd. No. 2 Detention 4/5 Hydrograph type = Reservoir Peak discharge = cfs Storm frequency = 10 yrs Time to peak = n/a Time interval = 5 min Hyd. volume = 0 cuft Inflow hyd. No. = 1 - Analysis Point 1 Max. Elevation = ft Reservoir name = Detention 4/5 Max. Storage = 84 cuft Storage Indication method used. Detention 4/5 Q (cfs) Hyd. No Year Q (cfs) Time (hrs) Hyd No. 2 Hyd No. 1 Total storage used = 84 cuft
109 Pond Report 4 Hydraflow Hydrographs Extension for AutoCAD Civil 3D 2015 by Autodesk, Inc. v10.4 Monday, 07 / 3 / 2017 Pond No. 1 - Detention 4/5 Pond Data Pond storage is based on user-defined values. Stage / Storage Table Stage (ft) Elevation (ft) Contour area (sqft) Incr. Storage (cuft) Total storage (cuft) n/a n/a n/a Culvert / Orifice Structures Weir Structures [A] [B] [C] [PrfRsr] [A] [B] [C] [D] Rise (in) Inactive Inactive Inactive Inactive Span (in) = No. Barrels = Invert El. (ft) = Length (ft) = Slope (%) = n/a N-Value = n/a Orifice Coeff. = Multi-Stage = n/a Yes No No Crest Len (ft) Inactive 1.00 Inactive Inactive Crest El. (ft) = Weir Coeff. = Weir Type = 1 Rect Multi-Stage = Yes No No No Exfil.(in/hr) = (by Wet area) TW Elev. (ft) = 0.00 Note: Culvert/Orifice outflows are analyzed under inlet (ic) and outlet (oc) control. Weir risers checked for orifice conditions (ic) and submergence (s). Stage / Storage / Discharge Table Stage Storage Elevation Clv A Clv B Clv C PrfRsr Wr A Wr B Wr C Wr D Exfil User Total ft cuft ft cfs cfs cfs cfs cfs cfs cfs cfs cfs cfs cfs
110 RATIONAL METHOD HYDROGRAPH PROGRAM COPYRIGHT 1992, 2001 RICK ENGINEERING COMPANY RUN DATE 6/30/2017 HYDROGRAPH FILE NAME Text1 TIME OF CONCENTRATION 5 MIN. 6 HOUR RAINFALL 1.5 INCHES BASIN AREA 0.15 ACRES RUNOFF COEFFICIENT 0.57 PEAK DISCHARGE 0.25 CFS TIME (MIN) = 0 DISCHARGE (CFS) = 0 TIME (MIN) = 5 DISCHARGE (CFS) = 0 TIME (MIN) = 10 DISCHARGE (CFS) = 0 TIME (MIN) = 15 DISCHARGE (CFS) = 0 TIME (MIN) = 20 DISCHARGE (CFS) = 0 TIME (MIN) = 25 DISCHARGE (CFS) = 0 TIME (MIN) = 30 DISCHARGE (CFS) = 0 TIME (MIN) = 35 DISCHARGE (CFS) = 0 TIME (MIN) = 40 DISCHARGE (CFS) = 0 TIME (MIN) = 45 DISCHARGE (CFS) = 0 TIME (MIN) = 50 DISCHARGE (CFS) = 0 TIME (MIN) = 55 DISCHARGE (CFS) = 0 TIME (MIN) = 60 DISCHARGE (CFS) = 0 TIME (MIN) = 65 DISCHARGE (CFS) = 0 TIME (MIN) = 70 DISCHARGE (CFS) = 0 TIME (MIN) = 75 DISCHARGE (CFS) = 0 TIME (MIN) = 80 DISCHARGE (CFS) = 0 TIME (MIN) = 85 DISCHARGE (CFS) = 0 TIME (MIN) = 90 DISCHARGE (CFS) = 0 TIME (MIN) = 95 DISCHARGE (CFS) = 0 TIME (MIN) = 100 DISCHARGE (CFS) = 0 TIME (MIN) = 105 DISCHARGE (CFS) = 0 TIME (MIN) = 110 DISCHARGE (CFS) = 0 TIME (MIN) = 115 DISCHARGE (CFS) = 0 TIME (MIN) = 120 DISCHARGE (CFS) = 0 TIME (MIN) = 125 DISCHARGE (CFS) = 0 TIME (MIN) = 130 DISCHARGE (CFS) = 0 TIME (MIN) = 135 DISCHARGE (CFS) = 0 TIME (MIN) = 140 DISCHARGE (CFS) = 0 TIME (MIN) = 145 DISCHARGE (CFS) = 0 TIME (MIN) = 150 DISCHARGE (CFS) = 0 TIME (MIN) = 155 DISCHARGE (CFS) = 0 TIME (MIN) = 160 DISCHARGE (CFS) = 0 TIME (MIN) = 165 DISCHARGE (CFS) = 0 TIME (MIN) = 170 DISCHARGE (CFS) = 0 TIME (MIN) = 175 DISCHARGE (CFS) = 0 TIME (MIN) = 180 DISCHARGE (CFS) = 0 TIME (MIN) = 185 DISCHARGE (CFS) = 0 TIME (MIN) = 190 DISCHARGE (CFS) = 0 TIME (MIN) = 195 DISCHARGE (CFS) = 0 TIME (MIN) = 200 DISCHARGE (CFS) = 0 TIME (MIN) = 205 DISCHARGE (CFS) = 0 TIME (MIN) = 210 DISCHARGE (CFS) = 0 TIME (MIN) = 215 DISCHARGE (CFS) = 0 TIME (MIN) = 220 DISCHARGE (CFS) = 0 TIME (MIN) = 225 DISCHARGE (CFS) = 0 TIME (MIN) = 230 DISCHARGE (CFS) = 0 TIME (MIN) = 235 DISCHARGE (CFS) = 0.1 TIME (MIN) = 240 DISCHARGE (CFS) = 0.2 TIME (MIN) = 245 DISCHARGE (CFS) = 0.25 TIME (MIN) = 250 DISCHARGE (CFS) = 0.1 TIME (MIN) = 255 DISCHARGE (CFS) = 0 TIME (MIN) = 260 DISCHARGE (CFS) = 0 TIME (MIN) = 265 DISCHARGE (CFS) = 0 TIME (MIN) = 270 DISCHARGE (CFS) = 0 TIME (MIN) = 275 DISCHARGE (CFS) = 0 TIME (MIN) = 280 DISCHARGE (CFS) = 0 TIME (MIN) = 285 DISCHARGE (CFS) = 0 TIME (MIN) = 290 DISCHARGE (CFS) = 0 TIME (MIN) = 295 DISCHARGE (CFS) = 0 TIME (MIN) = 300 DISCHARGE (CFS) = 0 TIME (MIN) = 305 DISCHARGE (CFS) = 0 TIME (MIN) = 310 DISCHARGE (CFS) = 0 TIME (MIN) = 315 DISCHARGE (CFS) = 0 TIME (MIN) = 320 DISCHARGE (CFS) = 0 TIME (MIN) = 325 DISCHARGE (CFS) = 0 TIME (MIN) = 330 DISCHARGE (CFS) = 0 TIME (MIN) = 335 DISCHARGE (CFS) = 0 TIME (MIN) = 340 DISCHARGE (CFS) = 0 TIME (MIN) = 345 DISCHARGE (CFS) = 0 TIME (MIN) = 350 DISCHARGE (CFS) = 0 TIME (MIN) = 355 DISCHARGE (CFS) = 0 TIME You (MIN) created = 360 this PDF DISCHARGE from an application (CFS) = 0 that is not licensed to print to novapdf printer (
111 Watershed Model Schematic Hydraflow Hydrographs Extension for AutoCAD Civil 3D 2015 by Autodesk, Inc. v Analysis Point Detention 6 Project: Det-6 YR 10.gpw Monday, 07 / 3 / 2017
112 Hydrograph Report 2 Hydraflow Hydrographs Extension for AutoCAD Civil 3D 2015 by Autodesk, Inc. v10.4 Monday, 07 / 3 / 2017 Hyd. No. 1 Analysis Point 1 Hydrograph type = Manual Peak discharge = cfs Storm frequency = 10 yrs Time to peak = 4.08 hrs Time interval = 5 min Hyd. volume = 195 cuft Analysis Point 1 Q (cfs) Hyd. No Year Q (cfs) Hyd No. 1 Time (hrs)
113 Hydrograph Report 3 Hydraflow Hydrographs Extension for AutoCAD Civil 3D 2015 by Autodesk, Inc. v10.4 Monday, 07 / 3 / 2017 Hyd. No. 2 Detention 6 Hydrograph type = Reservoir Peak discharge = cfs Storm frequency = 10 yrs Time to peak = n/a Time interval = 5 min Hyd. volume = 0 cuft Inflow hyd. No. = 1 - Analysis Point 1 Max. Elevation = ft Reservoir name = Detention 6 Max. Storage = 195 cuft Storage Indication method used. Detention 6 Q (cfs) Hyd. No Year Q (cfs) Time (hrs) Hyd No. 2 Hyd No. 1 Total storage used = 195 cuft
114 Pond Report 4 Hydraflow Hydrographs Extension for AutoCAD Civil 3D 2015 by Autodesk, Inc. v10.4 Monday, 07 / 3 / 2017 Pond No. 1 - Detention 6 Pond Data Pond storage is based on user-defined values. Stage / Storage Table Stage (ft) Elevation (ft) Contour area (sqft) Incr. Storage (cuft) Total storage (cuft) n/a n/a n/a Culvert / Orifice Structures Weir Structures [A] [B] [C] [PrfRsr] [A] [B] [C] [D] Rise (in) Inactive Inactive Inactive Inactive Span (in) = No. Barrels = Invert El. (ft) = Length (ft) = Slope (%) = n/a N-Value = n/a Orifice Coeff. = Multi-Stage = n/a Yes No No Crest Len (ft) Inactive 1.00 Inactive Inactive Crest El. (ft) = Weir Coeff. = Weir Type = 1 Rect Multi-Stage = Yes No No No Exfil.(in/hr) = (by Wet area) TW Elev. (ft) = 0.00 Note: Culvert/Orifice outflows are analyzed under inlet (ic) and outlet (oc) control. Weir risers checked for orifice conditions (ic) and submergence (s). Stage / Storage / Discharge Table Stage Storage Elevation Clv A Clv B Clv C PrfRsr Wr A Wr B Wr C Wr D Exfil User Total ft cuft ft cfs cfs cfs cfs cfs cfs cfs cfs cfs cfs cfs
115 RATIONAL METHOD HYDROGRAPH PROGRAM COPYRIGHT 1992, 2001 RICK ENGINEERING COMPANY RUN DATE 6/30/2017 HYDROGRAPH FILE NAME Text1 TIME OF CONCENTRATION 7 MIN. 6 HOUR RAINFALL 1.5 INCHES BASIN AREA 0.74 ACRES RUNOFF COEFFICIENT 0.57 PEAK DISCHARGE 1.28 CFS TIME (MIN) = 0 DISCHARGE (CFS) = 0 TIME (MIN) = 7 DISCHARGE (CFS) = 0 TIME (MIN) = 14 DISCHARGE (CFS) = 0 TIME (MIN) = 21 DISCHARGE (CFS) = 0 TIME (MIN) = 28 DISCHARGE (CFS) = 0 TIME (MIN) = 35 DISCHARGE (CFS) = 0 TIME (MIN) = 42 DISCHARGE (CFS) = 0 TIME (MIN) = 49 DISCHARGE (CFS) = 0 TIME (MIN) = 56 DISCHARGE (CFS) = 0 TIME (MIN) = 63 DISCHARGE (CFS) = 0 TIME (MIN) = 70 DISCHARGE (CFS) = 0 TIME (MIN) = 77 DISCHARGE (CFS) = 0 TIME (MIN) = 84 DISCHARGE (CFS) = 0 TIME (MIN) = 91 DISCHARGE (CFS) = 0.1 TIME (MIN) = 98 DISCHARGE (CFS) = 0.1 TIME (MIN) = 105 DISCHARGE (CFS) = 0.1 TIME (MIN) = 112 DISCHARGE (CFS) = 0.1 TIME (MIN) = 119 DISCHARGE (CFS) = 0.1 TIME (MIN) = 126 DISCHARGE (CFS) = 0.1 TIME (MIN) = 133 DISCHARGE (CFS) = 0.1 TIME (MIN) = 140 DISCHARGE (CFS) = 0.1 TIME (MIN) = 147 DISCHARGE (CFS) = 0.1 TIME (MIN) = 154 DISCHARGE (CFS) = 0.1 TIME (MIN) = 161 DISCHARGE (CFS) = 0.1 TIME (MIN) = 168 DISCHARGE (CFS) = 0.1 TIME (MIN) = 175 DISCHARGE (CFS) = 0.1 TIME (MIN) = 182 DISCHARGE (CFS) = 0.1 TIME (MIN) = 189 DISCHARGE (CFS) = 0.1 TIME (MIN) = 196 DISCHARGE (CFS) = 0.1 TIME (MIN) = 203 DISCHARGE (CFS) = 0.1 TIME (MIN) = 210 DISCHARGE (CFS) = 0.1 TIME (MIN) = 217 DISCHARGE (CFS) = 0.2 TIME (MIN) = 224 DISCHARGE (CFS) = 0.2 TIME (MIN) = 231 DISCHARGE (CFS) = 0.3 TIME (MIN) = 238 DISCHARGE (CFS) = 0.4 TIME (MIN) = 245 DISCHARGE (CFS) = 1.28 TIME (MIN) = 252 DISCHARGE (CFS) = 0.2 TIME (MIN) = 259 DISCHARGE (CFS) = 0.1 TIME (MIN) = 266 DISCHARGE (CFS) = 0.1 TIME (MIN) = 273 DISCHARGE (CFS) = 0.1 TIME (MIN) = 280 DISCHARGE (CFS) = 0.1 TIME (MIN) = 287 DISCHARGE (CFS) = 0.1 TIME (MIN) = 294 DISCHARGE (CFS) = 0.1 TIME (MIN) = 301 DISCHARGE (CFS) = 0.1 TIME (MIN) = 308 DISCHARGE (CFS) = 0.1 TIME (MIN) = 315 DISCHARGE (CFS) = 0.1 TIME (MIN) = 322 DISCHARGE (CFS) = 0 TIME (MIN) = 329 DISCHARGE (CFS) = 0 TIME (MIN) = 336 DISCHARGE (CFS) = 0 TIME (MIN) = 343 DISCHARGE (CFS) = 0 TIME (MIN) = 350 DISCHARGE (CFS) = 0 TIME (MIN) = 357 DISCHARGE (CFS) = 0 TIME (MIN) = 364 DISCHARGE (CFS) = 0 You created this PDF from an application that is not licensed to print to novapdf printer (
116 Watershed Model Schematic Hydraflow Hydrographs Extension for AutoCAD Civil 3D 2015 by Autodesk, Inc. v Analysis Point Detention 7 Project: Det-7 YR 10.gpw Monday, 07 / 3 / 2017
117 Hydrograph Report 2 Hydraflow Hydrographs Extension for AutoCAD Civil 3D 2015 by Autodesk, Inc. v10.4 Monday, 07 / 3 / 2017 Hyd. No. 1 Analysis Point 1 Hydrograph type = Manual Peak discharge = cfs Storm frequency = 10 yrs Time to peak = 4.08 hrs Time interval = 7 min Hyd. volume = 2,218 cuft Analysis Point 1 Q (cfs) Hyd. No Year Q (cfs) Hyd No. 1 Time (hrs)
118 Hydrograph Report 3 Hydraflow Hydrographs Extension for AutoCAD Civil 3D 2015 by Autodesk, Inc. v10.4 Monday, 07 / 3 / 2017 Hyd. No. 2 Detention 7 Hydrograph type = Reservoir Peak discharge = cfs Storm frequency = 10 yrs Time to peak = 5.37 hrs Time interval = 7 min Hyd. volume = 2,174 cuft Inflow hyd. No. = 1 - Analysis Point 1 Max. Elevation = ft Reservoir name = Detention 7 Max. Storage = 2,128 cuft Storage Indication method used. Detention 7 Q (cfs) Hyd. No Year Q (cfs) Time (hrs) Hyd No. 2 Hyd No. 1 Total storage used = 2,128 cuft
119 Pond Report 4 Hydraflow Hydrographs Extension for AutoCAD Civil 3D 2015 by Autodesk, Inc. v10.4 Monday, 07 / 3 / 2017 Pond No. 1 - Detention 7 Pond Data Pond storage is based on user-defined values. Stage / Storage Table Stage (ft) Elevation (ft) Contour area (sqft) Incr. Storage (cuft) Total storage (cuft) n/a n/a n/a 800 1, n/a 800 2,400 Culvert / Orifice Structures Weir Structures [A] [B] [C] [PrfRsr] [A] [B] [C] [D] Rise (in) = Inactive Inactive Span (in) = No. Barrels = Invert El. (ft) = Length (ft) = Slope (%) = n/a N-Value = n/a Orifice Coeff. = Multi-Stage = n/a Yes No No Crest Len (ft) = 3.14 Inactive Inactive Inactive Crest El. (ft) = Weir Coeff. = Weir Type = 1 Rect Multi-Stage = Yes No No No Exfil.(in/hr) = (by Wet area) TW Elev. (ft) = 0.00 Note: Culvert/Orifice outflows are analyzed under inlet (ic) and outlet (oc) control. Weir risers checked for orifice conditions (ic) and submergence (s). Stage / Storage / Discharge Table Stage Storage Elevation Clv A Clv B Clv C PrfRsr Wr A Wr B Wr C Wr D Exfil User Total ft cuft ft cfs cfs cfs cfs cfs cfs cfs cfs cfs cfs cfs ic 0.01 ic , ic 0.01 ic , ic 0.01 ic
120
121 RATIONAL METHOD HYDROGRAPH PROGRAM COPYRIGHT 1992, 2001 RICK ENGINEERING COMPANY RUN DATE 7/3/2017 HYDROGRAPH FILE NAME Text1 TIME OF CONCENTRATION 7 MIN. 6 HOUR RAINFALL 2.3 INCHES BASIN AREA 0.19 ACRES RUNOFF COEFFICIENT 0.57 PEAK DISCHARGE 0.52 CFS TIME (MIN) = 0 DISCHARGE (CFS) = 0 TIME (MIN) = 7 DISCHARGE (CFS) = 0 TIME (MIN) = 14 DISCHARGE (CFS) = 0 TIME (MIN) = 21 DISCHARGE (CFS) = 0 TIME (MIN) = 28 DISCHARGE (CFS) = 0 TIME (MIN) = 35 DISCHARGE (CFS) = 0 TIME (MIN) = 42 DISCHARGE (CFS) = 0 TIME (MIN) = 49 DISCHARGE (CFS) = 0 TIME (MIN) = 56 DISCHARGE (CFS) = 0 TIME (MIN) = 63 DISCHARGE (CFS) = 0 TIME (MIN) = 70 DISCHARGE (CFS) = 0 TIME (MIN) = 77 DISCHARGE (CFS) = 0 TIME (MIN) = 84 DISCHARGE (CFS) = 0 TIME (MIN) = 91 DISCHARGE (CFS) = 0 TIME (MIN) = 98 DISCHARGE (CFS) = 0 TIME (MIN) = 105 DISCHARGE (CFS) = 0 TIME (MIN) = 112 DISCHARGE (CFS) = 0 TIME (MIN) = 119 DISCHARGE (CFS) = 0 TIME (MIN) = 126 DISCHARGE (CFS) = 0 TIME (MIN) = 133 DISCHARGE (CFS) = 0 TIME (MIN) = 140 DISCHARGE (CFS) = 0 TIME (MIN) = 147 DISCHARGE (CFS) = 0 TIME (MIN) = 154 DISCHARGE (CFS) = 0 TIME (MIN) = 161 DISCHARGE (CFS) = 0 TIME (MIN) = 168 DISCHARGE (CFS) = 0 TIME (MIN) = 175 DISCHARGE (CFS) = 0 TIME (MIN) = 182 DISCHARGE (CFS) = 0 TIME (MIN) = 189 DISCHARGE (CFS) = 0 TIME (MIN) = 196 DISCHARGE (CFS) = 0 TIME (MIN) = 203 DISCHARGE (CFS) = 0 TIME (MIN) = 210 DISCHARGE (CFS) = 0.1 TIME (MIN) = 217 DISCHARGE (CFS) = 0.1 TIME (MIN) = 224 DISCHARGE (CFS) = 0.1 TIME (MIN) = 231 DISCHARGE (CFS) = 0.1 TIME (MIN) = 238 DISCHARGE (CFS) = 0.2 TIME (MIN) = 245 DISCHARGE (CFS) = 0.52 TIME (MIN) = 252 DISCHARGE (CFS) = 0.1 TIME (MIN) = 259 DISCHARGE (CFS) = 0.1 TIME (MIN) = 266 DISCHARGE (CFS) = 0 TIME (MIN) = 273 DISCHARGE (CFS) = 0 TIME (MIN) = 280 DISCHARGE (CFS) = 0 TIME (MIN) = 287 DISCHARGE (CFS) = 0 TIME (MIN) = 294 DISCHARGE (CFS) = 0 TIME (MIN) = 301 DISCHARGE (CFS) = 0 TIME (MIN) = 308 DISCHARGE (CFS) = 0 TIME (MIN) = 315 DISCHARGE (CFS) = 0 TIME (MIN) = 322 DISCHARGE (CFS) = 0 TIME (MIN) = 329 DISCHARGE (CFS) = 0 TIME (MIN) = 336 DISCHARGE (CFS) = 0 TIME (MIN) = 343 DISCHARGE (CFS) = 0 TIME (MIN) = 350 DISCHARGE (CFS) = 0 TIME (MIN) = 357 DISCHARGE (CFS) = 0 TIME (MIN) = 364 DISCHARGE (CFS) = 0 You created this PDF from an application that is not licensed to print to novapdf printer (
122 Watershed Model Schematic Hydraflow Hydrographs Extension for AutoCAD Civil 3D 2015 by Autodesk, Inc. v Analysis Point Detention 1 Project: Det-1 YR 100.gpw Monday, 07 / 3 / 2017
123 Hydrograph Report 2 Hydraflow Hydrographs Extension for AutoCAD Civil 3D 2015 by Autodesk, Inc. v10.4 Monday, 07 / 3 / 2017 Hyd. No. 1 Analysis Point 1 Hydrograph type = Manual Peak discharge = cfs Storm frequency = 100 yrs Time to peak = 4.08 hrs Time interval = 7 min Hyd. volume = 554 cuft Analysis Point 1 Q (cfs) Hyd. No Year Q (cfs) Hyd No. 1 Time (hrs)
124 Hydrograph Report 3 Hydraflow Hydrographs Extension for AutoCAD Civil 3D 2015 by Autodesk, Inc. v10.4 Monday, 07 / 3 / 2017 Hyd. No. 2 Detention 1 Hydrograph type = Reservoir Peak discharge = cfs Storm frequency = 100 yrs Time to peak = 4.08 hrs Time interval = 7 min Hyd. volume = 299 cuft Inflow hyd. No. = 1 - Analysis Point 1 Max. Elevation = ft Reservoir name = Detention 1 Max. Storage = 294 cuft Storage Indication method used. Detention 1 Q (cfs) Hyd. No Year Q (cfs) Time (hrs) Hyd No. 2 Hyd No. 1 Total storage used = 294 cuft
125 Pond Report 4 Hydraflow Hydrographs Extension for AutoCAD Civil 3D 2015 by Autodesk, Inc. v10.4 Monday, 07 / 3 / 2017 Pond No. 1 - Detention 1 Pond Data Pond storage is based on user-defined values. Stage / Storage Table Stage (ft) Elevation (ft) Contour area (sqft) Incr. Storage (cuft) Total storage (cuft) n/a n/a n/a Culvert / Orifice Structures Weir Structures [A] [B] [C] [PrfRsr] [A] [B] [C] [D] Rise (in) Inactive Inactive Inactive Inactive Span (in) = No. Barrels = Invert El. (ft) = Length (ft) = Slope (%) = n/a N-Value = n/a Orifice Coeff. = Multi-Stage = n/a Yes No No Crest Len (ft) Inactive 1.00 Inactive Inactive Crest El. (ft) = Weir Coeff. = Weir Type = 1 Rect Multi-Stage = Yes No No No Exfil.(in/hr) = (by Wet area) TW Elev. (ft) = 0.00 Note: Culvert/Orifice outflows are analyzed under inlet (ic) and outlet (oc) control. Weir risers checked for orifice conditions (ic) and submergence (s). Stage / Storage / Discharge Table Stage Storage Elevation Clv A Clv B Clv C PrfRsr Wr A Wr B Wr C Wr D Exfil User Total ft cuft ft cfs cfs cfs cfs cfs cfs cfs cfs cfs cfs cfs
126 RATIONAL METHOD HYDROGRAPH PROGRAM COPYRIGHT 1992, 2001 RICK ENGINEERING COMPANY RUN DATE 7/3/2017 HYDROGRAPH FILE NAME Text1 TIME OF CONCENTRATION 7 MIN. 6 HOUR RAINFALL 2.3 INCHES BASIN AREA 0.38 ACRES RUNOFF COEFFICIENT 0.57 PEAK DISCHARGE 1.08 CFS TIME (MIN) = 0 DISCHARGE (CFS) = 0 TIME (MIN) = 7 DISCHARGE (CFS) = 0 TIME (MIN) = 14 DISCHARGE (CFS) = 0 TIME (MIN) = 21 DISCHARGE (CFS) = 0 TIME (MIN) = 28 DISCHARGE (CFS) = 0 TIME (MIN) = 35 DISCHARGE (CFS) = 0 TIME (MIN) = 42 DISCHARGE (CFS) = 0 TIME (MIN) = 49 DISCHARGE (CFS) = 0 TIME (MIN) = 56 DISCHARGE (CFS) = 0 TIME (MIN) = 63 DISCHARGE (CFS) = 0 TIME (MIN) = 70 DISCHARGE (CFS) = 0 TIME (MIN) = 77 DISCHARGE (CFS) = 0 TIME (MIN) = 84 DISCHARGE (CFS) = 0 TIME (MIN) = 91 DISCHARGE (CFS) = 0 TIME (MIN) = 98 DISCHARGE (CFS) = 0 TIME (MIN) = 105 DISCHARGE (CFS) = 0 TIME (MIN) = 112 DISCHARGE (CFS) = 0 TIME (MIN) = 119 DISCHARGE (CFS) = 0 TIME (MIN) = 126 DISCHARGE (CFS) = 0 TIME (MIN) = 133 DISCHARGE (CFS) = 0 TIME (MIN) = 140 DISCHARGE (CFS) = 0.1 TIME (MIN) = 147 DISCHARGE (CFS) = 0.1 TIME (MIN) = 154 DISCHARGE (CFS) = 0.1 TIME (MIN) = 161 DISCHARGE (CFS) = 0.1 TIME (MIN) = 168 DISCHARGE (CFS) = 0.1 TIME (MIN) = 175 DISCHARGE (CFS) = 0.1 TIME (MIN) = 182 DISCHARGE (CFS) = 0.1 TIME (MIN) = 189 DISCHARGE (CFS) = 0.1 TIME (MIN) = 196 DISCHARGE (CFS) = 0.1 TIME (MIN) = 203 DISCHARGE (CFS) = 0.1 TIME (MIN) = 210 DISCHARGE (CFS) = 0.1 TIME (MIN) = 217 DISCHARGE (CFS) = 0.1 TIME (MIN) = 224 DISCHARGE (CFS) = 0.1 TIME (MIN) = 231 DISCHARGE (CFS) = 0.2 TIME (MIN) = 238 DISCHARGE (CFS) = 0.3 TIME (MIN) = 245 DISCHARGE (CFS) = 1.08 TIME (MIN) = 252 DISCHARGE (CFS) = 0.2 TIME (MIN) = 259 DISCHARGE (CFS) = 0.1 TIME (MIN) = 266 DISCHARGE (CFS) = 0.1 TIME (MIN) = 273 DISCHARGE (CFS) = 0.1 TIME (MIN) = 280 DISCHARGE (CFS) = 0.1 TIME (MIN) = 287 DISCHARGE (CFS) = 0.1 TIME (MIN) = 294 DISCHARGE (CFS) = 0.1 TIME (MIN) = 301 DISCHARGE (CFS) = 0 TIME (MIN) = 308 DISCHARGE (CFS) = 0 TIME (MIN) = 315 DISCHARGE (CFS) = 0 TIME (MIN) = 322 DISCHARGE (CFS) = 0 TIME (MIN) = 329 DISCHARGE (CFS) = 0 TIME (MIN) = 336 DISCHARGE (CFS) = 0 TIME (MIN) = 343 DISCHARGE (CFS) = 0 TIME (MIN) = 350 DISCHARGE (CFS) = 0 TIME (MIN) = 357 DISCHARGE (CFS) = 0 TIME (MIN) = 364 DISCHARGE (CFS) = 0 You created this PDF from an application that is not licensed to print to novapdf printer (
127 Watershed Model Schematic Hydraflow Hydrographs Extension for AutoCAD Civil 3D 2015 by Autodesk, Inc. v Analysis Point Detention 2 Project: Det-2 YR 100.gpw Monday, 07 / 3 / 2017
128 Hydrograph Report 2 Hydraflow Hydrographs Extension for AutoCAD Civil 3D 2015 by Autodesk, Inc. v10.4 Monday, 07 / 3 / 2017 Hyd. No. 1 Analysis Point 1 Hydrograph type = Manual Peak discharge = cfs Storm frequency = 100 yrs Time to peak = 4.08 hrs Time interval = 7 min Hyd. volume = 1,546 cuft Analysis Point 1 Q (cfs) Hyd. No Year Q (cfs) Hyd No. 1 Time (hrs)
129 Hydrograph Report 3 Hydraflow Hydrographs Extension for AutoCAD Civil 3D 2015 by Autodesk, Inc. v10.4 Monday, 07 / 3 / 2017 Hyd. No. 2 Detention 2 Hydrograph type = Reservoir Peak discharge = cfs Storm frequency = 100 yrs Time to peak = 4.20 hrs Time interval = 7 min Hyd. volume = 735 cuft Inflow hyd. No. = 1 - Analysis Point 1 Max. Elevation = ft Reservoir name = Detention 2 Max. Storage = 875 cuft Storage Indication method used. Detention 2 Q (cfs) Hyd. No Year Q (cfs) Time (hrs) Hyd No. 2 Hyd No. 1 Total storage used = 875 cuft
130 Pond Report 4 Hydraflow Hydrographs Extension for AutoCAD Civil 3D 2015 by Autodesk, Inc. v10.4 Monday, 07 / 3 / 2017 Pond No. 1 - Detention 2 Pond Data Pond storage is based on user-defined values. Stage / Storage Table Stage (ft) Elevation (ft) Contour area (sqft) Incr. Storage (cuft) Total storage (cuft) n/a n/a n/a n/a Culvert / Orifice Structures Weir Structures [A] [B] [C] [PrfRsr] [A] [B] [C] [D] Rise (in) = 6.00 Inactive Inactive Inactive Span (in) = No. Barrels = Invert El. (ft) = Length (ft) = Slope (%) = n/a N-Value = n/a Orifice Coeff. = Multi-Stage = n/a Yes No No Crest Len (ft) = 3.14 Inactive Inactive Inactive Crest El. (ft) = Weir Coeff. = Weir Type = 1 Rect Multi-Stage = Yes No No No Exfil.(in/hr) = (by Wet area) TW Elev. (ft) = 0.00 Note: Culvert/Orifice outflows are analyzed under inlet (ic) and outlet (oc) control. Weir risers checked for orifice conditions (ic) and submergence (s). Stage / Storage / Discharge Table Stage Storage Elevation Clv A Clv B Clv C PrfRsr Wr A Wr B Wr C Wr D Exfil User Total ft cuft ft cfs cfs cfs cfs cfs cfs cfs cfs cfs cfs cfs oc s
131 RATIONAL METHOD HYDROGRAPH PROGRAM COPYRIGHT 1992, 2001 RICK ENGINEERING COMPANY RUN DATE 7/3/2017 HYDROGRAPH FILE NAME Text1 TIME OF CONCENTRATION 6 MIN. 6 HOUR RAINFALL 2.3 INCHES BASIN AREA 0.14 ACRES RUNOFF COEFFICIENT 0.57 PEAK DISCHARGE 0.46 CFS TIME (MIN) = 0 DISCHARGE (CFS) = 0 TIME (MIN) = 6 DISCHARGE (CFS) = 0 TIME (MIN) = 12 DISCHARGE (CFS) = 0 TIME (MIN) = 18 DISCHARGE (CFS) = 0 TIME (MIN) = 24 DISCHARGE (CFS) = 0 TIME (MIN) = 30 DISCHARGE (CFS) = 0 TIME (MIN) = 36 DISCHARGE (CFS) = 0 TIME (MIN) = 42 DISCHARGE (CFS) = 0 TIME (MIN) = 48 DISCHARGE (CFS) = 0 TIME (MIN) = 54 DISCHARGE (CFS) = 0 TIME (MIN) = 60 DISCHARGE (CFS) = 0 TIME (MIN) = 66 DISCHARGE (CFS) = 0 TIME (MIN) = 72 DISCHARGE (CFS) = 0 TIME (MIN) = 78 DISCHARGE (CFS) = 0 TIME (MIN) = 84 DISCHARGE (CFS) = 0 TIME (MIN) = 90 DISCHARGE (CFS) = 0 TIME (MIN) = 96 DISCHARGE (CFS) = 0 TIME (MIN) = 102 DISCHARGE (CFS) = 0 TIME (MIN) = 108 DISCHARGE (CFS) = 0 TIME (MIN) = 114 DISCHARGE (CFS) = 0 TIME (MIN) = 120 DISCHARGE (CFS) = 0 TIME (MIN) = 126 DISCHARGE (CFS) = 0 TIME (MIN) = 132 DISCHARGE (CFS) = 0 TIME (MIN) = 138 DISCHARGE (CFS) = 0 TIME (MIN) = 144 DISCHARGE (CFS) = 0 TIME (MIN) = 150 DISCHARGE (CFS) = 0 TIME (MIN) = 156 DISCHARGE (CFS) = 0 TIME (MIN) = 162 DISCHARGE (CFS) = 0 TIME (MIN) = 168 DISCHARGE (CFS) = 0 TIME (MIN) = 174 DISCHARGE (CFS) = 0 TIME (MIN) = 180 DISCHARGE (CFS) = 0 TIME (MIN) = 186 DISCHARGE (CFS) = 0 TIME (MIN) = 192 DISCHARGE (CFS) = 0 TIME (MIN) = 198 DISCHARGE (CFS) = 0 TIME (MIN) = 204 DISCHARGE (CFS) = 0 TIME (MIN) = 210 DISCHARGE (CFS) = 0 TIME (MIN) = 216 DISCHARGE (CFS) = 0 TIME (MIN) = 222 DISCHARGE (CFS) = 0.1 TIME (MIN) = 228 DISCHARGE (CFS) = 0.1 TIME (MIN) = 234 DISCHARGE (CFS) = 0.1 TIME (MIN) = 240 DISCHARGE (CFS) = 0.1 TIME (MIN) = 246 DISCHARGE (CFS) = 0.46 TIME (MIN) = 252 DISCHARGE (CFS) = 0.1 TIME (MIN) = 258 DISCHARGE (CFS) = 0 TIME (MIN) = 264 DISCHARGE (CFS) = 0 TIME (MIN) = 270 DISCHARGE (CFS) = 0 TIME (MIN) = 276 DISCHARGE (CFS) = 0 TIME (MIN) = 282 DISCHARGE (CFS) = 0 TIME (MIN) = 288 DISCHARGE (CFS) = 0 TIME (MIN) = 294 DISCHARGE (CFS) = 0 TIME (MIN) = 300 DISCHARGE (CFS) = 0 TIME (MIN) = 306 DISCHARGE (CFS) = 0 TIME (MIN) = 312 DISCHARGE (CFS) = 0 TIME (MIN) = 318 DISCHARGE (CFS) = 0 TIME (MIN) = 324 DISCHARGE (CFS) = 0 TIME (MIN) = 330 DISCHARGE (CFS) = 0 TIME (MIN) = 336 DISCHARGE (CFS) = 0 TIME (MIN) = 342 DISCHARGE (CFS) = 0 TIME (MIN) = 348 DISCHARGE (CFS) = 0 TIME (MIN) = 354 DISCHARGE (CFS) = 0 TIME (MIN) = 360 DISCHARGE (CFS) = 0 TIME (MIN) = 366 DISCHARGE (CFS) = 0 You created this PDF from an application that is not licensed to print to novapdf printer (
132 Watershed Model Schematic Hydraflow Hydrographs Extension for AutoCAD Civil 3D 2015 by Autodesk, Inc. v Analysis Point Detention 3 Project: Det-3 YR 100.gpw Monday, 07 / 3 / 2017
133 Hydrograph Report 2 Hydraflow Hydrographs Extension for AutoCAD Civil 3D 2015 by Autodesk, Inc. v10.4 Monday, 07 / 3 / 2017 Hyd. No. 1 Analysis Point 1 Hydrograph type = Manual Peak discharge = cfs Storm frequency = 100 yrs Time to peak = 4.10 hrs Time interval = 6 min Hyd. volume = 346 cuft Analysis Point 1 Q (cfs) Hyd. No Year Q (cfs) Hyd No. 1 Time (hrs)
134 Hydrograph Report 3 Hydraflow Hydrographs Extension for AutoCAD Civil 3D 2015 by Autodesk, Inc. v10.4 Monday, 07 / 3 / 2017 Hyd. No. 2 Detention 3 Hydrograph type = Reservoir Peak discharge = cfs Storm frequency = 100 yrs Time to peak = 4.20 hrs Time interval = 6 min Hyd. volume = 190 cuft Inflow hyd. No. = 1 - Analysis Point 1 Max. Elevation = ft Reservoir name = Detention 3 Max. Storage = 196 cuft Storage Indication method used. Detention 3 Q (cfs) Hyd. No Year Q (cfs) Time (hrs) Hyd No. 2 Hyd No. 1 Total storage used = 196 cuft
135 Pond Report 4 Hydraflow Hydrographs Extension for AutoCAD Civil 3D 2015 by Autodesk, Inc. v10.4 Monday, 07 / 3 / 2017 Pond No. 1 - Detention 3 Pond Data Pond storage is based on user-defined values. Stage / Storage Table Stage (ft) Elevation (ft) Contour area (sqft) Incr. Storage (cuft) Total storage (cuft) n/a n/a n/a Culvert / Orifice Structures Weir Structures [A] [B] [C] [PrfRsr] [A] [B] [C] [D] Rise (in) Inactive Inactive Inactive Inactive Span (in) = No. Barrels = Invert El. (ft) = Length (ft) = Slope (%) = n/a N-Value = n/a Orifice Coeff. = Multi-Stage = n/a Yes No No Crest Len (ft) Inactive 1.00 Inactive Inactive Crest El. (ft) = Weir Coeff. = Weir Type = 1 Rect Multi-Stage = Yes No No No Exfil.(in/hr) = (by Wet area) TW Elev. (ft) = 0.00 Note: Culvert/Orifice outflows are analyzed under inlet (ic) and outlet (oc) control. Weir risers checked for orifice conditions (ic) and submergence (s). Stage / Storage / Discharge Table Stage Storage Elevation Clv A Clv B Clv C PrfRsr Wr A Wr B Wr C Wr D Exfil User Total ft cuft ft cfs cfs cfs cfs cfs cfs cfs cfs cfs cfs cfs
136 RATIONAL METHOD HYDROGRAPH PROGRAM COPYRIGHT 1992, 2001 RICK ENGINEERING COMPANY RUN DATE 7/3/2017 HYDROGRAPH FILE NAME Text1 TIME OF CONCENTRATION 5 MIN. 6 HOUR RAINFALL 2.3 INCHES BASIN AREA 0.11 ACRES RUNOFF COEFFICIENT 0.57 PEAK DISCHARGE 0.29 CFS TIME (MIN) = 0 DISCHARGE (CFS) = 0 TIME (MIN) = 5 DISCHARGE (CFS) = 0 TIME (MIN) = 10 DISCHARGE (CFS) = 0 TIME (MIN) = 15 DISCHARGE (CFS) = 0 TIME (MIN) = 20 DISCHARGE (CFS) = 0 TIME (MIN) = 25 DISCHARGE (CFS) = 0 TIME (MIN) = 30 DISCHARGE (CFS) = 0 TIME (MIN) = 35 DISCHARGE (CFS) = 0 TIME (MIN) = 40 DISCHARGE (CFS) = 0 TIME (MIN) = 45 DISCHARGE (CFS) = 0 TIME (MIN) = 50 DISCHARGE (CFS) = 0 TIME (MIN) = 55 DISCHARGE (CFS) = 0 TIME (MIN) = 60 DISCHARGE (CFS) = 0 TIME (MIN) = 65 DISCHARGE (CFS) = 0 TIME (MIN) = 70 DISCHARGE (CFS) = 0 TIME (MIN) = 75 DISCHARGE (CFS) = 0 TIME (MIN) = 80 DISCHARGE (CFS) = 0 TIME (MIN) = 85 DISCHARGE (CFS) = 0 TIME (MIN) = 90 DISCHARGE (CFS) = 0 TIME (MIN) = 95 DISCHARGE (CFS) = 0 TIME (MIN) = 100 DISCHARGE (CFS) = 0 TIME (MIN) = 105 DISCHARGE (CFS) = 0 TIME (MIN) = 110 DISCHARGE (CFS) = 0 TIME (MIN) = 115 DISCHARGE (CFS) = 0 TIME (MIN) = 120 DISCHARGE (CFS) = 0 TIME (MIN) = 125 DISCHARGE (CFS) = 0 TIME (MIN) = 130 DISCHARGE (CFS) = 0 TIME (MIN) = 135 DISCHARGE (CFS) = 0 TIME (MIN) = 140 DISCHARGE (CFS) = 0 TIME (MIN) = 145 DISCHARGE (CFS) = 0 TIME (MIN) = 150 DISCHARGE (CFS) = 0 TIME (MIN) = 155 DISCHARGE (CFS) = 0 TIME (MIN) = 160 DISCHARGE (CFS) = 0 TIME (MIN) = 165 DISCHARGE (CFS) = 0 TIME (MIN) = 170 DISCHARGE (CFS) = 0 TIME (MIN) = 175 DISCHARGE (CFS) = 0 TIME (MIN) = 180 DISCHARGE (CFS) = 0 TIME (MIN) = 185 DISCHARGE (CFS) = 0 TIME (MIN) = 190 DISCHARGE (CFS) = 0 TIME (MIN) = 195 DISCHARGE (CFS) = 0 TIME (MIN) = 200 DISCHARGE (CFS) = 0 TIME (MIN) = 205 DISCHARGE (CFS) = 0 TIME (MIN) = 210 DISCHARGE (CFS) = 0 TIME (MIN) = 215 DISCHARGE (CFS) = 0 TIME (MIN) = 220 DISCHARGE (CFS) = 0 TIME (MIN) = 225 DISCHARGE (CFS) = 0 TIME (MIN) = 230 DISCHARGE (CFS) = 0.1 TIME (MIN) = 235 DISCHARGE (CFS) = 0.1 TIME (MIN) = 240 DISCHARGE (CFS) = 0.2 TIME (MIN) = 245 DISCHARGE (CFS) = 0.29 TIME (MIN) = 250 DISCHARGE (CFS) = 0.1 TIME (MIN) = 255 DISCHARGE (CFS) = 0 TIME (MIN) = 260 DISCHARGE (CFS) = 0 TIME (MIN) = 265 DISCHARGE (CFS) = 0 TIME (MIN) = 270 DISCHARGE (CFS) = 0 TIME (MIN) = 275 DISCHARGE (CFS) = 0 TIME (MIN) = 280 DISCHARGE (CFS) = 0 TIME (MIN) = 285 DISCHARGE (CFS) = 0 TIME (MIN) = 290 DISCHARGE (CFS) = 0 TIME (MIN) = 295 DISCHARGE (CFS) = 0 TIME (MIN) = 300 DISCHARGE (CFS) = 0 TIME (MIN) = 305 DISCHARGE (CFS) = 0 TIME (MIN) = 310 DISCHARGE (CFS) = 0 TIME (MIN) = 315 DISCHARGE (CFS) = 0 TIME (MIN) = 320 DISCHARGE (CFS) = 0 TIME (MIN) = 325 DISCHARGE (CFS) = 0 TIME (MIN) = 330 DISCHARGE (CFS) = 0 TIME (MIN) = 335 DISCHARGE (CFS) = 0 TIME (MIN) = 340 DISCHARGE (CFS) = 0 TIME (MIN) = 345 DISCHARGE (CFS) = 0 TIME (MIN) = 350 DISCHARGE (CFS) = 0 TIME (MIN) = 355 DISCHARGE (CFS) = 0 TIME You (MIN) created = 360 this PDF DISCHARGE from an application (CFS) = 0 that is not licensed to print to novapdf printer (
137 Watershed Model Schematic Hydraflow Hydrographs Extension for AutoCAD Civil 3D 2015 by Autodesk, Inc. v Analysis Point Detention 4/5 Project: Det-4-5 YR 100.gpw Monday, 07 / 3 / 2017
138 Hydrograph Report 2 Hydraflow Hydrographs Extension for AutoCAD Civil 3D 2015 by Autodesk, Inc. v10.4 Monday, 07 / 3 / 2017 Hyd. No. 1 Analysis Point 1 Hydrograph type = Manual Peak discharge = cfs Storm frequency = 100 yrs Time to peak = 4.08 hrs Time interval = 5 min Hyd. volume = 237 cuft Analysis Point 1 Q (cfs) Hyd. No Year Q (cfs) Hyd No. 1 Time (hrs)
139 Hydrograph Report 3 Hydraflow Hydrographs Extension for AutoCAD Civil 3D 2015 by Autodesk, Inc. v10.4 Monday, 07 / 3 / 2017 Hyd. No. 2 Detention 4/5 Hydrograph type = Reservoir Peak discharge = cfs Storm frequency = 100 yrs Time to peak = 4.17 hrs Time interval = 5 min Hyd. volume = 111 cuft Inflow hyd. No. = 1 - Analysis Point 1 Max. Elevation = ft Reservoir name = Detention 4/5 Max. Storage = 143 cuft Storage Indication method used. Detention 4/5 Q (cfs) Hyd. No Year Q (cfs) Time (hrs) Hyd No. 2 Hyd No. 1 Total storage used = 143 cuft
140 Pond Report 4 Hydraflow Hydrographs Extension for AutoCAD Civil 3D 2015 by Autodesk, Inc. v10.4 Monday, 07 / 3 / 2017 Pond No. 1 - Detention 4/5 Pond Data Pond storage is based on user-defined values. Stage / Storage Table Stage (ft) Elevation (ft) Contour area (sqft) Incr. Storage (cuft) Total storage (cuft) n/a n/a n/a Culvert / Orifice Structures Weir Structures [A] [B] [C] [PrfRsr] [A] [B] [C] [D] Rise (in) Inactive Inactive Inactive Inactive Span (in) = No. Barrels = Invert El. (ft) = Length (ft) = Slope (%) = n/a N-Value = n/a Orifice Coeff. = Multi-Stage = n/a Yes No No Crest Len (ft) Inactive 1.00 Inactive Inactive Crest El. (ft) = Weir Coeff. = Weir Type = 1 Rect Multi-Stage = Yes No No No Exfil.(in/hr) = (by Wet area) TW Elev. (ft) = 0.00 Note: Culvert/Orifice outflows are analyzed under inlet (ic) and outlet (oc) control. Weir risers checked for orifice conditions (ic) and submergence (s). Stage / Storage / Discharge Table Stage Storage Elevation Clv A Clv B Clv C PrfRsr Wr A Wr B Wr C Wr D Exfil User Total ft cuft ft cfs cfs cfs cfs cfs cfs cfs cfs cfs cfs cfs
141 RATIONAL METHOD HYDROGRAPH PROGRAM COPYRIGHT 1992, 2001 RICK ENGINEERING COMPANY RUN DATE 7/3/2017 HYDROGRAPH FILE NAME Text1 TIME OF CONCENTRATION 5 MIN. 6 HOUR RAINFALL 2.3 INCHES BASIN AREA 0.15 ACRES RUNOFF COEFFICIENT 0.57 PEAK DISCHARGE 0.39 CFS TIME (MIN) = 0 DISCHARGE (CFS) = 0 TIME (MIN) = 5 DISCHARGE (CFS) = 0 TIME (MIN) = 10 DISCHARGE (CFS) = 0 TIME (MIN) = 15 DISCHARGE (CFS) = 0 TIME (MIN) = 20 DISCHARGE (CFS) = 0 TIME (MIN) = 25 DISCHARGE (CFS) = 0 TIME (MIN) = 30 DISCHARGE (CFS) = 0 TIME (MIN) = 35 DISCHARGE (CFS) = 0 TIME (MIN) = 40 DISCHARGE (CFS) = 0 TIME (MIN) = 45 DISCHARGE (CFS) = 0 TIME (MIN) = 50 DISCHARGE (CFS) = 0 TIME (MIN) = 55 DISCHARGE (CFS) = 0 TIME (MIN) = 60 DISCHARGE (CFS) = 0 TIME (MIN) = 65 DISCHARGE (CFS) = 0 TIME (MIN) = 70 DISCHARGE (CFS) = 0 TIME (MIN) = 75 DISCHARGE (CFS) = 0 TIME (MIN) = 80 DISCHARGE (CFS) = 0 TIME (MIN) = 85 DISCHARGE (CFS) = 0 TIME (MIN) = 90 DISCHARGE (CFS) = 0 TIME (MIN) = 95 DISCHARGE (CFS) = 0 TIME (MIN) = 100 DISCHARGE (CFS) = 0 TIME (MIN) = 105 DISCHARGE (CFS) = 0 TIME (MIN) = 110 DISCHARGE (CFS) = 0 TIME (MIN) = 115 DISCHARGE (CFS) = 0 TIME (MIN) = 120 DISCHARGE (CFS) = 0 TIME (MIN) = 125 DISCHARGE (CFS) = 0 TIME (MIN) = 130 DISCHARGE (CFS) = 0 TIME (MIN) = 135 DISCHARGE (CFS) = 0 TIME (MIN) = 140 DISCHARGE (CFS) = 0 TIME (MIN) = 145 DISCHARGE (CFS) = 0 TIME (MIN) = 150 DISCHARGE (CFS) = 0 TIME (MIN) = 155 DISCHARGE (CFS) = 0 TIME (MIN) = 160 DISCHARGE (CFS) = 0 TIME (MIN) = 165 DISCHARGE (CFS) = 0 TIME (MIN) = 170 DISCHARGE (CFS) = 0 TIME (MIN) = 175 DISCHARGE (CFS) = 0 TIME (MIN) = 180 DISCHARGE (CFS) = 0 TIME (MIN) = 185 DISCHARGE (CFS) = 0 TIME (MIN) = 190 DISCHARGE (CFS) = 0 TIME (MIN) = 195 DISCHARGE (CFS) = 0 TIME (MIN) = 200 DISCHARGE (CFS) = 0 TIME (MIN) = 205 DISCHARGE (CFS) = 0 TIME (MIN) = 210 DISCHARGE (CFS) = 0 TIME (MIN) = 215 DISCHARGE (CFS) = 0 TIME (MIN) = 220 DISCHARGE (CFS) = 0.1 TIME (MIN) = 225 DISCHARGE (CFS) = 0.1 TIME (MIN) = 230 DISCHARGE (CFS) = 0.1 TIME (MIN) = 235 DISCHARGE (CFS) = 0.1 TIME (MIN) = 240 DISCHARGE (CFS) = 0.3 TIME (MIN) = 245 DISCHARGE (CFS) = 0.39 TIME (MIN) = 250 DISCHARGE (CFS) = 0.1 TIME (MIN) = 255 DISCHARGE (CFS) = 0.1 TIME (MIN) = 260 DISCHARGE (CFS) = 0 TIME (MIN) = 265 DISCHARGE (CFS) = 0 TIME (MIN) = 270 DISCHARGE (CFS) = 0 TIME (MIN) = 275 DISCHARGE (CFS) = 0 TIME (MIN) = 280 DISCHARGE (CFS) = 0 TIME (MIN) = 285 DISCHARGE (CFS) = 0 TIME (MIN) = 290 DISCHARGE (CFS) = 0 TIME (MIN) = 295 DISCHARGE (CFS) = 0 TIME (MIN) = 300 DISCHARGE (CFS) = 0 TIME (MIN) = 305 DISCHARGE (CFS) = 0 TIME (MIN) = 310 DISCHARGE (CFS) = 0 TIME (MIN) = 315 DISCHARGE (CFS) = 0 TIME (MIN) = 320 DISCHARGE (CFS) = 0 TIME (MIN) = 325 DISCHARGE (CFS) = 0 TIME (MIN) = 330 DISCHARGE (CFS) = 0 TIME (MIN) = 335 DISCHARGE (CFS) = 0 TIME (MIN) = 340 DISCHARGE (CFS) = 0 TIME (MIN) = 345 DISCHARGE (CFS) = 0 TIME (MIN) = 350 DISCHARGE (CFS) = 0 TIME (MIN) = 355 DISCHARGE (CFS) = 0 TIME You (MIN) created = 360 this PDF DISCHARGE from an application (CFS) = 0 that is not licensed to print to novapdf printer (
142 Watershed Model Schematic Hydraflow Hydrographs Extension for AutoCAD Civil 3D 2015 by Autodesk, Inc. v Analysis Point Detention 6 Project: Det-6 YR 100.gpw Monday, 07 / 3 / 2017
143 Hydrograph Report 2 Hydraflow Hydrographs Extension for AutoCAD Civil 3D 2015 by Autodesk, Inc. v10.4 Monday, 07 / 3 / 2017 Hyd. No. 1 Analysis Point 1 Hydrograph type = Manual Peak discharge = cfs Storm frequency = 100 yrs Time to peak = 4.08 hrs Time interval = 5 min Hyd. volume = 387 cuft Analysis Point 1 Q (cfs) Hyd. No Year Q (cfs) Hyd No. 1 Time (hrs)
144 Hydrograph Report 3 Hydraflow Hydrographs Extension for AutoCAD Civil 3D 2015 by Autodesk, Inc. v10.4 Monday, 07 / 3 / 2017 Hyd. No. 2 Detention 6 Hydrograph type = Reservoir Peak discharge = cfs Storm frequency = 100 yrs Time to peak = 4.17 hrs Time interval = 5 min Hyd. volume = 132 cuft Inflow hyd. No. = 1 - Analysis Point 1 Max. Elevation = ft Reservoir name = Detention 6 Max. Storage = 291 cuft Storage Indication method used. Detention 6 Q (cfs) Hyd. No Year Q (cfs) Time (hrs) Hyd No. 2 Hyd No. 1 Total storage used = 291 cuft
145 Pond Report 4 Hydraflow Hydrographs Extension for AutoCAD Civil 3D 2015 by Autodesk, Inc. v10.4 Monday, 07 / 3 / 2017 Pond No. 1 - Detention 6 Pond Data Pond storage is based on user-defined values. Stage / Storage Table Stage (ft) Elevation (ft) Contour area (sqft) Incr. Storage (cuft) Total storage (cuft) n/a n/a n/a Culvert / Orifice Structures Weir Structures [A] [B] [C] [PrfRsr] [A] [B] [C] [D] Rise (in) Inactive Inactive Inactive Inactive Span (in) = No. Barrels = Invert El. (ft) = Length (ft) = Slope (%) = n/a N-Value = n/a Orifice Coeff. = Multi-Stage = n/a Yes No No Crest Len (ft) Inactive 1.00 Inactive Inactive Crest El. (ft) = Weir Coeff. = Weir Type = 1 Rect Multi-Stage = Yes No No No Exfil.(in/hr) = (by Wet area) TW Elev. (ft) = 0.00 Note: Culvert/Orifice outflows are analyzed under inlet (ic) and outlet (oc) control. Weir risers checked for orifice conditions (ic) and submergence (s). Stage / Storage / Discharge Table Stage Storage Elevation Clv A Clv B Clv C PrfRsr Wr A Wr B Wr C Wr D Exfil User Total ft cuft ft cfs cfs cfs cfs cfs cfs cfs cfs cfs cfs cfs
146 RATIONAL METHOD HYDROGRAPH PROGRAM COPYRIGHT 1992, 2001 RICK ENGINEERING COMPANY RUN DATE 7/3/2017 HYDROGRAPH FILE NAME Text1 TIME OF CONCENTRATION 7 MIN. 6 HOUR RAINFALL 2.3 INCHES BASIN AREA 0.74 ACRES RUNOFF COEFFICIENT 0.57 PEAK DISCHARGE 1.97 CFS TIME (MIN) = 0 DISCHARGE (CFS) = 0 TIME (MIN) = 7 DISCHARGE (CFS) = 0.1 TIME (MIN) = 14 DISCHARGE (CFS) = 0.1 TIME (MIN) = 21 DISCHARGE (CFS) = 0.1 TIME (MIN) = 28 DISCHARGE (CFS) = 0.1 TIME (MIN) = 35 DISCHARGE (CFS) = 0.1 TIME (MIN) = 42 DISCHARGE (CFS) = 0.1 TIME (MIN) = 49 DISCHARGE (CFS) = 0.1 TIME (MIN) = 56 DISCHARGE (CFS) = 0.1 TIME (MIN) = 63 DISCHARGE (CFS) = 0.1 TIME (MIN) = 70 DISCHARGE (CFS) = 0.1 TIME (MIN) = 77 DISCHARGE (CFS) = 0.1 TIME (MIN) = 84 DISCHARGE (CFS) = 0.1 TIME (MIN) = 91 DISCHARGE (CFS) = 0.1 TIME (MIN) = 98 DISCHARGE (CFS) = 0.1 TIME (MIN) = 105 DISCHARGE (CFS) = 0.1 TIME (MIN) = 112 DISCHARGE (CFS) = 0.1 TIME (MIN) = 119 DISCHARGE (CFS) = 0.1 TIME (MIN) = 126 DISCHARGE (CFS) = 0.1 TIME (MIN) = 133 DISCHARGE (CFS) = 0.1 TIME (MIN) = 140 DISCHARGE (CFS) = 0.1 TIME (MIN) = 147 DISCHARGE (CFS) = 0.1 TIME (MIN) = 154 DISCHARGE (CFS) = 0.1 TIME (MIN) = 161 DISCHARGE (CFS) = 0.1 TIME (MIN) = 168 DISCHARGE (CFS) = 0.1 TIME (MIN) = 175 DISCHARGE (CFS) = 0.1 TIME (MIN) = 182 DISCHARGE (CFS) = 0.1 TIME (MIN) = 189 DISCHARGE (CFS) = 0.2 TIME (MIN) = 196 DISCHARGE (CFS) = 0.2 TIME (MIN) = 203 DISCHARGE (CFS) = 0.2 TIME (MIN) = 210 DISCHARGE (CFS) = 0.2 TIME (MIN) = 217 DISCHARGE (CFS) = 0.2 TIME (MIN) = 224 DISCHARGE (CFS) = 0.3 TIME (MIN) = 231 DISCHARGE (CFS) = 0.4 TIME (MIN) = 238 DISCHARGE (CFS) = 0.7 TIME (MIN) = 245 DISCHARGE (CFS) = 1.97 TIME (MIN) = 252 DISCHARGE (CFS) = 0.3 TIME (MIN) = 259 DISCHARGE (CFS) = 0.2 TIME (MIN) = 266 DISCHARGE (CFS) = 0.2 TIME (MIN) = 273 DISCHARGE (CFS) = 0.1 TIME (MIN) = 280 DISCHARGE (CFS) = 0.1 TIME (MIN) = 287 DISCHARGE (CFS) = 0.1 TIME (MIN) = 294 DISCHARGE (CFS) = 0.1 TIME (MIN) = 301 DISCHARGE (CFS) = 0.1 TIME (MIN) = 308 DISCHARGE (CFS) = 0.1 TIME (MIN) = 315 DISCHARGE (CFS) = 0.1 TIME (MIN) = 322 DISCHARGE (CFS) = 0.1 TIME (MIN) = 329 DISCHARGE (CFS) = 0.1 TIME (MIN) = 336 DISCHARGE (CFS) = 0.1 TIME (MIN) = 343 DISCHARGE (CFS) = 0.1 TIME (MIN) = 350 DISCHARGE (CFS) = 0.1 TIME (MIN) = 357 DISCHARGE (CFS) = 0.1 TIME (MIN) = 364 DISCHARGE (CFS) = 0 You created this PDF from an application that is not licensed to print to novapdf printer (
147 Watershed Model Schematic Hydraflow Hydrographs Extension for AutoCAD Civil 3D 2015 by Autodesk, Inc. v Analysis Point Detention 7 Project: Det-7 YR 100.gpw Monday, 07 / 3 / 2017
148 Hydrograph Report 2 Hydraflow Hydrographs Extension for AutoCAD Civil 3D 2015 by Autodesk, Inc. v10.4 Monday, 07 / 3 / 2017 Hyd. No. 1 Analysis Point 1 Hydrograph type = Manual Peak discharge = cfs Storm frequency = 100 yrs Time to peak = 4.20 hrs Time interval = 7 min Hyd. volume = 3,809 cuft Analysis Point 1 Q (cfs) Hyd. No Year Q (cfs) Hyd No. 1 Time (hrs)
149 Hydrograph Report 3 Hydraflow Hydrographs Extension for AutoCAD Civil 3D 2015 by Autodesk, Inc. v10.4 Monday, 07 / 3 / 2017 Hyd. No. 2 Detention 7 Hydrograph type = Reservoir Peak discharge = cfs Storm frequency = 100 yrs Time to peak = 4.32 hrs Time interval = 7 min Hyd. volume = 3,766 cuft Inflow hyd. No. = 1 - Analysis Point 1 Max. Elevation = ft Reservoir name = Detention 7 Max. Storage = 2,390 cuft Storage Indication method used. Detention 7 Q (cfs) Hyd. No Year Q (cfs) Time (hrs) Hyd No. 2 Hyd No. 1 Total storage used = 2,390 cuft
150 Pond Report 4 Hydraflow Hydrographs Extension for AutoCAD Civil 3D 2015 by Autodesk, Inc. v10.4 Monday, 07 / 3 / 2017 Pond No. 1 - Detention 7 Pond Data Pond storage is based on user-defined values. Stage / Storage Table Stage (ft) Elevation (ft) Contour area (sqft) Incr. Storage (cuft) Total storage (cuft) n/a n/a n/a 800 1, n/a 800 2,400 Culvert / Orifice Structures Weir Structures [A] [B] [C] [PrfRsr] [A] [B] [C] [D] Rise (in) = Inactive Inactive Span (in) = No. Barrels = Invert El. (ft) = Length (ft) = Slope (%) = n/a N-Value = n/a Orifice Coeff. = Multi-Stage = n/a Yes No No Crest Len (ft) = 3.14 Inactive Inactive Inactive Crest El. (ft) = Weir Coeff. = Weir Type = 1 Rect Multi-Stage = Yes No No No Exfil.(in/hr) = (by Wet area) TW Elev. (ft) = 0.00 Note: Culvert/Orifice outflows are analyzed under inlet (ic) and outlet (oc) control. Weir risers checked for orifice conditions (ic) and submergence (s). Stage / Storage / Discharge Table Stage Storage Elevation Clv A Clv B Clv C PrfRsr Wr A Wr B Wr C Wr D Exfil User Total ft cuft ft cfs cfs cfs cfs cfs cfs cfs cfs cfs cfs cfs ic 0.01 ic , ic 0.01 ic , ic 0.01 ic
151
152 Weir Report Hydraflow Express Extension for Autodesk AutoCAD Civil 3D by Autodesk, Inc. Monday, Jul Detention 1 Rectangular Weir Crest = Broad Bottom Length (ft) = 1.00 Total Depth (ft) = 0.50 Calculations Weir Coeff. Cw = 2.60 Compute by: Known Q Known Q (cfs) = 0.52 Highlighted Depth (ft) = 0.34 Q (cfs) = Area (sqft) = 0.34 Velocity (ft/s) = 1.52 Top Width (ft) = 1.00 Depth (ft) Detention 1 Depth (ft) Weir W.S. Length (ft)
153 Weir Report Hydraflow Express Extension for Autodesk AutoCAD Civil 3D by Autodesk, Inc. Monday, Jul Detention 2 Rectangular Weir Crest = Broad Bottom Length (ft) = 1.00 Total Depth (ft) = 0.75 Calculations Weir Coeff. Cw = 2.60 Compute by: Known Q Known Q (cfs) = 1.08 Highlighted Depth (ft) = 0.56 Q (cfs) = Area (sqft) = 0.56 Velocity (ft/s) = 1.94 Top Width (ft) = 1.00 Depth (ft) Detention 2 Depth (ft) Weir W.S. Length (ft)
154 Weir Report Hydraflow Express Extension for Autodesk AutoCAD Civil 3D by Autodesk, Inc. Monday, Jul Detention 7 Rectangular Weir Crest = Broad Bottom Length (ft) = 3.14 Total Depth (ft) = 0.50 Calculations Weir Coeff. Cw = 2.60 Compute by: Known Q Known Q (cfs) = 1.97 Highlighted Depth (ft) = 0.39 Q (cfs) = Area (sqft) = 1.22 Velocity (ft/s) = 1.62 Top Width (ft) = 3.14 Depth (ft) Detention 7 Depth (ft) Weir W.S. Length (ft)
155 APPENDIX D: Hydrologic Information
156
157
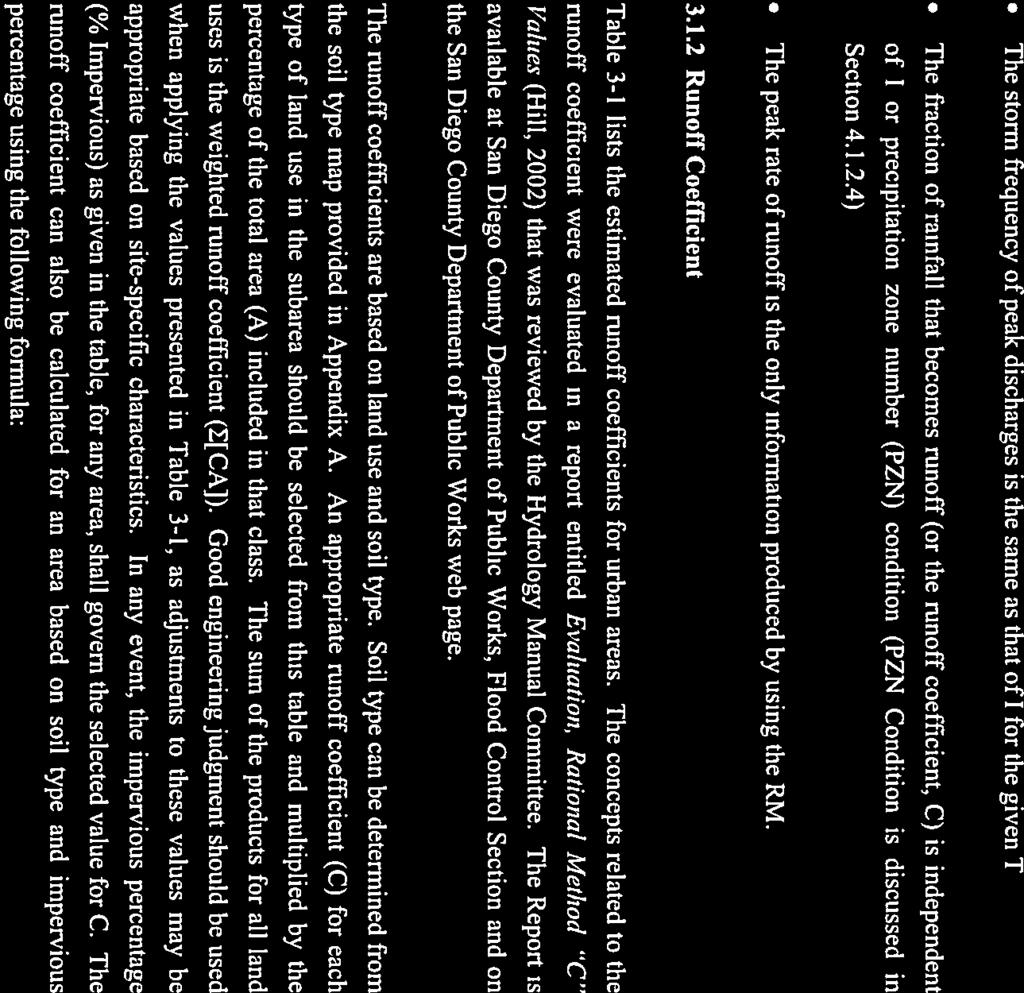
158
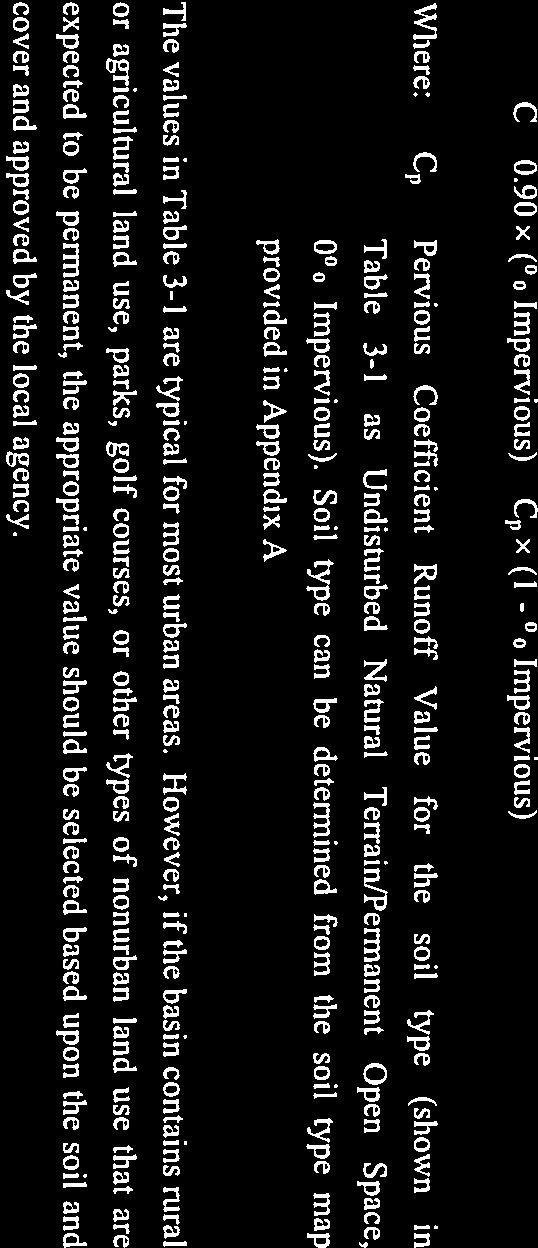
159
160
161 I SPECIAL PROGRAM REQUIREMENTS Page 6 of 124 9/29/ HANDICAPPED ACCESS a. Provide site and building access to physically handicapped persons in accordance with the requirements of California Code of Regulations, Title 24, and Uniform Federal Accessibility Standards as applicable. 2. PHYSICAL PLANNING Physical Planning is responsible for overseeing land use planning for the UCSD Campus, including Scripps Institution of Oceanography and the Medical Centers, and site planning for some renovation projects. Included within this scope of responsibility is urban planning, landscape planning, environmental reporting and monitoring, signage, implementation of the campus s 2004 Long Range Development Plan (LRDP) PlansStudiesProjects/LRDP2004/Default.htm and oversight of the process and production of neighborhood planning studies that extend, refine and, when necessary, amend the land use and design guidelines set forth in the 1989 UCSD Master Plan A Planner is usually designated to the project. b. Environmental Review 1) A standing duty of Physical Planning is the conduct of environmental impact reviews, in accordance with the guidelines established by the California Environmental Quality Act (CEQA), from initiation of environmental classification forms (EICs) through certification by The Regents and filing with the State Clearinghouse. An Environmental Planner is usually designated to the project and may require information from the design team to produce the environmental report for the project. 2) During design, care must be taken to adhere to the project environmental requirements. These requirements could include limits of grading, storm water treatment and discharge, and scheduling restrictions due to noise limits, geotechnical considerations and prohibition of vegetation removal during certain times of the year due to biological habitat. c. Coastal Commission permitting 1) Approximately half of the main campus acreage lies within the California Coastal Zone ( The boundary of the zone runs north along Torrey Pines Road and North Torrey Pines Road to the intersection of La Jolla Shores Drive, northeast to Voigt Drive and Interstate 5, then north along Interstate 5. Development within the seaward areas north and west of this boundary line is contingent upon the California Coastal Commission s review of the proposed project and granting of the requisite permit. 2) Development proposals within the Coastal Zone should be reviewed as early as possible in the design process with Government and Community Relations staff. Early review and coordination will facilitate timely processing. 3. GEOTECHNICAL REPORT a. The University shall provide a geotechnical report for all projects. Typically, the consultant structural engineer will provide a sketch of where the boreholes and other information are needed. The geotechnical consultant will evaluate existing reports which can be obtained from FD&C. The site investigation data gathered are then translated into recommendations for: 1) Site preparation, such as compaction or replacing existing unsuitable soils. 2) Bearing loads for foundation designs and the predicted settlement and soil design parameters for retaining walls. 3) Dealing with ground water and surface water as they may affect construction operations and the finished project. 4) Road pavement thickness design. b. It is recommended that the geotechnical engineer review the construction documents and submittals for compliance with the recommendations made in the Geotechnical Report. The Geotechnical Consultant should be present during construction excavation in order to verify that actual conditions agree with the anticipated conditions. c. The Geotechnical Consultant should provide a final construction report. d. Environmental Site Assessment and Soils Management Policy Prior to construction of a building on the UCSD Campus an Environmental Site Assessment is required to determine the presence of hazardous materials/wastes/ammunitions on a proposed project site. Samples should be collected in accordance with industry-standard ASTM recommendations, and the samples be analyzed using USEPA-approved methods, and the results be included in the Geotechnical Report in an Appendix. Project location and historical site activities will guide the sampling scheme. Based on the attached figure of the Camp Mathews Boundary [LINK], if the project is located inside the historic Camp Matthews boundary, samples shall be taken based on horizontal grid of the site into 100 foot by 100 foot blocks (approximately ¼ acre each) or as directed by FD&C who will consult with EH&S. If the project does not fall inside the Camp Matthews boundary, samples shall be taken from the boreholes for the geotechnical report. The following guidelines apply to the sampling: 1) All chemical analyses must be performed by State of California certified laboratories. 2) At a minimum, perform the following soil sampling and analyses: a) Collect soil samples from each of the locations using appropriate methods (hollow stem auger, push rig, hand auger, etc.) at approximately 2 feet below surface, 5 feet below surface and at 5 foot intervals thereafter to the bottom elevation of the proposed excavation. b) Analyze all samples for the following constituents: Total Petroleum Hydrocarbons (TPH) Extended Range (C8-C40) by EPA Method 8015 Modified. California Toxic Metals Total Concentration for Antimony, Arsenic, Barium, Beryllium, Cadmium, Chromium, Cobalt, Copper, Lead, Mercury, Molybdenum, Nickel, Selenium, Silver, Thallium, Vanadium, and Zinc. c) Explosives by EPA Method d) Submit laboratory results to FD&C who will forward them to EH&S for review, which will provide recommendations for further investigation and remedial actions, if necessary. e) Containerize soil cuttings from the borings and backfill with slurry mixture, following DEH criteria. Characterize soil cuttings for offsite disposal. f) Coordinate offsite soil disposal. 3) The results of the analyses of the soil sampling will be included in the geotechnical report as an appendices signed by a registered geologist or environmental scientist. All the technical data gathered during the course of the study, a map of the sampling locations, and any other applicable information should be included. The report will be provided as a hardcopy and in electronic format. 4) Buildings or sites with asbestos, lead paint, PCB containing light ballasts, underground tanks or other hazardous materials shall include a remediation and abatement plan in the Demolition Plan. This Plan should be prepared in coordination with EH&S Environmental Affairs. 4. HYDROLOGY STUDIES AND STORM WATER BEST MANAGEMENT PRACTICES (BMP s)
162 I SPECIAL PROGRAM REQUIREMENTS Page 7 of 124 9/29/2009 Storm water hydrology and water quality requirements shall be implemented on UCSD project sites in order to comply with the California Environmental Quality Act (CEQA), State Water Resources Board (SWRB), LEEDS, and Coastal Commission requirements. Designing to Mitigate Storm Water Impacts All university projects (excluding interior renovations), need to consider the effect of the project area on storm water quality and run-off rates. All projects, regardless of size, are to implement storm water quantity and quality best management practices, including Low Impact Design (LID). Examples of LID can be found at or The LID approach: encourages conservation measures; promotes impact minimization techniques such as impervious surface reduction; provides for strategic runoff timing by slowing flow using the landscape; uses an array of integrated management practices to reduce and cleanse runoff; advocates pollution prevention measures to reduce the introduction of pollutants to the environment. The Design Guidelines, posted on the UCSD Facilities Design and Construction (FD&C) web site ( provide detailed design requirements to mitigate storm water impacts. Design measures shall be consistent with UCSD s storm water management plan, shall be operational within a reasonable time from project occupancy, and shall be maintained by UCSD. Outdoor areas for storage of materials typically contribute pollutants to the storm water conveyance system and shall be covered and protected by secondary containment. Roofs or awnings shall be provided over all trash containers and loading docks to minimize direct precipitation and contamination of storm water. These areas shall not have any run-on of storm water. Pollutants of concern shall be minimized through the incorporation of design measures best suited to maximize the reduction of pollutant loadings in that runoff (see attached Table from the UCSD Long Range Development Plan (LRDP) EIR). At least one treatment control is required for new parking areas or parking structures, or other new uses identified by FD&C, Environmental Planning or Environmental Health and Safety (EH&S) to have potential to generate substantial pollutants. Treatment controls include detention basins, infiltration basins, wet ponds or wetlands, drainage inserts, filtration, and hydrodynamic separator systems. Treatment controls shall incorporate volumetric or flow based treatment control design standards to mitigate (infiltrate, filter, or treat) storm water runoff, as appropriate. When reclaimed water is used for landscape irrigation the design must assure that only incidental runoff of the reclaimed water be allowed to enter the storm drain system per the reclaimed water permit. Please contact Jon Schmidt, UCSD EH&S for assistance. All projects shall be designed to eliminate non-storm water (dry weather flows) from entering the storm water conveyance system. Discharges from flushing and testing building fire sprinkler systems shall be placed into landscaping. Hydrology Study A hydrology/drainage study is necessary for any one of these conditions: a) the development or redevelopment project that would result in an increase or decrease of impervious surface; b) the project will install or modify an existing storm drain system; c) the project is in the Coastal Zone and will be reviewed by the Coastal Commission as determined by the University; d) the project site area is one acre or greater and a SWPPP is required; e) to support the project level CEQA analysis; or f) the building will be attaining LEEDS equivalency. Hydrology study requirements: The hydrology study shall be performed by a registered civil engineering consultant. The study shall be based on a review of existing maps and records and the UCSD 2004 Long Range Development Plan (LRDP) EIR, as well as site-specific hydrologic factors. The campus-wide hydrology and drainage study prepared to support the LRDP EIR is an excellent source of baseline information available for use as a starting point for project level studies. The hydrology study shall include: 1) The amount, in square feet, of increase or decrease of impervious surface from existing to proposed conditions. This will be used to determine site design requirements as detailed in the UCSD LRDP EIR, Section 4.7, ( and in the University s Storm Water Management Program (SWMP). All University projects increasing impervious surfaces by 10,000 sf or more are required to maintain the peak runoff at the pre-project rate for the 10-year, 6-hour storm event. 2) Surface water drainage patterns and quantities, including run-on and runoff rates in cfs, for existing and proposed conditions, using the latest version of the City of San Diego Drainage Manual and the County of San Diego Hydrology Manual. Runoff rates shall be calculated for the 10-year and 100-year 6-hour storm event. These calculations shall be done for every drainage basin within, or impacted by, the project. The results shall be clearly reported in tabular form. Supporting data, calculations and figures shall be included. 3) Storm drainage system requirements, including the capacity of detention structures to mitigate run-off increases and appropriate options for mitigating storm water rate and quality impacts. 4) Areas of concern that should be addressed in the project design, such as erosion hazard areas, areas of potential flooding. 5) For project seeking LEEDS points for hydrology, the project design must reduce the pre-project 100 year, 6 hour storm event by 25%, and this would be documented in the study. Timing of the work: The hydrology report should be submitted to the University no later than at the schematic design phase of the project. This information shall be incorporated into the design of the project at the earliest stages and will form the basis of the project specific CEQA analysis of the issue, with the overall goal being to minimize the project impact on storm water runoff quantity and quality through integrating building, site and landscaping design. The project civil engineer shall revise and refine the hydrologic and hydraulic calculations as necessary as the project design progresses. Potential Pollutant Activity or Sources List [LINK] 5. LEED [Guidelines in process] 6. ENVIRONMENT, HEALTH AND SAFETY a. The UCSD Department of Environment, Health and Safety (EH&S) advises on industrial hygiene and laboratory safety (HVAC systems, fume hoods, design specifications for bio-hazardous and infectious-agent containment, air emissions, design and locations of safety devices, etc.), sanitation, radiation safety, hazardous waste (asbestos, PCBs, sink traps, lead and lead paint, soil contamination, etc.) fire code compliance and environmental site assessment. EH&S reviews environmental and occupational regulatory requirements and University policies and requirements that may affect a project. The involvement of EH&S in the pre-design through construction of a project offers the following benefits: 1) Provides EH&S insight into programmatic development and conceptual planning stages of a proposed project. 2) Avoidance of unnecessary project planning and construction delays due to overlooked EH&S issues and resulting cost overruns. 3) Reduction in building occupants' health and safety complaints and Workers' Compensation cases as well as avoidance of significant public health and safety

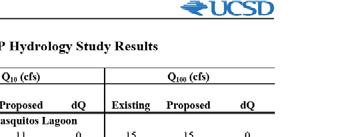

163
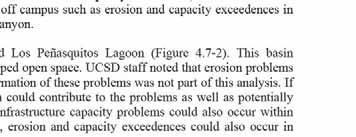


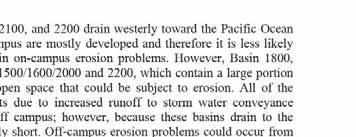

164


165


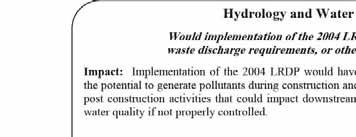


166
167
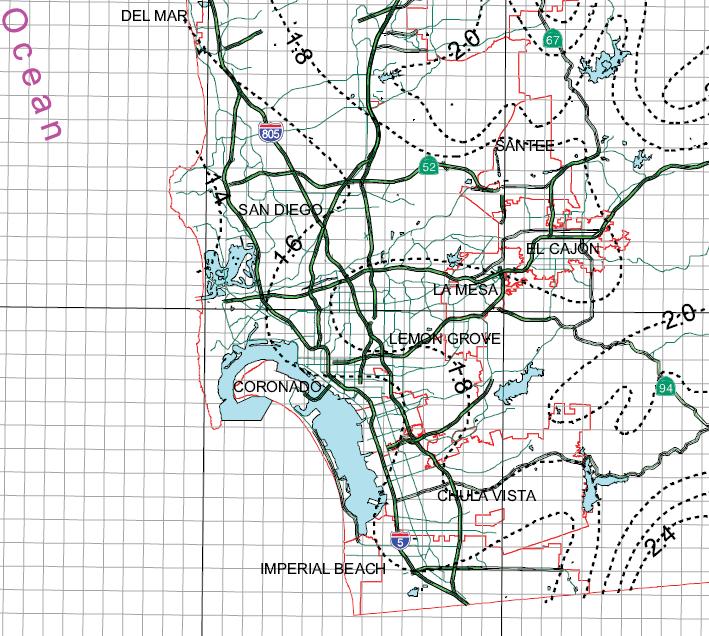
168
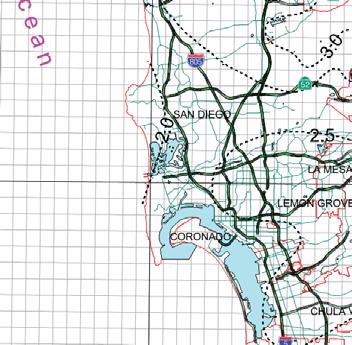

169

170
171 APPENDIX E: 303(d) Impaired Waters Information

172 Appendix D Map and Tables Note: ID numbers denoting 2006 CWA Section 303(d) List of Water Quality Segments are illustrated on the following map. These ID numbers may be cross-referenced with the tables following the map. Storm Water Standards D-1
173 Page 309 of 343 Selenium Source Unknown 12 Miles A 2019 Total Dissolved Solids Source Unknown 12 Miles A 2019 Total Nitrogen as N Source Unknown 12 Miles A 2019 Toxicity Unknown Nonpoint Source Unknown Point Source Urban Runoff/Storm Sewers 12 Miles A Los Penasquitos Lagoon Estuary / Sedimentation/Siltation Nonpoint Source Point Source 469 Acres A Loveland Reservoir Lake & Reservoir / Aluminum Source Unknown 420 Acres A 2019 Manganese Source Unknown 420 Acres A 2019 Oxygen, Dissolved Source Unknown 420 Acres A 2019 ph Source Unknown 420 Acres A 2019 This listing was made by USEPA for Miramar Reservoir Lake & Reservoir / Total Nitrogen as N Source Unknown 138 Acres A Mission Bay (area at mouth of Rose Creek only) Bay & Harbor / Eutrophic Highway/Road/Bridge Runoff Landfills Nonpoint Source Nurseries Point Source Urban Runoff/Storm Sewers 9.2 Acres A 2019 Lead Highway/Road/Bridge Runoff 9.2 Acres A /7/2012
174 9 Santa Ysabel Creek (above Sutherland Reservoir) River & Stream / Toxicity Unknown Nonpoint Source 9 Segunda Deshecha Creek River & Stream / Phosphorus Unknown Nonpoint Source Unknown Point Source Urban Runoff/Storm Sewers Toxicity Unknown Nonpoint Source Unknown Point Source Urban Runoff/Storm Sewers Turbidity Channelization Construction/Land Development Flow Regulation/Modification Unknown Nonpoint Source Unknown Point Source Urban Runoff/Storm Sewers 9 Soledad Canyon River & Stream / Sediment Toxicity Unknown Nonpoint Source Unknown Point Source Selenium Source Unknown Unknown Nonpoint Source Urban Runoff/Storm Sewers 9 Sutherland Reservoir Lake & Reservoir / Color Unknown Nonpoint Source Unknown Point Source Urban Runoff/Storm Sewers Iron Source Unknown Manganese Source Unknown Total Nitrogen as N Natural Sources Page 336 of Miles A Miles A Miles A Miles A Miles A Miles A Acres A Acres A Acres A Acres A /7/2012
175 Source Unknown Unknown Nonpoint Source Urban Runoff/Storm Sewers 9 Pacific Ocean Shoreline, Lower San Juan HSA, at North Doheny State Park Campground Coastal & Bay Shoreline / Enterococcus Natural Sources Source Unknown Unknown Nonpoint Source Urban Runoff/Storm Sewers Total Coliform Unknown Nonpoint Source Unknown Point Source Urban Runoff/Storm Sewers 9 Pacific Ocean Shoreline, Lower San Juan HSA, at San Juan Creek Coastal & Bay Shoreline / Enterococcus Natural Sources Source Unknown Unknown Nonpoint Source Urban Runoff/Storm Sewers Fecal Coliform Natural Sources Source Unknown Unknown Nonpoint Source Urban Runoff/Storm Sewers Total Coliform Natural Sources Source Unknown Unknown Nonpoint Source Urban Runoff/Storm Sewers 9 Pacific Ocean Shoreline, Lower San Juan HSA, at South Doheny State Park Campground Coastal & Bay Shoreline / Enterococcus Natural Sources Source Unknown Unknown Nonpoint Source Urban Runoff/Storm Sewers 9 Pacific Ocean Shoreline, Miramar Reservoir HA, at Los Penasquitos River mouth Coastal & Bay Shoreline / Total Coliform Unknown Nonpoint Source Unknown Point Source Urban Runoff/Storm Sewers Page 317 of Miles A Miles A Miles A Miles A Miles A Miles A Miles A /7/2012
176 APPENDIX F: BMP Design Calculations
177
178 Post-Construction Stormwater Management Checklist* (5,000 SF or Greater) Applicability: Required for projects that create and/or replace 5,000 square feet or greater of impervious surface (i.e. asphalt roads, concrete structures, building area, sidewalks, etc.). Impervious surfaces are those that water cannot infiltrate/soak into. *This form must be filled out during the planning stages of the project to ensure that all required Best Management Practices are implemented in accordance with UC San Diego's Phase II Small MS4 General Permit DWQ. All BMPs that will be implemented for projects will be reported to the State Water Quality Control Board on an annual basis by UC San Diego. Exemptions: The following projects are exempt from the Phase II Small MS4 permit storm water site design measures and low impact design requirements: 1. Projects completed before July 1, Regulated projects that have been designed, approved, and funded prior to July 1, Interior remodels. 4. Routine maintenance or repair projects such as: a. Maintenance, repair, and replacement work on existing underground utilities such as sanitary sewer lines or other utilities. b. Exterior wall surface replacement. c. Roof replacement. d. Pavement or asphalt resurfacing within the existing footprint. e. Sidewalk replacement within an existing footprint to replace concrete that is causing a trip hazard. f. routine replacement/repair of damaged pavement/asphalt such as pothole repair. 5. Bicycle lanes or pedestrian ramps on existing roads or sidewalks within existing footprint (e.g., no new impervious area). 6. Sidewalks built as a part of new streets or roads and built to direct storm water runoff to adjacent vegetated areas. 7. Bicycle lanes that are built as part of new streets or roads that direct storm water runoff to adjacent vegetated areas. 8. Impervious trails build to direct storm water runoff to adjacent vegetated areas, or other non-erodible permeable areas. 9. Sidewalks, bicycle lanes or trails constructed with permeable surfaces. ***If your project meets the exemption requirements, do NOT fill out this form. Project Name: Project #: Street Address: Cross Streets: Project Watershed (circle): See Attached Map if unsure which watershed your project lies within. Scripps Miramar Reservoir Miramar Other: Project Type: (Circle) New Development Re-Development Road Landscaping Retrofit Utility Other: 1 of 7
179 Post-Construction Stormwater Management Checklist* (5,000 SF or Greater) Description of Project: Post-construction stormwater mangement is required because the site creates or replaces more than 5,000 sf of impervious area. The project area is analyzed as single basin as described below for Post-Construction Stormwater Management purpose. Voigt Parking Structure: The project is comprised of construction of a parking structure, improvements along Voigt Drive & Engineer Lane, and paths from Warren Mall to Hopkins Lane. Associated improvement work also includes proposed paths between Warren Mall and the Price Center. Proposed improvements include a 1.75 acre Parking Structure, adjacent and rooftop pedestrian paths, improvements along Engineer Lane, and pedestrian and bicycle paths extending from Warren Mall to Hopkins Lane. Approximately 70% of the Parking Structure s will be covered by a green roof. The runoff originating from the roof area is directed to planter areas located on the fourth floor and at the ground level within the light well area. Seven planters including two within the light well areas are utilized for flow control purpose. Site meets the water balance requirement therefore, treatment control BMPs are not required. Areas (in square feet) Total: 293,158 Disturbed: 266,151 New Impervious: 39,204 Replaced Impervious: 78,408 Will more than 50% of Impervious Surface be Replaced?* X Yes No *If Yes then runoff from the entire project consisting of all existing, new, and/or replaced impervious surface must be included in the storm water treatment and design calculations For projects that are Redevelopment or Road Widening Projects Total pre-project impervious surface area: 78,408 SF Total post-project impervious area: 117,612 SF Status of Project Application Date: Application Deemed Complete Date: Project approval Date: 2 of 7
180 Post-Construction Stormwater Management Checklist* (5,000 SF or Greater) PART A - SITE DESIGN MEASURES: Which site design measures have been implemented to reduce project site runoff? Applicant must select one or more of the following options below (check all that apply). In addition, the State Water Board's SMARTS Post-Construction Calculator (or equivalent) must be used to quantify the runoff reduction resulting from implementation of any site design measures specified below and attach the calculations to this checklist. If post-construction water balance cannot be achieved with site design measures only, then additional storm water treatment BMPs must be designed for the project as described in PART B below. An electronic copy of the Post-Construction Calculator is available on the UC San Diego Storm Water Management Program website: or request an electronic copy from EH&S Environmental Affairs at: ehsea@ucsd.edu X X X Stream Setbacks and Buffers (A vegetated area including trees, shrubs, and herbaceous vegetation, that exists or is established to protect a stream system, lake reservoir, or coastal estuarine area) Soil Quality Improvement and Maintenance (improvements and maintenance through soil amendments and creation of microbial community) Tree Planting and Preservation (planting and preservation of healthy established trees that include both evergreens and deciduous, as applicable) Rooftop and Impervious Area Disconnection (Rerouting of rooftop drainage pipes to drain rainwater to rain barrels, cisterns, or permeable areas instead of to the storm water system) X Porous Pavement (Pavement that allows runoff to pass through it, thereby reducing the runoff from a site and surrounding areas and filtering pollutants) Green Roofs (a vegetative layer grown on a roof (rooftop garden)) Vegetated Swales (A vegetated, open-channel management practice designed specifically to treat and attenuate storm water runoff) Rain Barrels and Cisterns (system that collects and stores storm water runoff from a roof or other impervious surface) Description of Site Design Measures Implemented for Project: -The new landscaped areas will include amended soils which will support microbial community. -Tree planting and preservation are implemented throughout the site to the maximum extent feasible. -Rooftop and impervious areas are disconnected by directing the flow into landscaped areas. -A Green Roof is provided for the Voigt Parking Structure Volume of runoff that will be treated: Size of area that will drain to BMP: Pollutants that will be captured by BMP: (check all that apply) X Trash/Litter X Sediment X Dry weather flows (e.g. irrigation runoff) Other 3 of 7
181 Post-Construction Stormwater Management Checklist* (5,000 SF or Greater) PART B - SOURCE CONTROL MEASURES: All projects that are creating and/or replacing 5000 sf of impervious area or greater and that have pollutant generating sources are required to implement sources control BMPs as applicable. Check all pollutant generating activities that apply to your project below. The source controls below are from UC San Diego's Storm Water Management Program and are posted at Alternatively, source control measures may be designed consistent with the CASQA Stormwater BMP Handbook for New Development and Redevelopment ( Housekeeping for outdoor material storage and outdoor X Landscape management: irrigation runoff, work areas erosion, green waste X Spill control and cleanup for outdoor spills or leaks Food service management Marine activities Loading dock management Sanitary sewer overflows/ line blockages Onsite transportation of materials/waste Outdoor washing/ cleaning Surface cleaning/ pressure washing Fueling operations X Outdoor painting and sandblasting X Maintenance on equipment containing water (e.g., eyewash X Storm water conveyance system showers, boiler drain lines, condensate drain lines, rooftop management to prevent improper discharge equipment, and drainage sumps into storm drains X Equipment, vehicle, and boat maintenance Trash management X X Non-storm water discharges Integrated pest management Hazardous materials management Hazardous waste management X Building repairs and remodeling Parking lot and storage area management X Potable water system flushing Pools, decorative fountains, and other water X Fire sprinkler and hydrant testing/flushing features Describe the source control BMPs that will be implemented for the project for all pollutant generating activities checked above: 4 of 7
182 Post-Construction Stormwater Management Checklist* (5,000 SF or Greater) PART C - STORM WATER TREATMENT/BASELINE HYDROMODIFICATION MEASURES: Only required if site design measures listed above cannot fully meet Permit requirements (i.e.. Calculations on SMARTS calculator show that post-construction water balance is not achieved ). All stormwater treatment BMPs shall be designed based on the flow-based or volume-based criteria specified in Section F.5.g.2.b (Numeric Sizing Criteria) of the Permit. Treatment BMPs must be designed for each Drainage Management Area (DMA). Bioretention facilities are preferred for treatment but alternative treatment BMPs can be used if the proper documentation and supporting calculations are provided and attached to this checklist. If Alternative BMPs are selected then all sizing and calculations should be prepared by a Registered Civil Engineer. STEP 1: Calculating What is Required for Treatment BMPs: If you have a concept plan or design drawings for the proposed project which clearly define impervious and pervious areas you will be able to calculate the amount of area, volume, or flow that is required to be treated by stormwater treatment/hydromodification measures. If your project has more than one discharge point then you will need to divide your project into individual drainage management areas (DMA's) and calculate the required treatment for each DMA. If Bioretention is specified as the treatment control BMP of choice then skip to the Step 2 below for sizing BMPs. If alternative BMPs (BMPs other than bioretention) are utilized then depending on the type of BMP that will be designated for each DMA either volume-based or flow-based calculations should be performed to determine the required treatment volumes or rates. These calculations should be performed by a Registered Civil Engineer. The following sizing criteria should be used when determining volumes and rates for BMPs: Volume-Based BMP Sizing Criteria: a) The maximized stormwater capture volume for the tributary are based on historical rainfall records and determined in accordance with Urban Runoff Quality Management, WEF Manual of Practice No. 23/ASCE Manual of Practice No. 87 (1998), pages (the 85th percentile, 24-hour storm event) OR: b.) The volume of annual runoff required to achieve 80 percent or more capture, determined in accordance with CASQA's Stormwater BMP Handbook for New and Redevelopment (2003) using local rainfall. Flow-Based BMP Sizing Criteria: a) The flow of runoff produced from a rain event equal to at least 0.2 inches per hour intensity OR: b) The flow of runoff produced from a rain event equivalent to at least 2 time the 85th percentile hourly rainfall intensity as determined from local rainfall records. Treatment Rate or Volume Required for Project: (If multiple DMA's please attach additional calculations to this checklist ) ft 3 or ft./s 5 of 7

183 Post-Construction Stormwater Management Checklist* (5,000 SF or Greater) STEP 2: Selecting Treatment/Hydromodification BMPs Bioretention Facilities or Flow-Through Planters (Suggested BMP by Permit) Vegetated areas that can be designed as swales, basins, or flow-through planters. Bioretention facilities should be sized based on 4% of the total impervious tributary area to the bioretention facility and in accordance with the typical section below: Additional Design Requirements for Bioretention: -Bioretention facilities located in areas with highly infiltrative soils or high groundwater tables may omit the underdrain. -The 18' Soil layer (Planting layer) shall be comprised of a mixture of sand (60-70%) and compost (30-40%) and shall meet ASTM C33 Standards. - The 12" Storage layer shall be comprised of gravel and underdrain shall be placed near the top of this layer. - No liners or other barriers shall be used unless there is a structure or other geotechnical hazard located within 10 feet of facility. - The appropriate plant palette should be selected based on the soil type and max. available water use. Total Bioretention Area Required (based on 4% of impervious area) ft 2 Total Bioretention Area Provided: ft 2 If the Total Bioretention Area is less than the area required please explain why in the space below: X Other BMPs as listed below (check all that apply) X Extended Detention Basin Infiltration Basin or Infiltration Trench High-Rate Biofilters (e.g. Tree wells or other) (1) High-Rate Media Filter (e.g. Vault unit with replaceable cartridges) (1) Other equally effective as bioretention BMP (1) High-rate Biofilters or Media Filters are only allowed if bioretention or equivalent facility is proven to be infeasible for the project and if the following conditions apply: 1) project is creating or replacing an acre or less and is located in an area that has at least 85% of the site covered by permanent structures; 2) The proposed facility is receiving runoff solely from existing (pre-project) impervious areas. 6 of 7
184 Post-Construction Stormwater Management Checklist* (5,000 SF or Greater) Has the Excel File for the State Water Boards SMARTS Post-Construction Calculator been completed and attached to the back of this document for all Site Design Measures (Part A)? X Yes No Has all documentation for any source control measure that will be implemented on project been attached to this checklist (e.g.. CASQA Fact Sheets)? Yes X No Have all calculations for design of Storm water Treatment Facilities (bioretention facilities, etc.) been performed and attached to this report? Draft preliminary calcs are provided. X Yes No PART D - POST- CONSTRUCTION BMP FOLLOW-UP (to be completed after construction) Where was the post-construction storm water treatment system installed (Circle all that apply): O&M Responsibility of the Site Design and Treatment BMPs for the life of the project: HDH FM Contractor Other: BMP O&M procedures/guidance provided to UC San Diego? Yes No Date of Installation: Onsite Joint storm water treatment facility Offsite Date of post-construction inspection: Inspected by: Proper Installation? Yes No Corrective actions needed: 7 of 7


185 Figure 1. UCSD West Campus Drainage Map DRAINAGE FLOW DIRECTION WATERSHED BOUNDARY Scripps Watershed Miramar Reservoir Watershed Miramar Watershed Note: UCSD West Campus drainage flows towards Pacific Ocean, Los Penesquitos Creek, Los Penesquitos Lagoon, Rose Canyon Creek, and Mission Bay.


186 Figure 2: UCSD East Campus Drainage Map Miramar Watershed Note: UCSD East Campus drainage flows towards Rose Canyon Creek and Mission Bay. DRAINAGE FLOW DIRECTION WATERSHED BOUNDARY

 drainage")

187 Scripps Institution of Oceanography Drainage Map Scripps Watershed Note: Scripps Institution of Oceanography (SIO) drainage flows towards Pacific Ocean. DRAINAGE FLOW DIRECTION WATERSHED BOUNDARY
188 AB C D E F G H I J K L M N User may make changes from any cell that is orange or brown in color (similar to the cells to the immediate right). Cells in green are calculated for you. Post-Construction Water Balance Calculator Project Information (Step 1a) If you know the 85th percentile storm event for your location enter it in the box below (Step 1b) If you can not answer 1a then select the county where the project is located (click on the cell to the right for drop-down): This will determine the average 85th percentile 24 hr. storm event for your site, which will appear under precipitation to left. (Step 1c) If you would like a more percise value select the location closest to your site. If you do not recgonize any of these locations, leave this drop-down menu at location. The average value for the County will be used. Runoff Calculations SAN_DIEGO SAN DIEGO WSO AIRPORT Project Name: Voigt Parking Structure (Step 2) Indicate the Soil Type (dropdown menu to right): Group D Soils Very low infiltration. Clay loam, silty clay loam, sandy clay, silty clay, or clay. Infiltration rate 0 to 0.05 inch/hr when wet. 6 7 Waste Discharge Identification (WDID): Optional (Step 3) Indicate the existing dominant non-built land Use Type (dropdown menu to right): Brush: >75% ground cover Date: Sub Drainage Area Name (from map): Runoff Curve Numbers Design Storm Based on the County you indicated above, we have included the percentile average 24 hr event - P85 (in)^ for your area. The Amount of rainfall needed for runoff to occur (Existing runoff curve 0.51 number -P from existing RCN (in)^) P used for calculations (in) (the greater of the above two criteria) ^Available at Existing Runoff Curve Number Proposed Development Runoff Curve Number 0.51 Jul-17 Optional (Step 4) Indicate the proposed dominant non-built land Use Type (dropdown menu to right): 80 (Step 5) Total Project Site Area: 88 in In In Complete Either Sq Ft Acres 6.11 (Step 6) Sub-watershed Area: 6.11 Percent of total project : (Step 7) Sub-watershed Conditions Sub-watershed Area (acres) Complete Either Acres Existing Rooftop Impervious Coverage 0 Existing Non-Rooftop Impervious Coverage 1.80 Proposed Rooftop Impervious Coverage 1.73 Proposed Non-Rooftop Impervious Coverage 1.28 A mix of lawn, grass, pasture and tress covering more than 75% of the open space Sq Ft 100% Acres Calculated Acres Credits Porous Pavement Tree Planting Acres Square Feet 0 20, Pre-Project Runoff Volume (cu ft) 0.88 Cu.Ft. Downspout Disconnection , Project-Related Runoff Volume Increase w/o credits (cu ft) 775 Cu.Ft. Impervious Area Disconnection Green Roof Stream Buffer , Vegetated Swales Project-Related Volume Increase with Credits (cu ft) 0 Cu.Ft. Subtotal , Subtotal Runoff Volume Reduction Credit 324 Cu. Ft You have achieved your minimum requirements (Step 9) Impervious Volume Reduction Credits Rain Barrels/Cisterns Soil Quality Volume (cubic feet) 0 Cu. Ft. 460 Cu. Ft. 36 Subtotal Runoff Volume Reduction 460 Cu. Ft. 37 Total Runoff Volume Reduction Credit 784 Cu. Ft
189 Tree Planting Credit Worksheet Please fill out a tree canopy credit worksheet for each project sub-watershed. Tree Canopy Credit Criteria Number of proposed evergreen trees to be planted (credit = number of trees x 0.005)* Number of proposed deciduous trees to be planted (credit = number of trees x )* Square feet under an existing tree canopy, that will remain on the property, with an average diameter at 4.5 ft above grade (i.e., diameter at breast height or DBH) is LESS than 12 in diameter. Square feet under an existing tree canopy that will remain on the property, with an average diameter at 4.5 ft above grade (i.e., diameter at breast height or DBH) is 12 in diameter or GREATER. Please describe below how the project will ensure that these trees will be maintained. Number of Trees Planted Area Credit (acres) Square feet Under Canopy * credit amount based on credits from Stormwater Quality Design Manual for the Sacramento and South Placer Regions Return to Calculator
190 Downspout Disconnection Credit Worksheet Please fill out a downspout disconnection credit worksheet for each project subwatershed. If you answer yes to all questions, all rooftop area draining to each downspout will be subtracted from your proposed rooftop impervious coverage. Downspout Disconnection Credit Criteria Do downspouts and any extensions extend at least six feet from a basement and two feet from a crawl space or concrete slab? Is the area of rooftop connecting to each disconnected downspout 600 square feet or less? Is the roof runoff from the design storm event fully contained in a raised bed or planter box or does it drain as sheet flow to a landscaped area large enough to contain the roof runoff from the design storm event? The Stream Buffer and/or Vegetated Swale credits will not be taken in this sub-watershed area? Yes Yes Yes Yes No No No No Percentage of existing 0 Acre(s) of rooftop surface that have disconnected downspouts 0 Percentage of the proposed 1.73 Acre(s) of rooftop surface that have disconnected downspouts 100 Return to Calculator
191 Impervious Area Disconnection Credit Worksheet Please fill out an impervious area disconnection credit worksheet for each project sub-watershed. If you answer yes to all questions, all non-rooftop impervious surface area will be subtracted from your proposed non-rooftop impervious coverage. Non-Rooftop Disconnection Credit Criteria Is the maximum contributing impervious flow path length less than 75 feet or, if equal or greater than 75 feet, is a storage device (e.g. French drain, bioretention area, gravel trench) implemented to achieve the required disconnection length? Yes Response No Is the impervious area to any one discharge location less than 5,000 square feet? Yes No The Stream Buffer credit will not be taken in this sub-watershed area? Yes No Percentage of existing 1.8 Acre(s) of non-rooftop surface area disconnected Percentage of the proposed 1.28 Acre(s) of non-rooftop surface area disconnected 0 50 % Return to Calculator
192 Stream Buffer Credit Worksheet Please fill out a stream buffer credit worksheet for each project sub-watershed. If you answer yes to all questions, you may subtract all impervious surface draining to each stream buffer that has not been addressed using the Downspout and/or Impervious Area Disconnection credits. Stream Buffer Credit Criteria Does runoff enter the floodprone width* or within 500 feet (whichever is larger) of a stream channel as sheet flow**? Yes Response No Is the contributing overland slope 5% or less, or if greater than 5%, is a level spreader used? Yes No Is the buffer area protected from vehicle or other traffic barriers to reduce compaction? Will the stream buffer be maintained in an ungraded and uncompacted condition and will the vegetation be maintained in a natural condition? Percentage of existing 1.8 Acre(s) impervious surface area draining into a stream buffer Yes Yes No No Percentage of the proposed 3.01 Acre(s) impervious surface area that will drain into a stream buffer Please describe below how the project will ensure that the buffer areas will remain in ungraded and uncompacted condition and that the vegetation will be maintained in a natural condition. Return to Calculator * floodprone width is the width at twice the bankfull depth. ** the maximum contributing length shall be 75 feet for impervious area
193 Please fill out a soil quality worksheet for each project sub-watershed. Response Will the soils used for landscaping meet the ideal bulk densities listed in Table 1 below? 1 If you answered yes to the question above, and you know the area-weighted bulk density within the top 12 inches for soils used for landscaping (in g/cm 3 )*, fill in the cell to the right and skip to cell G11. If not select from the drop-down menu in G10. If you answered yes to the question above, but you do not know the exact bulk density, which of the soil types in the drop down menu to the right best describes the top 12 inches for soils used for landscaping (in g/cm 3 ). Yes No Sandy clay loams, loams, clay loams What is the average depth of your landscaped soil media meeting the above criteria (inches)? 12 What is the total area of the landscaped areas meeting the above criteria (in acres)? Table 1 Sands, loamy sands <1.6 Credit (cu ft) Sandy loams, loams <1.4 Sandy clay loams, loams, clay loams <1.4 Silts, silt loams <1.3 Silt loams, silty clay loams <1.1 Sandy clays, silty clays, some clay loams (35-45% clay) <1.1 Clays (>45% clay) <1.1 1 USDA NRCS. "Soil Quality Urban Technical Note No.2-Urban Soil Compaction". March Return to Calculator * To determine how to calculate density see:
194 APPENDIX G: BMPs Fact Sheets

195
196

197
198


199
200
201

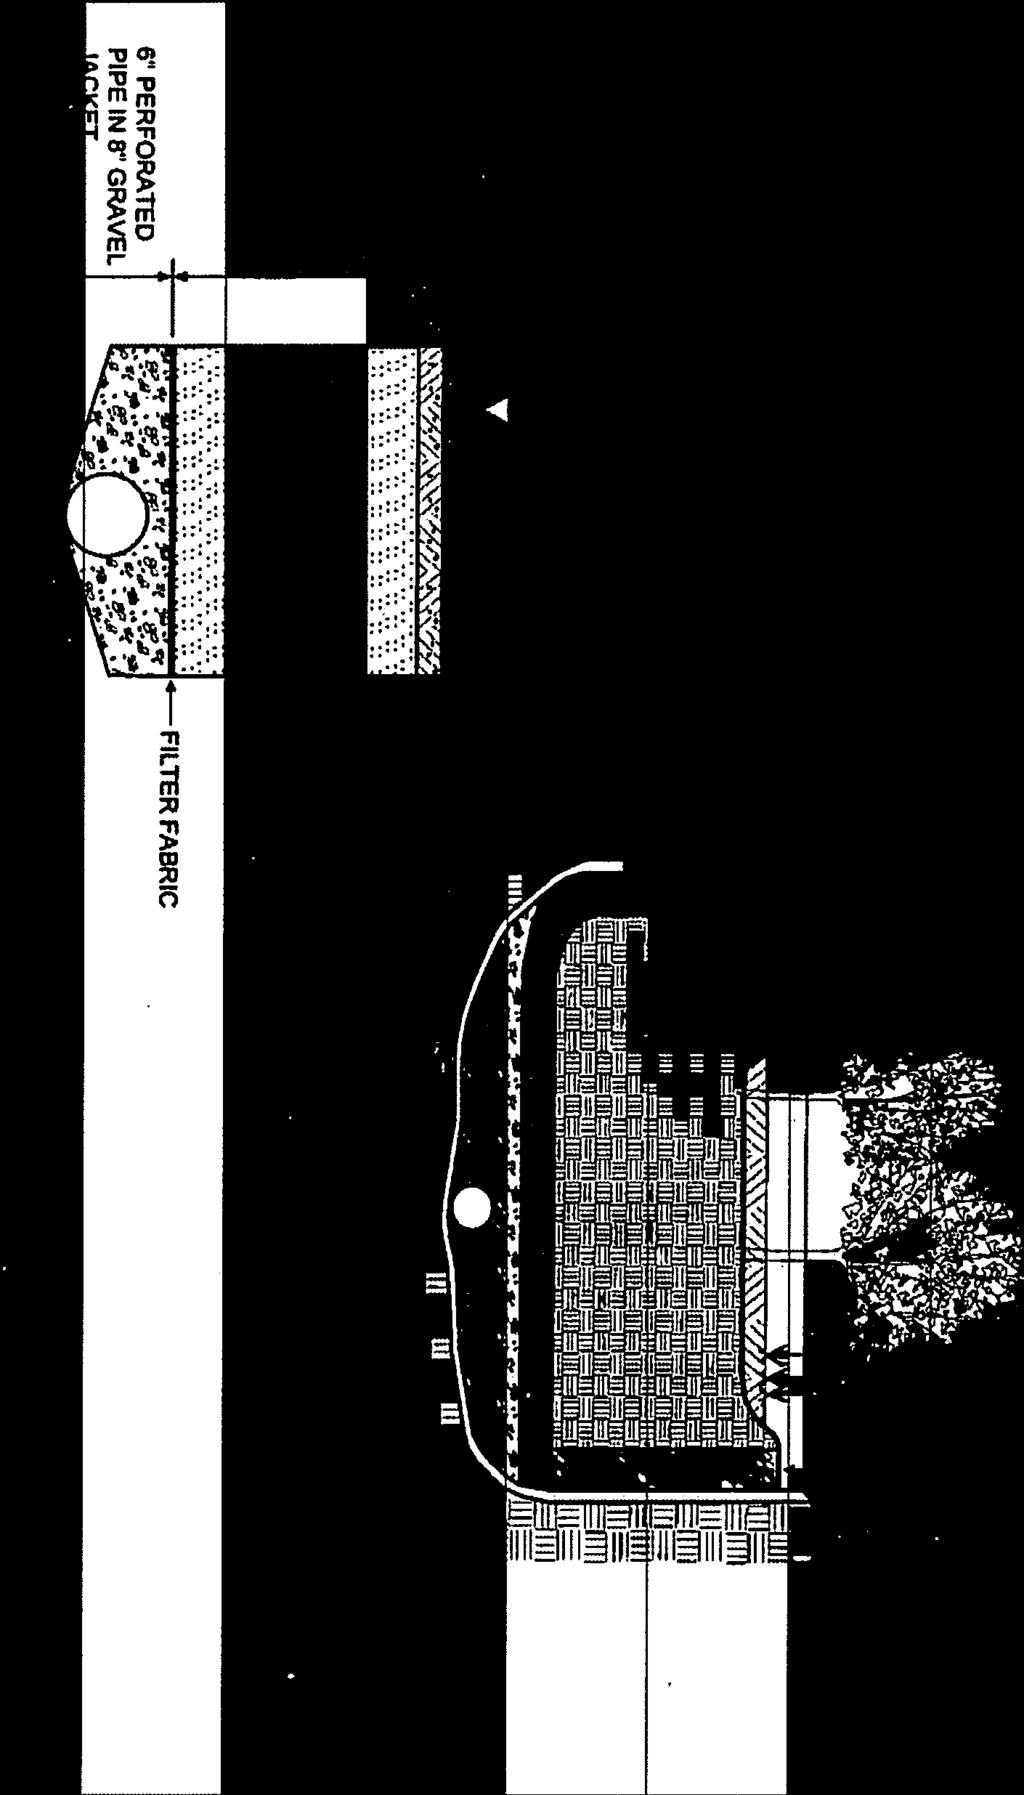
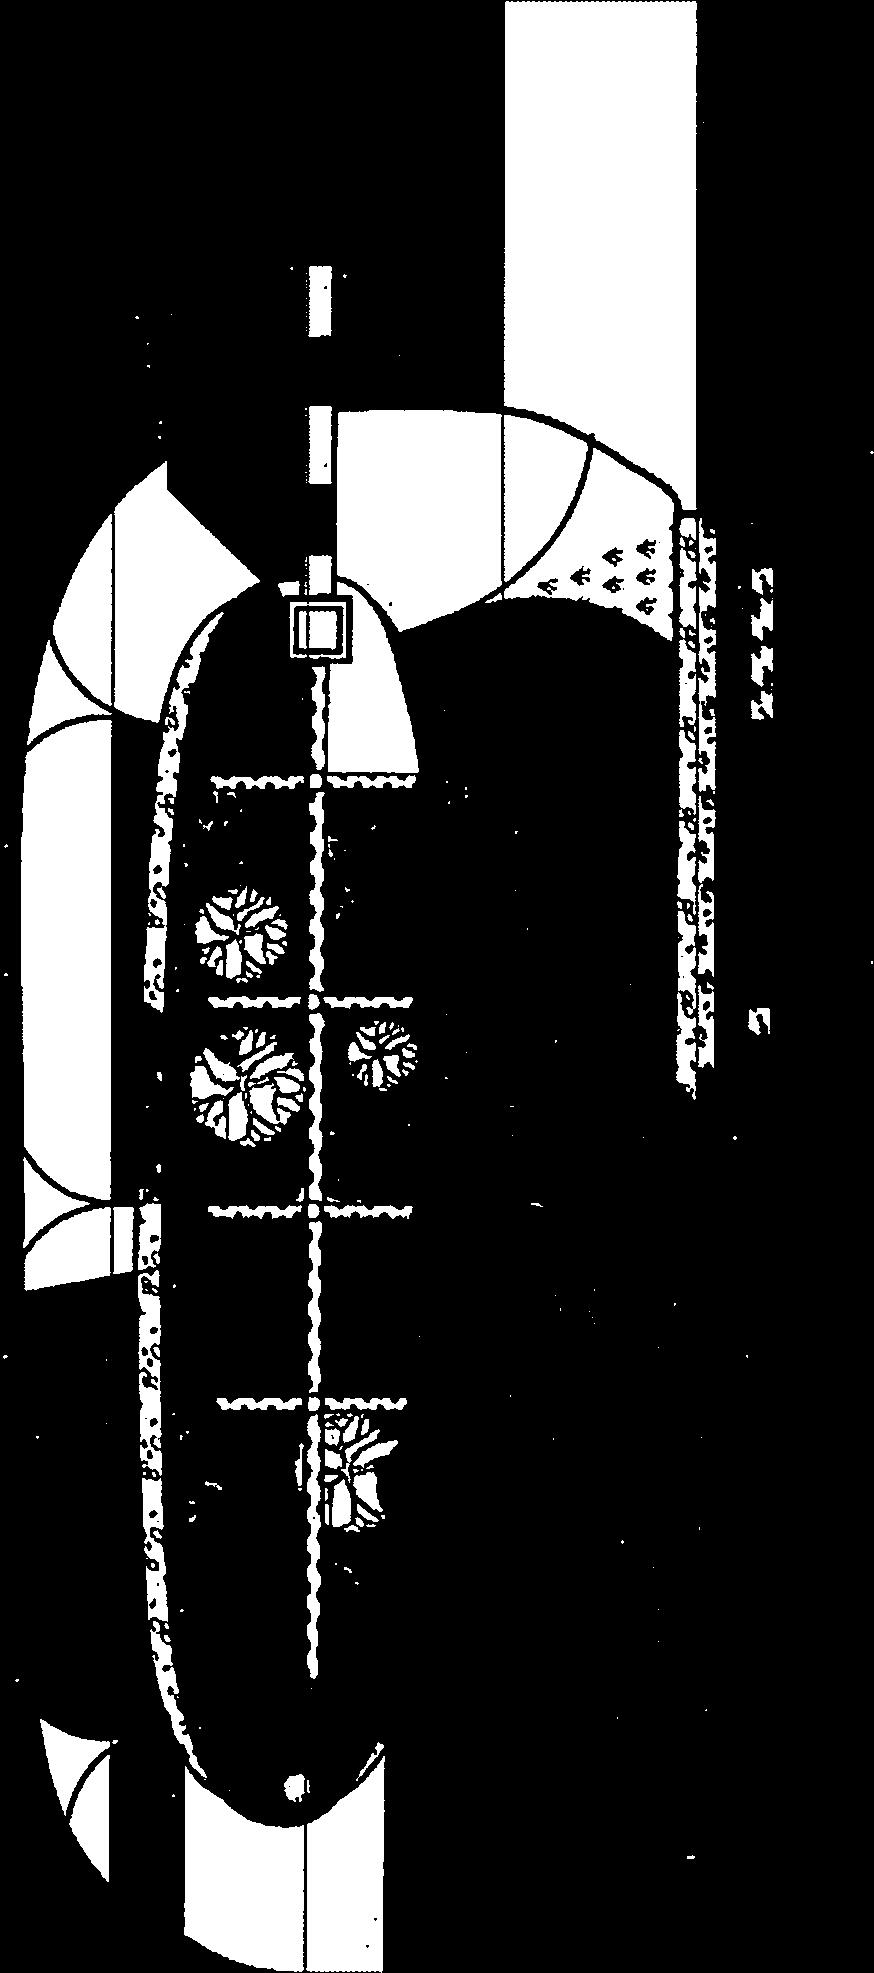
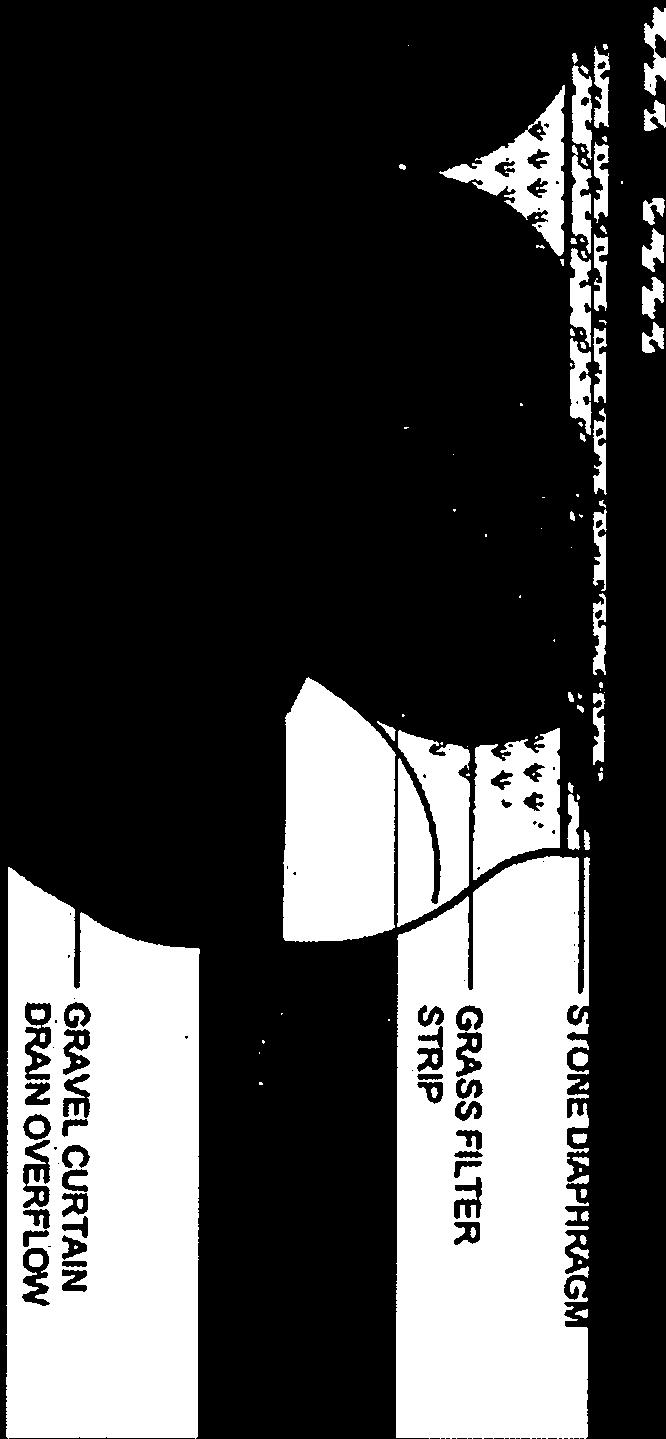
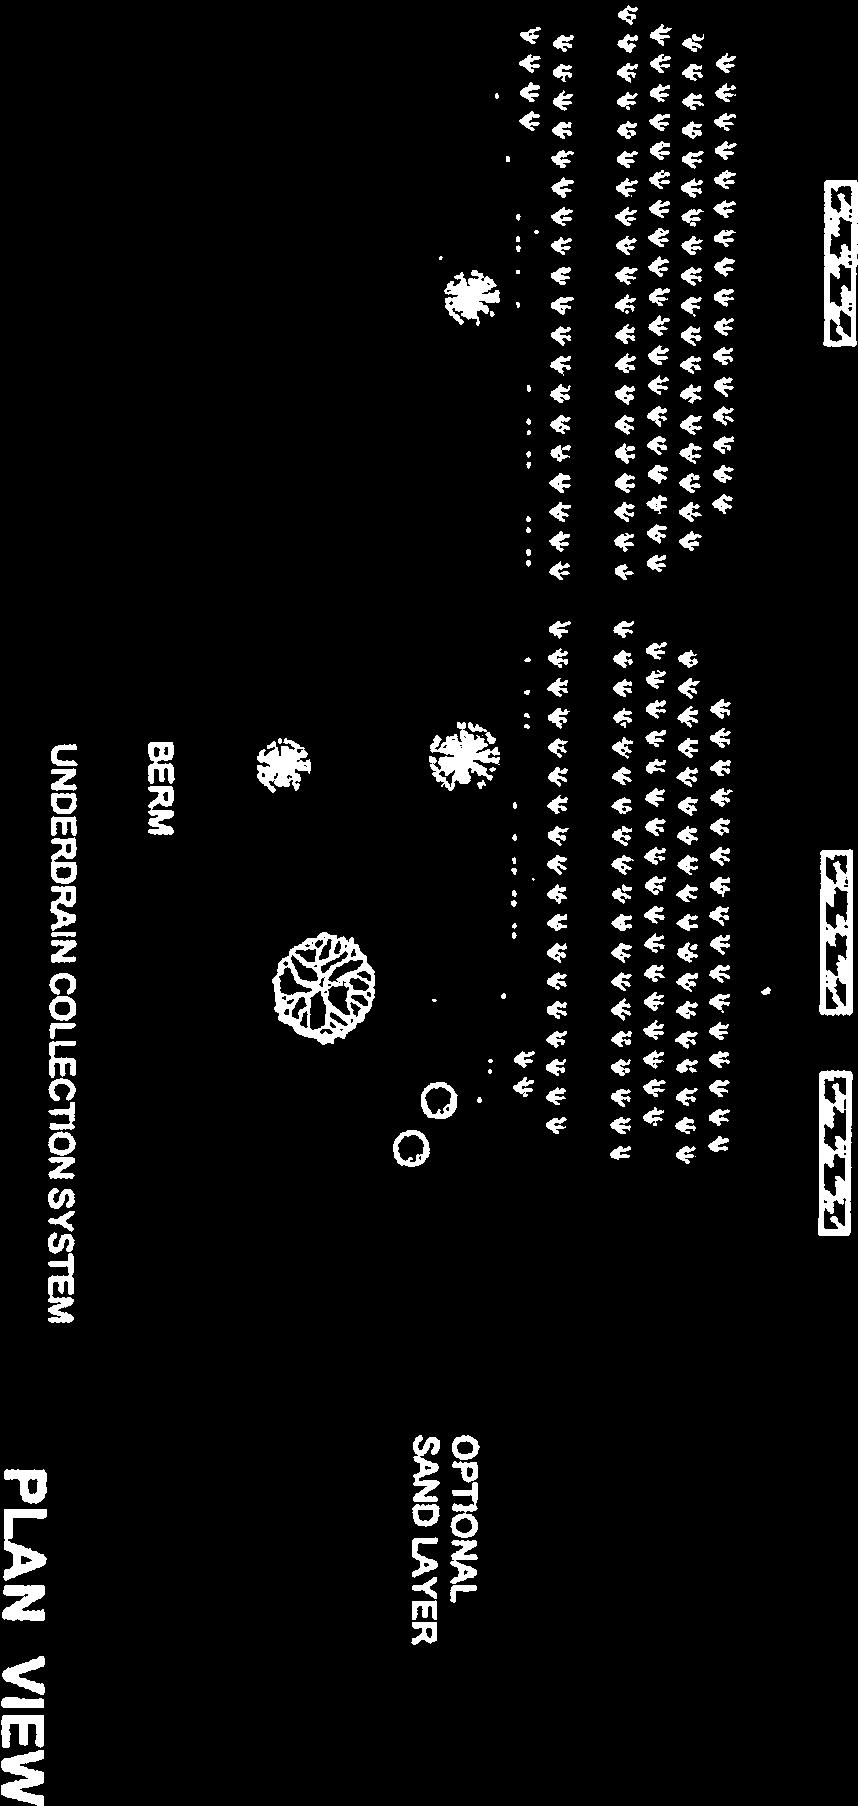
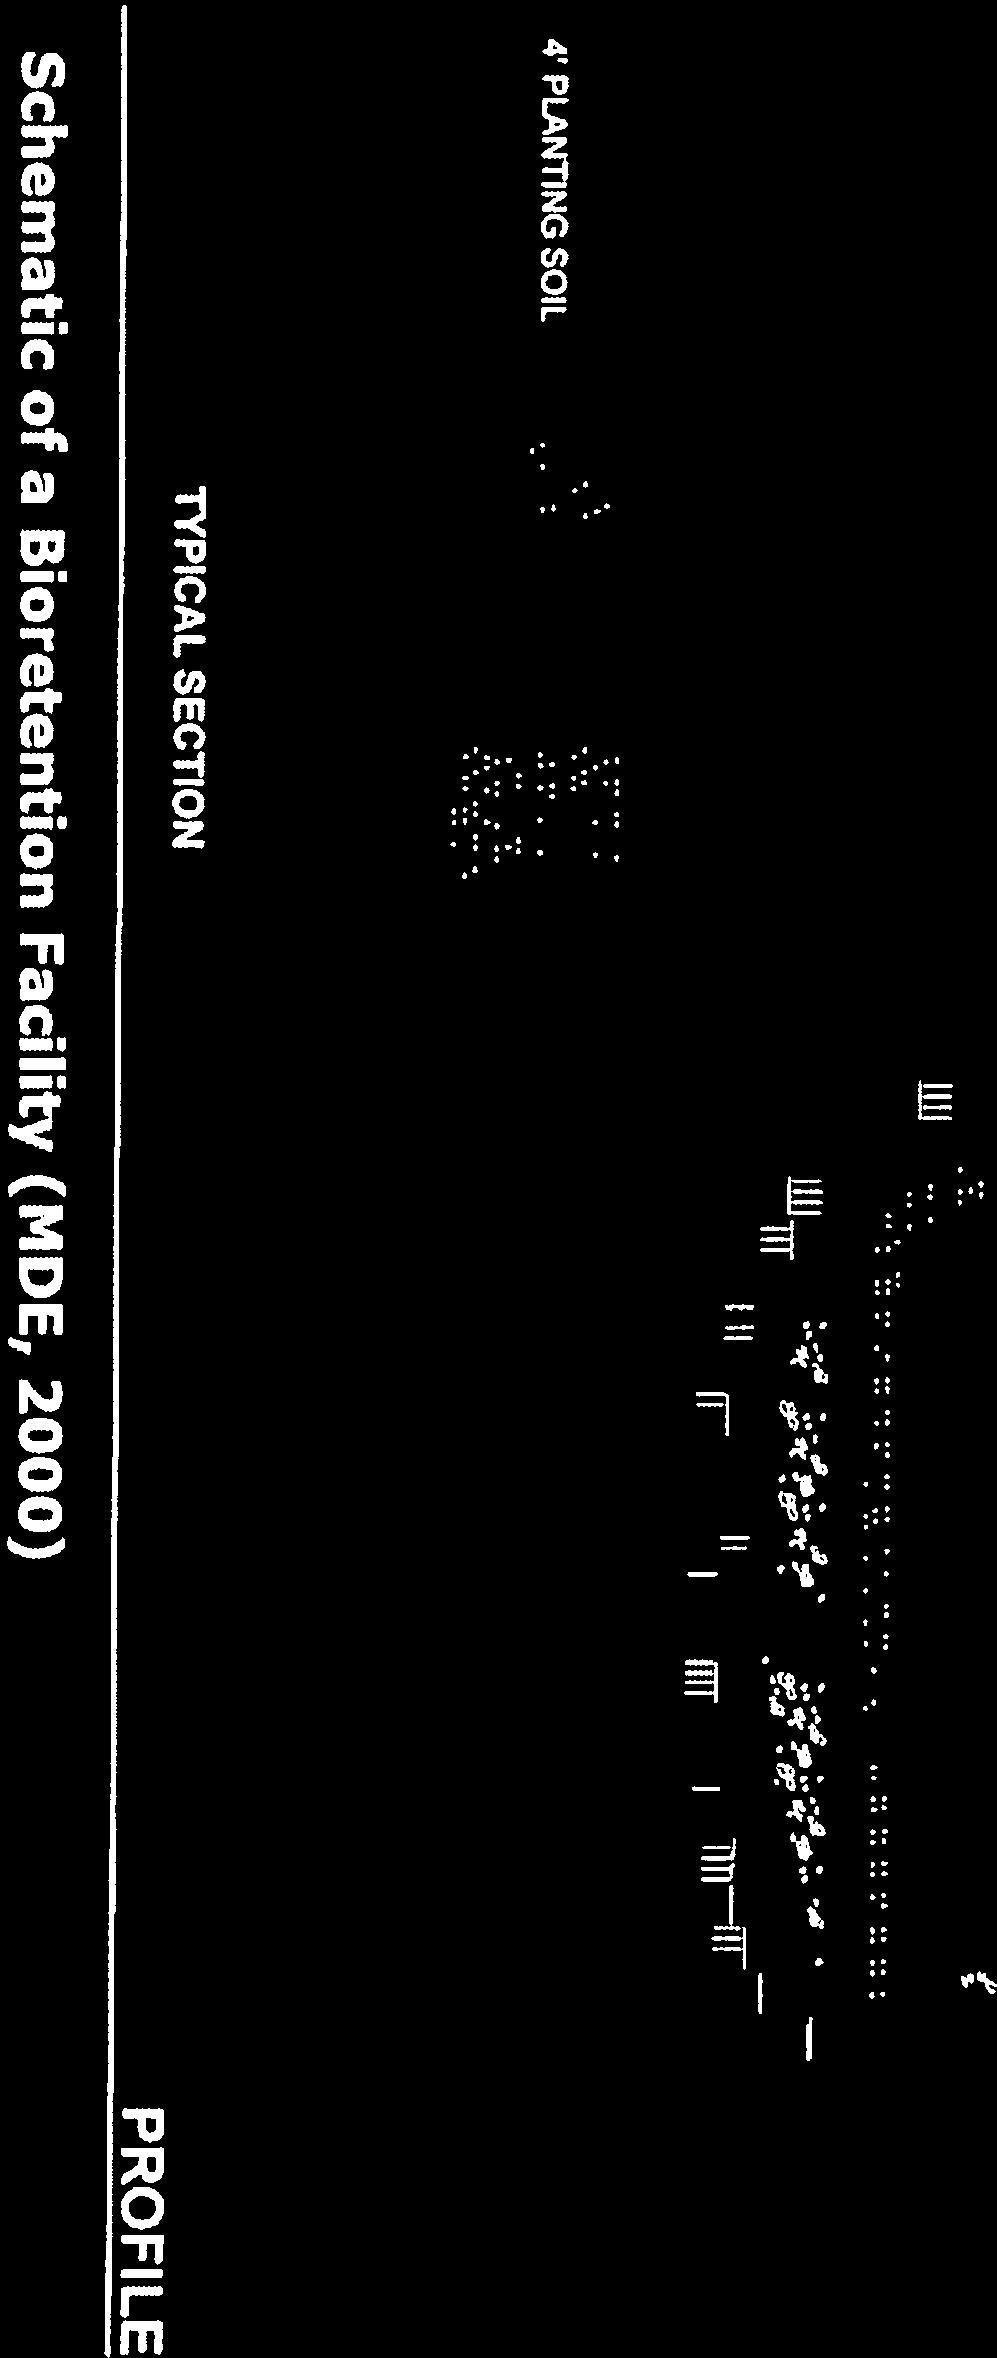


202
PRELIMINARY DRAINAGE REPORT FOR THE EDI MASTER PLAN
 PRELIMINARY DRAINAGE REPORT FOR THE EDI MASTER PLAN April 5, 2015 Wayne W. Chang, MS, PE 46548 Chang Civil Engineering Hydrology Hydraulics Sedimentation P.O. Box 9496 Rancho Santa Fe, CA 92067 (858) 692-0760
Storm Water - Priority Development Project Submittal
 Storm Water - Priority Development Project Submittal Project Summary Information Project Name Project Address Form I-2a Assessor's Parcel Number(s) Permit Application Number Project Watershed (Hydrologic
PRELIMINARY DRAINAGE STUDY
 PRELIMINARY DRAINAGE STUDY For 34 th & J Residences 3402 J St. San Diego, CA 92102 A.P.N 545-250-08 Prepared By: Kenneth J. Discenza, P.E. Site Design Associates, Inc. 1016 Broadway, Suite A El Cajon,
HYDROLOGY STUDY PREPARED FOR: MARKHAM PERRIS LLC 302 WEST FIFTH STREET, SUITE 103 SAN PEDRO, CA (310) FOR THE PROJECT:
 FOR THE PROJECT:") HYDROLOGY STUDY PREPARED FOR: MARKHAM PERRIS LLC 302 WEST FIFTH STREET, SUITE 103 SAN PEDRO, CA 90731 (310) 241-2992 FOR THE PROJECT: PERRIS VALLEY COMMERCE CENTER BUILDING PERRIS, CALIFORNIA PROJECT NUMBER:
HYDROLOGY STUDY PREPARED FOR: MARKHAM PERRIS LLC 302 WEST FIFTH STREET, SUITE 103 SAN PEDRO, CA 90731 (310) 241-2992 FOR THE PROJECT: PERRIS VALLEY COMMERCE CENTER BUILDING PERRIS, CALIFORNIA PROJECT NUMBER:
PRELIMINARY DRAINAGE STUDY. Del Prado 2329 CENTRE CITY PARKWAY ESCONDIDO, CALIFORNIA
 PRELIMINARY DRAINAGE STUDY FOR Del Prado 2329 CENTRE CITY PARKWAY ESCONDIDO, CALIFORNIA OWNER: Touchstone Communities 12700 Stowe Drive, Suite 130 Poway, CA 92064 858-586-0414 ENGINEER: MASSON & ASSOCIATES,
Hydrology Study. For Bella Terrazza Portion of Lot 1, Block 39, Subdivision of S Tract, Rancho El Cajon El Cajon, CA 92021
 Hydrology Study For Bella Terrazza Portion of Lot 1, Block 39, Subdivision of S Tract, Rancho El Cajon El Cajon, CA 92021 Prepared for Daryl Priest - Priest Development Corporation 124 West Main Street,
IV.E. HYDROLOGY AND WATER QUALITY
 IV.E. HYDROLOGY AND WATER QUALITY The following section presents the information provided in the hydrology report prepared by Sukow Engineering. Supporting hydrology data from this report is included in
APPENDIX N Guidance for Preparing/Reviewing CEQA Initial Studies and Environmental Impact Reports
 APPENDIX N N.1 Guidance for Preparing and Reviewing CEQA Initial Studies Step 1: Consider the Project Characteristics as Provided by the Project Applicant Review the project application and draft plan
Appendix H Amanda Estates Drainage Study
 Appendix H Amanda Estates Drainage Study Hunsaker & Associates 2015 Contents 1 Scope... 1 2 Existing Conditions... 1 3 Project Description... 3 4 Methodology... 5 4.1 Hydrology... 5 4.2 Hydraulics...
Background / Regulatory Requirements
 Chapter 2 Background / Regulatory Requirements This Chapter summarizes the impacts of development on stormwater quality and quantity and explains the postconstruction stormwater control requirements for
INFLOW DESIGN FLOOD CONTROL SYSTEM PLAN PLANT GASTON GYPSUM POND ALABAMA POWER COMPANY
 INFLOW DESIGN FLOOD CONTROL SYSTEM PLAN PLANT GASTON GYPSUM POND ALABAMA POWER COMPANY Section 257.82 of EPA s regulations requires the owner or operator of an existing or new CCR surface impoundment or
DESIGN DEVELOPMENT HYDROLOGY REPORT & LOW IMPACT DEVELOPMENT PLAN (LID PLAN)
") DESIGN DEVELOPMENT HYDROLOGY REPORT & LOW IMPACT DEVELOPMENT PLAN ( PLAN) ALAMITOS BEACH CONCESSION BUILDING 780 E. SHORELINE DRIVE LONG BEACH, CALIFORNIA Prepared For: Long Beach Public Works 333 W. Ocean
DESIGN DEVELOPMENT HYDROLOGY REPORT & LOW IMPACT DEVELOPMENT PLAN ( PLAN) ALAMITOS BEACH CONCESSION BUILDING 780 E. SHORELINE DRIVE LONG BEACH, CALIFORNIA Prepared For: Long Beach Public Works 333 W. Ocean
MS4 Programs: Quality, the Other Stormwater Q. Dan Bounds, PE, D.WRE IAFSM March 9, 2017
 MS4 Programs: Quality, the Other Stormwater Q Dan Bounds, PE, D.WRE IAFSM March 9, 2017 MS4 Rule and Regulations MS4 Municipal Separate Storm Sewer System A conveyance or system of conveyances (catch basins,
3F. Hydrology and Water Quality
 This section provides an analysis of potential hydrological and water quality impacts associated with implementation of the proposed project. The section also evaluates and describes the potential impacts
Drainage Analysis. Appendix E
 Drainage Analysis Appendix E The existing and proposed storm drainage systems have been modeled with Bentley CivilStorm V8 computer modeling software. The peak stormwater discharge was determined for
Appendix L. Drainage Report
 Appendix L Drainage Report 2nd Street and Pacific Coast Highway Retail Project City of Long Beach County of Los Angeles, CA DRAINAGE REPORT April 5, 2017 DRAINAGE REPORT For: 2nd Street and Pacific Coast
INFLOW DESIGN FLOOD CONTROL SYSTEM PLAN PLANT GREENE COUNTY ASH POND ALABMA POWER COMPANY
 INFLOW DESIGN FLOOD CONTROL SYSTEM PLAN PLANT GREENE COUNTY ASH POND ALABMA POWER COMPANY Section 257.82 of EPA s regulations requires the owner or operator of an existing or new CCR surface impoundment
PRELIMINARY DRAINAGE REPORT NEWCASTLE FIRE STATION OLD STATE HIGHWAY
 PRELIMINARY DRAINAGE REPORT FOR THE NEWCASTLE FIRE STATION OLD STATE HIGHWAY PREPARED FOR THE NEWCASTLE FIRE PROTECTION DISTRICT JULY 2014 BY ROSEVILLE DESIGN GROUP, INC. ROSEVILLE DESIGN GROUP, Inc Established
G. HYDROLOGY Existing Conditions
 G. HYDROLOGY Existing Conditions Surface Water Runoff This section is based on the hydrology and drainage analysis for the proposed Project, which was prepared by KPFF Consulting Engineers and is attached
STORM WATER MANAGEMENT PLAN
 STORM WATER MANAGEMENT PLAN for UNIVERSITY OF CALIFORNIA SAN DIEGO Updated October 2016 University of California, San Diego Storm Water Management Plan Updated October 21, 2016 TABLE OF CONTENTS Page 1.0
100-yr Design Runoff (cfs) Basin ID 103b A a B B C Totals
 Basin ID 103b A a B B C Totals") PROPOSED DEVELOPMENT The drainage for this site has been designed to be less than the maximum allowable runoff from each basin as stated in the Overall Rigden Farm drainage plan. Table 1 compares the actual
PROPOSED DEVELOPMENT The drainage for this site has been designed to be less than the maximum allowable runoff from each basin as stated in the Overall Rigden Farm drainage plan. Table 1 compares the actual
Appendix G Preliminary Hydrology Study
 Appendix G Preliminary Hydrology Study Preliminary Hydrology Study VESTING TTM 72608 Long Beach, CA Prepared for: The Long Beach Project, LLC 888 San Clemente, Suite 100 New Port Beach, CA May 28, 2014
15A NCAC 02H.1005 STORMWATER REQUIREMENTS: COASTAL COUNTIES
 1 1 1 1 1 1 1 1 0 1 0 1 1A NCAC 0H.0 STORMWATER REQUIREMENTS: COASTAL COUNTIES (a) The following definitions are applicable to this rule: (1) Built upon area as defined in Session Law 00- means that portion
FORT COLLINS STORMWATER CRITERIA MANUAL Hydrology Standards (Ch. 5) 1.0 Overview
 1.0 Overview") Chapter 5: Hydrology Standards Contents 1.0 Overview... 1 1.1 Storm Runoff Determination... 1 1.2 Design Storm Frequencies... 1 1.3 Water Quality Storm Provisions... 2 1.4 Design Storm Return Periods...
Chapter 5: Hydrology Standards Contents 1.0 Overview... 1 1.1 Storm Runoff Determination... 1 1.2 Design Storm Frequencies... 1 1.3 Water Quality Storm Provisions... 2 1.4 Design Storm Return Periods...
APPENDIX J-3. Orcem Stormwater Management and Treatment Facilities Design Summary
 APPENDIX J-3 Orcem Stormwater Management and Treatment Facilities Design Summary Stormwater Management & Treatment Facilities Design Summary INTRODUCTION KPFF Consulting Engineers has compiled this report
Hydrology Study. Ascension Heights Subdivision Ascension Drive at Bel Aire Road San Mateo, California (Unincorporated)
") Hydrology Study Ascension Heights Subdivision Ascension Drive at Bel Aire Road San Mateo, California (Unincorporated) Prepared for San Mateo Real Estate & Construction March 9, 21 Rev. 1 11-8-211 Rev.
Hydrology Study Ascension Heights Subdivision Ascension Drive at Bel Aire Road San Mateo, California (Unincorporated) Prepared for San Mateo Real Estate & Construction March 9, 21 Rev. 1 11-8-211 Rev.
City of Santa Clarita Project-Specific Urban Stormwater Mitigation Plan
 Project-Specific Urban Stormwater Mitigation Plan The purpose of this checklist is to assist developers and project engineers in the preparation of a uniform and comprehensive Project-Specific Urban Stormwater
INFLOW DESIGN FLOOD CONTROL SYSTEM PLAN 40 C.F.R. Part PLANT MCINTOSH ASH POND 1 GEORGIA POWER COMPANY
 INFLOW DESIGN FLOOD CONTROL SYSTEM PLAN 40 C.F.R. Part 257.82 PLANT MCINTOSH ASH POND 1 GEORGIA POWER COMPANY EPA s Disposal of Coal Combustion Residuals from Electric Utilities Final Rule (40 C.F.R. Part
RATIONAL METHOD INPUT PARAMETERS
 RATIONAL METHOD INPUT PARAMETERS TIME OF CONCENTRATION Study Area Rational Method Nodes Upper Elevation, ft Lower Elevation, ft Flow Length, mi Tc, min Quarry Phase 1 10 12 352.2 221 0.014 0.17 Quarry
Design Handbook. Low Impact Development Best Management Practices
 Design Handbook for Low Impact Development Best Management Practices Prepared by: 9/2011 Riverside County Flood Control and Water Conservation District 1995 Market Street Riverside, CA 92501 TABLE OF CONTENTS
INITIAL INFLOW DESIGN FLOOD CONTROL SYSTEM PLAN PLANT MCMANUS ASH POND A (AP-1) 40 CFR
 40 CFR") INITIAL INFLOW DESIGN FLOOD CONTROL SYSTEM PLAN PLANT MCMANUS ASH POND A (AP-1) 40 CFR 257.82 EPA s Disposal of Coal Combustion Residuals from Electric Utilities Final Rule (40 C.F.R. Part 257 and Part
INITIAL INFLOW DESIGN FLOOD CONTROL SYSTEM PLAN PLANT MCMANUS ASH POND A (AP-1) 40 CFR 257.82 EPA s Disposal of Coal Combustion Residuals from Electric Utilities Final Rule (40 C.F.R. Part 257 and Part
County of Los Angeles - Department of Public Works
 GENERAL PROJECT INFORMATION County of Los Angeles - Department of Public Works Building and Safety/Land Development Division LOW IMPACT DEVELOPMENT REVIEW SHEET (2017 Los Angeles County Building Code,
Non-Priority Projects WQMP Preparation Guidance Manual
 Non-Priority Projects WQMP Preparation Guidance Manual December 2005 Table of Contents 1.0 Introduction... 1 2.0 Requirements for Development Projects...1 3.0 WQMP Preparation... 2 3.1 Cover Page... 2
Hydromodification Management Measures
 Chapter 7 Hydromodification Management Measures This Chapter summarizes the requirements for controlling erosive flows from development projects. 7.1 Why Require Hydromodification Management? Changes in
Hydromodification Management Measures
 Chapter 7 Hydromodification Management Measures This Chapter summarizes the requirements for controlling erosive flows from development projects. 7.1 Why Require Hydromodification Management? Changes in
STORMWATER RUNOFF AND WATER QUALITY IMPACT REVIEW
 SUBCHAPTER 8 STORMWATER RUNOFF AND WATER QUALITY IMPACT REVIEW 7:45-8.1 Purpose and scope of review Except for those projects expressly exempted by this chapter or waived by the Commission, the Commission
January 20, Nate Hatleback Project Manager, City of Thornton Development Engineering 9500 Civic Center Drive Thornton, CO (303)
") January 20, 2017 Nate Hatleback Project Manager, City of Thornton Development Engineering 9500 Civic Center Drive Thornton, CO 80229 (303) 538-7694 RE: Riverdale Five Retail Drainage Conformance Letter
January 20, 2017 Nate Hatleback Project Manager, City of Thornton Development Engineering 9500 Civic Center Drive Thornton, CO 80229 (303) 538-7694 RE: Riverdale Five Retail Drainage Conformance Letter
Stormwater Control Plan Report
 Stormwater Control Plan Report (SWCP) HILLSDALE TERRACE 2700, 2728, 2790 South El Camino Real San Mateo, CA APN: 039-352-060, 039-352-070, 039-352-090 Stormwater Control Plan Report February 18, 2015 Prepared
HYDROLOGY CHECKLIST FOR LAND DISTURBANCE PERMITS
 HYDROLOGY CHECKLIST FOR LAND DISTURBANCE PERMITS Project Name: Project Number: Reviewed By: Date: Telephone: Email: Address all items marked with an X Minimum Submittal Requirements 1. Conceptual Review
Chapter 6. Hydrology. 6.0 Introduction. 6.1 Design Rainfall
 6.0 Introduction This chapter summarizes methodology for determining rainfall and runoff information for the design of stormwater management facilities in the City. The methodology is based on the procedures
Appendix B. Storm Drain System Data
 MENIFEE VALLEY CAMPUS MASTER PLAN FINAL EIR MT. SAN JACINTO COMMUNITY COLLEGE DISTRICT Appendix Appendix B. Storm Drain System Data June 2017 MENIFEE VALLEY CAMPUS MASTER PLAN FINAL EIR MT. SAN JACINTO
Example 1: Pond Design in a residential development (Water Quantity calculations for a Wet Pond and Wet Extended Detention Pond)
") Chapter 10 Design Examples Example 1: Pond Design in a residential development (Water Quantity calculations for a Wet Pond and Wet Extended Detention Pond) Example 2: Filter Design in a commercial development
Chapter 10 Design Examples Example 1: Pond Design in a residential development (Water Quantity calculations for a Wet Pond and Wet Extended Detention Pond) Example 2: Filter Design in a commercial development
INITIAL RUN-ON AND RUN-OFF CONTROL PLAN 40 C.F.R. PART 257
 INITIAL RUN-ON AND RUN-OFF CONTROL PLAN 40 C.F.R. PART 257.81 HUFFAKER ROAD (PLANT HAMMOND) PRIVATE INDUSTRIAL LANDFILL (HUFFAKER ROAD LANDFILL) GEORGIA POWER COMPANY EPA s Disposal of Coal Combustion
E. STORMWATER MANAGEMENT
 E. STORMWATER MANAGEMENT 1. Existing Conditions The Project Site is located within the Lower Hudson Watershed. According to the New York State Department of Environmental Conservation (NYSDEC), Lower Hudson
San Francisco State University Site 1 Vegetated Infiltration Basin Monitoring Report: Rainy Seasons and
 San Francisco State University Site 1 Vegetated Infiltration Basin Monitoring Report: Rainy Seasons 2011-12 and 2012-13 Project Overview San Francisco State University (SFSU) has implemented several green
Design Example Residential Subdivision
 Design Example Residential Subdivision Rhode Island Stormwater Design and Installation Standards Manual December 2010 Public Training March 22, 2010 Richard Claytor, P.E. 508-833-6600 Appendix D: Site
Preliminary Drainage Analysis
 Preliminary Drainage Analysis Tanimura and Antle Employee Housing Town of Spreckels County of Monterey, California LIB150205 May 29, 2015 Prepared For: Tanimura and Antle Produce Prepared By: 9699 Blue
IV. ENVIRONMENTAL IMPACT ANALYSIS G. HYDROLOGY/WATER QUALITY
 IV. ENVIRONMENTAL IMPACT ANALYSIS G. HYDROLOGY/WATER QUALITY ENVIRONMENTAL SETTING The project site is located in the Wilshire community of the City of Los Angeles and is bound by S. Wetherly Drive to
Appendix F HYDROLOGY/WATER QUALITY REPORT TIESLAU CIVIL ENGINEERING
 Appendix F HYDROLOGY/WATER QUALITY REPORT TIESLAU CIVIL ENGINEERING T IE S L A U C I V IL E N G I NE E R IN G, IN C. P.O. B o x 2 2 9 7, K i n g s B ea c h, C A 9 6 1 4 3 p h : (5 3 0 )5 4 6-0 8 6 1 8
RETENTION BASIN EXAMPLE
 -7 Given: Total Tributary Area = 7.5 ac o Tributary Area within Existing R/W = 5.8 ac o Tributary Area, Impervious, Outside of R/W = 0.0 ac o Tributary Area, Pervious, Outside of R/W = 1.7 ac o Tributary
INFLOW DESIGN FLOOD CONTROL SYSTEM PLAN PLANT BARRY ASH POND ALABAMA POWER COMPANY
 INFLOW DESIGN FLOOD CONTROL SYSTEM PLAN PLANT BARRY ASH POND ALABAMA POWER COMPANY Section 257.82 of EPA s regulations requires the owner or operator of an existing or new CCR surface impoundment or any
CORBIN AND NORDHOFF IV. ENVIRONMENTAL IMPACT ANALYSIS ENV EIR F. HYDROLOGY
 F. HYDROLOGY ENVIRONMENTAL SETTING Project Site The Project Site is located at 19601 Nordhoff Street in the Chatsworth area of the City of Los Angeles, California, within the Chatsworth - Porter Ranch
APPENDIX F HYDROLOGY REPORT
 APPENDIX F HYDROLOGY REPORT UCSD LONG RANGE DEVELOPMENT PLAN HYDROLOGY STUDY MAY 2004 PREPARED FOR: UNIVERSITY OF CALIFORNIA, SAN DIEGO 10280 NORTH TORREY PINES ROAD, SUITE 340 LA JOLLA, CA 92093-0965
INITIAL RUN-ON AND RUN-OFF CONTROL PLAN 40 C.F.R. PART 257
 INITIAL RUN-ON AND RUN-OFF CONTROL PLAN 40 C.F.R. PART 257.81 PLANT BOWEN PRIVATE INDUSTRY SOLID WASTE DISPOSAL FACILITY (ASH LANDFILL) GEORGIA POWER COMPANY EPA s Disposal of Coal Combustion Residuals
Stormwater Bio-Infiltration Pilot Project Concept Proposal Submitted by
 Concept Proposal Submitted by Public Works Department 1947 Center Street, Fourth Floor Berkeley, CA 94704 December 17, 2009 Executive Summary The s Public Works Department submits this concept proposal
INFLOW DESIGN FLOOD CONTROL SYSTEM PLAN 40 C.F.R. PART PLANT YATES ASH POND 3 (AP-3) GEORGIA POWER COMPANY
 GEORGIA POWER COMPANY") INFLOW DESIGN FLOOD CONTROL SYSTEM PLAN 40 C.F.R. PART 257.82 PLANT YATES ASH POND 3 (AP-3) GEORGIA POWER COMPANY EPA s Disposal of Coal Combustion Residuals from Electric Utilities Final Rule (40 C.F.R.
INFLOW DESIGN FLOOD CONTROL SYSTEM PLAN 40 C.F.R. PART 257.82 PLANT YATES ASH POND 3 (AP-3) GEORGIA POWER COMPANY EPA s Disposal of Coal Combustion Residuals from Electric Utilities Final Rule (40 C.F.R.
Phase II: Proposed (regulated) Impervious in disturbed area (ac) Long Lake Existing Impervious in disturbed area (ac)
 Impervious in disturbed area (ac) Long Lake Existing Impervious in disturbed area (ac)") Permit Application No.: 17-181 Rules: Erosion Control, Wetland Protection, and Waterbody Crossings & Structures Applicant: Hennepin County Received: 4/27/17 Project: CSAH 112 Phase II Complete: 9/5/17
Permit Application No.: 17-181 Rules: Erosion Control, Wetland Protection, and Waterbody Crossings & Structures Applicant: Hennepin County Received: 4/27/17 Project: CSAH 112 Phase II Complete: 9/5/17
June 27, 2012 Holly Galavotti U.S. EPA
 June 27, 2012 Holly Galavotti U.S. EPA Urban stormwater is a leading source of water quality impairment Urban stormwater identified as source of impairment (2004 WQ Report) 22,559 miles of impaired rivers
Sizing Calculations and Design Considerations for LID Treatment Measures
 SCVURPPP C.3 Workshop December 18, 2012 Sizing Calculations and Design Considerations for LID Treatment Measures Jill Bicknell, P.E., EOA, Inc. Santa Clara Valley Urban Runoff Pollution Prevention Program
Part 2.0 Non-Numeric Effluent Limitations
 2017 NH Small MS4 General Permit Page 50 of 67 report on its findings and progress towards making the practices allowable. (Information available at: http://www.epa.gov/region1/npdes/stormwater/assets/pdfs/addressingbarrier2lid.pdf
Applying the Water Quality Volume
 Applying the Water Quality Volume Justin Reinhart, PE Division of Surface Water Northeast Ohio Stormwater Training Council Cleveland, Ohio & Richfield, Ohio July 12, 2018 July 25, 2018 Post-Construction
New Draft Model BMP Design Manual for San Diego Region
 New Draft Model BMP Design Manual for San Diego Region Public Input 2013 Storm Water Permit June 10, 2014 & June 11, 2014 1 Welcome Sign-In Refreshments Sponsor Break Q&A and Input 2 Outline of Presentation
Municipal Regional Stormwater Permit Provision C.3 Model Conditions of Approval
 County Government Center P 650.599.1514 555 County Center, 5 th Floor F 650.363.7882 Redwood City, CA 94063 flowstobay.com ATTACHMENT 1 Municipal Regional Stormwater Permit Provision C.3 Model Conditions
HYDROLOGY STUDY LA MIRADA BOULEVARD La Mirada, California
 HYDROLOGY STUDY 12000 LA MIRADA BOULEVARD La Mirada, California TTM 73119 Prepared for: The Olson Company 3010 Old Ranch Parkway, Suite 100 Seal Beach, CA 90740 Contact: Mr. Aaron Orenstein (562) 370-9531
Stormwater Awareness Training
 Stormwater Awareness Training 2014 Purpose of Stormwater Awareness Training To educate City of Aurora employees on the importance of identifying non stormwater discharges and reducing pollution through
STORMWATER MANAGEMENT PLAN CONTENTS CHECKLIST Stormwater Management Plan Contents. SWMP Page # or Reference Location Yes/No
 STORMWATER MANAGEMENT PLAN CONTENTS CHECKLIST Stormwater Management Plan Contents Site Description A description of construction activity. The proposed sequence for major activities. Estimates of the total
Water Resources Management Plan
 P L Y M O U T H M I N N E S O T A Appendix D: The developed a to analyze and minimize the impact of existing and future development on the City s natural resources. It is important to the City to have
Home Remodeling Projects
 Should your project require a Standard Urban Stormwater Mitigation Plan (SUSMP), please see the City of Pomona s Standard Urban Stormwater Mitigation Plan (SUSMP) Pamphlet Best Management Practices For
Detention Pond Design Considering Varying Design Storms. Receiving Water Effects of Water Pollutant Discharges
 Detention Pond Design Considering Varying Design Storms Land Development Results in Increased Peak Flow Rates and Runoff Volumes Developed area Robert Pitt Department of Civil, Construction and Environmental
Stormwater Programs. BIA Meeting June 5, Jason Uhley
 Stormwater Programs BIA Meeting June 5, 2014 Jason Uhley Chief of Watershed Protection Riverside County Flood Control and Water Conservation District Presentation Outline Clean Water Act Stormwater Program
3.10 Hydrology and Water Quality. Environmental Setting
 3.10 Hydrology and Water Quality This section describes the potential hydrology and water quality impacts associated with the proposed changes to the approved project. Environmental Setting This section
Preliminary Stormwater Quality Mitigation Report
 Preliminary Stormwater Quality Mitigation Report MGA Chatsworth Campus 20000 Prairie Street Chatsworth, CA TUSTIN 17782 17th Street Suite 200 Tustin, CA 92780-1947 714.665.4500 Fax 714.665.4501 LOS ANGELES
Pre-Treatment Bioretention Cells Bioswales IOWA STORMWATER MANAGEMENT MANUAL DECEMBER 16, 2015
 Pre-Treatment Bioretention Cells Bioswales IOWA STORMWATER MANAGEMENT MANUAL DECEMBER 16, 2015 Urban Runoff Background How we got here What Problem?? Provenance of the Problem Unified Sizing Criteria What
Washington State University Pullman Stormwater Management Program Plan 2017
 Washington State University Pullman Stormwater Management Program Plan 2017 The Washington State University (WSU) Pullman Stormwater Management Program (SWMP) Plan has six elements derived from the Eastern
Santa Margarita Region of Riverside County
 Santa Margarita Region of Riverside County Water Quality Management Plan (WQMP), Hydromodification Management Plan (HMP) Program Training Presented by: Daniel Apt, CPSWQ, CPESC Vice President Kevin Villarama
Clean Water Services Design and Construction Standards Update: Base Strategy and Methodology to Address Hydromodification Impacts
 Clean Water Services Design and Construction Standards Update: Base Strategy and Methodology to Address Hydromodification Impacts 1.0 INTRODUCTION The proposed hydromodification base strategy (Base Strategy)
CITY OF ENCINITAS STORMWATER INTAKE FORM AND PRIORITY DEVELOPMENT PROJECT STORMWATER QUALITY MANAGEMENT PLAN (SWQMP)
") CITY OF ENCINITAS STORMWATER INTAKE FORM AND PRIORITY DEVELOPMENT PROJECT STORMWATER QUALITY MANAGEMENT PLAN (SWQMP) FOR: [PROJECT NAME] [APPLICATION/PERMIT NUMBER(S)] [SITE ADDRESS] [ENCINITAS, CA 92024]
CITY OF ENCINITAS STORMWATER INTAKE FORM AND PRIORITY DEVELOPMENT PROJECT STORMWATER QUALITY MANAGEMENT PLAN (SWQMP) FOR: [PROJECT NAME] [APPLICATION/PERMIT NUMBER(S)] [SITE ADDRESS] [ENCINITAS, CA 92024]
LAKE COUNTY HYDROLOGY DESIGN STANDARDS
 LAKE COUNTY HYDROLOGY DESIGN STANDARDS Lake County Department of Public Works Water Resources Division 255 N. Forbes Street Lakeport, CA 95453 (707)263-2341 Adopted June 22, 1999 These Standards provide
CHELTENHAM TOWNSHIP Chapter 290: WATERSHED STORMWATER MANAGEMENT Article IV: Stormwater Management
 CHELTENHAM TOWNSHIP Chapter 290: WATERSHED STORMWATER MANAGEMENT Article IV: Stormwater Management Online ECode Available on Cheltenham Township Website at: http://ecode360.com/14477578 For all regulated
3.3 Acceptable Downstream Conditions
 iswm TM Criteria Manual - = Not typically used or able to meet design criterion. 1 = The application and performance of proprietary commercial devices and systems must be provided by the manufacturer and
Hydrologic Study Report for Single Lot Detention Basin Analysis
 Hydrologic Study Report for Single Lot Detention Basin Analysis Prepared for: City of Vista, California August 18, 2006 Tory R. Walker, R.C.E. 45005 President W.O. 116-01 01/23/2007 Table of Contents Page
Chapter 3: Post Construction Water Quality Best Management Practices
 Chapter 3: Post Construction Water Quality Best Management Practices 3.1 Introduction to Stormwater Quality Under the regulations governing the NPDES Stormwater Phase II program, Montgomery County is required
Permeable Pavement Hydrologic Modeling
 Permeable Pavement Hydrologic Modeling Robin Kirschbaum, PE, LEED AP Alice Lancaster, PE April 24, 2013 Presentation Overview Overview of Hydrologic Modeling Performance Standards Modeling Guidelines,
GUIDELINES FOR STORMWATER BACTERIA REDUCTIONS THROUGH BMP IMPLEMENTATION NY/NJ HARBOR TMDL DEVELOPMENT
 GUIDELINES FOR STORMWATER BACTERIA REDUCTIONS THROUGH BMP IMPLEMENTATION NY/NJ HARBOR TMDL DEVELOPMENT Elevated bacteria in stormwater runoff in urban areas are well documented by many researchers. Monitoring
SECTION 4 SURFACE WATER MANAGEMENT DESIGN AND CONSTRUCTION REQUIREMENTS
 SECTION 4 SURFACE WATER MANAGEMENT DESIGN AND CONSTRUCTION REQUIREMENTS Page 4-1 INTRODUCTION 4-3 4-1.01 Applicability of VMCs 14.24, 14.25, 14.26 4-4 4-1.02 Minimum Requirements - Projects Below Threshold
TABLE OF CONTENTS PART III - MINIMUM DESIGN STANDARDS Section 105 DRAINAGE SYSTEM DESIGN SPECIFICATIONS AND SCOPE 105.1
 TABLE OF CONTENTS PART III - MINIMUM DESIGN STANDARDS Section 105 DRAINAGE SYSTEM DESIGN SECTION TITLE PAGE 105.1. SPECIFICATIONS AND SCOPE 105.1 105.2. METHODS OF ANALYSIS 105.1 105.2.1. Rational Method
Krista Reininga, PE Hydromodification and What it Means for the Design of Stormwater Facilities
 Krista Reininga, PE Hydromodification and What it Means for the Design of Stormwater Facilities Agenda 1. Evolution of Water Quality Facilities 2. Regulatory Response/MS4 Permit Requirements 3. Change
Storm Water Permitting Requirements for Construction Activities. John Mathews Storm Water Program Manager Division of Surface Water
 Storm Water Permitting Requirements for Construction Activities John Mathews Storm Water Program Manager Division of Surface Water Why Permit Storm Water? Impacts During Construction Not an issue until
Contents. Drainage Analysis: Hunters Trace, Westpointe, and Hunters Creek
 Drainage Analysis: Hunters Trace, Westpointe, and Hunters Creek Contents SITE LOCATION / DESCRIPTION... 3 WESTPOINTE STORMWATER MANAGEMENT PLAN... 3 THE ENCLAVE AT WESTPOINTE DETENTION POND... 3 Table
Storm Sewers, Page 2
 Storm Sewers storm sewer systems are dendritic systems used to collect and direct stormwater runoff storm sewer systems are integral components of any urban infrastructure curbs, gutters and storm inlets
Stormwater Control Plan for Post Construction Requirements Exhibit 4
 Stormwater Control Plan for Post Construction Requirements Exhibit 4 Application Submittal Where directions state Done that means no additional information or forms below that point needs to be filled
Modeling Infiltration BMPs
 Modeling Infiltration BMPs CAHILL ASSOCIATES Environmental Consultants West Chester, PA (610) 696-4150 www.thcahill.com Design Goals for Calculations 1. Mitigate Peak Rates 2-Year to 100-Year 2. No Volume
The site slopes generally from the southwest to northeast at approximately 3.7 percent.
 March 3, 2017 Nate Hatleback Project Manager, City of Thornton Development Engineering 9500 Civic Center Drive Thornton, CO 80229 (303) 538-7694 RE: Riverdale Five Retail Drainage Conformance Letter Dear
Stormwater Management Manual Revision History
 Stormwater Management Manual Revision History Manual Creation Date: January 30, 2007 12/12/2006 Water Quality for Post-Construction Standards and Criteria are established as part of the National Pollution
Project: Developer/Designer: Reviewer:
 City of Charlottesville, Virginia Engineering Plan Review Checklist (Site Plans, Site Plan Amendments, and Major Subdivisions) 610 East Market Street, Charlottesville, VA 22902 Telephone 434-970-3182;
PART V - STORM DRAIN DESIGN CRITERIA
 PART V - STORM DRAIN DESIGN CRITERIA A. Hydrology Studies and Hydraulic Analyses 1. Drainage area master plans and calculations are to be submitted with all subdivision improvement plans, permit improvement
PART V - STORM DRAIN DESIGN CRITERIA
 PART V - STORM DRAIN DESIGN CRITERIA A. Hydrology Studies and Hydraulic Analyses 1. Drainage area master plans and calculations are to be submitted with all subdivision improvement plans, permit improvement
PRELIMINARY HYDROLOGY STUDY
 PRELIMINARY HYDROLOGY STUDY FOR Tentative Tract Map West Side of Loma Alta Drive City of Oceanside, CA Prepared For: EMERALD HILLS LLC 4272 Dogwood Avenue Seal Beach, CA 90740 Contact: Mr. Jimmy Chen Ph: