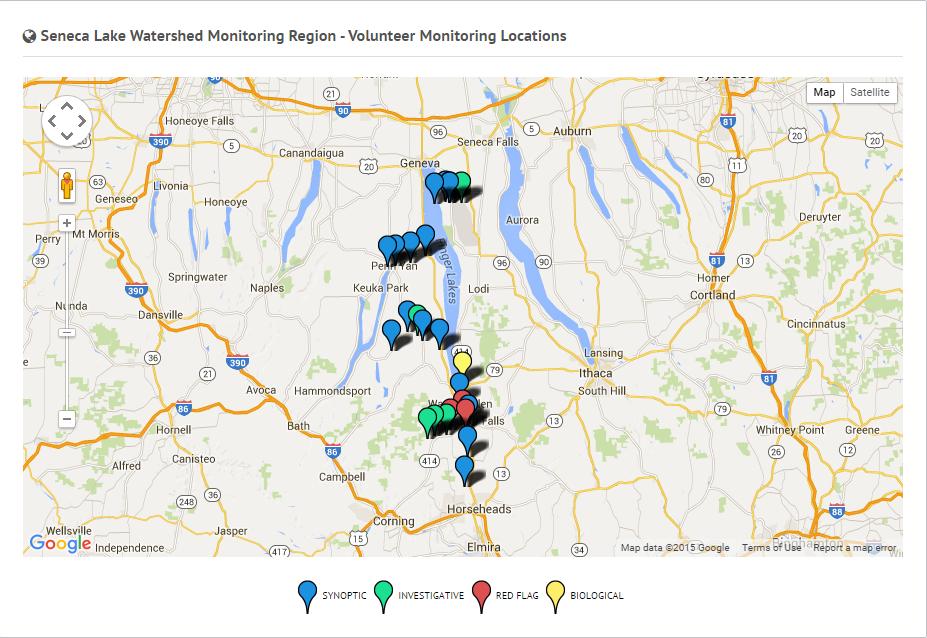
What s In your Watershed Reeder Creek
|
|
|
- Leo Jenkins
- 6 years ago
- Views:
Transcription
1 What s In your Watershed Reeder Creek Stephen Penningroth, Ph.D. Executive Director, Community Science Institute, Ithaca, NY Three Brothers Winery, Geneva, NY October 29, 2015 Sponsored by the Seneca Lake Pure Waters Association
2 Community Science Institute Nonprofit tax exempt environmental organization founded in 2000 Staff: Four (4) full time, five (5) part time Budget: $205,000 in 2014 Environmental Testing Lab: NY State and EPA certified for chemistry and microbiology, including phosphorus and nitrogen nutrients, E. coli, sediment and a dozen other indicators; also certified for drinking water Biological stream monitoring: Two (2) staff are certified BMI taxonomists Online database: Public can view, search and download data free of charge Mission: Partner with local volunteer groups to better understand and protect local water resources by collecting and disseminating scientifically credible water quality data that inform management decisions by communities and their governments Lean, mean data generating machine for local streams!
3


4 Rte 96A Access Rd Reeder Creek Mouth North Patrol Rd Kendig Creek Kendaia Creek
5 No Evidence of Hazardous Substances in Reeder Creek N. Patrol Rd. Access Rd. Rte 96A Mouth Drinking Water Standard Gross Alpha Radioactivity (pci/l) Gross Beta Radioactivity (pci/l) pci/l pci/l Arsenic (mg/l) <0.01 <0.01 <0.01 < Beryllium (mg/l) <0.001 <0.001 <0.001 < Copper (mg/l) < Lead (mg/l) <0.01 <0.01 <0.01 < VOCs (58 total) (mg/l) < < < <
 Most Wanted Organisms were found 6 or more Most wanted indicates No Known Impact Four (4) Least Wanted Organisms")
6 Living in Reeder Creek Benthic Macroinvertebrates (BMI) HUDSON BASIN RIVER WATCH MAY 10, 2015 Slight impact High density of organisms, 5,814 per sample May be linked to high nutrient levels 969 individual organisms identified, 1/6 of sample WAVE PROTOCOL SEPT 29, 2015 Five (5) Most Wanted Organisms were found 6 or more Most wanted indicates No Known Impact Four (4) Least Wanted Organisms were found 4 or more Least Wanted flag stream for further study
7 Why Aren t Nutrients Always a Good Thing? Algae and other plants need phosphorus and nitrogen to grow In freshwater lakes like Seneca Lake, phosphorus is generally the ratelimiting nutrient Too much phosphorus is a problem because it can lead to excessive plant growth including algal blooms this is called eutrophication Algae die and sink to the bottom of the lake where they are eaten by decomposer organisms The decomposers metabolize the dead algae aerobically, using up dissolved oxygen in the water If the oxygen concentration drops below about 3 mg/l, fish die
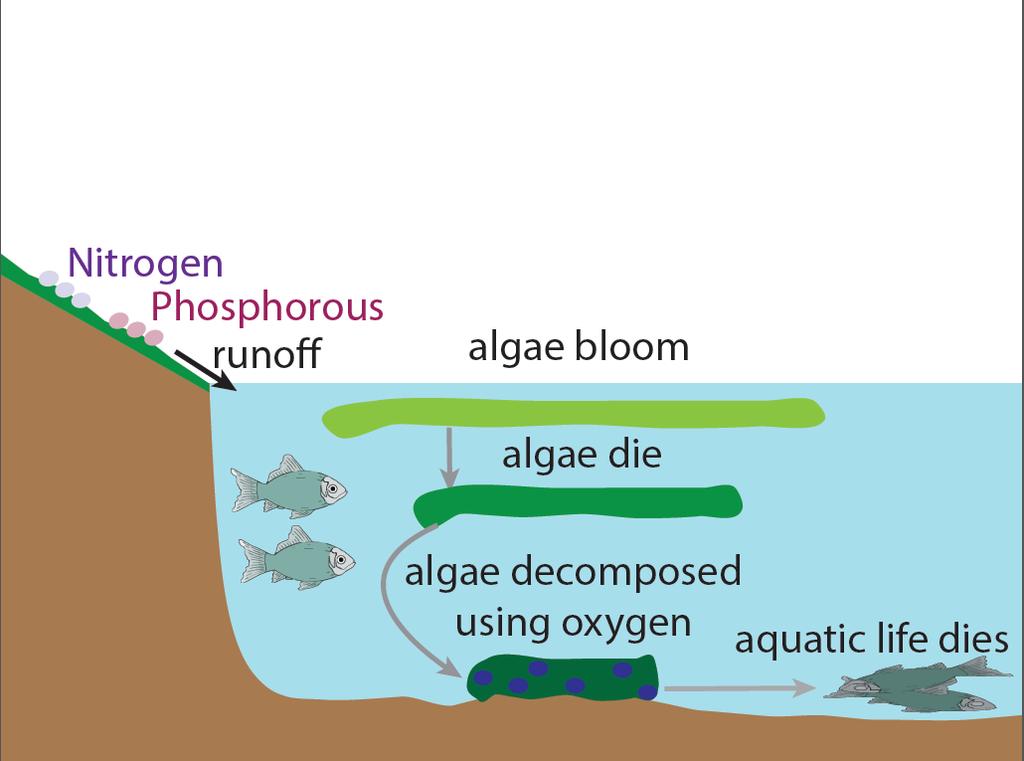
8 Eutrophication
9 A Very Brief Detour Through Phosphorus Chemistry Certified testing determines concentrations of two general classes of phosphorus: Total Phosphorus, which includes dissolved and particulate phosphorus; and Soluble Reactive Phosphorus, which includes only dissolved phosphorus Dissolved phosphorus is ~100% bioavailable to feed algae Particulate phosphorus in human and animal waste: It eventually breaks down, dissolves and becomes bioavailable Phosphorus bound to soil particles: It often stays attached to soil and does not become bioavailable As a rule, stormwater runoff increases total phosphorus in streams, because runoff is enriched in dirt and waste containing phosphorus
10 Phosphorus Concentration ( g/l) Seneca Army Depot 0 1. Average Base Flow Phosphorus Levels are extremely high, ~800 ug/l 2. Base Flow Phosphorus in Reeder Creek is ~100% dissolved, because Total Phosphorus = Dissolved Phosphorus 3. Phosphorus Concentration decreases as Reeder Creek flows downstream, showing phosphorus is being diluted by groundwater with lower phosphorus levels Dissolved Bioavailable Phosphorus Base Flow Total Phosphorus Base Flow Miles from North Patrol Rd Seneca Lake
11 Two Examples of Stormwater Runoff: Total Suspended Solids and Nitrate Levels Increase Substantially Downstream in Reeder Creek Nitrate + Nitrite (mg N/L) Base Flow Nitrate +Nitrite Nitrogen (as N) Stormwater Nitrate +Nitrite Nitrogen (as N) Base Flow Total Suspended Solids Stormwater Total Suspended Solids Stormwater Base Flow Total Suspended Solids (mg/l) 0 Seneca Army Depot Miles from North Patrol Rd 0 Seneca Lake
12 Another Example of Stormwater Runoff in Reeder Creek: E. Coli levels rise dramatically but they stay at ~same high level all the way downstream 12,000 10,000 E. Coli Base Flow E. Coli Stormwater E. Coli (colonies/100 ml) 8,000 6,000 4,000 2,000 Seneca Army Depot 0 North Patrol Rd Access Road Rt. 96 A Reeder Creek Mouth 235 Seneca Lake
13 Effect of stormwater runoff on phosphorus in Reeder Creek is to reduce, not increase, its concentration; typical behavior for groundwater constituents Total Phosphorus Base Flow Total Phosphorus Stormwater Total Phosphorus ( g/l) Seneca Army Depot North Patrol Rd Access Road Rt. 96 A Reeder Creek Mouth Seneca Lake
14 How Do Levels of Phosphorus and E. coli in Reeder Creek Compare to Other Seneca Lake Tributaries? Phosphorus Preview Base flow phosphorus averages more than recommended 20 g/l in all streams but is much higher in Reeder Creek, ~800 g/l vs. ~20 50 g/l in other streams Stormwater runoff results in dramatic increases in phosphorus in the Keuka Outlet and Big Stream, rivaling stormwater levels in Reeder Creek E. coli Preview Base flow E. coli is lower on average in Reeder Creek than in other streams Stormwater runoff results in extraordinary increases in E. coli in the Keuka Outlet and Big Stream, exceeding levels in Reeder and Catharine Creeks
15 Average Levels of Dissolved, Bioavailable Phosphorus in Seneca Lake Tributary Streams, Base Flow and Stormwater/Runoff Reeder Creek Mouth Kendig Creek Kendaia Creek Keuka Outlet Mouth Dissolved, Bioavailable Phosphorus Base Flow Dissolved, Bioavailable Phosphorus Stormwater Catherine Creek Mouth Big Stream Mouth Dissolved, Bioavailable Phosphorus ( g/l)
16 Average Levels of Total Phosphorus in Seneca Lake Tributary Streams, Base Flow and Stormwater/Runoff Reeder Creek Mouth Kendig Creek Kendaia Creek Total Phosphorus (as P) Base Flow Total Phosphorus (as P) Stormwater Keuka Outlet Mouth Catherine Creek Mouth Big Stream Mouth Total Phosphorus ( g/l)
17 Average Base Flow Levels of E. coli in Seneca Lake Tributary Streams Reeder Creek Mouth 128 Kendig Creek 380 Kendaia Creek 80 Keuka Outlet Mouth 270 Catherine Creek Mouth Big Stream Mouth Swimming guideline: 235 E. coli colonies/100 ml E.coli (colonies/100 ml)
18 Average Levels of E. coli in Seneca Lake Tributary Streams, Base Flow and Stormwater/Runoff Reeder Creek Mouth ,750 E. Coli Base Flow E. Coli Stormwater Kendig Creek 380 Kendaia Creek 80 Keuka Outlet Mouth ,500 Catherine Creek Mouth Big Stream Mouth ,170 34, ,000 40,000 60,000 80,000 E.coli (colonies/100 ml)
19 Conclusions: Reeder Creek 1. There is no evidence for hazardous or radioactive chemicals in Reeder Creek 2. The Reeder Creek ecosystem appears to be relatively healthy, based on two types of BMI analysis 3. Stormwater conditions result in a rise in E. coli levels from <235 colonies/100 ml to ~10,000 colonies/100 ml 4. Stormwater E. coli levels of ~10,000 colonies/100 ml are constant across all Reeder Creek sampling locations, implying a stormwater surge that originates upstream
20 Conclusions: Reeder Creek (cont d) 5. Base flow phosphorus levels are extraordinarily high, ~800 g/l 6. Base flow phosphorus is ~100% dissolved and presumably inorganic 7. Three lines of evidence suggest the source of dissolved phosphorus is groundwater inside the Seneca Army Depot a) Base flow phosphorus emerging from the Depot is progressively diluted by downstream groundwater entering Reeder Creek b) Base flow phosphorus is greatly diluted by stormwater runoff, which has a low concentration of phosphorus c) Base flow phosphorus concentrations are ~10x lower in nearby Kendig Creek, which is likely exposed to effluent from 5 Points wastewater 8. One possible explanation: Phosphorus ordnance was disposed of at the Seneca Army Depot; the phosphorus residue was not considered to be hazardous and therefore was not remediated; and eventually the residual phosphorus infiltrated into groundwater under the Depot
21 Seneca Lake Tributary Streams: Conclusions A. Average base flow phosphorus is elevated in all Seneca Lake tributary streams sampled to date compared to the NYSDEC s 20 ug/l guideline for total phosphorus B. With the exception of Reeder Creek, stormwater increases in phosphorus are remarkable in all Seneca Lake tributary streams; in the Keuka Outlet, the stormwater phosphorus increases are extraordinary. C. Average base flow E. coli levels exceed the threshold of 235 colonies/100 ml for contact recreation in three (3) of six (6) sampled streams D. Stormwater levels of E. coli are extraordinary in all sampled streams, averaging ~10x to ~100x greater than base flow E. coli levels Stormwater E. coli levels at the mouth of the Keuka Outlet on 9/30/15 were ~4x higher than E. coli at the mouth of Salmon Creek during Tropical Storm Irene on 9/8/11; Salmon Creek drains a heavily agricultural watershed
22 Thank you Seneca Lake Pure Waters Association Three Brothers Winery Carol Hardy CSI staff Michi Schulenberg Lab analyses Laura Dwyer Lab analyses, Power Point Adrianna Hirtler BMI Liz Carter, Becky Sims Volunteer training, coordination Abner Figueroa Database
Water Quality in Seneca Lake Tributary Streams
 Water Quality in Seneca Lake Tributary Streams Stephen Penningroth, Director Community Science Institute Hobart and William Smith Colleges March 24, 2018 Community Science Institute Independent, nonprofit,
Big Stream Fact Sheet
 Big Stream Fact Sheet Big Stream flows into the west shore of Seneca Lake at Glenora Point. Its watershed is dominated by agriculture, though it passes through Dundee and receives effluent from the waste
Acidity and Alkalinity:
 Evaluation of Pollution Sources to Lake Glenville Quarterly Report December 2018 Kimberlee K Hall, PhD Environmental Health Program, Western Carolina University Summary Chemical and microbial analysis
EUTROPHICATION. Student Lab Workbook
 EUTROPHICATION Student Lab Workbook THE SCIENTIFIC METHOD 1. Research Background literature research about a topic of interest 2. Identification of a problem Determine a problem (with regards to the topic)
The Snapshot CONODOGUINET CREEK WATERSHED SNAPSHOT
 CONODOGUINET CREEK WATERSHED SNAPSHOT ABOVE: CONODOGUINET CREEK AT RT 74 BRIDGE FACING DOWNSTREAM The Snapshot The Conodoguinet Watershed Snapshot was a collaborative effort to engage local citizens in
McKenzie Watershed Water Quality Discussion Article
 McKenzie Watershed Water Quality Discussion Article Oregon Department of Environmental Quality Report: Water Years 1996 2004 fostering better stewardship of the McKenzie Watershed resources through voluntary
Long-Term Volunteer Lake Monitoring in the Upper Woonasquatucket Watershed
 Long-Term Volunteer Lake Monitoring in the Upper Woonasquatucket Watershed Linda Green URI Watershed Watch 1-87-95, lgreen@uri.edu WATER QUALITY IS A REFLECTION OF THE ACTIVITIES IN THE LANDS AND WATERS
Water Monitoring in Spa Creek: A Summary
 Water Monitoring in Spa Creek: A Summary Written by: Alexis Jones & Blake Harden Edited by: Hannah Krauss Water monitoring is very important in order to determine the health of the Chesapeake Bay and its
Redwood Shores Lagoon May 2017 Monthly Water Quality Monitoring Report
 Redwood Shores Lagoon May 2017 Monthly Water Quality Monitoring Report Prepared for Redwood City Public Works Services Department 1400 Broadway Redwood City, CA 94063-2594 Prepared by Clean Lakes, Inc.
Water Quality Assessment in the Thames River Watershed
 Water Quality Assessment in the Thames River Watershed Nutrient Trends Karen Maaskant, Upper Thames River Conservation Authority 2015 Lake St. Clair Conference October 21, 2015 Outline Thames River watershed,
Little Bay Water Quality Report Card Spring 2014
 Little Bay Water Quality Report Card Spring 2014 Little Bay is a small, semi-enclosed estuary located in the heart of Rockport, Texas. Estuaries, where freshwater from rivers and streams mixes with salt
Redwood Shores Lagoon August Monthly Water Quality Monitoring Report
 Redwood Shores Lagoon August Monthly Water Quality Monitoring Report Prepared for Redwood City Public Works Services Department 1400 Broadway Redwood City, CA 94063-2594 Prepared by Clean Lakes, Inc. P.
Redwood Shores Lagoon November 2016 Monthly Water Quality Monitoring Report
 Redwood Shores Lagoon November 2016 Monthly Water Quality Monitoring Report Prepared for Redwood City Public Works Services Department 1400 Broadway Redwood City, CA 94063-2594 Prepared by Clean Lakes,
Redwood Shores Lagoon February 2019 Monthly Water Quality Monitoring Report
 Redwood Shores Lagoon February 2019 Monthly Water Quality Monitoring Report Prepared for Redwood City Public Works Services Department 1400 Broadway Redwood City, CA 94063-2594 Prepared by Clean Lakes,
CHAPTER 15 WATER POLLUTION. INTO THE GULF Researchers try to pin down what s choking the Gulf of Mexico
 CHAPTER 15 WATER POLLUTION INTO THE GULF Researchers try to pin down what s choking the Gulf of Mexico SAVING THE BAY Teams of researchers try to pin down what s choking the Chesapeake Water pollution
Hydrology and Water Quality. Water. Water 9/13/2016. Molecular Water a great solvent. Molecular Water
 Hydrology and Water Quality Water Molecular Water Exists as an equilibrium But equilibrium altered by what is dissolved in it Water Molecular Water a great solvent In reality, water in the environment
NERRS Science. Collaborative Project
 NERRS Science Collaborative Project Detecting non point nitrogen sources and transport pathways in the Great Bay watershed and engaging decision makers in the science Investigators: Dr. William H. McDowell,
Water Quality: The Basics
 Water Quality: The Basics Environmental Science Why is Water Quality Important? Effects all humans Safe drinking water Allows for food productions and SAFE food products Effects Wildlife Health domestic
Hydrology and Water Quality. Water. Water 9/11/2018. Molecular Water a great solvent. Molecular Water
 Hydrology and Water Quality Water Molecular Water Exists as an equilibrium But equilibrium altered by what is dissolved in it Water Molecular Water a great solvent In reality, water in the environment
Water Chemistry. Water 101
 Water Chemistry Water 101 I. Introduction A. Water is not pure Many different kinds of chemicals dissolved in it Ions, organic chemicals, organic matter, particulate matter, and gases can all be in water
2016 WATER QUALITY MONITORING BELTZVILLE RESERVOIR LEHIGHTON, PENNSYLVANIA
 2016 WATER QUALITY MONITORING BELTZVILLE RESERVOIR LEHIGHTON, PENNSYLVANIA U.S. Army Corps of Engineers Philadelphia District Environmental Resources Branch December 2016 2016 Water Quality Monitoring
Jordan River TMDL Study What Have We Learned So Far?
 Jordan River TMDL Study What Have We Learned So Far? Salt Lake Countywide Watershed Symposium October 29 th, 2008 Hilary Arens & James Harris Utah Division of Water Quality TMDL Update Impairments Water
Portland Water District Sebago Lake Watershed Monitoring Programs Crooked River Monitoring (1977 to 2016) Brie Holme
 Brie Holme") Portland Water District Sebago Lake Watershed Monitoring Programs Crooked River Monitoring (1977 to 2016) Brie Holme Introduction Sebago Lake is the primary drinking water supply for 200,000 people in
Portland Water District Sebago Lake Watershed Monitoring Programs Crooked River Monitoring (1977 to 2016) Brie Holme Introduction Sebago Lake is the primary drinking water supply for 200,000 people in
REPORT. Report No: 2013/0958 Prepared For: Natural Resources Committee Prepared By: Dean Olsen, Environmental Resource Scientist Date: 11 July 2013
 REPORT Document Id: A544088 Report No: 2013/0958 Prepared For: Natural Resources Committee Prepared By: Dean Olsen, Environmental Resource Scientist Date: 11 July 2013 Subject: Waianakarua River Water
Analysis of Chlorophyll-a and other data collected in the Illinois River Watershed from
 Analysis of Chlorophyll-a and other data collected in the Illinois River Watershed from 1996-2003 By W.J. Andrews and D.N. Mott USGS Oklahoma Water Science Center For the Oklahoma Clean Lakes and Watersheds
Aquatic Science Unit 2. Water Quality and Water Pollution
 Aquatic Science Unit 2 Water Quality and Water Pollution What is a healthy water body? In your own words, take a moment to describe what you believe are some of the characteristics of a healthy stream
Manitoba Water Quality Standards, Objectives, and Guidelines Dwight Williamson, Manager Water Quality Management Section Manitoba Conservation
 Manitoba Water Quality Standards, Objectives, and Guidelines 2002 Dwight Williamson, Manager Water Quality Management Section Manitoba Conservation 1 Outline Brief history Review process Overview of proposed
Globeville Landing Outfall Surface Water. December 12, 2017 Andrew Ross, Jon Novick Denver Department of Public Health & Environment
 Globeville Landing Outfall Surface Water December 12, 2017 Andrew Ross, Jon Novick Denver Department of Public Health & Environment Introductions Andrew Ross Environmental Program Manager, DDPHE Jon Novick
2016 HLWD WATER QUALITY RESULTS CATHERINE WEGEHAUPT WATERSHED TECHNICIAN JULY 2017 BOARD MEETING
 2016 HLWD WATER QUALITY RESULTS CATHERINE WEGEHAUPT WATERSHED TECHNICIAN JULY 2017 BOARD MEETING JACK CREEK 1200 2016 JACK CREEK HYDROGRAPH 1.80 1000 1.60 1.40 MEAN DAILY DISCHARGE (CFS) 800 600 400
Eutrophication. How can aquatic ecosystems change over time?
 Why? Eutrophication How can aquatic ecosystems change over time? If you could travel back in time millions of years, the land masses on Earth would not look like they do today. Huge areas were covered
Environmental Services
 215 Environmental Services River Water Quality Summary for the Twin Cities Metropolitan Area In 215, Metropolitan Council Environmental Services (MCES) river monitoring was conducted at six automated and
Cost/benefit Analysis Stormwater Detention Pond Maintenance Controls Demonstration Project. Objective
 Cost/benefit Analysis Stormwater Detention Pond Maintenance Controls Demonstration Project Mark W. Clark, Wetlands and Water Quality Extension Specialist, Soil and Water Science Department, University
Evaluation of Water Quality in. Sylvia Heaton Water Bureau, MDNRE
 Evaluation of Water Quality in Ford and Belleville Lakes Sylvia Heaton Water Bureau, MDNRE Objectives of 2010 TMDL Reevaluation Evaluate nutrient (total phosphorus) levels in Ford and Belleville Lakes
Sustaining Colorado s Watersheds: Making the Water Quality Connections October 2-4, 2007
 Sustaining Colorado s Watersheds: Making the Water Quality Connections October 2-4, 2007 Barr Lake and Milton Reservoir Watershed Management Plan ~ Brief History of the Reservoirs ~ Overview of the BMW
Environmental Services
 Environmental Services 14 River Water Quality Summary for the Twin Cities Metropolitan Area This document is a summary of the 14 water quality of major rivers in the Twin Cities metropolitan area (metro
Owasco Lake: The 2010 Update Owasco Lake Watershed Association August 4 th, 2010, Meeting Data Water Quality & Its Protection
 Lake: The Update Lake Watershed Association August th,, Meeting www.erh.noaa.gov/nerfc/basin_info/owsn.html John D Halfman Environmental Studies Program Department of Geoscience Finger Lakes Institute
Analyses for geochemical investigations traditionally report concentrations as weight per volume of the measured ions (mg/l of NO 3 , NO 2
 Nitrate-Nitrogen 55 Nutrients The nutrients nitrogen and phosphorus occur naturally and also may be introduced to groundwater systems from urban and agricultural fertilizer applications, livestock or human
DOE/PPPO/ &D1 FBP-ER-PRO-WD-RPT-0001 Revision 3 April ENVIRONMENTAL NON-RADIOLOGICAL PROGRAM INFORMATION
 5. ENVIRONMENTAL NON-RADIOLOGICAL PROGRAM INFORMATION 5.1 SUMMARY Non-radiological environmental monitoring at PORTS includes air, water, sediment, and fish. Monitoring of non-radiological parameters is
Dirty Water. Adapted from: Dirty Water in Living in Water. National Aquarium in Baltimore, Grade Level: all. Duration: 1-2 class periods
 Dirty Water Adapted from: Dirty Water in Living in Water. National Aquarium in Baltimore, 1997. Nitrogen and Phosphorus Grade Level: all Duration: 1-2 class periods Setting: classroom or laboratory Summary:
Fountain Creek Watershed Water Quality Overview. Fountain Creek Watershed Citizen Advisory Committee June 12, 2015
 Fountain Creek Watershed Water Quality Overview Fountain Creek Watershed Citizen Advisory Committee June 12, 2015 Outline Fountain Creek Watershed Strategic Plan - 2009 Regulatory standards and classifications
Pembina River Watershed Water Quality Report
 Pembina River Watershed Water Quality Report January 29 Prepared by: Manitoba Water Stewardship 16-123 Main St. Winnipeg, MB. Canada State of the Watershed Report 5OA and 5OB Pembina River Watershed -
An Introduction to The Ecology of Lakes, Ponds and Reservoirs. Developing a Management Plan
 An Introduction to The Ecology of Lakes, Ponds and Reservoirs Developing a Management Plan Stephen J. Souza, Ph.D. Princeton Hydro, LLC 1108 Old York Road Ringoes, NJ 08551 ssouza@princetonhydro.com Objective
2018 WATER QUALITY MONITORING BLUE MARSH RESERVOIR LEESPORT, PENNSYLVANIA
 2018 WATER QUALITY MONITORING BLUE MARSH RESERVOIR LEESPORT, PENNSYLVANIA U.S. Army Corps of Engineers Philadelphia District Environmental Resources Branch January 2019 2018 Water Quality Monitoring Blue
Little Cypress Bayou Special Study - Subwatershed 1.10
 - Subwatershed 1.1 Sabine River Authority of Texas August 31, 21 Prepared in Cooperation with the Texas Natural Resource Conservation Commission Under the Authorization of the Texas Clean Rivers Act Table
Phosphorus in the. Minnesota River
 Phosphorus in the Minnesota Phosphorus has been identified as a major pollutant of the Minnesota. It s one of the main reasons the Minnesota is regarded as the most polluted river in the state. Phosphorus
Lake Fred Watershed Management Plan for Nutrient Reduction. Jin Chen. ENVL 4300-Environmental Issues. Richard Stockton University
 LAKE FRED WATERSHED MANAGEMENT PLAN 1 Lake Fred Watershed Management Plan for Nutrient Reduction Jin Chen ENVL 4300-Environmental Issues Richard Stockton University Spring 2015 LAKE FRED WATERSHED MANAGEMENT
National Science Content Standards: A: Science as Inquiry E: Science and Technology
 National Science Content Standards: A: Science as Inquiry E: Science and Technology To develop an understanding of water quality monitoring and an appreciation of the methods used to keep water safe and
Comparative Study on Total Suspended Solids and Nutrients of the Las Vegas Wash Between the Demonstration Weir and its Terminus at the Las Vegas Bay
 Comparative Study on Total Suspended Solids and Nutrients of the Las Vegas Wash Between the Demonstration Weir and its Terminus at the Las Vegas Bay Delta September 2006 Comparative Study on Total Suspended
Status of Water Quality in Ohio: The 2018 Integrated Report. April 25, 2018
 Status of Water Quality in Ohio: The 2018 Integrated Report April 25, 2018 Today s Topics Overview of the 2018 Integrated Report Purpose and requirements Assessment overview Differences from the 2016 Integrated
2017 National Pollutant Release Inventory (NPRI) Report
 Report") 2017 National Pollutant Release Inventory (NPRI) Report City of London s Environmental and Engineering Services Division June 5, 2018 Page 1 of 14 Table of Contents 2017 NPRI... 3 Brief explanatory notes
2017 National Pollutant Release Inventory (NPRI) Report City of London s Environmental and Engineering Services Division June 5, 2018 Page 1 of 14 Table of Contents 2017 NPRI... 3 Brief explanatory notes
 Good Morning! Bruce Gilman Department of Environmental Conservation and Horticulture Finger Lakes Community College 3325 Marvin Sands Drive Canandaigua, New York 14424 585-785- 1255 gilmanba@flcc.edu Northern
Pollutant Types and Sources
 Pollutant Types and Sources FSA STORMWATER BMP SEMINAR SEPTEMBER 11, 2015 Prevailing thoughts about nutrient pollution and stormwater 1. Nutrient pollutant load estimates are commonly represented by a
2016 WATER QUALITY MONITORING PROMPTON RESERVOIR PROMPTON, PENNSYLVANIA
 2016 WATER QUALITY MONITORING PROMPTON RESERVOIR PROMPTON, PENNSYLVANIA U.S. Army Corps of Engineers Philadelphia District Environmental Resources Branch December 2016 2016 Water Quality Monitoring Prompton
Eutrophication: Tracing Nutrient Pollution Back to Penns Creek
 Eutrophication: Tracing Nutrient Pollution Back to Penns Creek Nutrients are substances that life depends on for growth and reproduction. However, when these nutrients enter our planets waterways in excess,
Lake Washington. Water Quality Assessment Report. Copyright 2012 PLM Lake & Land Management Corp.
 Lake Washington 2012 Water Quality Assessment Report Copyright 2012 PLM Lake & Land Management Corp. Water Quality Report On May 22nd, June 18th, July 30th, August 29th, and September 27 th, 2012, PLM
HARPETH RIVER MAIN STEM DISSOLVED OXYGEN STUDY
 HARPETH RIVER MAIN STEM DISSOLVED OXYGEN STUDY September 18, 2002 Report prepared by David J. Wilson Introduction Dissolved oxygen (dissolved O 2, a.k.a. DO) is essential for fish and benthic macroinvertebrates.
Fact Sheet. Chesapeake Bay Water Quality
 Fact Sheet Chesapeake Bay Water Quality Water quality is a critical measure of the Chesapeake Bay s health. For the Bay to be healthy and productive, the water must be safe for people and must support
Results from Fall Water Monitoring FortWhyte Alive Riverwatch Test Kit September October 2017
 Results from Fall Water Monitoring FortWhyte Alive Riverwatch Test Kit September October 2017 with: Westwood Collegiate, Elmwood Jr. High, Maples Met School, Miles Macdonnell Collegiate, Seven Oaks Met
Portland Water District Sebago Lake Watershed Monitoring Programs Crooked River Monitoring (1977 to 2017) Brie Holme
 Brie Holme") Portland Water District Sebago Lake Watershed Monitoring Programs Crooked River Monitoring (1977 to 2017) Brie Holme Introduction Sebago Lake is the primary drinking water supply for 200,000 people in
Portland Water District Sebago Lake Watershed Monitoring Programs Crooked River Monitoring (1977 to 2017) Brie Holme Introduction Sebago Lake is the primary drinking water supply for 200,000 people in
Results from the 2017 Water Quality Monitoring Program
 Results from the 217 Water Quality Monitoring Program As part of a larger project, this summer the BWC conducted water sampling throughout the Belleisle Bay to get a baseline of data and determine the
Ambient Water Quality Objectives For The Tributaries To Okanagan Lake Near Kelowna
 Water Quality Ambient Water Quality Objectives For The Tributaries To Okanagan Lake Near Kelowna Overview Report Water Management Branch Environment And Resource Division Ministry Of Environment, Lands
EUTROPHICATION. Teacher s Manual
 EUTROPHICATION Teacher s Manual Preface The following is a, hands on, and inquiry based lesson plan developed by COSEE Mid-Atlantic for teaching eutrophication. The National Education Science Standards
Wisconsin River. Hardest Working River In the Nation
 Hardest Working River In the Nation Hardest Working River In The Nation Largest Basin In Wisconsin 430 miles in length 20% of Wisconsin, with diverse land use 14,776 mi2 catchment at Prairie du Sac Dam
Monitoring Stormwater Best Management Practices: Why Is It Important and What To Monitor
 Monitoring Stormwater Best Management Practices: Why Is It Important and What To Monitor Scott D. Struck, Ph.D. US EPA, Urban Watershed Management Branch New Jersey Water Monitoring Workshop 4/20/2006
Lesson Overview. Cycles of Matter. Lesson Overview. 3.4 Cycles of Matter
 Lesson Overview 3.4 THINK ABOUT IT A handful of elements combine to form the building blocks of all known organisms. Organisms cannot manufacture these elements and do not use them up, so where do essential
Phosphorus Loading and Related Impacts in Southern Cayuga Lake. Dave Matthews Upstate Freshwater Institute Syracuse, NY
 Phosphorus Loading and Related Impacts in Southern Cayuga Lake Dave Matthews Upstate Freshwater Institute Syracuse, NY Upstate Freshwater Institute (UFI) mission: advance freshwater research and protect
Grand River Monitoring
 City of Grand Rapids Environmental Services Grand River Monitoring by Mike Lunn Environmental Services Department Manager Grand River Monitoring History 1968 Grand River Monitoring Network Since 1988 Data
Cycles of Ma,er. Lesson Overview. Lesson Overview. 3.4 Cycles of Matter
 Lesson Overview Cycles of Ma,er Lesson Overview 3.4 Cycles of Matter THINK ABOUT IT A handful of elements combine to form the building blocks of all known organisms. Organisms cannot manufacture these
WATER QUALITY MONITORING IN THE LOXAHATCHEE ESTUARY
 WATER QUALITY MONITORING IN THE LOXAHATCHEE ESTUARY Rebecca Wilder Town of Jupiter Utilities Bud Howard Loxahatchee River District TOWN OF JUPITER UTILITIES PRESENTATION OUTLINE Loxahatchee River District
CLMP+ Report on Fleming Lake (Aitkin County)
") CLMP+ Report on Fleming Lake (Aitkin County) Lake ID# -5-5-6 CLMP+ Data Summary July 7 Authors Shannon Martin Contributors/acknowledgements Terry Dahlberg Sandy Dahlberg Pam Anderson For questions regarding
CLMP+ Report on Fleming Lake (Aitkin County) Lake ID# -5-5-6 CLMP+ Data Summary July 7 Authors Shannon Martin Contributors/acknowledgements Terry Dahlberg Sandy Dahlberg Pam Anderson For questions regarding
Water Pollution. And Humans are 70% Water! A. Facts 1. 71% of the Earth s surface is water I. Water and the Planet Earth
 Water Pollution Water Pollution I. Water and the Planet Earth A. Facts 1. 71% of the Earth s surface is water. 3 0.5.003 2. Of the 100% of water on the planet, % is fresh water, % is available fresh water
CLMP+ Report on Grass Lake (Anoka County) Lake ID# CLMP+ Data Summary
 Lake ID# CLMP+ Data Summary") CLMP+ Report on Grass Lake (Anoka County) Lake ID# 02-0113-00 2012-2013 CLMP+ Data Summary October 2014 Authors Shannon Martin, MPCA Editing and graphic design Public Information Office Staff The (MPCA)
CLMP+ Report on Grass Lake (Anoka County) Lake ID# 02-0113-00 2012-2013 CLMP+ Data Summary October 2014 Authors Shannon Martin, MPCA Editing and graphic design Public Information Office Staff The (MPCA)
Understanding Nutrients and Their Affects on the Environment
 Understanding Nutrients and Their Affects on the Environment Humans & Ecosystems Humans are just like ecosystems, too much or too little of a nutrient is bad for the system. Nutrient management is a balancing
Impacts to Aquatic Habitats from Land-Use or Is It Polluted?
 Impacts to Aquatic Habitats from Land-Use or Is It Polluted? Water Pollution is: The addition of excessive carbon to a system The addition of large amounts of materials to water that causes adverse changes
Rough Guide to Red Flag Monitoring
 May 19, 2012 Introduction Rough Guide to Red Flag Monitoring The mission of the Community Science Institute (CSI) is to empower citizens to understand their local water resources and manage them sustainably.
Eutrophication and the Saltwater Hudson River
 Eutrophication and the Saltwater Hudson River Part 1: Primary Production and Eutrophication in the Hudson Since the Industrial Revolution, the Hudson River has had problems with pollution, yet the challenges
Continuous records for the Chariton River indicate that 2004 was an average water year, with total flow approximately equal to the average annual
 2004 Rathbun Report Iowa State University Limnology Laboratory John A. Downing, Ph.D. George Antoniou, Assistant Scientist For Rathbun Land and Water Alliance August 31, 2005 A. Tributaries Personnel of
Overview of Chapter 21
 21 Water Pollution Overview of Chapter 21 Types of Water Pollution Water Quality Today Agricultural, Municipal, Industrial, Groundwater, Water pollution internationally Improving Water Quality Laws Controlling
Phosphorus Goal Setting Process Questions and Answers 2010
 Lake Winnipesaukee Watershed Management Plan Phase I: Meredith, Paugus, Saunders Bays 1. What is phosphorus? Phosphorus (P) is a naturally occurring element and a major nutrient required for biological
Wakefield Lake TMDL Public Meeting 3/17/2014. Jen Koehler, PE Barr Engineering
 Wakefield Lake TMDL Public Meeting 3/17/2014 Jen Koehler, PE Barr Engineering Outline Project Contacts Introduction to Wakefield Lake Thoughts/Questions/Concerns About TMDL Studies Lake Water Quality and
Urban Geology Spring 2011
 Urban Geology Spring 2011 Gowanus Canal Historical use New York City Water pollution Sewage treatment plants Eutrophication Combined sewage outflows (CSO) Remediation Sustainability Gowanus Canal today
North Dakota s Nutrient Reduction Strategy. Presented to the 2016 ND Water Quality Monitoring Conference March 4, 2016
 North Dakota s Nutrient Reduction Strategy Presented to the 2016 ND Water Quality Monitoring Conference March 4, 2016 Nutrients Nutrients, in appropriate amounts, are essential to the growth and health
Chapter 3 Water Quality Assessment
 Chapter 3 Water Quality Assessment High quality water is more than the dream of the conservationists, more than a political slogan; high quality water, in the right quantity at the right place at the right
Streamside Management. How the area around your pond effects the water.
 Streamside Management Zones and Water Quality How the area around your pond effects the water. Stream(pond)side Management Zone A streamside management zone (SMZ) is a strip of land immediately adjacent
Virginia Department of Environmental Quality Water Quality Monitoring Program
 Virginia Department of Environmental Quality Water Quality Monitoring Program Trend Stations - Historically located, long-term water quality monitoring stations. - Used to assess changes in water quality
Water Pollution and Water Quality (Nazaroff & Alvarez-Cohen, Sections 6.A and 6.B) (with additional materials)
 (with additional materials)") Water Pollution and Water Quality (Nazaroff & Alvarez-Cohen, Sections 6.A and 6.B) (with additional materials) Water is a basic necessity of nature and humans. We use water for: -drinking - food preparation
Water Pollution and Water Quality (Nazaroff & Alvarez-Cohen, Sections 6.A and 6.B) (with additional materials) Water is a basic necessity of nature and humans. We use water for: -drinking - food preparation
Water Resources/Water Quality
 Water Resources/Water Quality From where does your drinking water come? How much land should be set aside for aquifer protection? Why should we care about Barton Springs? What are the effects (if any!)
EFFECT OF INORGANIC WASTES ON THE GROWTH OF AQUA LIFE
 EFFECT OF INORGANIC WASTES ON THE GROWTH OF AQUA LIFE Yathin Maturi &Kalyan Ram* *Research Analyst, Private Pharma (Org) Hyderabad, India. Email: kalyanramds@gmail.com (Received on Date: 12 th December
NUTRIENTS AND PARTICLES TAHOE.UCDAVIS.EDU 9
 NUTRIENTS AND PARTICLES 9 Sources of clarity-reducing and blueness-reducing pollutants In 2017 Research has quantified the primary sources of nutrients (nitrogen and phosphorus) and particulate material
Highlights of a pilot study to investigate natural attenuation of arsenic in the Little River near Norman, Oklahoma, 2012
 Highlights of a pilot study to investigate natural attenuation of arsenic in the Little River near Norman, Oklahoma, 2012 March 2014 By W.J. Andrews, J.R. Masoner, S.H. Rendon, K.A. Smith, 1 J.R. Greer,
West Souris River Technical Water Quality Report Summary
 Page 1 West Souris River Technical Water Quality Report Summary SAMPLING BACKGROUND INFORMATION Surface water quality data have been collected by the Water Quality Management Section, Manitoba Water Stewardship,
Portland Water District Sebago Lake Watershed Monitoring Programs Tributary Monitoring ( ) Kirsten Ness
 Kirsten Ness") Introduction Portland Water District Sebago Lake Watershed Monitoring Programs Tributary Monitoring (1977 2016) Kirsten Ness Sebago Lake is the primary drinking water supply for nearly 200,000 people in
Introduction Portland Water District Sebago Lake Watershed Monitoring Programs Tributary Monitoring (1977 2016) Kirsten Ness Sebago Lake is the primary drinking water supply for nearly 200,000 people in
Treatability of Organic and Radioactive Emerging Contaminants in Stormwater Runoff
 Treatability of Organic and Radioactive Emerging Contaminants in Stormwater Runoff Robert Pitt, Ph.D., P.E., D.WRE, BCEE, University of Alabama Shirley Clark, Ph.D., P.E., D.WRE, Penn State - Harrisburg
COG Region s Potomac Water Quality & Wastewater Treatment Fact Sheet (current draft, as of 7/28/09)
") COG Region s Potomac Water Quality & Wastewater Treatment Fact Sheet (current draft, as of 7/28/9) Background: Current Fact Sheet was prepared several years ago to summarize trends for certain water quality
COG Region s Potomac Water Quality & Wastewater Treatment Fact Sheet (current draft, as of 7/28/9) Background: Current Fact Sheet was prepared several years ago to summarize trends for certain water quality
Frequently Asked Questions - Fertilizers -
 What is fertilizer? What is phosphorus? What is nitrogen? How do I know if the fertilizer is phosphorus or nitrogen free? Which number on the bag of fertilizer is phosphorus and which is nitrogen? Is low
Factsheet: Town of Deep River Water Quality and Stormwater Summary
 79 Elm Street Hartford, CT 06106-5127 www.ct.gov/deep Affirmative Action/Equal Opportunity Employer Factsheet: Town of Deep River Water Quality and Stormwater Summary This document was created for each
Ellen Bailey. UWW Educator training January 13,
 Ellen Bailey UWW Educator training January 13, 2017 ellen.bailey@usu.edu 801-536-4432 Utah Water Watch Partnership between USU Extension and the DWQ Started in 2012 Trained 750+ volunteers, monitoring
Chronic Stream Pollution in a CAFO Rich Watershed in Duplin County, NC
 Chronic Stream Pollution in a CAFO Rich Watershed in Duplin County, NC Michael A. Mallin, Matthew R. McIver, Amanda Kahn Dickens and Anna R. Robuck Center for Marine Sciences University of North Carolina
Welcome. Thank you for joining us! Lower Mississippi River Watershed Management Organization
 Welcome. Thank you for joining us! Lower Mississippi River Watershed Management Organization Lower Mississippi River Watershed Management Organization Watershed Restoration and Protection (WRAP) Study