Chronic Stream Pollution in a CAFO Rich Watershed in Duplin County, NC
|
|
|
- Barnaby Nichols
- 6 years ago
- Views:
Transcription


1 Chronic Stream Pollution in a CAFO Rich Watershed in Duplin County, NC Michael A. Mallin, Matthew R. McIver, Amanda Kahn Dickens and Anna R. Robuck Center for Marine Sciences University of North Carolina Wilmington mallinm@uncw.edu


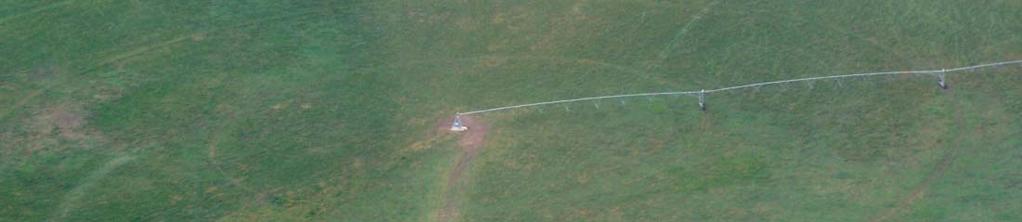
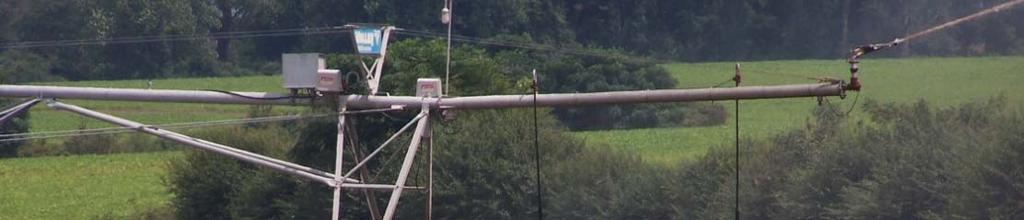
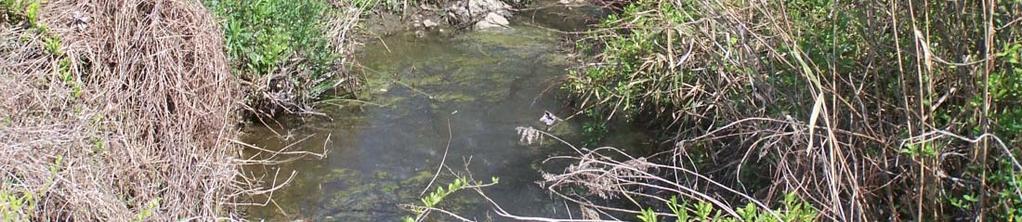
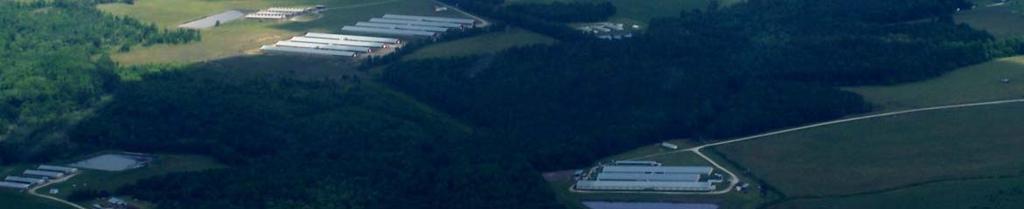
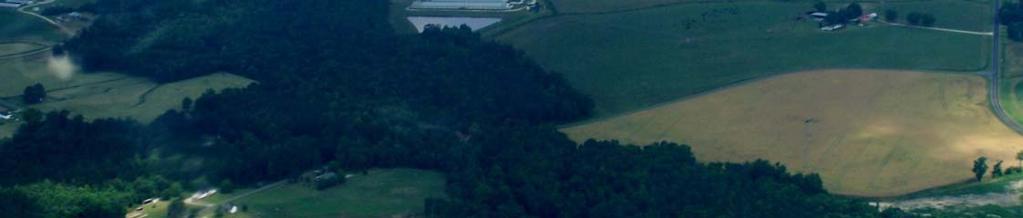
2 Stocking Head Creek Stream originates in swine waste sprayfield Swine and poultry CAFOs mixed in watershed No point sources, only 67 human dwellings in watershed Swine CAFO Poultry CAFO Tributary stream site TR SDCR Largely sandy stream sediments at sampling stations


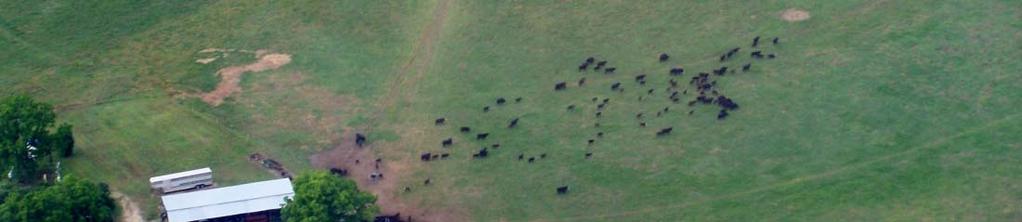
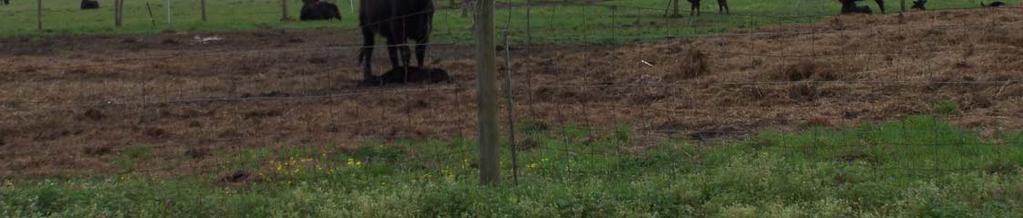
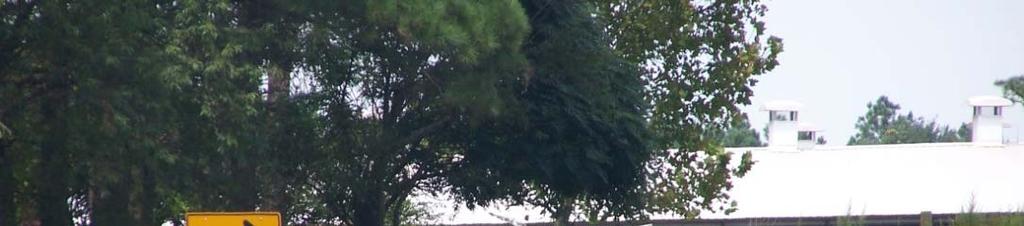
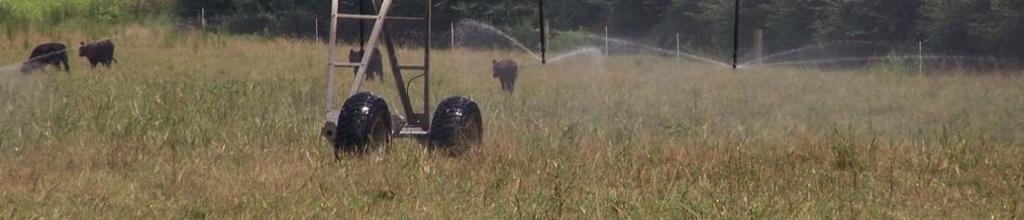
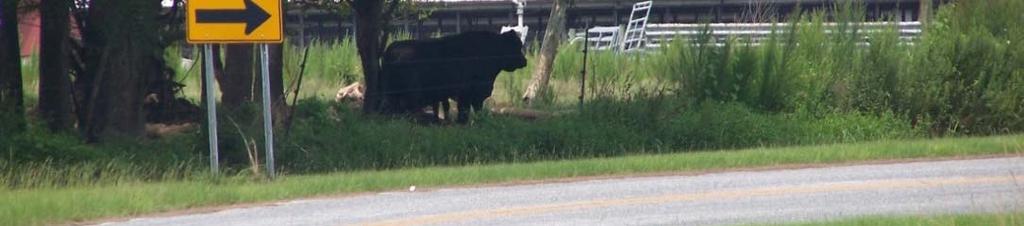

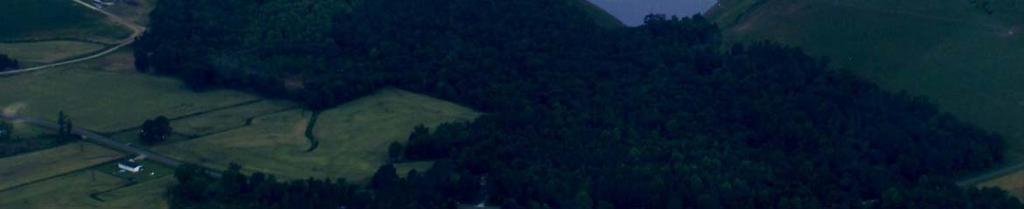
3 There are many head of cattle in the watershed (unquantified), many who graze directly under swine waste spray
4 Field and Laboratory Methods Surface water samples were collected at 7 stream stations on 5 sampling runs within a 30 day period in both summer (July August 2013) and fall (September October 2013) Sampling was performed using procedures required by NCDENR for assessment of use support of NC waters for fecal coliform concentrations. Sampling was performed in both rain and non rain conditions, with statistical analysis (after log transformation) to determine if significant pollution was due to acute surface stormwater runoff, or chronic pollution. Nutrients, TOC, BOD5 and fecal coliform analysis were performed at a state certified contract lab and field parameters and chlorophyll a were performed at the UNCW CMS Aquatic Ecology Laboratory, which is state certified for those parameters. UNCW follows QA/QC procedures of the Lower Cape Fear River Program and is audited annually by NCDENR.
5 GIS based methods The ArcMap 10.1 Hydrology toolset was utilized, and the catchment area of Stocking Head Creek system was identified. A shapefile including all of the documented animal operations from the NC OneMap geospatial portal was clipped to only display those CAFOs within the newly defined watershed area (these consist of swine CAFOs) orthophotography from the North Carolina OneMap service was analyzed for undocumented CAFOs. The signature shape of the farm buildings (long rectangles side by side) was used to identify these locations, which were presumed to be poultry CAFOs. These were manually digitized as polygons superimposed on the aerial photos, and added to the existing CAFO location data to provide a more accurate assessment of the total number of animal operations within the Stocking Head Creek watershed. The dimensions of each poultry building were computed from the digitized aerial photographs. Maximum bird (considered as broiler chickens) population per building were estimated by assuming 743 cm 2 (0.80 ft 2 ) of space allotted per bird as is standard for a major poultry producer (Sanderson Farms 2007). The United Egg Producers (2010) recommend cm 2 (0.47 to 0.60 ft 2 ) of space per egg laying chicken; thus, we feel our counts are conservative. As there is no way to distinguish chicken from turkey operations from the air, for the purposes of this study we assumed all broiler chickens.
6 Stocking Head Creek, Duplin County, North Carolina. Catchment area is 4,893 acres (1,980 ha) and stream length to the Northeast Cape Fear River is 13.7 mi (22.1 km). Contains 40 swine CAFOs permitted for 94,068 head of swine. Poultry estimated (by UNCW) as broilers or other chickens approximately 1.3 million birds in SHC watershed.
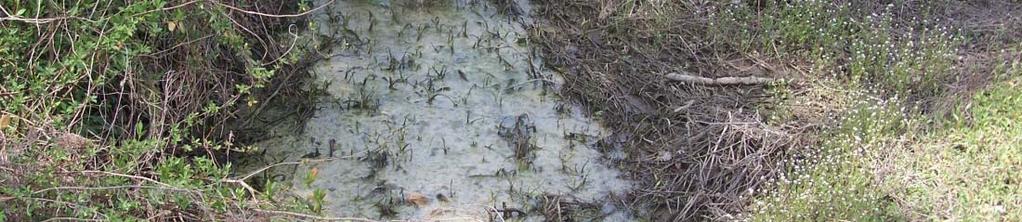
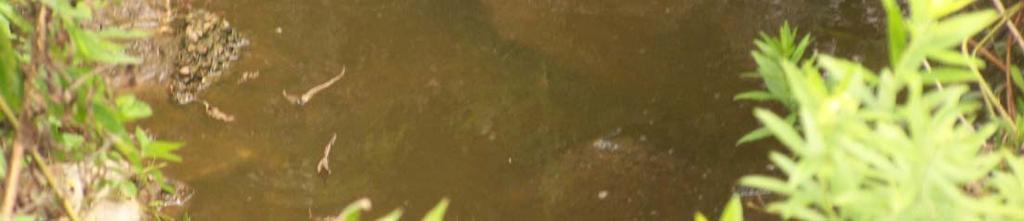
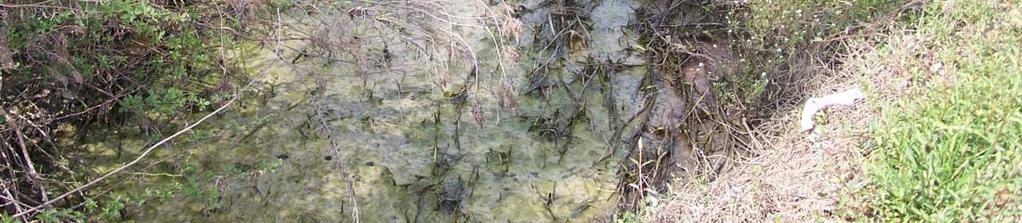
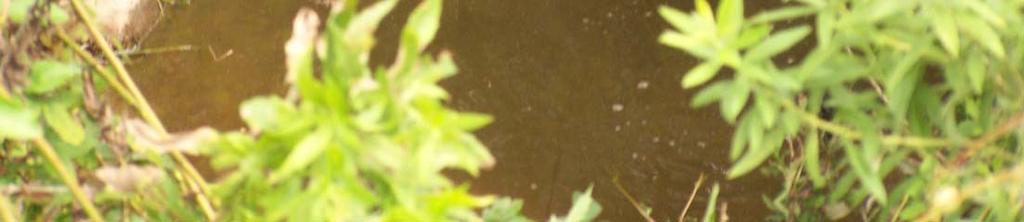
7 Ammonium Concentrations In Stocking Head Creek 2013, mean + standard error mg g N/L TR SDCR SHC GDR SHC CSR SHC SDCR SHC SHCR SHC 50 SHC PBR Station Ammonium concentrations were highest at sites abutting swine waste sprayfields, stations TR SDCR and SHC SHCR. The maximum ammonium concentration found was 38.7 mg N/L at TR SDCR on September 16, 2013.


.")


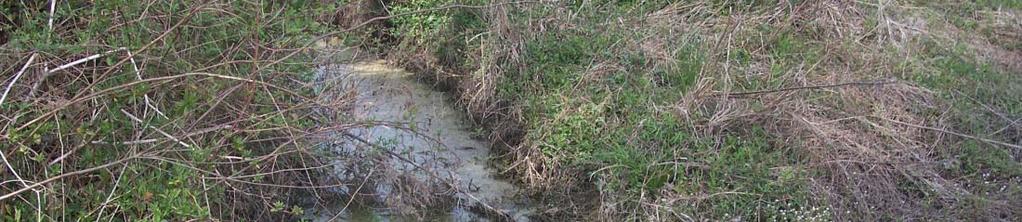
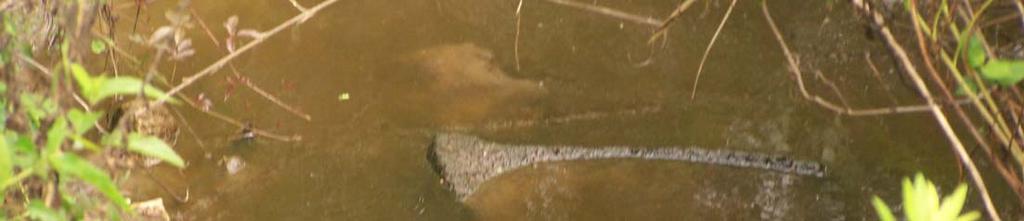
8 The most NH 4+ impacted sites were those adjacent to swine waste sprayfields, for example the Stocking Head Road ste(abo site (above left et and right). An aerial photograph of the watershed shows sprayfield drainage running into creekside wetlands immediately adjacent to the sprayfield.
9 Nitrate concentrations in Stocking Head Creek, 2013, mean + standard error mg g N/L TR SDCR SHC GDR SHC CSR SHC SDCR SHC SHCR SHC 50 SHC PBR Stationti In ten of the 70 samples nitrate N concentrations exceeding 10 mg/l (an EPA criteria to prevent blue baby syndrome) were found in creek samples. Peak areas were not adjacent to spray fields, demonstrating considerable sub surface nitrate movement towards the stream.
10 Total N concentrations in Stocking Head Creek, 2013, as median mg N/L TR SDCR SHC GDR SHC CSR SHC SDCR SHC SHCR SHC 50 SHC PBR Station For perspective, using a large data set of 1,070 streams Dodds et al. (1998) determined that TN concentrations > 1.5 mg/l were characteristic of eutrophic conditions. Dodds, W.K., J.R. Jones and E.B. Welch Suggested classification of stream trophic state: distributions of temperate stream types by chlorophyll, total nitrogen, and phosphorus. Water Research 32:
11 Total P concentrations for Stocking Head Creek, 2013, as median mg g P/L TR SDCR SHC GDR SHC CSR SHC SDCR SHC SHCR SHC 50 SHC PBR Station For perspective, using data from 1,366 streams, Dodds et al. (1998) concluded that TP concentrations > mg/l were characteristic of eutrophic streams. Dodds, W.K., J.R. Jones and E.B. Welch Suggested classification of stream trophic state: distributions of temperate stream types by chlorophyll, total nitrogen, and phosphorus. Water Research 32:
12 BOD5 Concentrations for Stocking Head Creek, 2013, as mean + standard error mg g/l TR SDCR SHC GDR SHC CSR SHC SDCR SHC SHCR SHC 50 SHC PBR Station BOD5 exceeded 10 mg/l on 11 of 70 samples in this creek; maximum of 88 mg/l at TR SDCR. From a wide variety of Coastal Plain Streams Mallin et al. (2006) determined that BOD5 of 1 to 2 mg/l could be considered the normal range. Mallin, M.A., V.L. Johnson, S.H. Ensign and T.A. MacPherson Factors contributing to hypoxia in rivers, lakes and streams. Limnology and Oceanography 51:


13 What drives biochemical oxygen demand (BOD) in Stocking Head Creek? We performed correlation analyses between BOD and several water quality parameters Correlation results BOD vs TOC: r = 0.833, p < BOD vs ammonium: r = 0.666, p < BOD vs TP: r = 0.626, p < BOD vs orthophosphate: r = 0.569, p < BOD vs chlorophyll a: r = 0.316, p = BOD vs TN: r = 0.284, p = Best predictive linear regression model dlfor BOD in SHC: BOD5 = 0.952(TOC) (ammonium) R 2 = 0.85, p <


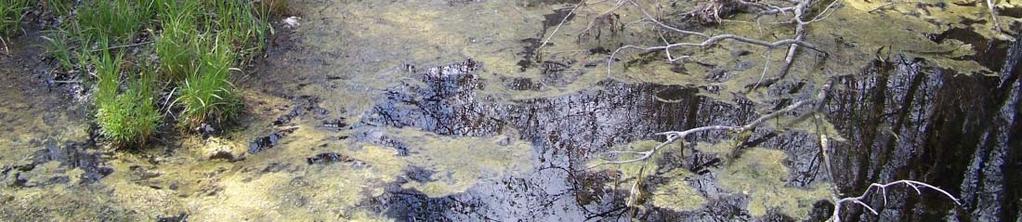
14 Algal blooms occurred at times at the sampling sites, but were g p g, inconsistent in space and time. On several occasions high chlorophyll a levels coincided with high BOD5 concentrations.
15 4,500 4,000 Fecal coliform counts for Stocking Head Creek summer 2013 geometric mean of 5 samples in 30 days fecal coliform ms CFU/100 ml 3,500 3,000 2,500 2,000 1,500 1, TR SDCR SHC GDR SHC CSR CSR SHC SDCR SDCR SHC SHCR SHCR SHC 50 SHC PBR Stations Upper 5 stations exceed 400 CFU/100 ml 100% of the time sampled All7 stations exceeded 200 CFU/100 ml 100% of occasions sampled
16 Fecal coliform counts for Stocking Head Creek fall 2013 geometric mean 5 samples in 30 days 10,000 9,000 fecal coliform ms CFU/100 ml 8,000 7,000 6,000 5,000 4,000 3,000 2,000 1,000 0 TR SDCR SHC GDR SHC CSR SHC SDCR SHC SHCR SHC 50 SHC PBR Stations The off screen geometric mean at station TR SDCR is 32,700 CFU/100 ml. U 4 f 5 t ti d 400 CFU/100 l 100% f th ti l d Upper 4 of 5 stations exceed 400 CFU/100 ml 100% of the time sampled All 7 stations exceeded 200 CFU/100 ml 100% of occasions sampled
17 Median pollutant concentrations in Stocking Head Creek in rain vs non rain periods. T test ss indicated no significant difference between periods. This indicates that that the upper groundwater table contains elevated fecal bacteria and inorganic nitrogen CFU U/100 ml 1,400 1,200 1, Fecal coliform counts (as median) for rain vs non rain periods in Stocking Head Creek Rain Non rain Ammonium concentrations (mg/l) for rain vs non rain periods in Stocking Head Creek 8.0 Nitrate concentrations (mg/l) for rain vs nonrain periods for Stocking Head Creek 10.0 Am mmonium (mg N/) Nitrat (mg N/ /L) Rain Non rain 0.0 Rain Non rain
18 Summary human health and ecological issues The North thcarolina protocol states tt that t fecal coliform counts shall not exceed a geometric mean of 200 CFU/100 ml based on at least five consecutive samples during any 30 day period, nor exceed 400 CFU/100 ml in more than 20% of the samples examined during such period. Stocking Head Creek fits all criteria for non support of designated use due to excessive fecal coliform pollution, and should be candidate for inclusion onthe 303(d) list. This creek also has some of highest ammonium and nitrate concentrations our laboratory has found in eastern NC: on par with levels l seen in CAFO spills and failing WWT plants Stream BOD concentrations were correlated with TOC, ammonium, phosphorus and algal blooms. This stream drains into the Northeast Cape Fear River, which enters the Cape Fear River at Wilmington. The lower CFR andestuaryare are on the NC 303(d) list for low dissolved oxygen and is required to produce a TMDL although reclassification actions are currently ongoing.
19 Other thoughts Pollution in this stream is chronic, meaning that it is not necessarily driven by stormwater pulses but has constant inputsof ammonium, nitrate andfecal bacteria entrained in groundwater through sprayfield contributions. Excessive land use of industrial scale swine (as much as 94,000 head), poultry (over 1.3 million chickens or equivalent wt. of turkeys, or some combination) are polluting this stream with ihfecal lbacteria, nutrients, and BOD. Action should be taken to require industry to address this non point source pollution to bring this (and other similar) streams into compliance with North Carolina standards. The present proposal p to reclassify the lower CFR basin to swamp water status does not address these sources of BOD and nutrients


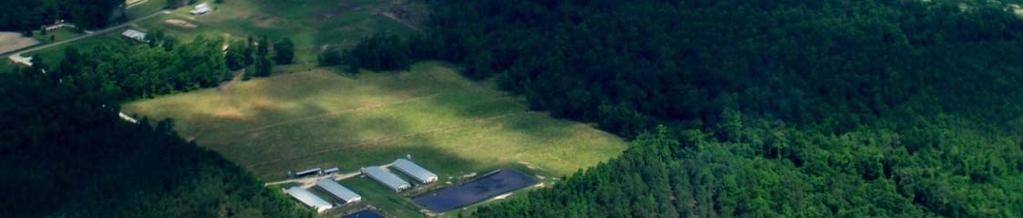
20 New poultry houses, Duplin Co., NC 2013 Turkeys in NC poultry house, 2013 A i l i f D li C NC 2013 Aerial view of Duplin Co., NC 2013, patchwork of swine and poultry CAFOs, + cattle grazing
Terrestrial Drivers of Coastal Plain Stream Water Quality in North Carolina
 Terrestrial Drivers of Coastal Plain Stream Water Quality in North Carolina Michael A. Mallin Center for Marine Science University of North Carolina Wilmington Wilmington, NC mallinm@uncw.edu As gathered
Water Quality Assessment for the Town of Caswell Beach, 2008
 Water Quality Assessment for the Town of Caswell Beach, 2008 UNCW-CMS Report 08-02 Report to: Town of Caswell Beach 1100 Caswell Beach Rd. c/o Mr. Jim Carter, Town Administrator Caswell Beach, N.C. 28465
New River Estuary Water Quality UNCW-CMS Report 10-02
 New River Estuary Water Quality 2008-2009 UNCW-CMS Report 10-02 Report to: Environmental Management Division, US Marine Corps, Camp Lejeune, N.C. By: Dr. Michael A. Mallin and Matthew R. McIver Center
(d) Responsiveness Summary June 3, 2016
 Responsiveness Summary June 3, 2016") 2016 303(d) Responsiveness Summary June 3, 2016 Public comments were received from the following entities and individuals: 1. Bill Floyd Citizen 2. Kemp Burdette and Gray Jernigan Cape Fear River Watch
2016 303(d) Responsiveness Summary June 3, 2016 Public comments were received from the following entities and individuals: 1. Bill Floyd Citizen 2. Kemp Burdette and Gray Jernigan Cape Fear River Watch
Redwood Shores Lagoon August Monthly Water Quality Monitoring Report
 Redwood Shores Lagoon August Monthly Water Quality Monitoring Report Prepared for Redwood City Public Works Services Department 1400 Broadway Redwood City, CA 94063-2594 Prepared by Clean Lakes, Inc. P.
UTILIZING GEOGRAPHIC INFORMATION SYSTEMS TO IDENTIFY AND MONITOR CONCENTRATED ANIMAL FEEDING OPERATIONS IN DUPLIN COUNTY, NC
 UTILIZING GEOGRAPHIC INFORMATION SYSTEMS TO IDENTIFY AND MONITOR CONCENTRATED ANIMAL FEEDING OPERATIONS IN DUPLIN COUNTY, NC Sean Burke Graduate Student Department of Geography and Geology University of
Guide 35. Ecosystem Ecology: Disruption of Terrestrial and Aquatic Ecosystems.
 Guide 35 Ecosystem Ecology: Disruption of Terrestrial and Aquatic Ecosystems http://www.americanforests.org/forestbytes/032004-inside.php http://www.mycomicshop.com/search?mingr=0&tid=544931 Vegetation
Henderson Watershed WRIA 13. Chapter Includes: Tanglewilde Stormwater Outfall Woodard Creek Woodland Creek
 Henderson Watershed WRIA 13 Chapter Includes: Tanglewilde Stormwater Outfall Woodard Creek Woodland Creek 146 Tanglewilde Stormwater Outfall PART OF HENDERSON WATERSHED PRIMARY LAND USES: Urban residential
Irrigation. Branch. Crowfoot Creek Watershed Study. Why was this study conducted? How was this study conducted?
 AGRICULTURE, FOOD AND RURAL DEVELOPMENT Irrigation Branch Crowfoot Creek Watershed Study The Crowfoot Creek Study was conducted to determine whether agricultural practices are contributing to the deterioration
Redwood Shores Lagoon November 2016 Monthly Water Quality Monitoring Report
 Redwood Shores Lagoon November 2016 Monthly Water Quality Monitoring Report Prepared for Redwood City Public Works Services Department 1400 Broadway Redwood City, CA 94063-2594 Prepared by Clean Lakes,
Redwood Shores Lagoon February 2019 Monthly Water Quality Monitoring Report
 Redwood Shores Lagoon February 2019 Monthly Water Quality Monitoring Report Prepared for Redwood City Public Works Services Department 1400 Broadway Redwood City, CA 94063-2594 Prepared by Clean Lakes,
Septic System Impacts on Stormwater and Impaired Waterbodies. December 8, 2016 Tim Denison, Johnson Engineering Marcy Frick, Tetra Tech
 Septic System Impacts on Stormwater and Impaired Waterbodies December 8, 2016 Tim Denison, Johnson Engineering Marcy Frick, Tetra Tech Presentation Overview Charlotte County: Many areas adjacent to impaired
Environmental Assessment of the Lower Cape Fear River System, 2012
 Environmental Assessment of the Lower Cape Fear River System, 2012 By Michael A. Mallin, Matthew R. McIver and James F. Merritt October 2013 CMS Report No. 13-02 Center for Marine Science University of
Redwood Shores Lagoon May 2017 Monthly Water Quality Monitoring Report
 Redwood Shores Lagoon May 2017 Monthly Water Quality Monitoring Report Prepared for Redwood City Public Works Services Department 1400 Broadway Redwood City, CA 94063-2594 Prepared by Clean Lakes, Inc.
ENVIRONMENTAL QUALITY OF WILMINGTON AND NEW HANOVER COUNTY WATERSHEDS, 2016
 ENVIRONMENTAL QUALITY OF WILMINGTON AND NEW HANOVER COUNTY WATERSHEDS, 2016 by Michael A. Mallin, Matthew R. McIver and Nicholas Iraola CMS Report 17-01 Center for Marine Science University of North Carolina
REPORT. Report No: 2013/0958 Prepared For: Natural Resources Committee Prepared By: Dean Olsen, Environmental Resource Scientist Date: 11 July 2013
 REPORT Document Id: A544088 Report No: 2013/0958 Prepared For: Natural Resources Committee Prepared By: Dean Olsen, Environmental Resource Scientist Date: 11 July 2013 Subject: Waianakarua River Water
2006 Aliceville Reservoir Report. Rivers and Reservoirs Monitoring Program
 2006 Aliceville Reservoir Report Rivers and Reservoirs Monitoring Program Field Operations Division Environmental Indicators Section Aquatic Assessment Unit May 2011 Rivers and Reservoirs Monitoring Program
PROTECTING THE WACCAMAW WATERSHED. Water Quality Monitoring. Christine Ellis. Waccamaw RIVERKEEPER A Program of Winyah Rivers Foundation
 PROTECTING THE WACCAMAW WATERSHED Water Quality Monitoring Christine Ellis Waccamaw RIVERKEEPER A Program of Winyah Rivers Foundation Focusing on the Waccamaw Waccamaw RIVERKEEPER Program Citizen-Based
2018 WATER QUALITY MONITORING BLUE MARSH RESERVOIR LEESPORT, PENNSYLVANIA
 2018 WATER QUALITY MONITORING BLUE MARSH RESERVOIR LEESPORT, PENNSYLVANIA U.S. Army Corps of Engineers Philadelphia District Environmental Resources Branch January 2019 2018 Water Quality Monitoring Blue
Lake of the Pines. Watershed TMDL. Depressed DO conditions in 3,700 acres of upper reservoir; declining
 Lake O O the Pines Watershed TMDL Presented at: 15 th National NPS Monitoring Workshop August 27, 2007 Vernon D. Rowe, P.E. Pilgrim s Pride Corporation Corporate Environmental Manager Lake of the Pines
Nutrient Cycling and Water Quality on California Rangelands
 Nutrient Cycling and Water Quality on California Rangelands Randy Dahlgren Department of Land, Air and Water Resources University of California - Davis Core Research Team Barbara Allen-Diaz Rob Atwill
Water Quality in the Upper Cohansey Watershed
 Slide 1 Water Quality in the Upper Cohansey Watershed Salvatore Mangiafico County Environmental and Resource Management Agent Cooperative Extension of Salem and Cumberland Counties This talk will present
Marine Pollution Bulletin
 Marine Pollution Bulletin 64 (2012) 1356 1366 Contents lists available at SciVerse ScienceDirect Marine Pollution Bulletin journal homepage: www.elsevier.com/locate/marpolbul Pollutant impacts to Cape
MARYLAND DEPARTMENT OF THE ENVIRONMENT 1800 Washington Boulevard Baltimore MD
 MARYLAND DEPARTMENT OF THE ENVIRONMENT 1800 Washington Boulevard Baltimore MD 21230 410-537-3000 1-800-633-6101 Martin O Malley Governor Anthony G. Brown Lieutenant Governor November 6, 2009 Shari T. Wilson
ENVIRONMENTAL QUALITY OF WILMINGTON AND NEW HANOVER COUNTY WATERSHEDS, 2014
 ENVIRONMENTAL QUALITY OF WILMINGTON AND NEW HANOVER COUNTY WATERSHEDS, 2014 by Michael A. Mallin, Matthew R. McIver, Anna R. Robuck and John D. Barker CMS Report 15-01 Center for Marine Science University
Monitoring site - Indian Creek
 Indian Creek Watershed Management Plan GIS and EPA Bacteria Indicator Tool (BIT) February 17, 2009 2009 Indiana GIS Conference Bloomington Monroe County Convention Center Stacey Jarboe, Stantec t Consulting
Bacon Creek Watershed Plan Implementation Chapter 3: Learning More - Monitoring to Secure New Data Draft
 Bacon Creek Watershed Plan Implementation Chapter 3: Learning More - Monitoring to Secure New Data Draft There are two main goals of watershed planning: protect good water quality and improve poor water
Analyses for geochemical investigations traditionally report concentrations as weight per volume of the measured ions (mg/l of NO 3 , NO 2
 Nitrate-Nitrogen 55 Nutrients The nutrients nitrogen and phosphorus occur naturally and also may be introduced to groundwater systems from urban and agricultural fertilizer applications, livestock or human
EAST FORK SAN JACINTO RIVER - SEGMENT 1003
 EAST FORK SAN JACINTO RIVER - SEGMENT 1003 EAST FORK SAN JACINTO RIVER - SEGMENT 1003 LAND COVER BACTERIA Impairment Concern No Impairments or Concerns Perennial Stream Perennial Stream Segment Number:
USEPA Region 7 Regional Technical Assistance Group
 USEPA Region 7 Regional Technical Assistance Group Debbie Baker and Donald Huggins P C C Central Plains Center for BioAssessment, Kansas Biological Survey B Gary Welker USEPA Region 7, Kansas City, KS
Improving Water Quality in the Lick Creek Watershed by Improving the Performance of Septic Systems
 Improving Water Quality in the Lick Creek Watershed by Improving the Performance of Septic Systems Charles Humphrey Jr., Guy Iverson, Christa Sanderford Researchers from the Coastal Resources Management
Continuous records for the Chariton River indicate that 2004 was an average water year, with total flow approximately equal to the average annual
 2004 Rathbun Report Iowa State University Limnology Laboratory John A. Downing, Ph.D. George Antoniou, Assistant Scientist For Rathbun Land and Water Alliance August 31, 2005 A. Tributaries Personnel of
Phosphorus Goal Setting Process Questions and Answers 2010
 Lake Winnipesaukee Watershed Management Plan Phase I: Meredith, Paugus, Saunders Bays 1. What is phosphorus? Phosphorus (P) is a naturally occurring element and a major nutrient required for biological
Acidity and Alkalinity:
 Evaluation of Pollution Sources to Lake Glenville Quarterly Report December 2018 Kimberlee K Hall, PhD Environmental Health Program, Western Carolina University Summary Chemical and microbial analysis
NERRS Science. Collaborative Project
 NERRS Science Collaborative Project Detecting non point nitrogen sources and transport pathways in the Great Bay watershed and engaging decision makers in the science Investigators: Dr. William H. McDowell,
Historical Water Quality Data Analysis, Pearson Creek, Springfield, Missouri
 The Ozarks Environmental and Water Resources Institute (OEWRI) Missouri State University (MSU) Historical Water Quality Data Analysis, Pearson Creek, Springfield, Missouri Prepared by: Marc R. Owen, M.S.,
Water Quality Conditions & Management on Rangelands
 Water Quality Conditions & Management on Rangelands Ken Tate, Leslie Roche, and Rob Atwill UC Davis and UC Cooperative Extension Grazing Workshop Mariposa County UCCE March 2014 CA Rangelands Safe Water
Factsheet: Town of Deep River Water Quality and Stormwater Summary
 79 Elm Street Hartford, CT 06106-5127 www.ct.gov/deep Affirmative Action/Equal Opportunity Employer Factsheet: Town of Deep River Water Quality and Stormwater Summary This document was created for each
What s In your Watershed Reeder Creek
 What s In your Watershed Reeder Creek Stephen Penningroth, Ph.D. Executive Director, Community Science Institute, Ithaca, NY Three Brothers Winery, Geneva, NY October 29, 2015 Sponsored by the Seneca Lake
 Good Morning! Bruce Gilman Department of Environmental Conservation and Horticulture Finger Lakes Community College 3325 Marvin Sands Drive Canandaigua, New York 14424 585-785- 1255 gilmanba@flcc.edu Northern
MILK RIVER WATERSHED WATER MONITORING REPORT 2017
 MILK RIVER WATERSHED WATER MONITORING REPORT 2017 Prepared for: Milk River Watershed Council Canada Prepared by: Palliser Environmental Services Ltd. March 2018 Acknowledgements Thank you to Cardston County,
July 2009 WATER QUALITY SAMPLING, ANALYSIS AND ANNUAL LOAD DETERMINATIONS FOR NUTRIENTS AND SOLIDS ON
 July 2009 WATER QUALITY SAMPLING, ANALYSIS AND ANNUAL LOAD DETERMINATIONS FOR NUTRIENTS AND SOLIDS ON THE BALLARD CREEK, 2008 LESLIE B. MASSEY, WADE CASH, AND BRIAN E. HAGGARD Submitted to Arkansas Natural
Factsheet: City of West Haven Water Quality and Stormwater Summary
 79 Elm Street Hartford, CT 06106-5127 www.ct.gov/deep Affirmative Action/Equal Opportunity Employer Factsheet: City of West Haven Water Quality and Stormwater Summary This document was created for each
Environmental Assessment of the Lower Cape Fear River System, 2012
 Environmental Assessment of the Lower Cape Fear River System, 2012 By Michael A. Mallin, Matthew R. McIver and James F. Merritt October 2013 CMS Report No. 13-02 Center for Marine Science University of
Ta r-pa m l i c o Ri v e r
 Ta r-pa m l i c o Ri v e r Basinwide Wat e r Qu a l i t y Ma n a g e m e n t Pl a n 2010 Su m m a ry Introduc tion This 2010 document is the fourth five-year update of the Tar-Pamlico River Basinwide Water
What s Happening in Lake Whatcom?
 What s Happening in Lake Whatcom? Dr. Robin A. Matthews, Director Institute for Watershed Studies Huxley College of the Environment Western Washington University June 6, 2011 Site 2 Basin 2 Lake Whatcom
Factsheet: Town of Hamden Water Quality and Stormwater Summary
 79 Elm Street Hartford, CT 06106-5127 www.ct.gov/deep Affirmative Action/Equal Opportunity Employer Factsheet: Town of Hamden Water Quality and Stormwater Summary This document was created for each town
Factsheet: Town of East Lyme Water Quality and Stormwater Summary
 79 Elm Street Hartford, CT 06106-5127 www.ct.gov/deep Affirmative Action/Equal Opportunity Employer Factsheet: Town of East Lyme Water Quality and Stormwater Summary This document was created for each
Florida s Triennial Review of Water Quality Standards
 Florida s Triennial Review of Water Quality Standards Agenda Review Background on Triennial Review Revisions to Chapter 62-4, FAC Revisions to Chapter 62-302, FAC Revisions to Chapter 62-303, FAC Triennial
2010 Use Assessment Methodology August 31, 2010
 North Carolina Division of Water Quality 2010 Use Assessment Methodology August 31, 2010 Page 1 of 14 Table of Contents Purpose... 3 Assessment Units and Water Quality Classifications... 3 Data Window/Assessment
Analysis of Chlorophyll-a and other data collected in the Illinois River Watershed from
 Analysis of Chlorophyll-a and other data collected in the Illinois River Watershed from 1996-2003 By W.J. Andrews and D.N. Mott USGS Oklahoma Water Science Center For the Oklahoma Clean Lakes and Watersheds
Nutrient distributions and the interaction between coastal wetlands and the nearshore of Lake Ontario
 Nutrient distributions and the interaction between coastal wetlands and the nearshore of Ontario Krista Chomicki and Gary Bowen International Association of Great s Research, 25 Type Durham Region Coastal
North Dakota s Nutrient Reduction Strategy. Presented to the 2016 ND Water Quality Monitoring Conference March 4, 2016
 North Dakota s Nutrient Reduction Strategy Presented to the 2016 ND Water Quality Monitoring Conference March 4, 2016 Nutrients Nutrients, in appropriate amounts, are essential to the growth and health
Long-Term Volunteer Lake Monitoring in the Upper Woonasquatucket Watershed
 Long-Term Volunteer Lake Monitoring in the Upper Woonasquatucket Watershed Linda Green URI Watershed Watch 1-87-95, lgreen@uri.edu WATER QUALITY IS A REFLECTION OF THE ACTIVITIES IN THE LANDS AND WATERS
Little Cypress Bayou Special Study - Subwatershed 1.10
 - Subwatershed 1.1 Sabine River Authority of Texas August 31, 21 Prepared in Cooperation with the Texas Natural Resource Conservation Commission Under the Authorization of the Texas Clean Rivers Act Table
Vancouver Watershed Health Assessment. Burnt Bridge Creek Watershed
 Vancouver Watershed Health Assessment Burnt Bridge Creek Watershed Presentation Overview 1. Introduction 2. Study Context 3. Burnt Bridge Creek Monitoring Program and Trend Analysis 4. Watershed Health
Peach Creek Watershed
 SH 304 Peach Creek Watershed Bastrop Peach Cree FM 713 Caldwell Peach Creek, Sandy Fork Copperas Creek 1803C Peach Creek Fayette FM 1054 US 90 Waelder US IH US 90 FM 1680 IH 10 Dry Run Gonzales SH 97 Peach
Estuaries and Catchments team, Water Wetlands and Coasts Science Branch, Science Division, Office of Environment and Heritage
 Impact assessment of Berkeley Vale subcatchment pollutant loads in nearshore zone of Tuggerah Lakes Rebecca Swanson, Aaron Wright, Peter Scanes and Angus Ferguson Estuaries and Catchments team, Water Wetlands
2007 Inland and Purdy Reservoirs Report. Rivers and Reservoirs Monitoring Program
 2007 Inland and Purdy Reservoirs Report Rivers and Reservoirs Monitoring Program Field Operations Division Environmental Indicators Section Aquatic Assessment Unit June 2012 Rivers and Reservoirs Monitoring
TMDL Development. For Turkey Creek HUC 11 Watersheds. Final Report
 TMDL Development For Turkey Creek HUC 11 Watersheds Final Report Developed By Oklahoma Department of Environmental Quality September 19, 2006 TABLE OF CONTENT 1. BACKGROUND... 1 2. PROBLEM STATEMENT...
SAN BERNARD RIVER ABOVE TIDAL - SEGMENT 1302
 SAN BERNARD RIVER ABOVE TIDAL - SEGMENT 1302 SAN BERNARD RIVER ABOVE TIDAL - SEGMENT 1302 LAND COVER BACTERIA DISSOLVED OXYGEN NUTRIENTS Impairment Concern No Impairments or Concerns SAN BERNARD RIVER
Factors contributing to hypoxia in rivers, lakes, and streams
 Limnol. Oceanogr., 51(1, part 2), 2006, 690 701 2006, by the American Society of Limnology and Oceanography, Inc. Factors contributing to hypoxia in rivers, lakes, and streams Michael A. Mallin, 1 Virginia
Water Quality Study In the Streams of Flint Creek and Flint River Watersheds For TMDL Development
 Water Quality Study In the Streams of Flint Creek and Flint River Watersheds For TMDL Development Idris Abdi Doctoral Dissertation Presentation Major Advisor: Dr. Teferi Tsegaye April 18, 2005 Alabama
Factsheet: Town of Trumbull Water Quality and Stormwater Summary
 79 Elm Street Hartford, CT 06106-5127 www.ct.gov/deep Affirmative Action/Equal Opportunity Employer Factsheet: Town of Trumbull Water Quality and Stormwater Summary This document was created for each town
Stormwater BMP Maintenance
 Stormwater BMP Maintenance Background and Definitions What is Stormwater Runoff? Stormwater Stormwater is the result of precipitation that flows overland to streams and other bodies of water Stormwater
Impacts of Rainfall Events on Water Quality in the Houston Metro Area
 Impacts of Rainfall Events on Water Quality in the Houston Metro Area Hanadi Rifai and Anuradha Desai Civil and Environmental Engineering University of Houston, Houston, TX Acknowledgments TCEQ EPA Houston
The Myakka River. Presented to the Myakka River Management Coordinating Council January 9, 2009
 The Myakka River Presented to the Myakka River Management Coordinating Council January 9, 2009 Kathryn L. Meaux Environmental Specialist III Sarasota County Integrated Water Resources Historical Monitoring
ASSIMILATIVE CAPACITY MODELING USING INTEGRATED WATERSHED AND LAKE MODELS IN SUPPORT OF THE GEORGIA COMPREHENSIVE STATEWIDE WATER MANAGEMENT PLAN
 B.J. Watson, et al., Int. J. of Design & Nature and Ecodynamics. Vol. 7, No. 2 (2012) 155 165 ASSIMILATIVE CAPACITY MODELING USING INTEGRATED WATERSHED AND LAKE MODELS IN SUPPORT OF THE GEORGIA COMPREHENSIVE
Slide 1: Welcome to today s The Nitrogen Cycle presentation, where we ll be talking to you about the importance of nitrogen in our environment.
 Slide 1: Welcome to today s The Nitrogen Cycle presentation, where we ll be talking to you about the importance of nitrogen in our environment. 1 Slide 2: Barnegat Bay, like many coastal areas in the country,
Executive Summary EXECUTIVE SUMMARY. ES.1 Monitoring Program Objectives. ES.2 Summary of Monitoring Results
 EXECUTIVE SUMMARY ES.1 Monitoring Program Objectives The following are the major monitoring program objectives, as outlined in the Municipal Stormwater Permit: Assess compliance with the Municipal Stormwater
Water Quality in Seneca Lake Tributary Streams
 Water Quality in Seneca Lake Tributary Streams Stephen Penningroth, Director Community Science Institute Hobart and William Smith Colleges March 24, 2018 Community Science Institute Independent, nonprofit,
Evaluation of Water Quality in. Sylvia Heaton Water Bureau, MDNRE
 Evaluation of Water Quality in Ford and Belleville Lakes Sylvia Heaton Water Bureau, MDNRE Objectives of 2010 TMDL Reevaluation Evaluate nutrient (total phosphorus) levels in Ford and Belleville Lakes
TMDL Data Requirements for Agricultural Watersheds
 This is not a peer-reviewed article. Pp. 408-415 in Total Maximum Daily Load (TMDL) Environmental Regulations: Proceedings of the March 11-13, 2002 Conference, (Fort Worth, Texas, USA) Publication Date
Water Quality Analysis of Eutrophication. Youghiogheny River Main Stem (Maryland Portion) Prepared by:
 Prepared by:") Water Quality Analysis of Eutrophication Youghiogheny River Main Stem (Maryland Portion) Prepared by: Maryland Department of the Environment 2500 Broening Highway Baltimore, MD 21224 Submitted to: Watershed
Water Quality Analysis of Eutrophication Youghiogheny River Main Stem (Maryland Portion) Prepared by: Maryland Department of the Environment 2500 Broening Highway Baltimore, MD 21224 Submitted to: Watershed
Pennsylvania Pequea and Mill Creek Watershed Section 319 National Monitoring Program Project
 Pennsylvania Pequea and Mill Creek Watershed Section 319 National Monitoring Program Project Figure 36: Pequea and Mill Creek (Pennsylvania) Watershed Project Location 231 T-1 C-1 T1-3 T-4 C1-2 T2-3 T-2
CADDO LAKE WATERSHED PROTECTION PLAN Technical Memo (Task 1.2.3)
") CADDO LAKE WATERSHED PROTECTION PLAN Technical Memo (Task 1.2.3) Prepared for: Northeast Texas Municipal Water District 4180 FM 250 P.O. Box 955 Hughes Springs, TX 75656 By: Espey Consultants, Inc. EC
CADDO LAKE WATERSHED PROTECTION PLAN Technical Memo (Task 1.2.3) Prepared for: Northeast Texas Municipal Water District 4180 FM 250 P.O. Box 955 Hughes Springs, TX 75656 By: Espey Consultants, Inc. EC
Little River Watershed Restoration Project. Mark Powell, Consultant Natural Resources Management
 Little River Watershed Restoration Project Mark Powell, Consultant Natural Resources Management Lessons Learned Strong partnerships RC&D, Soil and Water, 2 counties, Albemarle Commission, Universities,
2006 WATER MONITORING REPORT
 26 WATER MONITORING REPORT May 27 Prepared for: South Washington Watershed District Prepared by: Memorandum To: Matt Moore South Washington Watershed District Administrator From: Wendy Griffin, Travis
Environmental Assessment of the Lower Cape Fear River System, 2011
 Environmental Assessment of the Lower Cape Fear River System, 2011 By Michael A. Mallin, Matthew R. McIver and James F. Merritt September 2012 CMS Report No. 12-03 Center for Marine Science University
Table of Contents. Table of Figures
 Appendix A: Modeling Report Little Manatee WBID: 1790 Nutrients and Dissolved Oxygen September 30, 2009 Table of Contents 1. WATERSHED DESCRIPTION... 1 2. TMDL TARGETS... 2 3. MODELING APPROACH... 2 3.1.
Lake Tohopekaliga Nutrient Reduction Plan and Best Management Practice Pollutant Load Analysis
 Lake Tohopekaliga Nutrient Reduction Plan and Best Management Practice Pollutant Load Analysis Danielle Honour, P.E., D.WRE Principal Water Resources Engineer UF Water Institute Symposium February 15,
Summary of Weather Monitoring
 their district office on Nulle Road. An overview of the studies performed is included in Table 1. Figure 1 maps the sampling locations for the studies reviewed by this memorandum. A complete summary of
Water Resources/Water Quality
 Water Resources/Water Quality From where does your drinking water come? How much land should be set aside for aquifer protection? Why should we care about Barton Springs? What are the effects (if any!)
2012 Nutrient Regulations Update
 2012 Nutrient Regulations Update OWEA Government Affairs Workshop March 1, 2012 Guy Jamesson, PE, BCEE Malcolm Pirnie, The Water Division of ARCADIS Imagine the result Agenda Nutrient impacts Nutrient
Water Quality Sampling Presentation Ministry of the Environment. Presented by Dana Cruikshank Surface Water Specialist October 2009
 Water Quality Sampling Presentation Ministry of the Environment Presented by Dana Cruikshank Surface Water Specialist October 2009 1 5W s of Water Quality Sampling WHY WHAT WHERE WHEN WHO Sampling is an
Bald Head Creek Water Quality: Before and After Dredging
 Bald Head Creek Water Quality: Before and After Dredging Michael A. Mallin 1, Byron R. Toothman 1, Matthew R. McIver 1 and Matt S. Hayes 2 1 Center for Marine Science University of North Carolina at Wilmington
Freshwater Responses to Nitrogen and Phosphorus Pollution and a Case Study of Cutler and Dingle Marsh Wetlands
 Utah State University DigitalCommons@USU Watershed Sciences Faculty Publications Watershed Sciences 2009 Freshwater Responses to Nitrogen and Phosphorus Pollution and a Case Study of Cutler and Dingle
Protecting & Restoring Local Waters and the Chesapeake Bay
 Protecting & Restoring Local Waters and the Chesapeake Bay Restore America s Estuaries National Conference Gregory Barranco Chesapeake Bay Program Office November 2010 The Chesapeake Bay and Watershed
HORSESHOE LAKE WATER QUALITY IMPROVEMENT PROJECT FINAL REPORT
 KITSAP COUNTY HEALTH DISTRICT ENVIRONMENTAL HEALTH DIVISION POLLUTION IDENTIFICATION AND CORRECTION PROGRAM HORSESHOE LAKE WATER QUALITY IMPROVEMENT PROJECT FINAL REPORT By Kimberly Jones Environmental
Multipurpose Wetland Creation and Restoration to Improve Water Quality and Wildlife Habitat in Coastal Urban Bayous
 Multipurpose Wetland Creation and Restoration to Improve Water Quality and Wildlife Habitat in Coastal Urban Bayous CEER 2014 New Orleans, LA George Guillen, Misty Shepard, K. Vale and J. Oakley Environmental
Byllesby Reservoir Phosphorus TMDL Public Meeting & Open House May 13, 2013 Phillippo Scout Reservation
 Byllesby Reservoir Phosphorus TMDL Public Meeting & Open House May 13, 2013 Phillippo Scout Reservation Minnesota Pollution Control Agency Cannon River Watershed Partnership wq-iw9-10n Thank you for your
New Practices for Nutrient Reduction: STRIPs and Saturated Buffers. Matthew Helmers and Tom Isenhart Iowa State University
 New Practices for Nutrient Reduction: STRIPs and Saturated Buffers Matthew Helmers and Tom Isenhart Iowa State University Situation Increasing concern for local and regional waters Substantial demand for
Osher Course. What Lies Beneath the Inland Bays?
 Osher Course What Lies Beneath the Inland Bays? Objectives for Course Describe the Delaware Inland Bays and their tributaries Illustrate the ecology and importance of estuaries Demonstrate the threats
MONITORING RECOMMENDATIONS
 MONITORING RECOMMENDATIONS 9 The purpose of this section is to provide general guidance on proposed monitoring activities to provide information for several of the recommended indicators and key uncertainties
Effect of Turbidity on Dissolved Oxygen in the Lake Macatawa. Watershed
 Effect of Turbidity on Dissolved Oxygen in the Lake Macatawa Watershed Hope College GES 401 Research Project Group Members: Peter Van Heest, Rachel Burkhart, Wyatt Curry Advisor: Dr. G. Peaslee Introduction
Sandies Creek Watershed
 SH 97 Sandies Creek Watershed Gonzales De Witt FM 1116 Sandies Creek SH 72 FM 240 FM 466 Sandies Creek Karnes Smiley Elm Creek FM 108 US 87 SH 80 FM 1117 Guadalupe FM 1681 Wilson Nixon 13657 1803B 1803B
Water Monitoring in Spa Creek: A Summary
 Water Monitoring in Spa Creek: A Summary Written by: Alexis Jones & Blake Harden Edited by: Hannah Krauss Water monitoring is very important in order to determine the health of the Chesapeake Bay and its
 Atmospheric Nitrogen Deposition: An increasingly Important Source of new Nitrogen Supporting Coastal Eutrophication H Paerl 1, D. Whitall 2 and R. Dennis 3 1 UNC-CH CH Institute of Marine Sciences, Morehead
Technical Memorandum Lake Wequaquet Water Quality Trend Analysis
 Technical Memorandum Lake Wequaquet Water Quality Trend Analysis To: Gail Maguire, Lake Wequaquet Protective Association From: Ed Eichner, Senior Water Scientist RE: Lake Wequaquet Water Quality Trend
2016 WATER QUALITY MONITORING PROMPTON RESERVOIR PROMPTON, PENNSYLVANIA
 2016 WATER QUALITY MONITORING PROMPTON RESERVOIR PROMPTON, PENNSYLVANIA U.S. Army Corps of Engineers Philadelphia District Environmental Resources Branch December 2016 2016 Water Quality Monitoring Prompton