Tucson Electric Power Company Integrated Resource Plan. April 3, 2017
|
|
|
- Kelly Greer
- 6 years ago
- Views:
Transcription


1 2017 Integrated Resource Plan Tucson Electric Power Company 2017 Integrated Resource Plan April 3, 2017 Page - 1
2 Tucson Electric Power Page - 2
3 2017 Integrated Resource Plan Acknowledgements Tucson Electric Power Company IRP Team Jeff Yockey, Manager, Environmental and Long-Term Planning Victor Aguirre, Manager, Resource Planning Kevin Battaglia, Lead Resource Planner Luc Thiltges, Lead Resource Planner Lee Alter, Senior Resource Planner Ernesto Blanco Jr, Fuels, Senior Portfolio Analyst Henry Cattan, Fuels and Resource Planning Greg Strang, Lead Forecasting Analyst Stephanie Browne-Schlack, Senior Forecasting Analyst Debbie Lindeman, Supervisor, Energy Efficiency Planning Analysis & Reporting Ron Belval, Manager, Regional Transmission Planning Gary Trent, Manager, Transmission Planning Christopher Lindsey, Manager, Distribution Engineering & Technical Energy Services Richard Bachmeier, Principal Rate Designer, Rates & Revenue Requirements Lauren Briggs, Manager, Balancing Authority Function Sam Rugel, Director, System Control & Reliability Michael Bowling, Director, Wholesale Marketing Nicole Bell, Renewable Forecasting and Trading Analyst Michael Baruch Supervisor, Residential Energy Efficiency Programs & Services Jeff Krauss, Manager, Renewable Energy Ted Burhans, Manager, Renewable Energy Joe Barrios, Supervisor, Media Relations & Regulatory Communications Carmine Tilghman, Senior Director, Energy Supply & Renewable Energy Erik Bakken, Senior Director, Transmission and Environmental Services Mike Sheehan, Senior Director, Fuels and Resource Planning IRP Consultants and Forecasting Services Pace Global Gary W. Vicinus, Executive Vice President - Consulting Services Melissa Haugh - Consulting Services Anant Kumar - Consulting Services Brian Kwak Consulting Service Chuck Fan Consulting Services Wood Mackenzie - Consulting Services EPIS - AuroraXMP Software Consulting Services Page - 3
4 Tucson Electric Power Table of Contents ACKNOWLEDGEMENTS... 3 Tucson Electric Power Company IRP Team... 3 IRP Consultants and Forecasting Services... 3 ACRONYMS FORWARD CHAPTER EXECUTIVE SUMMARY Introduction Coal Plant Retirements Renewable Energy Integration and Diversification Grid Balancing Resources Smart Grid Operations Regional Infrastructure Projects Transformation of Desert Southwest Wholesale Power Markets Regional Transmission Organizations Market Fundementals Energy Efficiency A New Integration Approach to Resource Planning Summary of the 2017 IRP Reference Case Plan Planned Coal Plant Retirements Planned Renewable Resource Additions Planned Grid Balancing Resources Planned Energy Efficiency Commitments TEP s 2017 IRP Reference Case Plan CHAPTER ENERGY DEMAND AND USE PATTERNS Load Forecast Geographical Location and Customer Base Customer Growth Retail Sales by Rate Class Reference Case Forecast Methodology Reference Case Retail Energy Forecast Reference Case Retail Energy Forecast by Rate Class Reference Case Peak Demand Forecast Data Sources Used in Forecasting Process Risks to Reference Case Forecast and Risk Modeling Firm Wholesale Energy Forecast Summary of Reference Case Load Forecast Future Drivers that May Influence the Long-Term Load Forecast Electric Vehicles Future Adoption Rate Influencers Page - 4
5 2017 Integrated Resource Plan Policy Battery Technology Grid Impacts Smart Grid The Future of the Distribution Grid CHAPTER OPERATIONAL REQUIREMENTS AND RELIABILITY Load and Resource Adequacy Future Load Obligations System Resource Capacity Typical Dispatch Profiles Balancing Authority Operations Control Performance Standard (CPS) Balancing Authority ACE Limit (BAAL) Disturbance Control Standard (DCS) Frequency Response Measure (FRM) Reserves Load Following Adjustments to Operating Reserve Frequency Response Inertia Voltage Support Power Quality DISTRIBUTION SYSTEM ENHANCEMENTS Distribution Capacity Expansion New 138kV Substations Benefits Realized from New Substations Existing Substation Upgrades kV System Conversion KV System Conversion Benefits CLEAN ENERGY STANDARDS Renewable Energy Standard Compliance Energy Efficiency Standard Compliance Utility-Specific Standard Derived Through the IRP Process RENEWABLE ENERGY INTEGRATION Operational Challenges Shifting Net Peak Weather Forecasting to Support System Dispatch ENVIRONMENTAL REGULATIONS Overview Regional Haze Clean Power Plan CPP Overview Arizona Page - 5
6 Tucson Electric Power Navajo Nation New Mexico PACE Global Arizona CPP Analysis National Ambient Air Quality Standards Power Generation and Water Resources Power Generation and Water Impacts of Resource Diversification CHAPTER A NEW INTEGRATION APPROACH TO RESOURCE PLANNING Load Modifying Resources Renewable Load Serving Resources Conventional Load Serving Resources Grid Balancing Resources Typical Summer Day Categorized by Resource Requirements Typical Winter Day Categorized by Resource Requirements RESOURCES MATRIX Resource Benchmarking Source Data Lazard s Levelized Cost of Energy Analysis Overview on Conventional and Alternative Energy Technologies Lazard s Levelized Cost of Storage Analysis Overview on Energy Storage Technologies Cost Competitive Storage Technologies Future Energy Storage Cost Decreases Integrated Resource Plan Levelized Cost Comparisons LCOE Assumptions All Resources Levelized Cost of All Resources Load Modifying Resources Cost Assumptions LCOE Assumptions for Load Modifying Resources Renewable Load Serving Resources Cost Assumptions LCOE Assumptions for Load Serving Resources Renewables Conventional Load Serving Resources Cost Assumptions LCOE Assumptions for Load Serving Resources Conventional Grid Balancing Resources Cost Assumptions LCOE Assumptions for Grid Balancing Resources Renewable Electricity Production Tax Credit (PTC) Energy Investment Tax Credit (ITC) Solar Technologies Impacts of Declining Tax Credits and Technology Installed Costs Impacts of Declining PTC and Technology Installed Costs CHAPTER LOAD MODIFYING RESOURCES Energy Efficiency Implementation Plan, Goals, and Objectives Planning Process Page - 6
7 2017 Integrated Resource Plan Program Screening Utility Resource Cost Test Total Resource Cost Participant Cost Test Rate Impact Measure Test Societal Cost Test Current Energy Efficiency and DSM Programs RESOURCE PLANNING INTEGRATION DSM Forecasting Load Shape Results Energy Efficiency Technology Summary DISTRIBUTED ENERGY RESOURCES Solar Photovoltaic DG Systems Overview Typical System Components: Configuration of Typical PV Systems Solar Hot Water Heaters Integral Collector Storage (ICS) Passive Direct System Thermosiphon Passive Direct System Typical Installations Distributed Generation Technology Summary CHAPTER LOAD SERVING RESOURCES Renewable Energy Solar PV Technology Solar Resource Characteristics Photovoltaic Solar Power Technology Flat-Plate PV Systems Solar PV Technology Summary U.S. Solar Map Arizona Solar Power Map Concentrating Photovoltaics (CPV) CPV Technology Summary and Costs Concentrating Solar Power Technology (CSP) Power Tower CSP Systems CSP Technology Summary and Costs Ivanpah Solar Electric Generating Station Stirling Engine Dish Technology Parabolic Trough Power Plants (PTPP) Parabolic Trough Power Plant Technology Mojave PTPP Project Hybridized Configuration with Natural Gas Co-Firing Storage Configuration based on Two-Tank Molten Salt System Solana Generating Station Wind Power Resource Characteristics Page - 7
8 Tucson Electric Power U.S. Wind Resource Map Arizona Wind Resource Potential New Mexico Wind Resource Map New Mexico Wind Resource Potential Wind Technology Summary Bioenergy/Bio-Resources Arizona Biomass Map New Mexico Biomass Map Biomass Technology Overview Biomass Technology Summary and Costs Natural Gas Resources NGCC Technology Summary Coal Resources Pulverized Coal Technology Summary and Costs Integrated Gasification Combined-Cycle (IGCC) Coal Market Prices Nuclear Resources Small Modular Nuclear Reactors Permitting and Time to Commercial Operation SMR Technology Summary CHAPTER GRID BALANCING AND LOAD LEVELING RESOURCES Energy Storage Pumped Hydro-Power Compressed Air Energy Storage (CAES) Batteries Flywheels Energy Storage Applicability Energy Storage Technology Summary Batteries Pumped Hydro Compressed Air Energy Storage Fast Response Thermal Generation Reciprocating Internal Combustion Engines RICE Technology Summary Large Frame Combustion Technology Summary Aeroderivative Combustion Turbine Technology Summary Demand Response Demand Response Technology Summary Utility installed thermostats and switches at customer site used to control customer demand Rate Design Demand Rates Time-Varying Rates Distributed Generation TEP Rate Design Page - 8
9 2017 Integrated Resource Plan Desert Southwest Wholesale Power Markets - Transformation Wholesale Power Market Overview Non-Dispatchable Renewable Must Run Resources Impacts on Baseload Generation Resources Reduction in Overall Natural Gas Demand and Commodity Prices Arizona Gas Storage Project Kinder Morgan 2017 Open Season CHAPTER REGIONAL TRANSMISSION PLANNING Overview Ninth Biennial Transmission Assessment Reliability Must Run (RMR) Assessment Ten Year Snapshot Study Extreme Contingency Study Effects of Distributed Generation and Energy Efficiency Programs WestConnect WECC Multi-Regional & Interconnection-Wide Transmission Planning Evolving Resource Mix Challenges Key Issues: Other Regional Transmission Projects Nogales DC Intertie Sunzia Southwest Transmission Project The Southline Transmission Project Western Spirit Clean Line Energy Imbalance Markets CAISO Energy Imbalance Market EIM Regional Transmission Organizations (RTOs) CHAPTER TEP EXISTING RESOURCES TEP s Existing Resource Portfolio Coal Resources Springerville Generating Station San Juan Generating Station Navajo Generating Station Four Corners Power Plant H. Wilson Sundt Generating Station Luna Energy Facility Gila River Generating Station Combustion Turbines Future Plan to Move to Cycling Operations Existing Renewable Resources EXISTING FIXED AXIS SOLAR PV PROJECTS Springerville Solar Page - 9
10 Tucson Electric Power Solon / TEP UASTP II Gato Montes Solon Prairie Fire Ft. Huachuca Phase I Ft. Huachuca Phase-II EXISTING SINGLE AXIS TRACKING PROJECTS Cogenera Solon UASTP I E.ON UASTP Picture Rocks E.ON Valencia Avalon Solar I and II Red Horse Solar II NRG Solar EXISTING CONCENTRATING PV PROJECTS Amonix UASTP II White Mountain EXISTING CONCENTRATING SOLAR POWER PROJECTS Areva Solar EXISTING WIND RESOURCES Macho Springs Red Horse 2 Wind Project EXISTING BIOMASS PROJECTS Sundt Biogas TEP s Energy Storage Projects Distributed Generation Resources Davis Monthan Air Force Base Distributed Generation Project TRANSMISSION Overview TEP s Existing Transmission Resources Pinal Central to Tortolita 500 kv Transmission Upgrade Pinal West to South Upgrade Project CHAPTER FUTURE RESOURCE REQUIREMENTS Future Energy Efficiency Assumptions Future Renewable Energy Assumptions Technology Considerations Diversity of Resources Utility Scale Project Ownership Future Grid Balancing Resources Energy Storage Fast Response Thermal Generation Demand Response Future Transmission Page - 10
11 2017 Integrated Resource Plan Ten-Year Transmission Plan Transmission Substation Reconfiguration Projects Conceptual Future Local Area 345 kv EHV Transmission Projects Transmission Resources Needed for New Generating Resources CHAPTER ALTERNATIVE FUTURE SCENARIOS AND FORECAST SENSITIVITIES PACE Alternative Future Scenarios Natural Gas Prices Coal Prices Capital Costs Palo Verde (7x24) Market Prices Load Growth Scenarios High Load Scenario Low Load Scenario FUEL, MARKET AND DEMAND RISK ANALYSIS Permian Natural Gas Prices Permian Natural Gas Price Distributions Palo Verde (7x24) Wholesale Power Prices Palo Verde (7x24) Market Price Distributions Load Variability and Risk CHAPTER REFERENCE CASE PLAN Resource Diversification Loads and Resource Assessment Addition of Resources to Meet System Requirements Addition of Load Serving Resources Addition of Grid Balancing and Load Leveling Resources Reference Case Plan Summary and Timeline Reference Case Plan Attributes Existing Renewable Integration Requirements Reference Case Plan Renewable Integration Requirements Clean Power Plan Compliance Reference Case Plan Risk Dashboard LOAD GROWTH SCENARIO ANALYSIS High Load Scenario Low Load Scenario CHAPTER ALTERNATIVE PORTFOLIOS Overview of the Energy Storage Portfolio Overview of the SMR - Full Coal Retirement Portfolio Overview of Expanded Energy Efficiency Overview of the Expanded Renewable Portfolio Page - 11
12 Tucson Electric Power Overview of Major IRP Assumptions by Portfolio Summary of NPV Revenue Requirements by Scenario Summary of NPV Revenue Requirements Base Case Scenario Summary of NPV Revenue Requirements High Economy Scenario Summary of NPV Revenue Requirements High Technology Scenario Distribution of NPV Revenue Requirements by Portfolio Distribution of NPV Revenue Requirements by Portfolio NPVRR Mean and Worst Case Risk CHAPTER FIVE-YEAR ACTION PLAN PACE GLOBAL FUTURE STATES OF THE WORLD... APPENDIX A 2017 FLEXIBLE GENERATION TECHNOLOGY ASSESSMENT... APPENDIX B Page - 12
13 2017 Integrated Resource Plan List of Acronyms ACRONYMS ACC Arizona Corporation Commission ACE Area Control Error ANPR Advanced Notice of Proposed Rulemaking APS Arizona Public Service Company BA Balancing Authority BART Best Available Retrofit Technology Bcf Billion Cubic Feet BES Bulk Electric System BEV Battery Electric Vehicles BTA Biennial Transmission Assessment Btu British Thermal Unit C&I Commercial and Industrial CAES Compressed Air Energy Storage CBM Coal Bed Methane CC Combined Cycle Plant Technology CCCT Combined Cycle Combustion Turbine CCR Coal Combustion Residuals CCS Carbon Capture and Sequestration; Carbon Capture and Storage CFL Compact Fluorescent Light Bulb CAISO - California Independent System Operator CO2 Carbon Dioxide CPP Clean Power Plan CSP Concentrating Solar Power CT Combined Turbine DER Distributed Energy Resources DG - Distributed Generation DOE U.S. Department of Energy (Federal) DLC Direct Load Control DMS Distribution Management System DR Demand Response DSM Demand Side Management EAF Equivalent Availability Factor EE Energy Efficiency EIA - Energy Information Administration EIM Energy Imbalance Market ELCC Effective Load Carrying Capacity EMS Energy Management System EPA - Environmental Protection Agency EPRI Electric Power Research Institute EPS Emission Performance Standard Page - 13
14 Tucson Electric Power ERC Emission Rate Credit ESS Energy Storage System EV Electric Vehicles FERC Federal Energy Regulatory Commission FIP Federal Implementation Plan GIS Geographic Information System GHG Greenhouse Gas GW Gigawatt, GWh Gigawatt-Hour HAPS Hazardous Air Pollutants HEV Hybrid Electric Vehicle HRSG Heat Recovery Steam Generator IGCC Integrated Gasification Combined Cycle IRP Integrated Resource Plan ISCC Integrated Solar Combined Cycle ITC Investment Tax Credit kw Kilowatt kwh Kilowatt-Hour kwyr Kilowatt-Year LCOE Levelized Cost of Electricity LNG Liquefied Natural Gas MACT Maximum Available Control Technology Mcf Million Cubic Feet MMBtu Million British Thermal Units, also shown as MBtu MBtu Million British Thermal Units, also shown as MMBtu MW Megawatt MWh Megawatt-Hour NAAQ National Ambient Air Quality Standards NaS Sodium Sulphur NASNRC National Academies of Science National research Council NEC Navopache Electric Cooperative NERC - North American Electric Reliability Corporation NGCC Natural Gas Combined Cycle NGS Navajo Generating Station NMED New Mexico Environmental Department NNT No-Notice Transportation NOX Nitrogen Oxide(s) NPV Net Present Value NPVRR Net Present Value Revenue Requirement NRC Nuclear Regulatory Commission NREL National Renewable Energy Laboratory NSPS New Source Performance Standards NTUA Navajo Tribal Utility Authority O&M Operations and Maintenance PEV Plug-in Electric Vehicles PM - Particulate matter PNM Public Service Company of New Mexico PPA - Purchased Power Agreement Page - 14
15 2017 Integrated Resource Plan PTC Production Tax Credit PSD Prevention of Significant Deterioration R&D Research and Development RCRA Resource Conservation and Recovery Act REC Renewable Energy Credit RES Renewable Energy Standard RICE Reciprocating Internal Combustion Engine RFP Request for Proposal ROB Replace on Burnout ROD Record of Decision ROW Right of Way RTO - Regional Transmission Organization RTP Renewable Transmission Project RUCO - Residential Utility Consumer Office SAT Single-Axis Tracking SCADA Supervisory Control and Data Acquisition SCE Southern California Edison SCR Selective Catalytic Reduction SCT Societal Cost Test SCCT Simple Cycle Combustion Turbine SGS Springerville Generating Station (aka Springerville) SIP State Implementation Plan SJCC San Juan Coal Company SJGS San Juan Generating Station SMR Small Modular (Nuclear) Reactor SNCR Selective Non-Catalytic Reduction SRP Salt River Project SRSG Southwest Reserve Sharing Group SO2 Sulfur Dioxide STG Steam Turbine Generator SWEEP Southwest Energy Efficiency Project TEP Tucson Electric Power Company TOU Time-of-Use TOUA - Tohono O odham Utility Authority TRICO Trico Electric Cooperative UES UniSource Energy Services (Parent Company of UNS Electric) UAMPS - Utah Associated Municipal Power System VAR Volt-Ampere Reactive; Reactive Power WECC - Western Electricity Coordinating Council Page - 15
16 Tucson Electric Power Page - 16
17 2017 Integrated Resource Plan Forward As our community grows and changes, Tucson Electric Power (TEP) must evolve to continue satisfying the energy needs of our customers with a more flexible and responsive resource portfolio. Our 2017 Integrated Resource Plan (IRP) reflects our ongoing transformation from a traditional utility to a more technology and consumer-focused provider of energy products and services a shift that must be accomplished without sacrificing reliability, convenience or affordability. TEP will continue to diversify its generation portfolio and reduce its significant reliance on coal by expanding cost-effective renewable resources, particularly solar. Our goal is to serve at least 30 percent of our retail load from renewable resources by 2030 twice the level TEP must achieve by 2025 under Arizona's Renewable Energy Standard. We also will continue to rely on energy efficiency measures while investing in cleaner burning natural gas resources. We anticipate making significant progress toward that goal by adding approximately 800 megawatts (MW) of renewable energy capacity by We recently signed an agreement with NextEra Energy Resources LLC., to purchase power from a new 100 MW wind facility. We re also evaluating proposals for a new 100 MW-dc solar facility that would be built and owned by a project partner. Both projects are scheduled for completion in Amid such change, we also must maintain access to and control of reliable, cost-effective conventional generating resources. To that end, TEP recently replaced a long-term lease with full ownership and control of Unit 1 at the Springerville Generating Station Arizona s newest, most efficient coal plant. This will allow our resource portfolio to remain appropriately balanced during planned reductions of coal-fired resources at the San Juan and Navajo Generating Stations. Our increasingly diverse, sustainable generation portfolio will create operational challenges that require new ways of managing the intermittency and variability of renewable resources. Through a partnership with the University of Arizona, we are using unique and highly customized forecasting models to predict our solar and wind systems next-day production. These predictions help us make more informed decisions about real-time system dispatch. We re also making greater use of energy storage systems, which can boost power output levels more quickly than conventional generating resources to maintain the required balance between energy demand and supply. Such systems are expected to rapidly decline in cost over the next several years. TEP recently completed three energy storage projects with a combined capacity of 22 MW that are designed to provide grid-balancing resources such as frequency response and regulation and voltage support. We also are planning investments in flexible, fast-responding reciprocating internal combustion engines that will provide capacity and assist in mitigating power fluctuations associated with renewable resources. Such systems can run efficiently at varying loads without regard to frequent starts and cycling operations. Renewable resources, energy efficiency measures and demand response technologies will play increasingly prominent roles in our future resource plans. Renewable resource costs are becoming competitive with conventional generation, while energy efficiency remains the lowest-cost option. That said, building the most reliable and cost-effective portfolio requires us to consider the price, benefits and feasibility of each resource option in relation to existing infrastructure, environmental factors and other operating conditions unique to our company. That s why we believe utility-specific clean energy standards should be determined through the IRP process instead of mandatory, numeric-driven statewide standards. This report also describes how new smart grid technologies identified in TEP s 10-year transmission and distribution plans would improve service reliability by providing increased system capacity and contingency support for the distribution network. These network upgrades will support the grid of the future with integration of technologies like remote switching that can help prevent and minimize service interruptions. New technologies will continue to create new energy choices for consumers and new options for utilities. TEP must remain flexible and focused on managing resources in ways that adapt to such changes while maintaining progress toward achieving a sustainable portfolio that preserves safe, reliable and affordable service. David G. Hutchens President and CEO Page - 17
18 Tucson Electric Power Page - 18
19 2017 Integrated Resource Plan CHAPTER 1 EXECUTIVE SUMMARY Introduction For the last 50 years, Tucson Electric Power (TEP) has relied on a fleet of baseload coal plants to meet the majority of customers energy needs. Customer usage and peak demand steadily and often rapidly increased as more and more people moved to Tucson for its favorable climate. Natural gas fired steam boilers and combustion turbines, as well as purchased power, provided the additional capacity needed to meet summer peak demand. During this time the primary resource planning challenge was to meet this ever increasing system peak economically given high volatility in natural gas and wholesale power prices. Presently, many new factors have come into play, some competing, some complimentary, that necessitate varying from the status quo. Changing customer use patterns have resulted in lower load growth, yet there exists the potential for new opportunities that will require communication and coordination between customers and the grid. Operating requirements relating to reliability, grid security, clean energy standards, and environmental compliance are becoming continuously more stringent at the same time that we prepare for the operating challenges relating to integrating higher levels of renewable energy. Resource economics and environmental considerations have shifted the historically strong preference for coal, to a more balanced use of coal, natural gas, and renewable resources. Given all these changes, we need to view resources differently, to be better aligned with the role each resource plays in meeting the economical and reliable delivery of energy to our customers. Furthermore, the traditional role of resource planning itself has changed. While we still must provide for reliable and safe power at affordable rates, our stakeholders expect us to achieve those objectives while improving environmental performance and mitigating risk. To meet these expanded objectives, TEP must be prepared to make significant changes while maintaining optionality to account for the uncertainty inherent in a long-term outlook. TEP s 2017 Integrated Resource Plan identifies the current and anticipated changes facing the utility industry, and TEP specifically, and outlines a plan to meet our customers energy needs in light of these changes. The IRP presents a snap shot of current loads and resources and projects future energy and capacity needs through TEP presents the 2017 Reference Case Plan that provides a reasonable path forward in terms of reliability, affordability, environmental performance and risk. Page - 19

20 Tucson Electric Power Coal Plant Retirements As part of TEP s longer-term portfolio diversification strategy, the Company is reducing its significant reliance on coal to approximately 38% of retail energy deliveries. Over the next five years, TEP will reduce its coal-fired capacity by 508 MW through planned retirements. TEP plans to exit San Juan Generating Station ( San Juan ) Unit 2 at the end of 2017, exit the Navajo Generating Station ( Navajo ) at the end of 2019, and exit San Juan Unit 1 at the end of June These planned coal retirements will enable TEP to take advantage of near-term opportunities to reduce costs and rebalance its resource portfolio over the longer-term. This reduction in coal resources will result in significant cost savings 2 for TEP customers and will result in meaningful reductions in air emissions and water consumption 3. Finally, TEP s long-term commitments to clean energy resources will help minimize the Company s long-term environmental risk while locking in lower-cost sustainable sources of energy for decades to come. Figure 1 - TEP 2017 IRP Reference Case Timeline for Coal Unit Retirements 1 On March 16, 2107, PNM announced that their current IRP analysis concluded that retiring the remaining two units at the San Juan Generating Station in the Farmington area in 2022 could provide long-term benefits for its customers. 2 As part of the 2014 IRP analysis, TEP avoided approximately $165 in pollution controls with its commitment to retire San Juan Unit 2 at the end of In the 2017 IRP analysis, TEP s customers will realize an additional net present value savings of approximately $179 million related to the retirement of TEP s ownership interest in Navajo at the end of 2019 and the retirement of TEP s ownership interest in San Juan Unit 1 at the end of June The retirement of both Navajo and San Juan Units 1 and 2 results in reductions in TEP s total system emissions of 15.8% for carbon dioxide (CO2), 29.8% for nitrous oxides (NOx), and 9.8% for sulfur dioxide (SO2). In addition, the retirement of the Navajo and San Juan units show water consumption is reduced by approximately 2,599 acre feet per year, an overall savings of 16.18%. Page - 20

21 2017 Integrated Resource Plan Renewable Energy Integration and Diversification TEP will continue to expand its portfolio of renewable energy resources as a component of our overall resource diversification plan as well as our targeted goal of serving 30% of retail load with renewable energy by As TEP expands its renewable energy portfolio, the Company continues to evaluate the most cost-effective options available. The Company expects to have a higher percentage of solar resources, primarily due to favorable production curves, low costs, and lack of available transmission to import other resources. TEP s resource mix will also include large scale wind resources in eastern Arizona and New Mexico that are able to utilize existing transmission facilities, including expected available capacity from planned plant retirements, and new large regional transmission projects. TEP s renewable energy target will come with its own set of challenges and will require TEP to transition to a more flexible and responsive generation portfolio. Utility-scale solar PV that is tied to the distribution grid has substantial benefits, and if properly planned and sited may contribute to reduced line losses, apportioned capacity reductions (generation and transmission), along with environmental benefits. However, a large accumulation of solar PV in TEP s portfolio introduces operational challenges at certain times of the year as illustrated in the figure below, showing a hypothetical 2030 winter day. TEP s portfolio must have the capability to accommodate the rapid ramping requirements (up and down) that occur on certain days, and strategies are needed to take advantage of the over generation that may occur. Initially, Arizona s clean energy standards relating to renewable energy and energy efficiency provided the catalyst for these dramatic changes. Going forward, future clean energy targets should be developed on a utility-by-utility basis. While these standards have produced real and tangible benefits, clean energy standards applied at a statewide level are inherently inflexible, and fail to take into account the unique circumstances of each utility. This inflexibility creates inefficiencies in resource acquisitions and system dispatch, which ultimately results in higher costs passed on to customers. TEP believes that the IRP is a better mechanism to develop utility-specific clean energy targets than a state-wide, one size fits all rulemaking. The IRP provides Page - 21
22 Tucson Electric Power the most holistic consideration of the very goals that clean energy standards aim to achieve, while balancing the cost of achieving those goals for our customers. Grid Balancing Resources As part of TEP s 2017 Reference Case Plan, planned energy storage systems will play a greater role in the integration of more renewable energy into TEP s resource portfolio. These energy storage systems will be readily available to provide ancillary power services such as frequency response, regulation and voltage support that are more challenging to maintain under the demands of a system with high levels of renewable energy penetration. In addition, new fast start, fast ramping thermal resources with mechanical inertia will also have to be added in order to help balance grid operations. Reciprocating internal combustion engines (RICEs) are fast response resources designed to flexibly dispatch to meet changes in load and can provide 100% of their effective load carrying capability (ELCC) during peak periods. These units are not degraded by the number of start-ups, as are combustion turbines, and they are capable of running at an efficient heat rate even at 30% of their designed capacity. A 10 MW unit can idle down to 3 MWs under spin and stand ready to react to system disturbances or renewable intermittent variability as needed. 4 Under today s Direct Load Control (DLC) programs, TEP is able to rely on approximately 12 MW of interruptible commercial and industrial loads to reduce summer peaking capacity requirements. As part of the 2017 IRP Reference Plan, TEP plans to evaluate the cost-effectiveness of future DLC programs. Future DLC programs will be proposed as part of the Company s annual EE implementation filings. In order to achieve higher levels of DLC, TEP would likely need to expand its DLC program design beyond the Commercial and Industrial sectors. Going forward, rather than focusing specifically on summer peaking requirements, TEP intends to transition from conventional peak shaving demand response (DR) programs to more advanced DR programs5 that are capable of cost-effectively addressing grid balancing needs such as short-run ramps and disturbances at timescales ranging from seconds up to an hour, throughout the year. Smart Grid Operations The adoption of new grid balancing resources will play a major role in providing TEP s Balancing Authority (BA) with the tools needed to maintain system reliability with higher levels of intermittent resources. In addition, as part of the 2017 Reference Case Plan, TEP is preparing its future grid operations to accommodate higher levels of distributed energy resources and other smart grid innovations through the use of smart digital networks. This strategy is much different than how the distribution system has been managed in the past. At the core of these smart network changes is the need for a digital communications network that will allow for intelligent electronic devices to be installed on the distribution system by both customers and the utility. This communication network will be managed through the use of a distribution management system (DMS) that will process the information from these devices and make decisions in a manner that optimizes grid operations for the benefit of the utility and its customers. 4 As part of this current resource planning cycle, TEP conducted a Flexible Generation Technology Assessment (See Appendix B). The results of this study indicate that the RICE technology is the preferred resource that will provide capacity and assist in mitigating renewable energy intermittency and variability. TEP plans to move forward with a generating resource modernization plan at Sundt over the next few years to integrate these fast start, fast resources in the 2020 and 2022 timeframes. 5 Lawrence Berkeley National Laboratory. California Demand Response Potential Study - Charting California s Demand Response Future, November Page - 22
23 2017 Integrated Resource Plan Regional Infrastructure Projects TEP is poised to take advantage of several large energy-related infrastructure projects that are developing in the southwestern United States. There are three large transmission projects proposed for interconnection in eastern and southeastern Arizona that may influence TEP s long-term resource planning decisions. The SunZia Southwest Transmission Project ( SunZia ) is a proposed double-circuit 500 kv line that will originate in central New Mexico at a proposed substation near Ancho, New Mexico and terminate at the proposed Pinal Central substation near Casa Grande, Arizona. Another proposed project, the Southline Transmission Project, has a new build portion and an upgrade portion. The new build section would involve the construction of approximately 240 miles of new 345kV double-circuit electric transmission lines in New Mexico and Arizona. The upgrade section is a double-circuit 230-kV lines connecting the Apache Substation to the existing Saguaro Substation northwest of Tucson, Arizona. Additionally, the proposed Western Spirit Clean Line will collect renewable power from east-central New Mexico and deliver it via an approximately 140-mile transmission line to the existing electric grid in northwestern New Mexico where it interconnects with the TEP transmission system at San Juan. Each of these projects, should they be built, would offer TEP an opportunity to tap into high capacity wind sites in New Mexico as well as large solar facilities located along the route. In addition, TEP and UNS Electric are involved in the development of the Nogales Interconnection Project, a proposed direct current interconnection, which will allow for an asynchronous interconnection between the electric grids in southern Arizona and the northwest region of Mexico. The project will support the reliability of the electric system, including providing bidirectional power flow and voltage support, as well as emergency assistance, as needed, for the electric systems both north and south of the border. Transformation of Desert Southwest Wholesale Power Markets Energy Imbalance Markets (EIMs) are designed to create a market opportunity for balancing loads and resources given the intermittent characteristics of wind and solar resources. An EIM can aggregate the variability of resources across much larger footprints than current balancing authorities and across multiple balancing authority areas. The sub hourly clearing, in some cases down to 5 minutes, potentially provides economic advantage to participants in the market. In 2014, PacifiCorp joined the California Independent System Operator (CAISO) EIM, and since that time several other utilities including Arizona Public Service have joined or committed to join by a certain date. Participants in the EIM expect to realize at least three benefits: Produce economic savings to customers through lower production costs Improve visibility and situational awareness for system operations in the Western Interconnection Improve integration of renewable resources TEP contracted with the energy consulting firm E3 to perform a study to evaluate the economic benefits of TEP participating in the energy imbalance market. The project analysis began in February 2016 and was completed in December, Based on the results of the E3 study TEP estimates an annual benefit of approximately $2.5 million. However, it is expected that this benefit will diminish over time. TEP has started the process of determining the relevant costs associated with joining the CAISO EIM market as well as evaluating what other western EIM market options may be available. Page - 23

24 Tucson Electric Power Regional Transmission Organizations Seeing a need for greater coordination, a Working Group consisting of investor owned utilities, cooperative power providers and public power entities was formed to consider and analyze potential alternatives to joining the CAISO EIM. The objectives of the Working Group are as follows: Determine economic benefits of potential alternatives and weigh opportunities for market participation Determine if the CAISO EIM and regulated markets in the Midwest and Mountain west offer certain economic benefits related to more efficient utilization of generating assets and transmission infrastructure Evaluate operational benefits especially as they relate to renewable resource integration and system regulation Establish if EIM/Regulated Markets and certain alternatives may offer reliability benefits related to the grid operations Consider governance structure and implications for resource control The Working Group discussed various options with the CAISO, the Southwest Power Pool, and the Mountain West Transmission Group. Currently there is recognizable value to establishing a regional market. However, the cost of joining or establishing a regional market have yet to be determined or fully evaluated. TEP will continue to engage with market operators to determine the best path forward for its customers. Market Fundamentals With the rapid increase in renewable resource penetration throughout the region, a transformation of market fundamentals is currently underway and is changing how both load-serving entities and wholesale merchants transact. As shown in the figure below, surplus solar output is causing a downward shift in market prices from the hours of 8 AM to 4 PM. Page - 24
25 2017 Integrated Resource Plan In addition to surplus renewable generation, low cost shale gas production has also played a significant role in transforming the supply and demand economics of natural gas. As we saw in 2015 and 2016, expanded natural gas production from shale formations is directly impacting the economic viability of many baseload coal and nuclear resources. Unlike renewables, most thermal plants like coal and nuclear, have higher operating costs that cannot be fully recovered in the wholesale market. Thus, the ultimate effect of high penetrations of renewables and low cost natural gas will likely be an accelerated retirement of older and higher cost coal and nuclear resources. Alternatively, resources like natural gas combined cycle (NGCC) units that have much lower capital and fixed costs are more competitive than coal and nuclear in today s wholesale power markets. This competitive advantage will likely result in NGCC units displacing many coal and nuclear as baseload resources since they are better positioned to maintain profitability in a market driven by low natural gas prices. Energy Efficiency TEP recognizes energy efficiency (EE) as a cost-effective way to reduce our reliance on fossil fuels. To evaluate EE in terms of TEP s overall resource portfolio, TEP determined the hourly savings of each individual EE measure using widely used and recognized third-party load shapes, and then aggregated them at the portfoliolevel by customer rate class. From these composite program-level savings, TEP is able to analyze peak periods to determine coincident and non-coincident peak demand savings. The level of energy savings was based on compliance with the EE standard through 2020, excluding program credits, and an estimate of achievable EE developed by the Electric Power Research Institute (EPRI) for all years after Then, to evaluate EE as a resource for replacement of generation, the specific types of measures being implemented are modeled like other resources against the forecasted system load. The figure below provides a sample of how current EE measures interact with TEP s system loads during a typical summer day. Using these results, TEP can target measures that coincide with periods of high ramp rate, period dominated by high cost resources, or the system peaks, both daily and annually. Page - 25
26 Tucson Electric Power A New Integration Approach to Resource Planning With the increasing cost-competiveness of certain renewable resources, many resource planners are in the process of integrating higher levels of renewable technologies as a complement to their existing conventional generation fleet. Because of the unique challenges that high levels of renewable energy place on grid operations, the 2017 IRP takes a new approach in categorizing the capabilities for each type of resource in order to better reflect the role these resources will play as the Company transforms its resource portfolio over the next decade. Load Modifying Resources includes EE, distributed generation, and time of use tariffs, whose effects are primarily behind the meter and are therefore, largely, if not entirely beyond the view and control of the balancing authority. Renewable Load Serving Resources include both utility scale solar and wind technologies. Conventional Load Serving Resources include coal, nuclear and natural gas technologies that are fully dispatchable and are used to supply the vast majority of the energy needed to meet load Grid Balancing Resources include natural gas combustion turbines, demand response, natural gas reciprocating engines and storage technologies that are fast ramping and flexible, as needed to maintain grid reliability. The table below provides a brief overview of the types of resources that will be included and evaluated in the resource planning process within the 2017 IRP. Category Type Zero Carbon Production State of Technology Primary Use Dispatchable by Balancing Authority Load Modifying Resources Load Serving Renewable Resources Load Serving Conventional Resources Grid Balancing Resources Energy Efficiency Yes Mature Distributed Generation Yes Mature Rate Design (1) Mature Wind Yes Mature Solar Yes Mature Natural Gas Combined Cycle No Mature Pulverized Coal No Mature Small Modular Nuclear (SMR) Reciprocating Engines Combustion Turbines Pumped Hydro Storage Yes No No Emerging Mature Mature (1) Mature Demand Response Yes Mature Battery Storage (1) Emerging Base Load Reduction Intermediate Load Reduction Targeted Load Usage / Reductions Intermediate Generation Intermediate Generation Base Load Generation Base Load Generation Base Load Generation 5-10 Minute Ramping Minute Ramping 1 Minute Ramping 1 Minute Ramping 1 Second Ramping No No No No No Yes Yes Yes Yes Yes Yes Yes Yes (1) Carbon intensity is dependent upon the resources that would be displaced by this rate tariff or storage technology net of charging. Page - 26
27 2017 Integrated Resource Plan Summary of the 2017 IRP Reference Case Plan TEP s 2017 IRP Reference Case Plan continues the Company s long-term strategy of resource diversification by taking advantage of near-term opportunities to reduce its coal capacity, expanding the deployment of renewable energy resources with a target of serving 30% of its retail load using renewable energy by 2030, continued development and implementation of cost-effective EE measures, and the addition of high-efficiency natural gas resources. Planned Coal Plant Retirements In September 2016, TEP acquired the remaining 50.5% share of Springerville Generating Station ( Springerville ) Unit 1, bringing our total capacity at Springerville to 793 MW with full ownership and operational control of Units 1 and 2. By 2018, TEP anticipates that it will reduce its coal capacity at San Juan from 340 MW to 170 MW with the retirement of San Juan Unit 2. TEP will further reduce its overall coal capacity by 168 MW with the recently announced retirement of the Navajo at the end of Finally, TEP plans to exit San Juan entirely when the current coal supply agreement ends in June Planned Renewable Resource Additions The 2017 Reference Case Plan includes two renewable energy projects that are planned to come online in These projects consist of 100 MW of wind and 100 MWdc of solar PV that are currently in procurement as 20- year Purchased Power Agreements (PPAs). An additional 800 MW of renewable capacity is planned to be added to the system between 2023 and 2030, consisting of a diversified mix of solar PV (fixed axis and singleaxis tracking), and wind. Planned Grid Balancing Resources To support the system in light of this high penetration in intermittent renewable energy, and to provide replacement capacity for the retirement of older, less efficient natural gas steam units at Sundt (Units 1 and 2), it is assumed that TEP constructs approximately 192 MW of natural gas fired RICEs between 2020 and Moreover, a number energy storage projects are planned to come on line between 2019 and 2021 to provide additional renewable energy support and other ancillary services. These systems would likely be sized as 50 MW projects with a storage discharge capacity of 50 MWh. Planned Energy Efficiency Commitments TEP's EE programs will continue to comply with the Arizona Energy Efficiency Standard that targets a cumulative energy savings of 22 % by From 2021 through the end of the planning period, the estimated annual savings in the 2017 Reference Case Plan are based on an assessment of achievable potential in energy savings from EE programs conducted by the EPRI. By 2032, this offset to future retail load growth is expected to reduce TEP s annual energy requirements by approximately 1,894 GWh and reduce TEP s system peak demand by 318 MW. A timeline of TEP s Reference Case Plan is presented below. 6 The 2019 retirement date is dependent upon receiving an extension of the lease agreement to allow for plant decommissioning prior to expiration of the lease. Without an extension of the current lease, plant closure would need to take place as early as this year to allow for decommissioning by the end of Page - 27
28 Tucson Electric Power TEP s 2017 IRP Reference Case Plan Milestone Timeline Page - 28

")
29 2017 Integrated Resource Plan TEP s 2017 Reference Case Plan - Energy Mix by Year (GWh) TEP s 2017 Reference Case Plan - Capacity Mix by Year (MW) Page - 29
30 Tucson Electric Power Distributed Generation (DG), 4% Utility Scale Renewable Resources, 7% TEP s 2017 Reference Case Plan Portfolio Energy Mix 2017 Portfolio Energy Mix Market Purchases, 9% Natural Gas, 11% Coal Generation, 69% Distributed Generation (DG), 5% Utility Scale Renewable Resources, 14% 2023 Portfolio Energy Mix Market Purchases, 3% Natural Gas, 28% Coal Generation, 50% 2032 Portfolio Energy Mix Distributed Generation (DG), 5% Utility Scale Renewable Resources, 26% Coal Generation, 38% Market Purchases, 5% Natural Gas, 26% The portfolio energy charts shown above represents the energy resource mix to serve TEP s retail customers. Wholesale market sales are excluded from these results. By 2030, TEP s retail customers will be served from 30% renewables. This is based on a combination of utility-scale and distributed generation resources. Page - 30
31 2017 Integrated Resource Plan ENERGY DEMAND AND USE PATTERNS CHAPTER 2 Load Forecast In the IRP process it is crucial to estimate the load obligations that existing and future resources will be required to meet for both short and long term planning horizons. As a first step in the development of the resource plan, a long term load forecast was produced. This chapter provides an overview of the anticipated long term load obligations at TEP, a discussion of the methodology and data sources used in the forecasting process, and a summary of the tools used to deal with the inherent uncertainty surrounding a number of key forecast inputs. The sections in this chapter include: Company Overview: TEP geographical service territory, customer base, and energy consumption by rate class Reference Case Forecast: An overview of the Reference Case forecast of energy and peak demand used in the planning process Wholesale Obligations: An outline of the firm system requirements for wholesale electricity sales Summary: Compilation of results from this analysis Page - 31
.")

32 Tucson Electric Power Geographical Location and Customer Base TEP currently provides electricity to more than 420,000 customers in the Tucson metropolitan area (Pima County). Pima County has maintained positive growth over the last decade and is now estimated to have a population of approximately 1,000,000 people. Map 1 - Service Area of Tucson Electric Power and UES Utilities Page - 32


33 2017 Integrated Resource Plan Customer Growth In recent years population growth in Pima County and customer growth at TEP have slowed dramatically as a result of the severe recession and weak recovery. While customer growth is currently rebounding from its recessionary lows, it is not expected to return to its pre-recession level. Chart 1 outlines the historical (blue bars) and expected (green bars) customer count and corresponding growth in the residential rate class from As customer growth is the largest factor behind growth in TEP s load, the continuing customer growth will necessitate additional resources to serve the increased load in the medium term. Chart 1 - Estimated TEP Customer Growth , % 450, % 400, % 350, % 300, % 250, % 200, % Average Annual Residential Customers % Growth Page - 33

34 Tucson Electric Power Retail Sales by Rate Class In 2016, TEP experienced a peak demand of approximately 2,278 MW, with approximately 8,900 GWh of retail sales. Approximately 66% of 2016 retail energy was sold to the residential and commercial rate classes, with approximately 34% sold to the industrial and mining rate classes. Customer classes such as municipal street lighting, etc. accounted for the remaining sales. Chart 2 gives a detailed breakdown of the estimated 2017 retail sales by rate class. Chart 2 Estimated 2017 Retail Sales (GWh) % by Rate Class Other 0.4% Mining 11.7% Industrial 22.3% Residential 41.5% Commercial 24.1% Page - 34
35 2017 Integrated Resource Plan Reference Case Forecast Methodology The load forecast used in the TEP IRP process was produced using a bottom up approach. A separate monthly energy forecast was prepared for each of the major rate classes (residential, commercial, industrial, and mining). As the factors impacting usage in each of the rate classes vary significantly, the methodology used to produce the individual rate class forecasts also varies. However, the individual methodologies fall into two broad categories: 1) For the residential and commercial classes, forecasts were produced using statistical models. Inputs include factors such as historical usage, weather (e.g. average temperature and dew point), demographic forecasts (e.g. population growth), and economic conditions (e.g. Gross County Product and disposable income). 2) For the industrial and mining classes, forecasts were produced for each individual customer. Inputs include historical usage patterns, information from the customers themselves (e.g. timing and scope of expanded operations), and information from internal company resources working closely with the mining and industrial customers. After the individual monthly forecasts were produced, they were aggregated (along with any remaining miscellaneous consumption falling outside the major categories) to produce a monthly energy forecast for the company. After the monthly energy forecast for the company was produced, the anticipated monthly energy consumption was used as an input for another statistical model used to estimate the peak demand. The peak demand model is based on historical relationship between hourly load and weather, calendar effects, and sales growth. Once these relationships are estimated, 60+ years of historical weather scenarios are simulated to generate a probabilistic peak forecast. Page - 35
36 Tucson Electric Power Reference Case Retail Energy Forecast As illustrated in Chart 3, after a period of relatively rapid growth from , TEP s weather-normalized retail energy sales fell significantly from As commodity prices remain weak, retail sales are expected to continue to decline through As commodity prices begin to return to historical averages in 2020, mining load is expected to return to historical values and expand with the Rosemont mine project. After 2024 the growth in sales is dominated by residential and commercial sales growth at a level that is far slower than the pre-great recession historical average. Chart 3 - Reference Case Retail Energy Sales, Weather Normalized Historical 12,000 11,000 Long Term Growth Average Annual Rate of 0.9% ( ) 10,000 GWh 9,000 8,000 7,000 6, Page - 36
37 2017 Integrated Resource Plan Reference Case Retail Energy Forecast by Rate Class As illustrated in Chart 4, the Reference Case forecast assumes significant short term changes for the next few years followed by slow, steady growth starting in However, the growth rates vary significantly by rate class. The energy sales trends for each major rate class are detailed in Chart 4. Chart 4 - Reference Case Retail Energy Sales by Rate Class (GWh) 5,000 4,500 4,000 3,500 3,000 2,500 2,000 1,500 1, Residential Commercial Industrial Mining After experiencing consistent year over year growth throughout the past, both residential and commercial energy sales fell or remained flat from Both are assumed in the Reference Case to increase steadily after However, industrial energy sales are assumed to increase much more slowly than those in either the residential or commercial classes. In addition, mining sales are assumed to significantly fall in the coming years due to low commodity prices. As these prices return to more historical averages, the current mining customers are forecast to return to normal operations, as well as expand due to the Rosemont mine project. Page - 37
38 Tucson Electric Power Reference Case Peak Demand Forecast As show in Chart 5 below, demand is expected to drop in This is largely caused by the mining class curtailing load and an expected return of more normal peak weather. As the mining class rebounds and the residential and commercial classes grow slowly and steadily, the retail peak demand is expected to grow. The red and blue dashed lines represent extreme weather cases and are set at a one-in-ten year weather anomaly. Chart 5 - Reference Case Peak Demand (MW) 2,800 2,600 Long Term Peak Growth Average of 0.7% ,400 2,200 2,000 1,800 1,600 1, High Low Peak Page - 38
39 2017 Integrated Resource Plan Data Sources Used in Forecasting Process As outlined above, the Reference Case forecast requires a broad range of inputs (demographic, economic, weather, etc.) For internal forecasting processes, TEP utilizes a number of sources for these data: IHS Global Insight The University of Arizona Forecasting Project Arizona Department of Commerce U.S. Census Bureau National Oceanic and Atmospheric Administration Weather Underground Forecasting Service Risks to Reference Case Forecast and Risk Modeling As always, there is a large amount of uncertainty with regard to projected load growth. Some, but certainly not all, of the key risks to the current forecast include: Strength and timing of the economic recovery Possible structural changes to customer behavior (i.e. do post-recession customers have consumption patterns different from those seen pre-recession?) Volatility in industrial metal prices and associated shifts in mining consumption Efficacy of EE programs (i.e. what percentage of load growth can be offset by demand side management?) Technological innovations (e.g. plug in hybrid vehicle penetration) Volatility in demographic assumptions (e.g. much higher or lower population growth than currently assumed) Because of the large amount of uncertainty underlying the load forecast, it is crucial to consider the implications to resource planning if TEP experiences significantly lower or higher load growth than projected. For this reason, load growth is one of the fundamental factors considered in the risk analysis process undertaken as part of the 2017 IRP. Specifically, the performance of each potential resource portfolio is analyzed through 100 simulations of potential load growth (along with correlated natural gas and wholesale power prices). A more in depth discussion of this risk analysis process is provided in Chapter 11. In addition to the simulation analysis, a more specific discussion of how resource decisions and timing would be affected in the case of sustained higher or lower loads is provided in the Load Growth Scenarios discussed in Chapter 12. Page - 39
40 Tucson Electric Power Firm Wholesale Energy Forecast TEP is currently under contract to provide firm wholesale energy and capacity to five utility customers. These firm obligations are in addition to TEP s commitment to serve its retail customers. The contracts stipulate energy services to the four entities below: Navajo Tribal Utility Authority (NTUA) through December 2022 TRICO Electric Cooperative (TRICO) through December 2024 Navopache Electric Cooperative (NEC) through December 2041 Tohono O odham Utility Authority (TOUA) through December 2019 Shell Energy North America L.P. ( Shell ) through December 2017 TEP expected firm wholesale obligations are shown in Table 1 below. The contract with Salt River Project (SRP) expired in the spring of 2016; it was not renewed. TEP signed a firm wholesale agreement with NEC in the fall of Delivery services for NEC began in January A short-term contract with Shell expires at the end of It is important to note contract extensions have not been assumed. However, there is a possibility that any or all agreements could be extended. This would obviously require current resource plans to be revised to account for the additional energy sales and peak summer load requirements. Table 1 - Firm Wholesale Requirements Firm Wholesale, GWh NTUA TRICO NEC Shell TOUA Total Firm Wholesale Peak Demand, MW NTUA TRICO NEC Shell TOUA Total Firm Demand Page - 40
41 2017 Integrated Resource Plan Summary of Reference Case Load Forecast Table 2 below excludes the effects of distributed generation (DG) and EE. Table 2 - TEP Reference Case Forecast Summary Retail Sales, GWh Residential 3,627 3,673 3,722 3,766 3,816 3,877 3,947 4,018 4,078 4,122 4,168 4,215 4,269 4,329 4,386 4,444 Commercial 2,103 2,128 2,151 2,171 2,201 2,243 2,287 2,331 2,375 2,417 2,458 2,500 2,544 2,586 2,631 2,677 Industrial 1,949 1,962 1,957 1,953 1,946 1,943 1,941 1,941 1,935 1,948 1,950 1,956 1,960 1,965 1,970 1,976 Mining 1,022 1,022 1,022 1,077 1,249 1,617 1,778 1,783 1,778 1,778 1,778 1,783 1,778 1,778 1,778 1,777 Other Total Retail 8,734 8,818 8,885 9,000 9,245 9,713 9,986 10,106 10,199 10,298 10,387 10,487 10,584 10,691 10,798 10,907 Residential Sales Growth % -2.1% 1.3% 1.3% 1.2% 1.3% 1.6% 1.8% 1.8% 1.5% 1.1% 1.1% 1.1% 1.3% 1.4% 1.3% 1.3% Commercial Sales Growth % -0.6% 1.2% 1.1% 0.9% 1.4% 1.9% 2.0% 1.9% 1.9% 1.8% 1.7% 1.7% 1.8% 1.7% 1.7% 1.7% Industrial Sales Growth % -2.5% 0.7% -0.3% -0.2% -0.4% -0.2% -0.1% 0.0% -0.3% 0.7% 0.1% 0.3% 0.2% 0.3% 0.3% 0.3% Mining Sales Growth % 2.2% 0.0% 0.0% 5.4% 16.0% 29.5% 10.0% 0.3% -0.3% 0.0% 0.0% 0.3% -0.3% 0.0% 0.0% -0.1% Other Sales Growth % 6.5% 0.0% 0.0% 0.0% 0.0% 0.0% 0.0% 0.0% 0.0% 0.0% 0.0% 0.0% 0.0% 0.0% 0.0% 0.0% Total Retail Sales Growth % -1.3% 1.0% 0.8% 1.3% 2.7% 5.1% 2.8% 1.2% 0.9% 1.0% 0.9% 1.0% 0.9% 1.0% 1.0% 1.0% Customer Count, Firm Wholesale, GWh NTUA TRICO NEC Shell TOUA Total Firm Wholesale Retail Peak Demand, MW Retail Demand 2,220 2,230 2,243 2,280 2,319 2,429 2,440 2,452 2,485 2,495 2,506 2,504 2,515 2,531 2,549 2,565 Retail Demand Growth % -2.8% 0.5% 0.6% 1.6% 1.7% 4.7% 0.5% 0.5% 1.3% 0.4% 0.4% -0.1% 0.4% 0.6% 0.7% 0.6% Firm Wholesale Peak Demand, MW NTUA TRICO NEC Shell TOUA Total Firm Demand Total Retail & Firm Wholesale 2,443 2,388 2,401 2,434 2,473 2,583 2,569 2,581 2,529 2,539 2,550 2,548 2,559 2,575 2,593 2,609 Page - 41
42 Tucson Electric Power Future Drivers that May Influence the Long-Term Load Forecast In addition to the macro-economic factors that are inherent in long-term load forecasts, future load growth will be influenced by development of emerging technologies and the adoption of customer-driven technologies. One such technology is electric vehicles (EVs). EVs could play a significant role in future years as both a load requirement (charge mode) and a system energy resource (discharge mode). To achieve the most benefit from electric vehicles in terms of grid operations and emission reductions, incentives are needed for daytime workplace charging. A daytime charging incentive would enable customers to take advantage of low cost solar resources during the day while simultaneously providing system discharge benefits to help manage real-time grid requirements. Furthermore, the utility of the future will be required to accommodate higher levels of distributed energy resources and other grid innovations as the company transitions to a smart digital network. This strategy is much different than how the distribution system has been managed in the past. At the core of these smart network changes is the need for a digital communications network that will allow for intelligent electronic devices to be installed on the distribution system by both customers and the utility. This communication network will be managed through the use of a DMS that will process the information from these devices and make decisions in a manner that optimizes grid operations for the benefit of the utility and its customers. Finally, rate design will also need to evolve to offer customers more options and choices. Customers may want to have access to real-time pricing tariffs in order to minimize their energy usage during high cost periods. Other customers may want sign up for clean energy tariffs that incentive the use of zero-emission resources such as renewables, DR, and EE. Other customers may want a demand -and energy- based rate tariff that would enable them to take advantage of distributed energy resources and storage technologies. In any case, the ability to collect and manage real-time grid data will be a critical milestone for utilities to achieve in order to provide these types of services for customers in the future. This next sections discusses some of these evolving technologies and discusses how the Company plans to integrate them over the next few years as part of the on-going IRP planning process. Page - 42

 which have both an electric motor and an internal combustion engine that burns fossil fuel Figure 2")
43 2017 Integrated Resource Plan Electric Vehicles Nationwide, 2016 plug in electric vehicle sales were 159,139 units 7 of 1.1 million light vehicles sold 8 for a 14% market share. Plug in electric vehicles predominantly fall into two categories: Battery Electric Vehicles (BEV) fully electric, battery only vehicles that do not consume fossil fuel Plug-in Electric Vehicles (PEV) which have both an electric motor and an internal combustion engine that burns fossil fuel Figure 2 Tesla Model Page - 43

44 Tucson Electric Power An additional class of vehicle, the Hybrid Electric Vehicle (HEV), incorporates electric battery technology similar to a PEV but notably receives its charge via regenerative braking and on-board charging via an internal combustion engine. HEVs represent the largest share of electrified vehicles operating in Arizona at 1.1%, but do not plug in to the electrical grid for charging and therefor are not considered a factor in future load growth scenarios. Of active vehicles registered in the state of Arizona, just 0.09% (6,260 vehicles) are PEVs or BEVs. Based on the low adoption rate and total number of EVs in Arizona, it is reasonable to assume that EV adoption in the state will continue to lag national high, medium, and low market penetration projections. This IRP contemplates two scenarios, an aggressive growth scenario and moderate base case scenario. Under the base case scenario EV load projections remain below 1% through 2024 and reach 2.5% of load by The more aggressive scenario reaches 1% by 2021 and ramps up to 5% by Figure 3- Electric Vehicle Demand Scenarios Page - 44

45 2017 Integrated Resource Plan Future Adoption Rate Influencers Much research around the country has gone into understanding the factors that underlie BEV and PEV adoption. While many innovative programs and initiatives have been launched to support EV adoption, the two most significant influencers of adoption rates are: Policy Future advances in battery technology Policy The most clearly demonstrable influencer of EV adoption to date has been federal and state policy creating incentives directly reducing the cost of EV purchases. States with highest incentives, such as California, Oregon and Georgia, have reached EV adoption rates 2 to 4 times above the national average. At the state level, incentive policies are dependent on public support and may be complimented by regulations such as California s Zero Emission Vehicle program requiring automakers to achieve volumetric EV sales goals tied to their total fleet sales numbers. Battery Technology The opportunity that holds the greatest promise to increase future EV adoption rates is improvements to battery and manufacturing technology that reduce the cost of batteries measured, in $/kwh. Industry analysis ties the price point at which EVs are on parity with contemporary internal combustion engine vehicles to a battery cost of $100/kWh capacity. The current cost of batteries is around $300/kWh capacity with claims the 2017 Tesla and Chevy Bolt will feature battery cells below $200/kWh. Figure 4 Tesla Lithium-Ion Battery Production Page - 45

46 Tucson Electric Power Grid Impacts Advancements in EV battery technology are dramatically increasing the range of these vehicles and driving charging patterns towards evening, at home charging, which can be accommodated through existing infrastructure via level 1 trickle charging using a standard 120v residential outlet. This pattern aligns with TEP s current time of use based electric vehicle charging discount and creates a load pattern centered on late evening off-peak power. A second charging profile option would center on workplace charging and presents a future opportunity to leverage power produced during low generation-cost daylight hours. This daytime workplace charging profile is not incented under the current rate structure but could be promoted through a future tariff design and a workplace charging station support program. Figure 5 - EV Charging Profiles Page - 46
 are leading many of these changes. TEP is developing and analyzing strategies to enable these opportunities.")

47 2017 Integrated Resource Plan Smart Grid The Future of the Distribution Grid Changes in the supply, demand, and delivery of electricity are remodeling electric distribution systems at most North American utilities. Distributed Energy Resources (DERs) are leading many of these changes. TEP is developing and analyzing strategies to enable these opportunities. The overarching strategy will help TEP adapt to the changing landscape for regulated electric utilities. TEP envisions a future that will accommodate DERs and other innovations into the existing network while transitioning to a digital network. To accommodate DERs and other innovations, electric utilities need to do more than make their distribution systems bigger. Instead, utilities need to make their distribution systems smarter. Smart distribution systems provide flexibility, capability, speed, and resilience. These smart distribution systems include new types of software, networks, sensors, devices, equipment, and resources. To achieve new levels of economic value, these smart distribution systems operate according to new strategies and metrics. With more DG resources being deployed on TEP s distribution system, higher demands and lower per capita energy consumption is occurring today. This puts demands on the transmission and distribution systems that were not contemplated in the original designs and requirements of the system. To meet these new demands, new methods of operation and technology need to be developed and implemented. TEP is investigating technology to add more sensing and measurement devices and new methods for managing and operating the distribution system. This approach turns a distribution feeder into an effective micro grid system. Figure 6 Smart Grid Systems Page - 47
48 Tucson Electric Power With increased demand and lower per capita energy consumption, new techniques and strategies need to be developed and implemented to effectively manage costs. By adding additional measurement and sensing capabilities, the situational awareness of the distribution system will be increased. The increased situational awareness allows for real time operations and planning opportunities for efficiency and productivity changes. To utilize the existing distribution system more efficiently, TEP is investigating the use of DERs, energy storage, EE, and targeted DR capabilities in conjunction with optimization software. These improvements may reduce the infrastructure additions required in the past as customer demand increased. This strategy is much different than how the distribution system has been managed in the past. It requires the use of a bottom up planning and design process that needs to be integrated with the IRP process. New tools and capabilities will be required as a result of the new opportunities envisioned. At the core of these changes is the need for a communications network that allows for intelligent electronic devices to be installed on the distribution system. The communications network allows for the backhaul of information from the intelligent electronic devices to centralized software and control applications. Simply collecting and displaying more sensing and measurement information won t provide the needed benefits. An integrated approach to the installation of field devices, software applications, and historical data management will be needed. A DMS is the central software application that provides distribution Supervisory Control and Data Acquisition (SCADA), outage management, and geographical information into a single operations view. By combining the information from all three of these systems into a single view, an electrical distribution system model can be created for both real time applications and planning needs. The single view provides situational awareness of the distribution system that has not been possible in the past. It also creates a platform from which additional applications can be launched to continue to provide value and new opportunities. The historical information also creates a new opportunity to drive value and decisions based on system performance and dynamic simulations. With the development of multiple distribution micro grid feeders and DER systems, the challenge of resource dispatching will become more complex. A solution to dispatch across a fleet of resources of existing centralized generation, purchased power from the market, and the intermittency of DER systems to customer demand will be required. The speed with which the resource pool will need to change and optimize for efficiency and cost will require the system to be automated. The distribution micro grid feeder concept is intended to help manage the distribution level intermittency but would need to be monitored and managed by the automated system for resource management. To manage such a large and dynamic system as outlined is a substantial challenge. This type of automated system is not currently available within the utility industry. Page - 48
49 2017 Integrated Resource Plan OPERATIONAL REQUIREMENTS AND RELIABILITY CHAPTER 3 Load and Resource Adequacy A critical component of the IRP planning process is the assessment of available firm resource capacity to meet firm load obligations and to maintain a planning margin above a utility s forecasted load. As part of TEP s longterm planning process, the Company targets a 15% planning reserve margin in order to cover for forecasting variances and any system contingencies related to unplanned outages on its generation and transmission system. Chart 6 - TEP s 2017 Loads and Resource Assessment Existing Resources 3,500 MW 3,000 2,500 2,000 1,500 1, San Juan Unit MW (Retired) Sundt Unit 1 81 MW (Retired) Navajo Units MW (Retired) 800 MW Capacity Shortfall Sundt Unit 2 81 MW (Retired) San Juan Unit MW (Retired) Local CTs 123 MW (Retired) Coal Resources Natural Gas Resources Renewable Resources Sundt Unit MW (Retired) Demand Response Market Purchases Net Retail, Firm & Reserves 1,200 MW Capacity Shortfall Chart 6 above illustrates TEP s existing resource portfolio compared to a retail load forecast which includes firm wholesale and planning reserves. This loads and resource assessment includes significant coal and natural gas generating unit retirements. San Juan Unit 2 will cease operations by December 31, Preliminary studies performed by plant participants at Navajo Generating Station indicate that all 3 units could be retired as early as year-end TEP is weighing its options to completely exit and terminate its participation on San Juan Unit 1 by the end of June TEP is also committed to retiring and replacing its older and less efficient natural gas steam generators at Sundt Generating Station. The capacity reduction of these aging and costly units will require TEP to diligently secure cost-effective replacement capacity in the near future. Within 5 years TEP may need 800 MWs of replacement capacity. That shortfall increases to approximately 1,200 MWs by the end of the 15-year planning horizon. The emergence of renewable resources, combined with evolving operational requirements, present challenges but also an opportunity to build a resource portfolio that is economically and environmentally sound. TEP is responsive to Page - 49
50 Tucson Electric Power its customers and dedicated to provide them safe, clean, and reliable power. This IRP presents a Reference Case Plan that achieves a target of 30% renewable generation by TEP is also committed to its EE programs and is supportive of DG. The renewables target and EE/DG projections will be complimented with proposed installations of Energy Storage Systems and RICEs. The reduction of generation anticipated from TEP s traditionally base-loaded coal units also necessitates the addition of natural gas combined cycle generation as a replacement. Table 3 summarizes TEP gross retail peak demands by year based on its September 2016 load forecast projections. These demands are summarized by customer class and by the Company s assumptions on coincident peak load reductions from DG and EE. In addition, TEP includes a summary of projected firm wholesale customer demands along with demand associated with system losses. Table 3 also summarizes the Company s reserve margin positions based on the capacity resources shown in Table 4. Table 4 summarizes TEP s firm resource capacity based on its current planning assumptions related to its coal and natural gas resources. Table 4 also reflects TEP s plan to source 30% of its retail energy needs from renewable generation resources by Additional resources such as DR programs, short-term market purchases, along with capacity sourced from its proposed battery storage project, are also shown in the TEP resource portfolio. The resource portfolio also includes the addition of NGCC resources to offset coal unit retirements and RICEs to help mitigate intra-hour intermittency and variability challenges introduced by renewable resources. Page - 50
51 Tucson Electric Power Company Future Load Obligations The following two tables provide a data summary of TEP s loads and resources. Table 3 shows TEP s projected firm load obligations, which include retail, firm wholesale, system losses, and planning reserves. Table 3 - Firm Load Obligations, System Peak Demand (MW) Firm Load, Demand MW Residential 1,284 1,304 1,326 1,356 1,379 1,411 1,425 1,439 1,464 1,474 1,487 1,492 1,503 1,519 1,534 1,550 Commercial Industrial Mining Gross Retail Demand 2,438 2,474 2,513 2,574 2,635 2,764 2,789 2,814 2,859 2,878 2,900 2,909 2,929 2,957 2,984 3,012 Distributed Generation Energy Efficiency Net Retail Demand 2,220 2,230 2,243 2,281 2,319 2,429 2,440 2,452 2,485 2,494 2,506 2,504 2,515 2,532 2,549 2,566 Firm Wholesale Demand Total Firm Load Obligations 2,443 2,388 2,401 2,435 2,473 2,583 2,569 2,581 2,529 2,538 2,550 2,548 2,559 2,576 2,593 2,610 Reserve Margin Reserve Margin, % 21% 15% 15% 15% 15% 15% 15% 15% 19% 20% 20% 21% 18% 18% 17% 17% Page - 51
52 System Resource Capacity Table 4 shows TEP s Reference Case Plan schedule for firm resource capacity based on a resource s contribution to system peak. Table 4 Capacity Resources, System Peak Demand (MW) 2017 Integrated Resource Plan Firm Resource Capacity (MW) Four Corners Navajo San Juan Springerville Remote Coal Resources 1,411 1,241 1,241 1,073 1, Sundt Luna Energy Facility Gila River Power Station Existing Combustion Turbines Future Peaking Resources Future NGCC Resources RICE Resources Total Natural Gas Resources 1,237 1,237 1,237 1,252 1,252 1,679 1,679 1,679 1,679 1,679 1,679 1,679 1,556 1,556 1,596 1,596 Utility Scale Renewables Demand Response Total Renewables & DR Resources Short-Term Market Resources Future Storage Resources Total Firm Resources 2,965 2,749 2,763 2,800 2,847 2,971 2,964 2,976 3,010 3,037 3,069 3,095 3,007 3,029 3,028 3,044 Page - 52
53 2017 Integrated Resource Plan Typical Dispatch Profiles The previous section described how the TEP Reference Case Plan will address peak hour demand. This IRP, more than previous ones, required additional analysis on the inter and intra-hour demand requirements and the response of the optimal resource mix. Chart 7 illustrates the manner in which existing resources were routinely dispatched to meet anticipated load requirements during a summer peak-type day in The figures do not represent the actual peak days; instead the demand profiles demonstrated in these figures are a typical day representative of each respective season for In Chart 7, it s clear that TEP s existing renewable resources have already had an impact on the dispatch of its coal and natural gas resources. Both Chart 7 and Chart 8 below are derived from a sample of actual production data. The area shown above the Retail line represents opportunity sales made to the spot market. Note that the current level of renewable resources is creating a greater opportunity to make sales from coal and natural gas resources. Of course, the depth of that opportunity may not always exist as renewables are creating this situation regionally and not just for the utility. This creates pressure on regional power prices, which have remained depressed over recent years, influenced by excess generation and low priced natural gas. Chart Example Summer Day Dispatch MW Typical Peak Day (Hours) Renewables Coal Natural Gas Purchases Retail In Chart 7 above, we observe that the high peak demand experienced in the summer can be met with substantial market purchases and the utilization of existing peaking resources (gas turbines). The contribution from renewables, in green, is shifting these traditional peaks further to the right and into the evening hours. Increased solar generation is already creating a shift in gas and energy market forecasts. Page - 53
54 Tucson Electric Power With capacity available for purchase, the gas and energy market price forecasts dictate that a part of TEP s gas resources would be displaced. The portion of the gas resources that are not dispatched have traditionally served as stand-by (reserve) capacity, thus serving a vital purpose in maintaining system reliability. This displacement is also cause to reevaluate how coal and gas resources should operate and in some cases if they re able to operate with redefined parameters. As demonstrated in Chart 7, TEP experiences its peak demand at 4 to 5 PM in either July or August. Increased penetration of solar PV is having the net effect of shifting this peak to later hours, ultimately onto 7 to 8 PM as the sun sets. Meanwhile, system operators are deploying their fastest ramping units upward to respond to the ramp-down of solar resources. Chart Example Winter Day Dispatch MW Typical Peak Day (Hours) Renewables Coal Natural Gas Purchases Retail The TEP winter load profile, as seen in Chart 8 above, differs significantly from the summer profile. The peak demand experienced on weekdays in the winter is measurably lower than those seen in the summer. In the winter months, the load peaks in the early morning hours and then again in the late evening. The dispatch strategy in the winter differs significantly from the strategy in the summer. A different set of challenges emerges with increased solar generation during the winter. A more pronounced duck curve creates ramp down and ramp up challenges, while also pushing the traditional base-load coal plants closer to their minimum generation (and ultimately below). Page - 54

55 2017 Integrated Resource Plan Balancing Authority Operations To describe TEP s utility operation with respect to the electric grid requires a review of electric grid fundamentals. There are several interconnections on the North American continent the Eastern, Electric Reliability Council Of Texas, Quebec, and the Western. These are each part of the North American Electric Reliability Corporation (NERC), (see Figure 7). In addition Centro Nacional de Control de Energia (CENACE) operates the national grid of Mexico. Within the Western Interconnection, there are 38 BAs (see Figure 8). Each BA is responsible to balance loads and resources so that frequency remains at or near 60 Hz or 60 cycles per second. This resource balance is important for the safe and reliable operation of supply side resources and end use equipment. Simply put, a BA is the collection of loads and resources within a metered boundary, connected to other BAs through transmission ties for the purpose of maintaining frequency. TEP s BA boundary (see Figure 9) has 44 ties to our 7 adjacent BAs. Figure 7 - NERC Interconnections Page - 55

56 Tucson Electric Power Figure 8 - Western Interconnection Balancing Authorities Page - 56

57 2017 Integrated Resource Plan Figure 9 - TEP s Balancing Authority Area Page - 57
.")

58 Tucson Electric Power The primary quantity established by NERC for determining a BA s reliability performance is Area Control Error (ACE). ACE is the instantaneous measure of a BA s ability to manage its load obligations and support the interconnection frequency (see Figure 10). The following measures of ACE over time are the standards that each BA is expected to meet: Control Performance Standard (CPS) CPS is a measure of a BA s ACE over time with respect to frequency. The BA helps frequency by over generating when frequency is low, and under generating when frequency is high. This is known as having ACE on the opposite side of frequency. Balancing Authority ACE Limit (BAAL) BAAL is a measure of how long a BA remains with an ACE that is hindering frequency. It is understood that no BA can always support frequency, but it is expected that a BA experiencing difficulties does not lean on the interconnection longer than it takes to resolve the issue. Disturbance Control Standard (DCS) DCS is a measure of a BA s ability to replace their generating resources following the unplanned loss of a resource. Frequency Response Measure (FRM) FRM is a measure of a BA s ability to provide frequency response during a disturbance. Frequency response typically comes from governor response on generators with capacity to increase output, inductive loads, and more recently inverter technology connected to batteries or renewable sources with capacity to respond. Figure 10 - Balancing Area Function Page - 58
59 2017 Integrated Resource Plan Reserves Reserves are the key to providing a BA with the ability to respond to deviations in ACE and remain compliant with the measures above. Reserves are often labeled by the function they are performing such as regulating reserves for following load, contingency reserves for responding to a disturbance, frequency responsive reserves that immediately respond to frequency excursions. Collectively they are referred to as Operating Reserves. Reserves are also classified as spinning and non-spinning. Spin refers to generation that is online but unloaded so that it can immediately respond to an event. The reserve classification of non-spin or supplemental comes from generation that is not connected to the system but can be connected and generating power within 10 minutes, such as a quick start turbine. Interruptible load contracts also fall into this non-spin category. Non-spin is primarily used for disturbance recovery. With the proliferation of power electronics, many utilities, reserve sharing groups, and regulating bodies recognize the value of storage systems and head room on renewable systems which factor into the reserve calculation. Load Following Load following is generally characterized by a utility s ability to follow the load shape of its BA Area and regulate power output changes over a five to ten minute timeframe. Load following is required to respond to the changing conditions of electric supply and demand. Historically, utilities relied on a mix of conventional generation resources tied into a utilities Energy Management System (EMS) that provided Automatic Generation Control (AGC) to manage their load following requirements. However, as renewable resources become a larger part of the resource portfolio, changes in supply and demand conditions will become more extreme and will happen more frequently. These changes require fast responding resources and demand side shaping to accommodate the fluctuating resources as renewable penetration increases. Regulation is used to reconcile momentary differences caused by fluctuations in generation and loads. The primary reason for controlling regulation in the power system is to maintain grid frequency requirements that comply with the NERC s Real Power Balancing Control Performance and Disturbance Control Performance Standards. The benefit of regulation from storage technologies with a fast ramp rates are on the order of two to three times that of regulation provided by conventional generation. This is due to the fact that storage technologies have the ability to react to changes in system conditions in a matter of a minute or two rather than several minutes. The black load demand line in Chart 9 shows numerous fluctuations depicting the imbalance between generation and load without regulation. The thicker orange line in the plot shows a smoother system response after damping of those fluctuations with regulation. One of the new challenges with high levels of renewable penetration is the low load levels seen in the off season belly of the duck curve (see Chart 10), as well as the large daily swings associated with the peak season load shape. With loads being supplied by both DG and utility scale renewables, the conventional resources must be backed down to make room for the renewables, but then must ramp up to cover the peak when the renewables are unavailable. Page - 59
60 Tucson Electric Power Chart 9 Effects of Load Regulation Demand, MW Hourly Demand - Typical Summer Day Wind Solar Coal Resource Natural Gas Intermediate Units Purchases Natural Gas Peakers Demand Regulated Demand Without Regulation Chart 10 - Typical 2030 Winter/Spring Duck Curve Page - 60
61 2017 Integrated Resource Plan Another challenge to regulation with high levels of renewable penetration is intermittency. Moving cloud cover and variations in wind, among other weather patterns, can cause large amounts of renewable generation to drop out or return to service in mere minutes. These fast changes in renewable generation require resources that can ramp up and down quickly and repeatedly in order to regulate and maintain performance measures. Many potential solutions to help mitigate this steep daily ramp up and down and inter-hour intermittency are being explored and include: Cycling coal plants Lowering the minimum operating levels of conventional plants Investing in fast response generating technology Investing in storage systems Changing the load shape through rate design Adjustments to Operating Reserve TEP maintains an amount of Operating Reserves greater than the minimum requirement, but had not quantified the excess. Difficulties with regulation due to renewable intermittency led TEP s System Control to study the intermittency and excess operating reserves. The result was a change to how TEP calculates and carries Operating Reserve. The purpose of the adjustment to Operation Reserves is to ensure a defined amount of excess reserves are available at all times. The new calculation will require that additional Operating Reserves are carried in the On-Peak hours and Off-Peak Hours. Excess Reserves meeting the new criteria were already available during 85% of hours in the year, but implementing this new criteria is necessary to ensure sufficient reserves are available at all times. TEP s Energy Management System takes the System Load, and depending on whether it is an On-Peak or Off- Peak hour, multiply it by a variability margin. This amount is added to the Spinning Reserve Requirement, which the System Operators monitor and maintain around-the-clock. They are also free to deploy this reserve as necessary to maintain performance measures. Frequency Response Frequency response is an ancillary service requirement that is similar to regulation except that frequency response automatically reacts to a system disturbance in seconds rather than minutes. Frequency disturbances occur when there is a sudden loss of a generating unit or a transmission line outage disrupting the load/resource balance. As a result, other generating resources that are online must respond to counteract this sudden imbalance between load and generation and to maintain the system frequency and stability of the grid. The first response within the initial seconds is called the primary frequency control. This response is the result of the governor action on the generating units as well as storage systems which automatically increase their power output as shown in the lower portion of Figure 11 below. This is followed by the longer duration of secondary frequency controls. These responses are initiated by AGC that spans a half a minute to several minutes shown by the dotted line in the lower portion of Figure 11. The combined effect of inertia and the governor actions of online generating units determines the rate of frequency decay and recovery shown in the arresting and rebound periods in the upper portion of Figure 11. This is also the window of time in which the fast-acting response of flywheel and battery storage systems excels in stabilizing the frequency. The presence of fast-acting storage assures a smoother transition to normal operation returning grid frequency back to its normal range. Page - 61

62 Tucson Electric Power Figure 11 Sequential Actions of Frequency Controls Inertia Generators and motor load provide the inertia of a system. Inertia is the rotating mass of generators and their prime movers, as well as motors and their load which oppose changes in frequency. The magnitude of inertia in the system is changing as the industry moves from large centralized steam plants to more of a distributed network of gas turbines and renewable systems. As the inertia declines, the rate of change of frequency increases. The contribution to inertia from power electronics and their systems is still to be quantified and is sometimes referred to as pseudo inertia. Voltage Support Another reliability requirement for electric grid operation is to maintain grid voltage within specified limits. To manage reactance at the grid level, system operators need voltage support resources to offset reactive effects so that the transmission and distribution system networks can be operated in a stable manner. Normally, designated power plants are used to generate reactive power (volt-ampere reactive, VAR) to offset reactance in the grid. As power plants are displaced, VAR sources need to be strategically placed within the grid at central locations and by taking the distributed approach and placing multiple VAR-support storage systems near large loads. Page - 62
63 2017 Integrated Resource Plan Power Quality The electric power quality service involves using storage to protect customer on-site loads downstream (from storage) against short-duration events that affect the quality of power delivered to the customer s loads. Some manifestations of poor power quality include the following: Variations in voltage magnitude (e.g., short-term spikes or dips, longer term surges, or sags) Variations in the primary 60-hertz (Hz) frequency at which power is delivered Low power factor (voltage and current excessively out of phase with each other) Harmonics (i.e., the presence of currents or voltages at frequencies other than the primary frequency) Interruptions in service, of any duration, ranging from a fraction of a second to several seconds Typically, the discharge duration required for the power quality use ranges from a few seconds to a few minutes. Distributed storage systems can monitor grid power quality and discharge to smooth out disturbances so that it is transparent to customers. Table 5 Ancillary Services Technical Consideration for Storage Technologies Ancillary Services Storage System Size Target Discharge Duration Load Following / Ramping Regulation MW Range: MW Range: 15 minutes to 60 minutes Range: 15 minutes to 60 minutes Minimum Cycles/Year Not Applicable ,000 Voltage Support 1 10 (MVAR) Not Applicable Not Applicable Distribution Deferral 500 kilowatts (kw) 10 MW Range: 1 4 hours Power Quality 100 kw 10 MW 10 seconds 15 minutes Frequency Response MW 5 seconds 5 minutes Page - 63

64 Tucson Electric Power Distribution System Enhancements Distribution Capacity Expansion TEP s long term distribution system capacity requirements are being supported by strategically targeting areas where new substations can be built, increasing existing substation capacity, and the optimizing the replacement of ageing equipment. New 138kV Substations New 138kV substations have been identified in the Company s 10 year transmission plan. Historically, justification for new substations in the 10 year plan have been driven primarily from capacity needs on the distribution system. These new 138kV-sourced distribution substations will not only help support and increase system capacity, they will provide additional contingency support for the existing distribution network. The new 138kV substations also align with long range plans of further utilizing the 138kV system to directly source the distribution system. The 138kV transmission system is more reliable than the 46kV subtransmission system that is used to source a significant portion of the distribution system. These new substations allow for more of the distribution system load to be sourced from a more reliable 138kV system. Benefits Realized from New Substations Reduced peak loading on existing system Increased capacity for future commercial, residential and light industrial development Increased contingency support to improve system reliability and operational flexibility Additional capacity can be utilized to identify and evaluate improved service for critical customers Supports other technology integration such as remote switching control Supports long term plans for 4kV system conversion to 13.8kV Retirement of ageing substations where feasible Reduces distribution system loses Page - 64
65 2017 Integrated Resource Plan Existing Substation Upgrades Continued focus on utilizing the Asset Management Group to analyze and monitor all of TEP s existing substation equipment will help identify which ageing substation transformers are in need of replacement throughout the system. Once the transformers have been identified for replacement, they are evaluated in relation to current system conditions to determine a proper replacement strategy. In many cases, increased transformer capacity and upgrades to a higher low-side voltage are required. Similar to what has been described above, increased transformer capacity will improve operational flexibility and system reliability. Additionally, installing new transformers with a 13.8kV low-side voltage aligns with long range plans for upgrading the 4kV distribution system to meet existing standards. 4kV System Conversion Initially, the 4kV system emerged as the primary distribution voltage to serve all residential and commercial load within central Tucson. A majority of the 4kV system is sub-standard when compared to the Company s 13.8kV system, however, a full system conversion will be very labor and cost intensive. Many of the existing components including cable, service transformers, poles, arms, and insulators must be replaced to fully convert the system to 13.8kV. Efforts are underway for identifying a long-range plan for system conversion and these plans will rely on projects identified above related to substation transformer replacements. 4KV System Conversion Benefits Opportunity for aligning system conversion with substation transformer change-outs Increased circuit capacity with voltage conversion Improved system reliability by creating stronger ties with the existing 13.8kV system Increased contingency support will improve outage restoration time Reduced system loses Page - 65
66 Tucson Electric Power Clean Energy Standards Beginning in 1999, with the Environmental Portfolio Standard, the Arizona Corporation Commission (ACC or Commission ) has adopted clean energy standards, which establish goals for all Arizona load serving entities regulated by the Commission, such as TEP to (1) utilize renewable energy resources to meet a portion of its retail load, and (2) design and implement EE programs to reduce some percentage of customer energy use. These standards were intended to, and in fact have, accrued certain benefits to customers, as well as broader society, including: Reduced emissions of greenhouse gases and other air pollutants though a reduction in fossil-fuelgeneration Reduced renewable energy unit costs by contributing to a larger and more certain market for renewable energy manufacturers and installers Reduced overall customer bills, by promoting cost-effective EE measures Renewable Energy Standard Compliance The Renewable Energy Standard 9 (RES) sets forth a requirement for all Arizona load serving entities to meet a percentage of their retail load using renewable energy resources. This percentage increases annually until it reaches 15% in In 2017 the RES target for TEP will be approximately 621 GWh based on 7.0% of 2016 retail sales. TEP anticipates exceeding the annual requirement in 2017 and each year thereafter as part of its goal to reach 30% of retail load using renewable energy by Energy Efficiency Standard Compliance The Arizona Energy Efficiency Standard ( EE Standard ) sets forth a requirement for all Arizona load serving entities to achieve energy savings based on a percentage of the prior year retail load, growing to a cumulative load reduction of 22% by Table 6 shows TEP s progress towards meeting the standard annually. As of the end of 2016, TEP has achieved the required savings and is poised to continue through In 2017 TEP s target for energy savings will be 204,341 MWh, based on 14.5% of 2016 retail sales. For resource planning purposes, TEP has assumed that it maintains compliance with Arizona EE Standard through 2020 when the program sunsets. Assumptions for EE savings after 2020 are addressed in Chapter Renewable Energy Standard and Tariff, A.C.C. R Page - 66
67 2017 Integrated Resource Plan Table 6 - Energy Efficiency Cumulative Annual Savings Progress towards the Standard Year Retail Energy Sales (MWh) Incremental Annual Energy Savings (MWh) Cumulative Annual Energy Savings (MWh) Cumulative Annual Savings as a % of previous year Retail Sales Cumulative EE Standard ,291, ,332, , , % 1.25% ,264, , , % 3.00% ,278, , , % 5.00% ,520, , , % 7.25% ,431, , , % 9.50% ,387, ,466 1,011, % 12.00% ,341 1,216, % 14.50% Utility-Specific Standard Derived Through the IRP Process While the RES and EE standard have produced real and tangible benefits as noted above, clean energy standards applied at a statewide level are inherently inflexible and fail to take into account the unique circumstances of different utilities. This creates inefficacies in resource acquisition and dispatch, which ultimately results in higher costs passed on to customers. In the early years of these programs, when the clean energy goals were modest, the impact of these inefficiencies was not significant. However, as these clean energy goals approach higher percentages of the total retail load, TEP anticipates that the negative impact of these inefficiencies will become more pronounced. Proper consideration of cost and benefits of various resources is a fundamental function of integrated resource planning. In fact, the IRP provides the most holistic consideration of the very goals that clean energy standards aim to achieve, while balancing the cost of achieving those goals. Since integrated resource planning was reinstated in 2011, the goal of the IRP has shifted from focusing on the least-cost portfolio to the best case portfolio considering cost, environmental factors, and reducing long-term risk. Addressing clean energy standards within the IRP would put the cost effectiveness of renewable energy, EE, and DR on a level playing field with conventional resources based on their role in creating a low-cost, low-risk resource portfolio. Adding to the logic of this approach is that many renewable energy technologies are at or approaching parity with conventional resources, and cost effective EE remains the lowest cost resource. Finally, IRP tools are continually being adapted to account for emerging hourly and sub-hourly operational issues that accompany certain renewable energy and DR products. Therefore, TEP believes that the IRP would be a better mechanism to develop utility-specific targets for clean energy standards than a state-wide, one size fits all rulemaking. Page - 67
68 Tucson Electric Power Renewable Energy Integration TEP is targeting a renewable portfolio that will supply 30% of its retail load requirement by This aggressive target will come with its own set of challenges and it will require TEP to derive a balanced, responsive, and diverse generation portfolio. This section will point out and explain the operational challenges that TEP will face as it increases its use of renewable generation. Operational Challenges Historically, electric utilities with predominant air conditioning load set a peak demand between 4:00 PM to 5:00 PM on a summer day. The winter load requirements are lower than they are for the summer but, the challenges that emerge on a daily basis (with heavy solar penetration) are more pronounced. Chart 11 below illustrates a sample winter day for TEP. On a typical winter day retail load tends to peak at day-break and again after the sun sets and consumers turn on appliances and lighting. Chart 11 Sample Operational Challenges due to Solar Production Typical 2030 Winter Day Load Profile Ramp Down 2 - Minimum Generation 3 - Over-Generation 4 - Ramp-Up 5 - Peak Shift MW Typical Peak Day (Hours) Coal Natural Gas/Purchases Over Generation Retail (net renewables) Page - 68
69 2017 Integrated Resource Plan The accumulation of solar PV introduces operational challenges on a daily basis. As we review Chart 11 above showing the load shape of a typical winter day, we make the following observations; 1. Ramp Down Absent solar PV, the demand profile on a typical winter day includes a peak in the morning and one in the evening. The morning peak occurs during the coldest hours as the sun rises and while consumers wake, homes and businesses are warmed and commuters head to work. The retail load, on its own, would trend downward modestly as the sun rises and tracks along the horizon. This ramp-down was typically managed with coal and natural gas resources. The net effect of addition solar PV will cause a more drastic ramp-down. Fast-response resources, such as RICEs, will be required to manage this steep reduction in net load. These units will likely be prescheduled to contribute to the morning peak and then utilized to ramp down to give way to the sun and solar PV. 2. Minimum Generation As solar PV generation reaches its peak, and after ramp-down, generating units must have the capability to generate at reduced output levels during the midday hours. Modifications may be required on units to allow them to cycle off. If cycling is not an option for generators, TEP must rely on market demand for excess thermal generation off-take or develop strategies to dispatch below its minimum generation. 3. Over-Generation The CAISO is already experiencing negative pricing for over-generation during peak PV generating hours. Adjacent utilities and entities have been the beneficiaries of this pricing. The opportunity to charge Energy Storage Systems (ESS), such as batteries or hydro pumped-storage, presents itself during these hours to take advantage of excess generation at low cost. Increased PV at TEP will contribute to over-generation and will require innovative ideas and infrastructure to secure the right mixture of resources. 4. Ramp Up The sun begins to set, fast-responding resources must now ramp up to displace the demand that solar PV relinquishes. It s at this point that a utility must utilize flexible resources to equally offset the drop in solar generation. The ramp-up may be mitigated in the near term by combustion turbines and natural gas combined cycle generators. As the ramp-up steepens, it may necessitate the inclusion of ESS, RICE, and/or DR mechanisms. 5. Peak Shift Solar PV will only reduce demand until the sun sets. This results in a narrowing and net shift of peak demand. CAISO has also demonstrated escalated pricing in these evening and night hours. While ESS charges during the over-generation hours, this peak period may present an opportunity to discharge these systems, especially if we observe a transformation of hourly peak and off-peak pricing. Solar PV has tremendous upside and arguably it may contribute to reduced losses, to apportioned capacity reductions (generation and transmission), and to carbon emission reductions, among other benefits. We recognize from the chart and discussion above that other challenges arise. As the sun is rising, electric load stabilizes and begins an ascent toward the peak. Increased penetration of solar creates a rapid net drop in load; TEP must have generators that are capable of ramping down at a fast rate. Most baseload units such as coal and natural gas-steam are challenged to respond to this ramp down and subsequent ramp up. In between we may be challenged with unit generation minimums and negative pricing. The net reduction in load will create the need for rapid responding generators to regulate the initial steep decline in load followed by an immediate rise. In a resource planning context, with the increasing penetration of solar systems, we must take into consideration the right combination of resources to respond to the variability and intermittency of renewable systems. A portfolio with a high penetration of solar and other renewables may necessitate the installation of RICEs and/or storage in the form of batteries or natural gas. Page - 69
70 Tucson Electric Power Shifting Net Peak Chart 12 below represents a projected 2030 typical summer peak day for retail demand and the net retail demand adjusted for varying levels of solar penetration as estimated in the Reference Case Plan. The chart illustrates how increased penetration of solar PV and solar DG will shift the net peak retail demand from approximately 4 PM to ultimately 8 PM. The net reduction in peak will not exceed the difference between the demand demonstrated at 4 PM and the demand at 8 PM when the sun has already set. In fact, TEP anticipates that approximately 350 MWs of PV and DG will be in service by year-end The impact of the current solar portfolio is demonstrated in the chart below; net peak demand has already been reduced by and the net peak is shifted to 7 PM. The addition of 150 MWs prior to year-end 2020 will reduce the peak minimally but the time of peak will shift further to the right and to 8 PM. After 2020, we observe that solar generation from PV and DG will have negligible reduction to net peak at 8 PM. The contribution from solar generation toward demand reduction will be constrained within the mid-day hours. Solar generation at levels demonstrated for 2025 and 2030 in the chart, will only contribute toward energy production primarily while other resources must be deployed to meet net peak demand. Chart 12 Peak Demand Contribution from PV Typical Summer Day Load Profile Retail (2030) Net (with 2030 solar) Net (with 2017 solar) Net (with 2020 solar) Net (with 2025 solar) MW Typical Peak Day (Hours) Page - 70
71 2017 Integrated Resource Plan Weather Forecasting to Support System Dispatch Weather forecasting is utilized to reduce operating costs at TEP. There are different products that are used to forecast the weather, but the main product TEP predicts the weather with is weather forecast models. At TEP, we use a regional specific form of a Numerical Weather Prediction (NWP) model. A NWP model is a numerical representation of the different land and atmospheric processes that affect the weather. The specific version of the NWP model TEP uses is known as the Arizona Weather Research & Forecast (AZ WRF) model. This model was created by the University of Arizona (UA), which was done so in partnership with TEP and is maintained with continued support from TEP and a number of other utilities. This model is unique, because it is a highly customized model that is specific to the southwestern United States (US). This is important, because traditional weather forecast models do not take into account the terrain located throughout the southwestern US. The modifications the UA made to the model has allowed it to produce better forecasts than other weather forecast models can. It is also run at a higher resolution than other weather forecast models are. This is done, so small scale weather phenomena can be captured, like the wind events, clouds, and monsoonal thunderstorms created by the surrounding mountains. If we were to use traditional weather models, weather events are commonly either over or under forecasted. Power forecasts are created by the UA for TEP, so TEP can easily take the forecast information and implement it into its existing processes. This power forecast is an ensemble of multiple runs of the North American Model (NAM), the Global Forecast System model (GFS), and the Rapid Refresh model (RR). The power forecast also contains information that TEP gives the UA about the different utility and residential scale solar and wind sites in the service territory. This model provides forecasts that range from 48 hours up to 7 days. The model is run up to 8 times a day and is initialized with different data each time. At this time, TEP s Wholesale Marketing Department uses this power forecast to make decisions, regarding how much power to buy or sell at the real time and day ahead level. Page - 71


72 Tucson Electric Power Below are two examples of these forecasts. The first example is a forecast that covers all of TEP territory s utility-scale solar and the second example is a forecast that covers all of TEP territory s utility-scale wind. Chart 13 TEP Utility Scale Solar Forecast Chart 14 TEP Utility Scale Wind Forecast TEP can see how and if the models that go into the power forecast agree, by looking at the green shading seen on the above forecasts. The confidence intervals represented on the forecasts are reliable through three days. Past the three day mark, however, the forecast s confidence intervals become less and less reliable. A large majority of the uncertainty apparent after three days comes from the uncertainty that is apparent in global weather conditions. Page - 72
73 2017 Integrated Resource Plan Environmental Regulations Overview The electric generating sector currently faces numerous regulations related to air quality, waste generation, protection of waterways, and climate change. Fossil fuel-fired power plants, particularly coal-fired power plants, are significant sources of sulfur dioxide (SO2), nitrogen oxides (NOx), particulate matter (PM), and carbon dioxide (CO2) as well as mercury and other hazardous air pollutants. These power plant emissions are limited through several statutory and regulatory programs. As these regulatory programs have evolved, they have had, and will continue to have important implications for public health, for the mix of U.S. generating resources, and for economic growth by driving investment in new and cleaner technologies and contributing to the retirement of the more inefficient and higher polluting plants. The discussion below provides a snapshot of the major environmental regulatory programs facing the electric generating sector that may have an impact on TEP. Regional Haze The EPA's Regional Haze Rule establishes a goal to reduce visibility impairment in Class I areas (National Parks, Monuments, etc.) to natural conditions by Progress toward this long-term goal is measured in 10-year planning periods. For each planning period, states must develop plans that establish goals and emission reduction strategies for improving visibility by reducing emissions from sources located within their respective jurisdictions. Because Navajo and Four Corners are located on the Navajo Indian Reservation, they are not subject to state oversight; the EPA oversees regional haze planning for these power plants. These state plans must achieve Reasonable Progress toward the 2064 goal, and are reviewed by EPA in relation to that objective. During the first planning period ( ) the rule included an additional requirement referred to as Best Available Retrofit Technology (BART). BART applied to certain industrial facilities built between August 1962 and August In the western U.S., Regional Haze BART determinations have focused on controls for NOx, often resulting in a requirement to install selective catalytic reduction (SCR). Several plant owners subject to BART determinations that called for SCR negotiated alternative to BART provisions in which equivalent or greater emission reductions were achieved through unit retirements combined with other measures in lieu of installing SCR. Final BART provisions applicable to plants owned by TEP are summarized in Table 7 below. Table 7 - Final BART NOx Provisions for TEP-Owned Plants Plant TEP Ownership Four Corners 7% of Units 4 and MW San Juan 50% of Units 1 and MW Navajo 7.5% of Units MW Sundt Unit 4 100% 120 MW BART Provisions SCR on all five units One Unit (Unit 4 or 5) by October 2016 The remaining four units by October 2017 Plant-wide emission rate of 0.11 lbs./mmbtu SCR on all four units by September 2016 Emission rate of 0.11 lbs./mmbtu SCR on all three units Emission rate of lbs./mmbtu SNCR on Unit 4 Unit operates on coal or natural gas Emission rate of 0.36 lb./mmbtu Alternative to BART Provisions Closure of Units 1-3 by January 2014 SCR on Units 4 and 5 by August 2018 Plant-wide emission rate of lbs./mmbtu Closure of Units 2 and 3 by January 2018 SNCR on Units 1 and 4 by February 2016 Emission rate of 0.23 lbs./mmbtu Closure of one unit by January 2020 SCR on the remaining units by January 2031 Emission rate of 0.07 lbs./mmbtu Unit eliminates coal as a fuel source Emission rate of 0.25 lb./mmbtu Page - 73
74 Tucson Electric Power Future planning periods will focus on a Reasonable Progress provisions. Reasonable Progress is an evaluation on the cost effectiveness of emission reductions for a source based on four factors 10 and in relation to the visibility improvement goals established by the State for that planning period. The plants that have been subject to BART provisions are not likely to have further control requirements under Reasonable Progress. Springerville Generating Station was not subject to BART, and therefore, will be evaluated for emission reductions under Reasonable Progress. According to the Arizona Department of Environmental Quality s Proposed Regional Haze 5-Year Progress Report 11, monitoring data from each of the 12 Class I areas in Arizona shows that visibility conditions are expected to exceed their respective 2018 Reasonable Progress goals for the 20% worst days. In addition, there are significant emission reductions expected over the next several years due to the BART determinations for plants in and near Arizona. One of the key metrics for measuring cost effectiveness under a Reasonable Progress evaluation is the cost of the controls divided by amount of emission reductions achieved through implementation of those controls (i.e. $/ton reduced). The higher the $/ ton reduced value, the less likely that those controls will be determined to be cost effective. Springerville is currently well controlled for SO2, NOx and PM emissions (see Chapter 9), meaning there is not a lot of room for further reductions, and lower tons reduced increases the $/ton reduced value. Based on the State s progress in improving visibly at Class I areas in the state, and the anticipated high cost of achieving further emission reductions at Springerville, for purposes of this IRP we assume no further emission reductions will be required at Springerville through a Reasonable Progress determination. Clean Power Plan On October 23, 2015, the EPA published a final rule regulating, for the first time, CO2 emissions from existing power plants. In general, this final rule, referred to as the Clean Power Plan (CPP), aims to reduce CO2 emissions from U.S. power plants by 32% from 2005 levels by More specifically, the rule establishes emission guidelines based on EPA s determination of the best system of emission reductions, which states and tribes (hereto referred to as states ) must use to set standards applicable to the affected plants in their jurisdictions. Arizona is one of 27 states challenging the EPA s rule making authority and Arizona has filed suit against the EPA. On February 9, 2016, the United States Supreme Court issued a stay of the CPP, 12 meaning that the rule has no legal effect pending the resolution of the state and industry challenge to the rule. That challenge is currently before the U.S. Court of Appeals for the D.C. Circuit, which heard oral arguments before an en banc court on September 27, Notwithstanding the status of the litigation, the current Administration has stated it plans to significantly modify, if not completely dismantle the rule. While recognizing that the ultimate outcome of the CPP is highly uncertain, TEP believes it serves as an appropriate proxy for incorporating CO2 emission constraints into long-term planning. The CPP is a final 10 Clean Air Act Sec. 169A(g)(1) in determining reasonable progress there shall be taken into consideration the costs of compliance, the time necessary for compliance, and the energy and non-air quality environmental impacts of compliance and the remaining useful life of any existing source 11 ADEQ Air Quality Division, Proposed Arizona State Implementation Plant Revision - Regional Haze 5-Year Progress Report, September Page - 74
75 2017 Integrated Resource Plan agency action and was promulgated under rules pursuant to the Clean Air Act. In addition, the CPP establishes ambitious goals for emission reductions. Therefore, TEP will evaluate compliance with the CPP for all portfolios studied in this IRP. CPP Overview The CPP establishes emission goals for two subcategories of power plants in the form of an emission rate (lbs./mwh) that declines over the period from 2022 to Those subcategories are: Fossil-fired steam electric generating units ( Steam EGUs ) - includes coal plants and oil and natural gas-fired steam boilers Natural gas-fired combined-cycle plants (NGCC) Then using these rates Subcategory Rates and the proportional generation from steam EGUs and NGCC plants in each state, the CPP derives state specific goals ( State Rates ). The CPP also converts these emission rate goals to total mass (i.e. short tons) goals for each state. Each state is required to develop a State Plan that will regulate the affected plants in their jurisdiction. TEP has effected plants in three separate jurisdictions, Arizona, New Mexico, and the Navajo Nation, and therefore, would be subject to three State Plans. Table 8 below shows the applicable rate goals. Table 8 CPP Rate Goals CO 2 Rate (lbs/mwh) Subcategorized Rate - Steam EGUs 1,671 1,500 1,308 1,305 Subcategorized Rate - NGCC State Rate - Arizona 1,263 1,149 1,074 1,031 State Rate - New Mexico 1,435 1,297 1,203 1,146 State Rate - Navajo Nation 1,671 1,500 1,380 1,305 There are three primary forms of the State Plan available to states (with sub-options): Rate Plants are required to meet an emission rate standard (lbs./mwh) equal to the plant s emissions divided by the sum of its generation and the generation from qualifying renewable energy projects and/or verified EE savings. A rate plan could be administered through the use of emission rate credits (ERCs), where sources with emissions above the standard generate negative ERCs when they operate, and sources with emissions below the standard (or no emissions) generate positive ERCs. At the end of a compliance period, each affected plant must have at least a zero balance of ERCs. Under the rate approach, states have the option of measuring compliance against the State Rate or the Subcategory Rates. Mass Plants are allocated (or otherwise acquire) allowances, the total of which equals the state s mass goal, and each plant must surrender an allowance for each ton of CO2 emitted during a compliance period. Owners of plants that do not have sufficient allowances can reduce emissions by curtailing production, re-dispatching to a lower Page - 75
76 Tucson Electric Power emission resource, or retiring the plant and re-distributing allowances to their remaining plants. State Measures Instead of regulating power plants directly, a state could implement policies that will have the effect of reducing emissions in their state such as building codes, renewable energy mandates or EE standards. Compliance is measured based on emissions from the affected plants. Arizona The State of Arizona was proactively planning for CPP compliance; however, planning activities were put on hold after the presidential election. Much of the planning was done with the assistance of a Technical Working Group, formed to evaluate technical aspects of the plan. The State of Arizona has previously stated it is committed to developing a State Plan, and in preparing for the initial plan submittal, ADEQ organized the options for the form of a State Plan into subsets of Rate or Mass, with the intent to focus on the most likely options. Navajo Nation In the proposed Federal Plan and Model Rules 13, EPA asked for comments on whether it was necessary or appropriate to regulate EGUs on the Navajo Nation under the CPP. EPA has not taken action on its proposal and it is uncertain when or if it will take final action. If the EPA determines that it is inappropriate or unnecessary to regulate EGUs on the Navajo Nation, then TEP will be relieved of any CPP requirements for the Navajo Generating Station and the Four Corners Power Plant. If EPA elects to proceed with regulating these EGUs under the CPP, it is likely that the Navajo Nation would adopt a mass-based approach to CPP compliance. Under a mass-based approach, the excess allowances associated with TEP s ownership share of the retirement of the Navajo at the end of 2019 would be sufficient to cover emissions associated with the remaining plant (Four Corners) through its planned retirement in New Mexico Rather than be subject to a Federal Plan, the State of New Mexico is likely to submit a State Plan SIP as well, believing that a New Mexico developed plan will provide the flexibility needed to minimize costs passed on to its residents. TEP assumes that New Mexico would also adopt a mass-based approach to CPP compliance. Under a mass-based approach, the excess allowances associated with TEP s ownership share of the retirement of the San Juan Unit 2 at the end of 2017, and the exit from Unit 1 in 2022 would be sufficient to cover emissions associated with the remaining New Mexico plant (Luna) well beyond the planning period. 13 Federal Plan Requirements for Greenhouse Gas Emissions for Electric Utility Generating Units Constructed on or Before January 8, 2014; Model Trading Rules; Amendments to Frame Regulations; Proposed Rule [80 FR 64966] dated October 23, Page - 76
 to conduct a modeling assessment of the relative compliance position compared to the State Rate and Mass goals based on a base case outlook.")
77 2017 Integrated Resource Plan Chart 15 ADEQ Regulatory Framework Options 14 PACE Global Arizona CPP Analysis To help evaluate the relative benefits of Rate versus Mass for Arizona, the Arizona utilities hired PACE Global ( PACE ) to conduct a modeling assessment of the relative compliance position compared to the State Rate and Mass goals based on a base case outlook. The results 15 of that assessment indicate that Arizona would likely fall short of the allowances needed to cover emissions using a mass approach. However, Arizona was able to meet the rate goals for the vast majority of the compliance period studied. A rate-based plan, in general, better accommodates the need to meet future load growth with existing plants, and the subcategory rate approach is generally considered better for resource portfolios with a high percentage of coal-fired generation. 14 Ibid, ADEQ EPA s Final Clean Power Plan: Overview, Steve Burr, AQD, SIP Section, September 1, More information can be found at ADEQ s website Page - 77

78 Tucson Electric Power Figure 12 PACE Global Arizona CPP Analysis Based on the PACE work, TEP believes that Arizona is most likely to adopt a subcategorized rate approach for CPP compliance, therefore, planning portfolios studied in this IRP will be evaluated for CPP compliance under a subcategorized rate approach. Page - 78
 with an adequate margin of safety.")
79 2017 Integrated Resource Plan National Ambient Air Quality Standards A core element of Clean Air Act is the establishment of National Ambient Air Quality Standards (NAAQS). NAAQS are levels of air pollution in the ambient air that are determined to be protective of the general public (including sensitive populations) with an adequate margin of safety. NAAQS have been established for six specific criteria pollutants (ozone, particulate matter, sulfur dioxides, nitrogen oxides, lead, and carbon monoxide). NAAQS have two components: primary standards to protect public health and secondary standards to protect public welfare and the environment. NAAQS are implemented through enforceable source specific emission limitations and other air quality regulations established by states via State Implementation Plans (SIPs). The SIPs detail each state s strategy to attain or maintain the NAAQS. The CAA requires EPA to review and, if appropriate, revise each NAAQS every five years. These revisions often result in more stringent standards, which may lead to further restrictions of emissions from power plants and other sources. In 2015 EPA revised the primary NAAQSs for ozone, lowering the standard to 70 parts per billion (ppb). Within one year following promulgation of a standard, States and Tribes are required to submit to EPA recommended boundary designations for the attainment status (i.e. attainment, nonattainment, unclassifiable) of areas within their jurisdictions. Arizona submitted its recommended boundary designations in September 2016, recommending that two distinct areas be designated as nonattainment. TEP has no operation near the Yuma nonattainment area. The Maricopa-Pinal-Gila nonattainment area is delineated on Figure 13 below. Figure 13 - Maricopa-Pinal-Gila Nonattainment Area Boundary Source: Enclosure 1, ADEQ s 2015 Ozone NAAQS Boundary Recommendations and Technical Support Document Page - 79
80 Tucson Electric Power The Gila River Generating Station is located just within the boundary of the Maricopa-Pinal-Gila nonattainment area and is, therefore, subject to nonattainment provisions of the Clean Air Act. Gila River Unit 3, partially owned by TEP, is equipped with SCR for control of NOx emissions, and therefore, is not expected to be subject to any further emission reductions due to the area s nonattainment status. However, any expansion or significant modifications to the facility would trigger the requirement to upgrade to Lowest Available Emission Reductions (LAER) standards and offset any increase in emissions at a ratio greater than 1:1. The Tucson metropolitan area was designated as in attainment per Arizona s recommendation to EPA, with a maximum monitored ambient air quality concentration of 69 ppb. Therefore, new sources, and modifications of existing sources, will not currently be subject to nonattainment provisions. Attainment status is monitored on an annual basis. If future monitoring data indicates that ambient air quality in the Tucson metropolitan area exceeds the ozone standard, Arizona would be required to revise its nonattainment boundary designation. Power Generation and Water Resources Water availability is a major issue for utilities operating power plants, or planning new resources in the Desert Southwest. For facilities already in operation, utilities need to be cognizant of water use and supply trends in the area immediately surrounding those facilities. While existing facilities have likely secured the legal rights to the water needed for operation, there can be a disconnect between the legal right to water and its physical availability. For this reason technologies and strategies to decrease power plant water use can become an important planning goal within the integrated resource planning process. Reducing power plant water use can be accomplished either through shifting to a lower water use generating resource or through increasing power plant water use efficiency. This section provides an overview of TEP s water use at its existing generating facilities and discusses our strategy to reduce overall water consumption. Chart 16 presents the historical annual water use associated with TEP s share of ownership for its steam electric and NGCC generating plants and the source of that water (i.e. surface water or groundwater). Chart 16 Average Annual Water Consumption by Station (TEP Share) 12,000 10,000 Surface Water Groundwater ACRE-FEET 8,000 6,000 4,000 2,000 - Four Corners Navajo San Juan Springerville Sundt Luna Gila River Page - 80

81 2017 Integrated Resource Plan Power Generation and Water Impacts of Resource Diversification TEP s resource diversification strategy replaces generation from higher water use coal-fired resources with a corresponding amount of generation from lower water use NGCC plants and zero-water use renewable resources. See Chart 17 below for average water consumption rates for various electricity generation technologies. Based on these water consumption rates, TEP s resource diversification will result in lower water consumption for power generation overall. Chart 17 Life Cycle Water Use for Power Generation 16 However, water consumption has a localized environmental impact as well. The availability of water that is withdrawn from surface waters, as in the case of the Navajo Generating Station (Lake Powell), the Four Corners Power Plant (Morgan Lake and the San Juan River), and the San Juan Generating Station (San Juan River), is highly dependent on precipitation and snow pack, as well as other uses. TEP s reference case portfolio calls for retirement of or exit from each of these facilities within the planning period, with the 16 Adapted from Meldrum et. al. Life cycle water use for electricity generation: a review and harmonization of literature estimates, published March 3, 2013, Page - 81
82 Tucson Electric Power majority occurring within the next six years, which significantly reduces and eventually eliminates any risk of water availability for power generation from surface waters. The availability of water that is withdrawn from groundwater aquifers, as in the case of Springerville, Sundt, Gila River, and Luna power plants, is dependent on the recharge to and other withdrawals from the aquifer, but is also a function of the hydrogeological characteristics of the aquifer itself. At Springerville, it is to TEP s advantage, by virtue of an agreement with a local Native American Tribe, to limit withdrawals of groundwater at the plant to 20,000 acre-feet annually. Therefore, there are water conservation measures in place at the plant, and TEP is exploring additional water conservation and reuse measures. The cooling towers for Units 1 and 2 operate at high cycles of concentration, up to 13 cycles before blowdown, which reduces the amount of water used per unit of energy generated. In addition, TEP recently hosted a pilot study at Springerville 17 to demonstrate a new technology for reducing wastewater discharges through vapor recompression, which also produces a distillate that could be recirculated back to the plant. Additional technologies are being considered for demonstration projects. Luna reduces groundwater withdrawals by supplementing the well water with treated municipal wastewater provided by the City of Deming, New Mexico. Luna is able to satisfy, on average, 12% of its total water demand from municipal wastewater. Gila River Generating Station is located west of Phoenix, Arizona (in proximity to the Palo Verde Nuclear Generating Station). In this area there is over 6,000 MW of existing NGCC capacity that is likely to see a significant increase in generation as utilities like TEP replace coal-fired generation with generation from NGCC plants. These facilities are too far apart to have a direct impact on each other in terms of groundwater availability; however, the expected increased water use as a result of increased generation needs to be evaluated. For the IRP, TEP will include for each portfolio the change in water consumption over the planning period. For the Reference Case Plan, the IRP will chart the annual amount of water consumed for power generation along with the source of the water (surface water or groundwater). Increasing water consumption within either of these source categories will be weighed as a risk factor for that portfolio. 17 Electric Power Research Institute (EPRI) in partnership with Tucson Electric Power, Salt River Project, and Tri-State Generation and Transmission, AVARA Wastewater Treatment Demonstration at Springerville Generating Station, final results pending. Page - 82


83 2017 Integrated Resource Plan CHAPTER 4 A New Integration Approach to Resource Planning With the increasing cost-competiveness of certain renewable resources, many resource planners are in the process of integrating higher levels of renewable technologies as a complement to their existing conventional generation fleet. While some renewable technologies have achieved notional grid parity under certain conditions, such comparisons do not take into account the cost of system integration. As a result, today s resource planning efforts are now focused on integrating new grid balancing technologies that will enable them to take advantage of higher levels of low cost, clean renewable energy. Historically, utility planners classified traditional generation resources into four categories based on their duty-cycle and their ability to serve load. These categories were referred to as base load, intermittent, load following and peaking. As part of the 2017 IRP, TEP takes a slightly different approach to categorizing the capabilities for each type of resource in order to better describe how these resources will play a role as the Company transforms its resource portfolio over the next decade. The four categories are described in more detail below: Figure 14 New Resource Categories to Meet Tomorrow Resource Needs Grid Balancing Resources Load Serving Conventional Resources Load Modifying Resources Load Serving Renewable Resources Page - 83
84 Tucson Electric Power Load Modifying Resources Load modifying resources includes EE, DG, and time of use tariffs, whose effects are primarily behind the meter and are therefore, largely, if not entirely beyond the view and control of the balancing authority. While both EE and DG resources reduce a customer s net consumption, solar PV grid systems can overgenerate during the day in hours when a customer s usage is less than the solar production output. Renewable Load Serving Resources Renewable load serving resources are comprised of both utility scale solar and wind technologies. Both grid scale solar photovoltaics and wind are currently the lowest cost resources from an energy only basis. As part of the Company s 2017 IRP, TEP plans to add approximately 800 MW of additional solar and wind resources to its generation portfolio over the next fifteen years. While utility scale solar and wind will give TEP the opportunity to develop a transformed portfolio of low-cost, zero-carbon resources, these technologies must be balanced within a portfolio of conventional load serving and grid balancing resources. Conventional Load Serving Resources Conventional load serving resources are comprised of coal, hydro, nuclear and natural gas technologies that are used to serve the vast majority of the energy dispatched to meet load. Grid Balancing Resources Grid balancing resources include natural gas combustion turbines, DR, natural gas reciprocating engines and storage technologies. These grid balancing resources will be used for peak shaving, energy arbitrage and can be used by the balancing authorities to maintain grid reliability. Page - 84
85 2017 Integrated Resource Plan Typical Summer Day Categorized by Resource Requirements Chart 18 details how load modifying, load serving, grid balancing resources would be utilized on typical summer day. Chart 18 Resource Requirements on Typical Summer Day 3,500 3,000 2,500 Demand, MW 2,000 1,500 1, Hour Ending Load Serving-Traditional Fossil Load Serving-Renewables Grid Balancing Load Modifying Total Firm Obligations Gross Load Before EE and DG Page - 85
86 Tucson Electric Power Typical Winter Day Categorized by Resource Requirements Chart 19 details how load modifying, load serving, grid balancing resources would be utilized on typical winter day. Chart 19 Resource Requirements on Typical Winter Day 2,500 2,000 1,500 Demand, MW 1, Hour Ending Load Serving-Traditional Fossil Load Serving-Renewables Grid Balancing Load Modifying Total Firm Obligations Gross Load Before EE and DG Page - 86
87 2017 Integrated Resource Plan Resources Matrix Table 9 provides a brief overview of the types of resources that were evaluated in the resource planning process within the 2017 IRP. Each technology is described by category, type, carbon profile, state of technology, primary use and whether it can be dispatched upon demand. Table 9 - Resource Matrix Category Type Zero Carbon Production State of Technology Primary Use Dispatchable by Balancing Authority Load Modifying Resources Load Serving Renewable Resources Load Serving Conventional Resources Grid Balancing Resources Energy Efficiency Yes Mature Distributed Generation Yes Mature Rate Design (1) Mature Wind Yes Mature Solar Yes Mature Natural Gas Combined Cycle No Mature Pulverized Coal No Mature Small Modular Nuclear (SMR) Reciprocating Engines Combustion Turbines Pumped Hydro Storage Yes No No Emerging Mature Mature (1) Mature Demand Response Yes Mature Battery Storage (1) Emerging Base Load Reduction Intermediate Load Reduction Targeted Load Usage / Reductions Intermediate Generation Intermediate Generation Base Load Generation Base Load Generation Base Load Generation 5-10 Minute Ramping Minute Ramping 1 Minute Ramping 1 Minute Ramping 1 Second Ramping No No No No No Yes Yes Yes Yes Yes Yes Yes Yes (1) Carbon intensity is dependent upon the resources that would be displaced by this rate tariff or storage technology net of charging. Resource Benchmarking Utility resource planning is performed using a wide spectrum of tools and methodologies. Prior to running any detailed simulation models, the resource planning team reviewed sources of information from thirdparties and consultants to develop up-to-date cost parameters for the varying resource technologies. In addition, information gathered through our on-going competitive bidding processes and request for proposal solicitations was also used to derive cost estimates for new build resources and wholesale market alternatives. Page - 87
88 Tucson Electric Power Source Data Below is a list of sources that TEP relied on to compile cost input assumptions for traditional supply-side, demand-side and renewable resources modeled in the 2017 IRP: PACE Global Pace Global Future States of the World - Integrated Resource Planning Scenarios (December 2016) See Appendix A Burns and McDonnell 2017 Flexible Generation Technology Assessment (March 2017) See Appendix B U.S. Energy Information Administration Annual Energy Outlook 2017 (August 2016) National Renewable Energy Laboratory Renewable Electricity Futures Study (2016) Sunshot Initiative Lazard Levelized Cost of Energy Analysis 10.0 (December 2016) Lazard and Enovation Partners Levelized Cost of Storage Analysis 2.0 (December 2016) Page - 88
89 2017 Integrated Resource Plan Lazard s Levelized Cost of Energy Analysis Overview on Conventional and Alternative Energy Technologies The following analysis was published as part of Lazard s Levelized Cost of Energy (LCOE) Analysis. 18 This 2016 report compares the various conventional and alternative energy technologies. Certain alternative energy technologies such as wind and utility-scale solar continue to become more costcompetitive with conventional generation technologies in some applications, despite large decreases in the cost of natural gas. Lazard s analysis does not take into account potential social and environmental externalities or reliability- or intermittency-related considerations. Despite a sharp drop in the price of natural gas, the cost of all forms of utility-scale solar PV and utility-scale wind technologies continue to remain competitive with conventional generation technologies as illustrated by recent public announcements of bids submitted by renewable energy providers in open power procurement processes. Currently, rooftop solar PV is not cost competitive without significant subsidies, due, in part, to the smallscale nature and added complexity of rooftop installations. However, the LCOE of rooftop solar PV is expected to decline in coming years, partially as a result of more efficient installation techniques, lower costs of capital and improved supply chains. Importantly, Lazard excludes from their analysis the value associated with certain uses of rooftop solar PV by sophisticated commercial and industrial users such as demand charge management, which appears increasingly compelling to certain large energy customers. The pronounced cost decrease in certain renewable energy technologies, combined with the needs of an aging and changing power grid in the U.S., has significantly increased demand for energy storage technologies to fulfill a variety of electric system needs. Industry participants expect this increased demand to drive significant cost declines in energy storage technologies over the next five years. Increased availability of lower-cost energy storage will likely facilitate greater deployment of renewable energy technologies. Energy storage applications and costs are discussed below. 18 Lazard is a preeminent financial advisory and asset management firm. More information can be found at Lazard s Levelized Cost Of Energy Analysis 10.0 can be found at Page - 89
90 Tucson Electric Power Lazard s Levelized Cost of Storage Analysis Overview on Energy Storage Technologies The follow analysis was published as part of Lazard s Levelized Cost of Storage (LCOS) Analysis. 19 This 2016 report compares the various energy storage technologies by cost and use. Energy storage has a variety of uses with very different requirements, ranging from large-scale, power grid-oriented uses to small-scale, consumer-oriented uses. Lazard s analysis identifies a number of use cases and assigns detailed operational parameters to each. This approach enables meaningful comparisons of storage technologies across a number of use cases. Cost Competitive Storage Technologies Select energy storage technologies are cost-competitive with certain conventional alternatives in a number of specialized power grid uses, but none are cost-competitive yet for the transformational scenarios envisioned by renewable energy advocates. Although energy storage technology has created a great deal of excitement regarding transformational scenarios such as consumers and businesses going off the grid or the conversion of renewable energy sources to baseload generation, it is not currently cost competitive in most applications. However, some uses of select energy storage technologies are currently attractive relative to conventional alternatives; these uses relate primarily to managing frequency regulation and transmission investment deferral. Today, energy storage appears most economically viable compared to conventional alternatives in use cases that require relatively greater power capacity and flexibility as opposed to energy density or duration. These use cases include frequency regulation and to a lesser degree transmission and distribution investment deferral, demand charge management and micro grid applications. This finding illustrates the relative expense of incremental system duration as opposed to system power. Put simply, battery life is more difficult and costly to increase than battery size. This is likely why the potentially transformational use cases such as full grid defection are not currently economically attractive they require relatively greater energy density and duration, as opposed to power capacity. The Lazard study finds a wide variation in energy storage costs, even within use cases. This dispersion of costs reflects the immaturity of the energy storage industry in the context of power grid applications. There is relatively limited competition and a mix of experimental and more commercially mature technologies competing at the use case level. 19 Lazard s Levelized Cost Of Storage Analysis 1.0 can be found at Lazard s Levelized Cost Of Storage Analysis 2.0 can be found at Page - 90
91 2017 Integrated Resource Plan Future Energy Storage Cost Decreases Industry participants expect costs to decrease significantly in the next five years, driven by the increasing use of renewable energy generation, government policies promoting energy storage and the needs of an aging and changing power grid. Industry participants expect increased demand for energy storage to result in enhanced manufacturing scale and ability. The economies of scale created will drive cost declines and establish a production cost cycle in which energy storage cost declines facilitate wider deployment of renewable energy technology. The result will create more demand for storage and spurring further innovation in storage technology. Cost declines projected by industry participants vary widely between storage technologies lithium is expected to experience the greatest five year battery capital cost decline (~50%), while flow batteries and lead are expected to experience five year battery capital cost declines of ~40% and ~25%, respectively. Lead is expected to experience 5% five year cost decline, reflecting the fact that it is not currently commercially deployed. The majority of near- to intermediate- cost declines are expected to occur as a result of manufacturing and engineering improvements in batteries, rather than in balance of system costs. Therefore, use case and technology combinations that are primarily battery-oriented and involve relatively smaller balance of system costs are likely to experience more rapid levelized cost declines. As a result, some of the most expensive use cases today are most levered to rapidly decreasing battery capital costs. If industry projections materialize, some energy storage technologies may be positioned to displace a significant portion of future gas-fired generation capacity, in particular as a replacement for peaking gas turbine facilities, enabling further integration of renewable generation. Page - 91
92 Tucson Electric Power 2017 Integrated Resource Plan Levelized Cost Comparisons The calculation of the levelized cost of energy provides a common measure to compare the cost of energy across different demand and supply-side technologies. The LCOE takes into account the installed system price and associated costs such as capital, operation and maintenance, fuel, transmission, tax incentives and converts them into a common cost metric of dollars per megawatt hour. The calculation for the LCOE is the net present value of total costs of the project divided by the quantity of energy produced over the system life. Because intermittent technologies such as renewables do not provide the same contribution to system reliability as technologies that are operator controlled and dispatched, they require additional system investment for system regulation and backup capacity. As with any projection, there is uncertainty about all of these factors and their values can vary regionally and across time as technologies evolve and fuel prices change. Further resource utilization is dependent on many factors; the portfolio mix, regional market prices, customer demand and must-run requirements are some considerations outside of LCOE. LCOE Assumptions All Resources All LCOE costs are in 2017 dollars. Future year costs will be based on year project is installed which will incorporate inflation and technology innovation assumptions. Analysis excludes integration costs (e.g., grid and conventional generation investment to overcome system intermittency) for intermittent technologies. Analysis does not include any decommissioning costs. Page - 92
93 2017 Integrated Resource Plan 2017 Levelized Cost of All Resources Chart 20 below provides a comparison on the levelized costs of all resources used in the 2017 IRP. All costs reflect the 2017 LCOE $/MWh. Chart 20 - Levelized Costs of All Resources $600 Fuel Capital Property Tax & Insurance Fixed O&M Variable O&M $500 $503 $400 $300 $200 $100 $257 $192 $157 $130 $104 $105 $44 $51 $53 $65 $68 $77 $- $15 Energy Efficiency Solar PV - Tracking Solar PV - Fixed Tilt Wind Resources Natural Gas Combined Cycle (NGCC) Solar PV - Commercial and Industrial Natural Gas Combined Cycle (NGCC) Small Modular Nuclear Solar PV - Residential Reciprocating Engines (RICE) Combustion Turbine (Large Frame Class) Combustion Turbine (Small Frame Class) Battery Storage (Lithium) Demand Response 2017 LCOE $/MWh Page - 93
94 Tucson Electric Power Load Modifying Resources Cost Assumptions Table 10 includes the load modifying resource costs for the 2017 Integrated Resource Plan. Table 10 Load Modifying Resources Cost Assumptions Energy Efficiency Solar PV Residential Solar PV Commercial and Industrial Rate Design Customer Efficiency Programs Residential DG Programs Commercial & Industrial DG Programs Targeted Load Usage / Reductions By Time of Use Energy Efficiency Solar PV Residential Solar PV Commercial and Industrial Rate Design Based on Various Customer Demand Side Programs Based on Various Residential DG Programs Based on Various Commercial & Industrial DG Programs Based on Various Rate Tariff by Customer Class $15 $105 $68 Depends of Tariff Page - 94
95 2017 Integrated Resource Plan Chart 21 - Load Modifying Resources Cost Assumptions 2017 $/MWh $105 $ $15 Energy Efficiency Solar PV - Residential Solar PV - Commercial and Industrial Capital or Program Cost LCOE Assumptions for Load Modifying Resources Energy efficiency based on TEP s projected program costs based on the average lifetime of the programs. Solar PV Residential based on Lazard s LCOE Analysis Version 10. Solar PV Commercial & Industrial based on Lazard s LCOE Analysis Version 10. Page - 95
96 Tucson Electric Power Renewable Load Serving Resources Cost Assumptions Table 11 includes the load serving renewable resource costs for the 2017 Integrated Resource Plan. Table 11 Renewable Load Serving Resources Cost Assumptions Plant Construction Costs Units Solar Thermal No Storage Solar Thermal Ten Hour Storage Solar PV Fixed Tilt Solar PV Tracking Wind Resources Project Lead Time Years Installation Years First Year Peak Capacity, MW MW Plant Construction Cost 2017 $/kw $6,500 $10,300 $1,300 $1,450 $1,475 Resource Life Years Operating Characteristics Units Solar Thermal No Storage Solar Thermal Ten Hour Storage Solar PV Fixed Tilt Solar PV Tracking Wind Resources Fixed O&M 2017 $/kw $66.30 $81.60 $9.18 $12.24 $40.80 Variable O&M 2017 $/MWh $0.00 $0.00 $0.00 $0.00 $0.00 ITC Percent 30% 30% 30% 30% - PTC $/MWh $18.40 Annual Capacity Factor Annual % 28% 52% 23% 30% 33% Annual Output GWh Net Coincident Peak NCP% 100% 34% 34% 65% 23% Water Usage Gal/MWh Levelized Cost of Energy $/MWh $228 $179 $51 $44 $53 Page - 96
97 2017 Integrated Resource Plan Chart 22 - Renewable Load Serving Resources Cost Assumptions $60 $50 $51 $44 $53 $ $/MWh $30 $20 $10 $0 Solar PV - Fixed Tilt Solar PV - Tracking Wind Resources Capital Property Tax & Insurance Fixed O&M Variable O&M LCOE Assumptions for Load Serving Resources Renewables ITC and PTC shown are for 2017 in service dates (commence construction prior to 12/31/16). Solar resources assume high solar insulation for projects sited in the Desert Southwest. Wind resources assume no ITC. PTC reflects $23/MWh escalated at 1.5% for a term of 10 years. Capacity factors reflect projects sited in Eastern Arizona or Western New Mexico. Transmission wheeling costs are not reflected in cost of delivery for both solar and wind projects. Page - 97
98 Tucson Electric Power Conventional Load Serving Resources Cost Assumptions Table 12 includes the load serving conventional resource cost assumptions for the 2017 Integrated Resource Plan. Table 12 - Conventional Load Serving Resources Cost Assumptions Plant Construction Costs Units Baseload NGCC Intermediate NGCC Small Modular Nuclear (SMR) Project Lead Time Years Installation Years First Year Available Peak Capacity, MW MW Plant Construction Cost 2017 $/kw $1,100 $1,100 $5,100 Resource Life Years Operating Characteristics Units Baseload NGCC Intermediate NGCC Small Modular Nuclear (SMR) Fixed O&M 2017 $/kw $33.97 $33.97 $ Variable O&M 2017 $/MWh $2.04 $2.04 $3.06 Gas Transportation 2017 $/kw $16.80 $ Heat Rate Btu/kWh 7,400 7,400 9,500 Annual Capacity Factor Annual % 75% 50% 95% Expected Annual Output GWh , ,161.0 Fuel Source Fuel Source Natural Gas Natural Gas Uranium Unit Fuel Cost $/mmbtu $5.04 $5.04 $0.90 Net Coincident Peak NCP% 100% 100% 100% Water Usage Gal/MWh Levelized Cost of Energy $/MWh $65 $77 $104 Page - 98
99 2017 Integrated Resource Plan Chart 23 Conventional Load Serving Resources 2017 LCOE $/MWh 2017 $/MWh $120 $100 $80 $60 $40 $20 $104 $65 $77 $0 Small Modular Nuclear Base Load NGCC Intermediate NGCC Fuel Capital Property Tax & Insurance Fixed O&M Variable O&M LCOE Assumptions for Load Serving Resources Conventional Natural gas prices are based on PACE Global s Base Case (Clean Power Plan) Scenario that assumes prices will average $5.04/mmBtu from 2017 through Conventional resources do not include any decommissioning costs. Page - 99
100 Tucson Electric Power Grid Balancing Resources Cost Assumptions Table 13 includes the grid balancing resource cost assumptions for the 2017 Integrated Resource Plan. Table 13 Grid Balancing Resources Cost Assumptions Plant Construction Costs Units Combustion Turbine (Aeroderivative) Combustion Turbine (Small Frame Class) Combustion Turbine (Large Frame Class) Reciprocating Engines (RICE) Battery Storage (Lithium) Project Lead Time Years Installation Years Year Available Peak Capacity, MW MW Construction Cost 2017 $/kw $1,300 $800 $650 $1,200 $2,568 Resource Life Years Operating Characteristics Units Combustion Turbine (Aeroderivative) Combustion Turbine (Small Frame Class) Combustion Turbine (Large Frame Class) Reciprocating Engines (RICE) Battery Storage Fixed O&M 2017 $/kw $29.89 $30.65 $28.05 $12.24 $9.18 Variable O&M 2017 $/MWh $3.57 $3.83 $3.57 $4.59 $37.35 Gas Transportation 2017 $/kw $16.80 $16.80 $16.80 $ Heat Rate Btu/kWh 9,800 10,500 9,900 8,000 - Capacity Factor Annual % 15% 8% 12% 20% 16% Annual Output GWh Fuel Source Fuel Source Natural Gas Natural Gas Natural Gas Natural Gas System Unit Fuel Cost $/mmbtu $5.04 $5.04 $5.04 $ Net Coincident Peak NCP% 100% 100% 100% 100% 100% Water Usage Gal/MWh System Demand Response Customer Load Control Programs Demand Response Based on Various Direct Load Control Programs Levelized Cost of Energy $/MWh $192 $239 $157 $130 $257 $503 Page - 100
101 2017 Integrated Resource Plan Chart 24 Grid Balancing Resources Cost Assumptions $600 $500 $503 $ $/MWh $300 $200 $100 $257 $192 $157 $130 $0 Demand Response Battery Storage (Lithium) Combustion Turbine (Small Frame Class) Combustion Turbine (Large Frame Class) Reciprocating Engines (RICE) Fuel Capital Property Tax & Insurance Fixed O&M Variable O&M LCOE Assumptions for Grid Balancing Resources Natural gas prices are based on PACE Global s Base Case (Clean Power Plan) Scenario that assumes prices will average $5.04/mmBtu. Reciprocating engines are assumed to be dispatch with natural gas at a 20% capacity factor based on TEP s resource portfolio with emphasis on supporting the integration of renewable resources. Assumes replacement cost of 65% of initial capital after 25,000 hours of operation. DLC costs are based on average estimated program cost of third-party load aggregators. Annual capacity factors based on limited customer interruptability. These programs assume a limit of 30 interruptible events dispatched over 6 hours totaling 180 hours per year (or 2% capacity factor). Page - 101
102 Tucson Electric Power Renewable Electricity Production Tax Credit (PTC) The federal renewable electricity production tax credit is an inflation-adjusted per-kilowatt-hour (kwh) tax credit for electricity generated by qualified energy resources and sold by the taxpayer to an unrelated person during the taxable year. The duration of the credit is 10 years after the date the facility is placed in service for all facilities. In December 2015, the Consolidated Appropriations Act extended the expiration date for the production tax credit to December 31, 2019, for wind facilities commencing construction with a phase-down beginning for wind projects commencing construction after December 31, The Act extended the tax credit for other eligible renewable energy technologies commencing construction through December 31, The Act applies retroactively to January 1, The tax credit amount is adjusted for inflation by multiplying the tax credit amount by the inflation adjustment factor for the calendar year in which the sale occurs, rounded to the nearest 0.1 cents. The Internal Revenue Service (IRS) publishes the inflation adjustment factor no later than April 1 each year in the Federal Registrar. For 2015, the inflation adjustment factor used by the IRS is Applying the inflation-adjustment factor for the 2014 calendar year, as published in the IRS Notice , the production tax credit amount is as follows: $0.023/kWh for wind, closed-loop biomass, and geothermal energy resources $0.012/kWh for open-loop biomass, landfill gas, municipal solid waste, qualified hydroelectric, and marine and hydrokinetic energy resources. The tax credit is phased down for wind facilities and expires for other technologies commencing construction after December 31, The phase-down for wind facilities is described as a percentage reduction in the tax credit amount described above: Table 14 Production Tax Credit Phase Down Construction Year (1) PTC Reduction 2017 PTC amount is reduced by 20% 2018 PTC amount is reduced by 40% 2019 PTC amount is reduced by 60% (1) For wind facilities commencing construction in year. Note that the exact amount of the production tax credit for the tax years will depend on the inflation-adjustment factor used by the IRS in the respective tax years. The duration of the credit is 10 years after the date the facility is placed in service. See for more details. Page - 102
103 2017 Integrated Resource Plan Energy Investment Tax Credit (ITC) The Consolidated Appropriations Act, signed in December 2015, included several amendments to the federal Business Energy Investment Tax Credit which apply to solar technologies and other PTC eligible technologies. Notably, the expiration date for these technologies was extended, with a gradual step down of the credits between 2019 and The ITC has been amended a number of times, most recently in December The table below shows the value of the investment tax credit for each technology by year. The expiration date for solar technologies and wind is based on when construction begins. For all other technologies, the expiration date is based on when the system is placed in service (fully installed and being used for its intended purpose). Table 15 Investment Tax Credits by Year and Technology Technology Future Years PV, Solar Water Heating, Solar Space Heating/Cooling, Solar Process Heat Geothermal Electric Large Wind 30% 30% 30% 26% 22% 10% 10% 10% 10% 10% 10% 10% 10% 10% 24% 18% 12% Solar Technologies Eligible solar energy property includes equipment that uses solar energy to generate electricity, to heat or cool (or provide hot water for use in) a structure, or to provide solar process heat. Hybrid solar lighting systems, which use solar energy to illuminate the inside of a structure using fiber-optic distributed sunlight, are eligible. Passive solar systems and solar pool-heating systems are not eligible. See for more details. Page - 103
104 Tucson Electric Power Impacts of Declining Tax Credits and Technology Installed Costs Chart 25 and Chart 26 shown below reflect the near-term capacity price declines on a $/kw basis from associated with the reduction in the installed costs of solar technologies relative to the levelized cost realized on a $/MWh assuming different levels of investment tax credits by year. The solar ITC assumptions are based on the federal investment tax credit assumptions shown in Table 15 above. Chart 25 Solar PV Fixed, Impacts of Declining Tax Credits and Technology Installed Costs Solar - Fixed PV $1,320 $52.0 Installed Cost, $/kw $1,300 $1,280 $1,260 $1,240 $1,220 $1,200 $51.5 $51.0 $50.5 $50.0 $49.5 $49.0 $48.5 $48.0 LCOE, $/MWh $1, $47.5 LCOE, $/MWh Installed Cost, $/kw Chart 26 Solar SAT, Impacts of Declining Tax Credits and Technology Installed Costs $1,460 Solar - Single Axis Tracking (SAT) $45.0 $1,440 $44.5 Installed Cost, $/kw $1,420 $1,400 $1,380 $1,360 $44.0 $43.5 $43.0 $42.5 $42.0 LCOE, $/MWh $1,340 $41.5 $1, $41.0 LCOE, $/MWh Installed Cost, $/kw Page - 104
105 2017 Integrated Resource Plan Impacts of Declining PTC and Technology Installed Costs Chart 27 shown below reflects the near-term capacity price declines on a $/kw basis from associated with the reduction in the installed costs of wind resources relative to the levelized cost realized on a $/MWh assuming different levels of production tax credits by year. The wind PTC assumptions are based on the federal production tax credit assumptions shown in Table 14 above. Chart 27 Wind, Impacts of Declining Production Tax Credits and Technology Price Installed Costs Wind Resources Installed Cost, $/kw $1,540 $1,530 $1,520 $1,510 $1,500 $1,490 $1,480 $1,470 $53 $59 $65 $77 $78 $79 $79 $90 $80 $70 $60 $50 $40 $30 $20 LCOE, $/MWh $1,460 $10 $1, $0 LCOE, $/MWh Installed Cost, $/kw Page - 105
106
107 2017 Integrated Resource Plan LOAD MODIFYING RESOURCES CHAPTER 5 Energy Efficiency TEP recognizes energy efficiency (EE) and demand response (DR) as cost-effective ways to reduce our reliance on fossil fuels. TEP offers a variety of energy saving options for customers encouraging both homeowners and businesses to invest in EE upgrades through Demand Side Management (DSM) incentivized programs. TEP has made great strides towards achieving the goals set by Arizona's EE Standard. The EE Standard calls on investor-owned electric utilities in Arizona to increase the kilowatt-hour savings realized through customer ratepayer-funded EE programs each year until the cumulative reduction in energy achieved through these programs reaches 22 percent of the previous year s retail sales by The EE section presents a detailed overview of the proposed electric DSM programs targeted at the residential, commercial and industrial (C&I), and utility improvement sectors, as well as their associated proposed implementation costs, savings, and benefit-cost ratios. TEP, with input from other parties such as Navigant Consulting, Inc. ( Navigant ), Residential Utility Consumer Office (RUCO) and the Southwest Energy Efficiency Project (SWEEP), has designed a comprehensive portfolio of programs to deliver electric energy and demand savings to meet annual DSM energy savings goals outlined in the EE Standard. These programs include incentives, direct-install and buydown approaches for energy efficient products and services; educational and marketing approaches to raise awareness and modify behaviors; and partnerships with contractors to obtain the most cost-effective return on the rate-payer dollars invested in DSM programs Implementation Plan, Goals, and Objectives TEP s high-level EE-related goals and objectives are as follows: Implement only cost-effective EE programs. Design and implement a diverse group of programs that provide opportunities for all customers to participate in. Achieve energy savings goals set in the EE Standard through When feasible, maximize opportunities for program coordination with other efficiency programs (e.g. Southwest Gas Corporation, Arizona Public Service Corporation) to yield maximum benefits. Maximize program savings at a minimum cost to the rate payer through comprehensive and costeffective programs. Page - 107
108 Tucson Electric Power Provide TEP customers and contractors with direct web access to detailed information on all efficiency programs (residential and commercial) for electricity savings opportunities at Expand the EE infrastructure in the state by increasing the number of available qualified contractors through training and certification in specific fields. Use trained and qualified trade allies such as electricians, HVAC contractors, builders, manufacturers, architects, and engineers to transform the market for efficient technologies. Inform and educate customers to modify behaviors that enable them to use energy more efficiently. Planning Process TEP s portfolio of programs incorporates elements of the most successful EE programs across North America. Programs are designed in consideration of the Tucson market and provide cost-effective programs for TEP customers. A substantial amount of information including evaluations, program plans and studies were used to develop specific programs for TEP. With input from Navigant, RUCO and SWEEP, TEP also used a benchmarking process to review the most successful EE programs from across the country, with a focus on successful Desert Southwest programs to help shape the portfolio. TEP used the following strategies to produce the lowest cost portfolio of EE programs: Implementing primarily industry accepted programs that have been successfully applied by other utilities in the Southwest and across the country. Implementing programs through a combination of third-party contractors and TEP staff. TEP utilizes implementation contractors where they provide particular industry expertise and/or tools. Program Screening TEP uses rigorous models to evaluate the costs, benefits, and risks of EE and DSM programs and measures. These models are designed to estimate the capacity and energy values of EE and DR measures at an hourly level. By examining projected program performance and cost effectiveness over a wide variety of weather and cost conditions, TEP is able to measure the risks and benefits of employing EE and DSM measures versus traditional generation capacity additions, and further, to ensure that DSM resources are compared to supply side resources relatively. The analysis of EE and DSM cost-effectiveness has traditionally focused primarily on the calculation of specific metrics, often referred to as the Societal Cost Test (SCT). As detailed in Table 16 - Comparative Benefit-Cost Tests, there are five major benefit-cost tests commonly utilized in the EE industry, each of which addresses different perspectives. The EE Standard established that the societal cost test should be used as the key perspective for determining the cost-effectiveness of EE measures and programs. Regardless of which perspective is used, benefit-cost ratios greater than or equal to 1.0 are considered cost-effective. While various perspectives are often referred to as tests, the following list of criteria demonstrates that decisions on program development go beyond a pass/fail test. Page - 108
109 2017 Integrated Resource Plan Table 16 - Comparative Benefit-Cost Tests SOCIETAL COST TEST BENEFITS TOTAL RESOURCE COST TEST UTILITY RESOURCE COST TEST PARTICIPANT COST TEST RATE IMPACT MEASURE TEST Reduction in Customer's Utility Bill Incentive Paid by Utility Any Tax Credit Received Avoided Supply Costs Avoided Participant Costs Participant Payment to Utility External Benefits COSTS Utility Administration Costs Participant Costs Incentive Costs External Costs Lost Revenues Utility Resource Cost Test The Utility Resource Cost Test (UCT), also referred to as the Program Administrator Test (PAT), measures the net benefits of a DSM program as a resource option based on the costs and benefits incurred by the utility (including incentive costs) and excluding any net costs incurred by the customer participating in the efficiency program. The benefits are the avoided supply costs of energy and demand, the reduction in transmission, distribution, generation and capacity valued at marginal costs for the periods when there is a load reduction. The costs are the program costs incurred by the utility, the incentives paid to the customers, and the increased supply costs for the periods in which load is increased. Total Resource Cost The Total Resource Cost (TRC) is a test that measures the total net resource expenditures of a DSM program from the point of view of the utility and its ratepayers. Resource costs include changes in supply and participant costs. A DSM program that passes the TRC test (i.e., has a ratio greater than 1) is viewed as beneficial to the utility and its customers because the savings in electric costs exceed the DSM costs incurred by the utility and its customers. Participant Cost Test The Participant Cost Test (PCT) illustrates the relative magnitude of net benefits that go to participants compared with the net benefits achieved from other perspectives. The benefits derived from this test reflect reductions in a customer s bill and energy costs plus any incentives received from the utility or third parties, Page - 109
110 Tucson Electric Power and any tax credit. Savings are based on gross revenues. Costs are based on out-of-pocket expenses from participating in a program, plus any increases in the customer s utility bills. Rate Impact Measure Test The Rate Impact Measure (RIM) Test measures the change in utility energy rates resulting from changes in revenues and operating costs. Higher RIM test scores indicate there will be less impact on increasing energy rates. While the RIM results provide a guide as to which technology has more impact on rates, generally it is not considered a pass/fail test. Instead, the amount of rate impact is usually considered at a policy level. The policy level decision is whether the entire portfolio s impact on rates is so detrimental that some net benefits have to be forgone. Societal Cost Test The SCT is similar to the TRC test, but it is also intended to account for the effects of externalities (such as reductions in CO2, nitrogen oxides NOx, and sulfur dioxide SO2. One additional difference between the TRC and the SCT is that the SCT uses a societal discount rate in its analysis. The SCT is the regulated benefit/cost analysis required in the EE Standard. TEP has provided a SCT that accounts for the societal discount rate. Current Energy Efficiency and DSM Programs TEP s 2016 Energy Efficiency Plan was filed on June 1 st, 2015, in accordance with Section R of the EE Standard, for approval of EE and DSM programs with the ACC (Docket No. E-01933A ). TEP received the final order for approval for these programs from the ACC in Decision No on February 11, 2016 augmenting Decision No (December 31, 2014). TEP has requested that the ACC continue the implementation plan approved in Decision No to program year TEP uses EE programs to efficiently and cost-effectively alter customer energy demand and consumption and reduce the long-term supply costs for energy and peak demand. TEP s portfolio of programs is divided into residential, commercial, behavioral, support, and utility improvement sectors with administrative functions providing support across all program areas. These programs can vary greatly in their dispatch characteristics, size and duration of load response, certainty of load response, and level and frequency of customer participation. In general, programs are offered in two primary categories, 1) EE programs that reduce energy consumption, and 2) DR programs that reduce peak demand. Table 17 below lists the Commission-approved EE and DR programs currently in the TEP portfolio. Details of these programs can be found in the 2016 Energy Efficiency Plan Page - 110
111 2017 Integrated Resource Plan Table 17 - Current Energy Efficiency Programs Appliance Recycling Efficient Products Existing Homes Residential Sector Low Income Weatherization Multi-Family Homes Residential New Construction Shade Trees Behavioral Sector Behavioral Comprehensive Home Energy Reports Bid for Efficiency Combined Heat & Power C&I Comprehensive Commercial & Industrial Sector Commercial New Construction Commercial Schools Retro-Commissioning Small Business Direct Install Support Sector Consumer Education and Outreach Energy Codes and Standards C&I Direct Load Control Utility Improvement Sector Conservation Voltage Reduction Generation Improvement and Facilities Upgrade Page - 111


112 Tucson Electric Power Chart 28 shows the actual segmentation of energy savings across sectors as a result from the 2016 implementation. Chart DSM Portfolio Composition by Sector 12% 7% 34% 47% Behavoiral Commercial Residential Utility Improvement Resource Planning Integration DSM Forecasting Consistent with the ACC s Decision No on Resources Planning, TEP forecasted cumulative energy savings for TEP s DSM portfolio over a 15-year time period from including meeting Arizona s EE Standard, which concludes in TEP prepared a monthly energy and peak reduction forecasts for all years in the IRP planning period. The savings were distributed based on the actual hourly shape of all historical measures installed from 2011 through 2015 and are carried forward for the planning period. Cost dispatch modeling using this shape will approximate the impacts of EE savings on the actual system load. In addition, TEP prepared an hourly savings distribution based on the impacts of EE in 2015 and compared EE savings distribution to the shape distribution of the actual TEP system load for In order to integrate the hourly savings impact of TEP s portfolio of DSM programs into 15-year planning horizon, TEP determined the hourly savings of each individual EE measures and then aggregated them at the portfolio-level by customer rate class. The hourly savings resolution can be summed into monthly energy and used to find peak demand savings. TEP considered several available resources and options for determining EE measure hourly level savings data. One option was to conduct long-term end-use metering and analysis for the measures installed at Page - 112
113 2017 Integrated Resource Plan customers premises, which would be multi-year projects and very costly. Another option was to utilize data made available from national and other state-level funded multi-year studies and research that incorporated best practices for determining hourly level measure savings. TEP found this latter option to be more prudent given the time sensitivity and expense. TEP relied upon 8,760 hourly savings load shapes taken from widely referenced and recognized industry sources for individual EE measures that comprised each particular DSM program. These sources include: California s Database for Energy Efficient Resources (DEER), which is developed by the California Public Utilities Commission California s Commercial End-Use Survey (CEUS), which was prepared by Itron, Inc. for the California Energy Commission in cooperation with California s investor-owned utilities (i.e., Pacific Gas and Electric, San Diego Gas and Electric, Southern California Edison, Southern California Gas Company), and the Sacramento Municipal Utilities District Building America National Residential Efficiency Measures Database, which is developed by the National Renewable Energy Laboratory (NREL) with support from the U.S. Department of Energy (DOE) These load shapes were developed through extensive building end-use metering and energy simulation modeling and were normalized for historical weather conditions and patterns applicable to particular climate regions. The load shapes selected from these sources address the residential and non-residential sectors separately with different building end-uses that relate to the EE measures in the programs. TEP selected the load shapes carefully to account for seasonal or diurnal variations in operational or end-use patterns for different measures. TEP utilized the California-based DEER and CEUS load shapes only as a means to develop 8,760 hourly shaping on the EE measures. The annual savings values that will be attributed to these hourly savings load shape are calculated specifically for TEP s programs through program design and third-party Measurement, Evaluation, and Research (MER). Since the weather-sensitive EE measure load shapes from DEER and CEUS were developed for California, TEP had to apply adjustment factors for its service territory in Arizona. First, for weather calibration purposes, TEP utilized typical meteorological year (TMY3) weather data for Tucson, Arizona and compared that to the load shapes developed for California s Climate Zone 15, which is the closest geographically as well as the most compatible weather region in California to TEP s service territory, and then adjusted hourly indexed values as needed. This approach of weather calibration ensures that weather-sensitive EE measures that have seasonal or diurnal variations in energy savings would have the appropriate effect for TEP s climate region. Furthermore, the TMY3 weather data sets, which were developed by NREL with support from DOE, are based on climate data from a period from Utilizing recent historical weather data helps to weather normalize the savings effects of weather-sensitive EE measures at the hourly level. The Building America database included measure savings load shapes developed utilizing TMY3 weather data for Tucson; therefore, no such weather adjustments were needed for these load shapes. After determining the measure shapes, TEP applied a measure s annual energy savings value with the appropriate measure end-use load shape to determine a unique measure-specific savings load shape. TEP was then able to aggregate the hourly savings value for all given measures in a particular program to determine a program-level savings load shape. From these composite program-level savings load shape, TEP was able to apply its definition of peak periods to determine coincident and non-coincident peak demand savings. Page - 113
114 Tucson Electric Power While the focus of this IRP is on future resources planning, TEP also acknowledges the importance of attributing verified savings values for individual measures and programs from MER results. TEP has retained the services of Navigant to serve as the third-party evaluation contractor for TEP s portfolio of DSM programs. Navigant verifies energy savings for programs utilizing rigorous industry evaluation standards and protocols outlined by the International Performance Measurement and Verification Protocol (IPMVP), Federal Energy Management Plan (FEMP) and the Uniform Methods Project (UMP) of the NREL. Load Shape Results The hourly savings determined through the Methodology Section above allowed TEP to forecast annual energy and peak demand savings for TEP s 2017 portfolio of DSM programs both to determine a 15-year outlook on resources and to meet the EE Standard savings targets by To estimate the level of cost-effective energy savings beyond 2020, TEP relied on a report published by the EPRI titled U.S. Energy Efficiency Potential Through Further details on TEP s assumptions for future EE are included in Chapter 10. Page - 114
115 2017 Integrated Resource Plan Chart 29 shows the EE annual savings (MWh) required to meet the Standard (including credits) through 2020, and the corresponding estimated actual reduction in retail sales through Chart 29 EE Annual Energy Goals (The Standard) vs. EPRI Estimated Retail Sales Reduction (MWh) 250,000 Annual Energy Efficiency Targets (MWh) 200, , ,000 50, Tracking to Standard Retail Sales Reduction In order to evaluate EE as a resource for replacement of generation in the context of the IRP, the specific types of measures being implemented are modeled, like other resources against the forecasted system load. Modeling EE measures as a resource in TEP s cost production model will provide a more accurate indication of the potential cost savings associated with these measures, through displacing energy (i.e. fuel) or capacity from conventional resources. Using these results, TEP can target measures that coincide with high cost resources or the system peaks, both daily and annually. Chart 30 provides a sample of how current EE measures interact with TEP s system loads. Page - 115
116 Tucson Electric Power Chart 30 TEP s Typical Day Summer Load Shape vs. Cumulative EE Load Shape 0.025% Percent of Hourly Load 0.020% 0.015% 0.010% 0.005% Typical Summer Day Load Shape Typical Summer Energy Efficiency (Negative Load Shape) 0.000% Hour of the Day Tucson s climate has a great impact on the system s generation needs. As expected, TEP is a summer peaking utility, generally experiencing its greatest demand occurring in July. As shown Chart 30 the cumulative impact of EE for TEP in 2015 peaked during the 8:00PM-12:00AM timeframe. However, the TEP system load peak is between 1-8PM. In order to truly replace generation needs, EE targets and goals would need to focus more on the installation of EE measures that coincide with the system peak. Chart 30 depicts the forecasted cumulative annual peak demand savings for TEP s portfolio of programs through 2032, based on the EE shape derived from 2015 data. Page - 116
117 2017 Integrated Resource Plan Energy Efficiency Technology Summary Technology Characteristics Benefits Risks Resource Lead Time Wide range of technologies and customer incentives. Technologies range from customer installed high efficiency electrical devices to design and construction of high efficiency building standards. TEP offers a variety of EE programs designed for both the residential and commercial customers. The primary objective of these programs is to provide customers with consumption based information and financial incentives to reduce overall energy consumption. EE programs give customers opportunities to reduce their monthly electric bills by providing incentives for customers to invest in high efficiency technologies such as home appliances, compact fluorescent lighting, pumps, motors and HVAC equipment. Other programs provide incentives for builders to design and construct both residential and commercial buildings based on higher EE construction standards. Lowest cost resource. Potential environmental benefits include reductions in air emissions and water consumption. The effect of EE reduces system demand and losses and may contribute to deferring the need to construct new power plants and transmission lines. Challenges include customer participation, market potential and sustained load reduction. 1-2 Years The cumulative annual peak demand savings from TEP s DSM programs does reduce the system peak with the increase in cumulative annual savings target goals in the Standard and beyond. The implementation of TEP s DSM programs will help TEP meet the cumulative annual savings targets in the EE Standard and incorporate EE into its 15-year resource planning time-frame. EE is an important part of TEP s future resource mix. Furthermore, stratifying measure-level energy savings on an hourly level will help the planning process to identify EE measures and programs that best fit TEP s resource needs. TEP will continue to monitor DSM program activity and research EE industry best practices to determine the most cost-effective portfolio of programs that provides EE solutions to its customers and incorporates DSM investments in TEP s resource planning. Page - 117

118 Tucson Electric Power Distributed Energy Resources Distributed Energy Resources (DER) include Distributed Generation (DG), which are small-scale, typically renewable resources often sited on utility customer premises. The Arizona RES requires that a portion of renewable energy requirements be obtained from residential and commercial DG systems. The required percentage of DG in the Arizona REST is 30% of the total renewable energy requirement. This section provides a brief overview on both residential PV systems and solar hot water heating technologies. Figure 15 Typical Residential Distributed PV Systems Page - 118

119 2017 Integrated Resource Plan Solar Photovoltaic DG Systems Overview Solar PV DG systems convert sunlight directly into electricity. A residential PV power system enables a homeowner to generate some or all of their daily electrical energy needs on their roof or sometimes using a ground-mounted system. The most common type of PV system today is referred to as a grid tied system, which parallels the utility system and references the utility voltage and frequency to insure that the PV inverter(s) are operating properly. With a grid tied PV system, the PV system remains connected to the utility grid so that power and energy can be drawn from the utility if the PV system cannot meet the demand. PV systems may also include stand-alone battery backup or Uninterruptible Power Supply (UPS) capability to provide power and energy in the event of a utility outage. Today there are a new generation of battery systems that are capable of grid tied operation, and this will allow significant operational benefits in the future and may allow grid support operations as batteries can supplement the utility supply during peak demand times. Every home and business that is connected to the electric utility has a main service panel, an electrical meter, and a line to the utility grid (a service drop). Power flows from the grid through the meter to the service panel where it is distributed throughout the home or business. When PV generation is added to a building, additional power from that source will also flow to the main service panel and is distributed throughout the building. In the event of a utility outage, a grid tied PV system is designed to shut down until utility power is restored. A simple grid-tied PV system diagram is show below: Figure 16 Residential PV System Schematic Typical System Components: PV Array: PV systems use solar cells to convert sunlight directly into electricity. The most commonly used solar cells are made from highly purified crystalline silicon. Groups of solar cells are packaged into PV modules, which are sealed to protect the cells from the environment. Modules are wired together in series and parallel combinations to meet the voltage, current, and power requirements of the PV system. This grouping is referred to as a PV array, and the PV array produces DC power which is then converted to AC power by an inverter. PV modules typically range in size from 5-to-25 square feet and weigh about 3-4 lbs./ft 2. Page - 119
120 Tucson Electric Power Balance of System (BOS): The remainder of the PV system components, aside from the PV modules, is called the Balance-of-System, or BOS. BOS includes mounting hardware and wiring systems used to integrate the solar modules into the structural and electrical systems of the home or business. The wiring systems may include disconnects for the DC and AC sides of the inverter (most string inverters have AC and DC disconnects integrated into the device), ground-fault protection, and overcurrent protection for the solar modules. Many PV systems include a circuit combiner to integrate strings of PV modules. Some inverters include this fusing and combining function within the inverter enclosure. Micro-inverters have become common in the PV arena over the past few years, and the PV module is sometimes called an AC Module. With micro-inverters, the DC to AC conversion is achieved on each module, typically at the 300 watt power level. PV systems that utilize micro-inverters have no DC disconnects, no combiners, and the design can look quite different than the typical grid tied PV system shown below. Benefits of micro-inverters include the fact that one inverter failure will not have a significant impact on energy production, shading of one or several modules may not be a significant problem as it is with traditional PV systems, and the wiring of the PV system requires no DC components, but only AC wiring, which is the typical wiring that electricians are accustomed to working on, installing and servicing. Configuration of Typical PV Systems Figure 17 Typical Grid Tied PV System Page - 120
 active, which have circulating pumps and controls, and 2) passive, which don't have circulating pumps and controls.")
121 2017 Integrated Resource Plan Solar Hot Water Heaters Solar Hot Water (SHW) heating systems include storage tanks and solar collectors. There are two types of SHW systems: 1) active, which have circulating pumps and controls, and 2) passive, which don't have circulating pumps and controls. Most solar water heaters require a well-insulated storage tank. Solar storage tanks have an additional outlet and inlet connected to and from the collector. In two-tank heating systems, the solar water heater preheats water before it enters the conventional water heater. In one-tank systems, the back-up heater is combined with the solar storage in one tank. Solar water heating systems are described using four common terms: Active systems: use pumps to move fluids through the system Passive systems: rely on the buoyancy of warm water and gravity to move fluids through the system without the need for pumps Direct systems: heat water that feeds directly into the domestic hot water system. Direct systems always use potable water as the heat transfer fluid. In areas with high levels of dissolved minerals, carbon dioxide, or other water quality problems, these systems may require water softeners or other water quality mitigation Indirect systems: have independent piping and use heat exchangers to isolate solar fluids from potable domestic hot water. Systems using propylene glycol must use heat exchangers, however, water may also be used in indirect systems with heat exchangers Figure 18 - Typical Solar Hot Water Heater System Page - 121
 Passive Direct System ICS systems are both passive and direct. The tank and collector are combined. Potable water is heated and stored in the ICS collector.")
122 Tucson Electric Power The following system descriptions include example illustrations of system designs. In practice, systems may be configured in many different ways. Integral Collector Storage (ICS) Passive Direct System ICS systems are both passive and direct. The tank and collector are combined. Potable water is heated and stored in the ICS collector. As hot water is used, cold water fills the collector from the bottom. These systems work best when hot water demands are in the late afternoon and evening. Heat gained during the day may be lost at night if not used, and depends on local weather conditions. A check valve, or the arrangement of pipe runs, stops reverse thermosiphoning where heat is lost from the domestic hot water system to the night sky. These systems are the least expensive of solar thermal system designs and one of the most popular types of designs on the world market. However, they may only be used in areas that do not experience regular hard freezes. ICS collectors have more depth than flat plate collectors to accommodate integral tanks. Some builders have placed these collectors directly on the roof deck and built up around them with parapets or tile roof systems. Thermosiphon Passive Direct System Thermosiphon systems are passive with a storage tank located higher than the solar collector, and some systems may come packaged with tanks pre-mounted to collectors. In these systems the tank sits on the outside of the roof, while other systems have tanks located inside attic spaces above the collectors. These systems are direct, using potable water as the heat transfer fluid. Water pipes and tanks containing water must be protected from freezing or located in a conditioned space in climates that freeze. Page - 122

123 2017 Integrated Resource Plan Typical Installations In general, SHW systems are mounted on a south-facing roof (in the northern hemisphere), or adjacent to the house at ground level. In either case the SHW system is generally remote from the backup and supplementary storage water heater and its tank. This distance, or the amount of finished space the loop must traverse in a retrofit installation, impacts the method and cost of installation. The most fundamental distinction is between systems that must resist freezing (closed-loop systems) and those located in climates where freezing is very rarely severe enough to threaten the integrity of the system (open-loop systems). Because closed-loop systems require either drain-back provisions or a separate freeze-protected loop to indirectly heat water in the storage tank, they generally have active components (pumps) and are more complex. Distributed Generation Technology Summary Technology and Fuel Distributed Generation; Predominantly Rooftop Solar PV PV cells convert sunlight directly into electricity. Cells are arranged in Characteristics modules, and modules into arrays, which can be mounted in a fixed position or onto structures that enable them to track the sun. O&M costs are very low and not subject to future fuel prices. Emits no air pollution and consumes no water. Energy generally produced during highdemand periods. Scalability provides greater cost control and cost risk Benefits mitigation. Unless coupled with energy storage, solar energy is only available during Risks daylight hours and is subject to variable output during the day, depending on cloud cover. Construction Lead Time 0.75 years Page - 123
124
125 2017 Integrated Resource Plan LOAD SERVING RESOURCES CHAPTER 6 Renewable Energy The resource planning team relied on a number of industry experts such as Black and Veatch, United States Department of Energy, and the National Renewable Energy Laboratory to help develop the operational and cost assumptions for renewable technologies. This chapter provides an overview on the assumptions used in the resource planning evaluations. For the 2017 resource plan the following renewable technologies were considered: Solar Photovoltaic (PV) Solar - Concentrating PV Technology (CPV) Solar - Concentrating Solar Power Technology (CSP) Wind Turbines Bio-Resources Renewable resource assumptions were based on the following data sources: 1. DOE, Energy Efficiency & Renewable Energy, SunShot Initiative Website DOE, Electricity Advisory Committee Reports and meetings, news, etc. through meetings 3. NREL Website 4. PACE Global Insights 5. TEP s competitive procurement process and on-going R&D efforts. Page - 125
126 Tucson Electric Power Solar PV Technology Solar PV cells convert sunlight directly into electricity. These PV cells are the building blocks of PV modules, or panels, and these modules are the building blocks for a PV array, which can produce kilowatts to megawatts of power. PV gets its name from the process of converting light (photons) to electricity (voltage and current), which is called the PV effect. The PV effect was first observed in by Alexandre Edmond Becquerel, and proven with the first practical silicon solar cell in 1954, when scientists at Bell Labs discovered that silicon (an element found in sand) created an electric charge when exposed to sunlight. Soon after, solar cells were used to power space satellites and eventually powered smaller items like calculators and watches. Today, hundreds of thousands of Americans, and millions across the world power their homes and businesses with grid tied 21 solar PV systems. Utility companies are also using PV technology for large power stations, many in the 100s of megawatts during peak power times. Traditional solar cells made from silicon are typically flat-plate, and generally are the most efficient 22. Secondgeneration solar cells are called thin-film solar cells because they are made from amorphous silicon or nonsilicon materials such as cadmium telluride. Thin film solar cells use layers of semiconductor materials only a few micrometers thick. Because of their flexibility, thin film solar cells can double as rooftop shingles and tiles, building facades, or the glazing for windows. All of these building material technologies are generally referred to as Building Integrated Photovoltaic. Next-generation solar cells are being made from variety of materials other than silicon, including solar inks that may use conventional printing technologies, solar dyes, and conductive plastics. Some solar PV cells use plastic lenses or mirrors to concentrate sunlight onto a very small piece of high efficiency PV material. The PV material is generally more expensive, but because so little is needed, the systems are seen as becoming cost effective for use by utilities and industry. However, because the lenses must be pointed at the sun, the use of concentrating collectors is limited to the sunniest parts of the country that include California, Nevada, and Arizona. Solar modules and arrays used to power homes and businesses are typically made from solar cells combined into modules that hold about 40 cells. A typical home will have an array of 10 to 20 solar panels to power the home, with an average residential PV system size of 5 kw 23. The modules are often mounted at a fixed angle facing south, or they can be mounted on a tracking device that follows the sun, allowing them to capture the most sunlight. For large electric utility or industrial applications, hundreds of solar arrays are interconnected to form a large utility-scale PV system often in the 10s or 100s of MW of nameplate capacity Grid Tied PV systems are PV systems that are connected in parallel to the electric utility grid, where some or all of the energy is consumed locally and some or all of the energy is sent back to the utility system for use by other consumers 22 For more on efficiency see Page - 126
127 2017 Integrated Resource Plan Solar Resource Characteristics Several forms of solar power technology are available today in order to capture energy from the sun. One form, solar PV, converts sunlight into direct current power. A device called an inverter then converts the direct current power into alternating current power to be used by consumers and tied to the electric grid. Another form of solar is CSP, where CSP uses large reflectors and tracking systems to gather energy from sunlight and focus it to generate heat. Heat from the concentrated sunlight may be used to produce steam that turns a turbine generator to generate alternating current power. Some CSP systems may heat molten salts or other materials to be used after the sun goes down, and when that power is needed. This is another type of energy storage that is being studied and developed throughout the world, and may help solve some of the challenges related to the diurnal nature of the sun. In certain respects, the technological development and commercialization of utility-scale solar power is currently at a stage similar to that of wind power prior to its recent period of rapid growth and widespread adoption by the electric utility industry. For example, large amounts of capital are being invested in research, design and demonstration efforts to improve solar power generating technologies and achieve improved economies of scale. Examples include intensive R&D on advanced forms of solar PV technologies, and construction of demonstration projects based on large-scale concentrating solar generating technology. Page - 127


128 Tucson Electric Power Photovoltaic Solar Power Technology As noted above, the two primary forms of solar power generating technologies are solar PV and concentrating solar power. PV systems make up the bulk of existing installed solar generating facilities, and can be built at practically any size from one kilowatt to 100s of megawatts. PV modules can be connected in groups to become an array, and a PV array can be configured in many different layouts based on the available rooftop or the available land to place these arrays. Flat-Plate Photovoltaic Array Source: Renewable Energy Atlas of the West: A Guide to the Region s Resource Potential Source: NREL: National Renewable Energy Laboratory A single PV cell produces a small amount of power. To produce more power, cells are electrically interconnected and physically mounted to a frame to form modules, which can in turn be connected into arrays to produce yet more power. Because of this modularity, PV systems can be designed to meet many electrical requirements, both large and small. PV systems can even be designed to have battery storage systems connected, providing power and energy when it is needed or for emergencies. Page - 128


129 2017 Integrated Resource Plan Flat-Plate PV Systems The most common PV array design uses flat-plate PV modules (sometimes referred to as PV panels). These PV panels can either be fixed in place or allowed to track the movement of the sun. Tracking systems, which are more expensive to install and have higher maintenance requirements, can be single axis tracking or dual axis tracking, and generally result in a significant increase in energy production. One typical flat-plate module design uses a substrate of metal, glass, or plastic to provide structural support in the back; an encapsulant material to protect the cells; and a transparent cover of plastic or glass. Source: NREL PV systems respond to sunlight that is either direct or diffuse. Even in clear skies, the diffuse component of sunlight accounts for between 10% and 20% of the total solar radiation on a horizontal surface. On partly sunny days, up to 50% of that radiation is diffuse. And on cloudy days, 100% of the radiation is diffuse. Illustration of the direct solar radiation and the indirect, diffuse radiation that contribute to a PV array. Source: NREL Page - 129
130 Tucson Electric Power Mounting Structures PV arrays must be mounted on a stable, durable structure that can support the array and withstand wind, rain, hail, and other adverse conditions. However, stationary structures are typically designed with flat-plate systems. These structures tilt the PV array at a fixed angle determined by the latitude of the site, the requirements of the load, and the availability of sunlight. Among the choices for stationary mounting structures, rack mounting may be the most versatile. It can be constructed fairly easily and installed on the ground or on flat or slanted roofs. The advantages of fixed arrays are that they lack moving parts, there is virtually no need for extra equipment, and they are relatively lightweight compared to tracking systems. These features make them suitable for many locations, including most residential roofs. Because the panels are fixed in place, their orientation to the sun is usually at an angle that provides less than optimal energy production and maximum energy production time of day. Therefore, less energy per unit area of a PV array is collected compared with that from a tracking array. However, this drawback must be balanced against the higher cost of the tracking system. Chart 50 illustrates the increased energy production of a single-axis tracking (SAT) system, which is dependent on location, but can provide an increase in annual energy production of up to 20-40%. Single Axis and Dual Axis Tracking Systems Sometimes, the solar mounting structure is designed to track the sun. There are two basic kinds of tracking structures: one-axis and two-axis. The SAT PV systems are typically designed to track the sun from east to west. They are used with flat-plate systems and sometimes with concentrator systems. The two-axis type is used primarily with PV concentrator systems. These units track the sun's daily course and its seasonal course between the northern and southern hemispheres. Naturally, the more sophisticated systems are the more expensive ones, and they usually require more maintenance. Chart 31 - Comparison of Solar PV Systems (Fixed Panel vs. Single Axis Tracking) % of Nameplate Solar PV Capacity 100% 90% On an annual basis, 80% single axis tracking During summer 70% systems provide 40% coincident peak, a more energy versus fixed tracking system 60% provide 60% more 50% capacity versus fixed 40% 30% 20% 10% 0% 1:00 AM 4:00 AM 7:00 AM 10:00 AM 1:00 PM 4:00 PM 7:00 PM 10:00 PM Time of Day (Typical Summer Day) Solar PV (Fixed) Solar PV (Single-Axis) Page - 130
131 2017 Integrated Resource Plan Solar PV Technology Summary Technology and Fuel Characteristics Benefits Risks Construction Lead Time Solar PV Technology PV cells convert sunlight directly into electricity. Cells are arranged in modules, and modules into arrays, which can be mounted in a fixed position or onto structures that enable them to track the sun. O&M costs are very low and not subject to future fuel prices. Emits no air pollution and consumes no water. Energy generally produced during highdemand periods. Scalability provides greater cost control and cost risk mitigation. Unless coupled with energy storage, solar energy is only available during daylight hours and is subject to variable output during the day, depending on cloud cover years Page - 131

132 Tucson Electric Power U.S. Solar Map This map shows the national solar PV resource potential for the U.S., and is based on the monthly average daily total solar resource potential on grid cells. The insolation values represent the resource available to a flat plate collector, such as a PV panel, oriented due south at an angle from horizontal to equal to the latitude of the collector location. This is typical practice for PV system installation, although other orientations are also used. Additional maps are available at the NREL website located at Map 2 - U.S. PV Solar Resource Map Page - 132


133 2017 Integrated Resource Plan Arizona Solar Power Map The Global Horizontal Resource of Arizona map provides monthly average and annual average daily total solar resource averaged over surface cells of degrees in both latitude and longitude, or nominally 4 km in size. The inputs are based on the PATMOS-X model that uses half-hourly radiance images in visible and infrared channels from the GOES series of geostationary weather satellites. Map 3 - Global Horizontal Solar Resource of Arizona Page - 133

134 Tucson Electric Power New Mexico Solar Power Map The New Mexico NREL Solar Insolation Map is based on estimates monthly daily total radiation, averaged from hourly estimates of direct normal irradiance over eight years. The inputs are based on hourly visible irradiance from the GOES geostationary satellites, and month average aerosol optical depth, precipitable water vapor, and ozone sampled at a 10km resolution. Map 4 - New Mexico NREL Solar Insolation Map Page - 134
135 2017 Integrated Resource Plan Concentrating Photovoltaics (CPV) Concentrating photovoltaic systems use lenses or mirrors to concentrate sunlight onto high-efficiency solar cells. These solar cells are more expensive than conventional cells used for flat-plate PV systems. However, the increased cell efficiency requires less cell area to produce a given amount of power. CPV technology offers the following advantages: Potential for solar cell efficiencies greater than 40% No moving parts No intervening heat transfer surface Near-ambient temperature operation No thermal mass; fast response Reduction in costs of cells relative to optics Scalable to a range of sizes Because of their relatively high cost, CPV systems require the use of concentrated sunlight to be costcompetitive with other solar power options. Thus, groups such as NREL have focused on the development of multi-cell packages (dense arrays) to improve overall performance, improve cooling, and install reliable prototype systems. CPV systems are not included in TEP s long-term resource plan at this time due to their high costs, as they are typically two to three times higher than more traditional solar and wind resources on a levelized cost basis. Also, market prices and cost data are difficult to obtain because the CPV market is young and there are a relatively low number of installations and companies in the field. Recently, the CPV industry has struggled to compete with PV prices, leading CPV companies exiting the market, while others face challenges in raising the capital required to scale. 24 CPV Technology Summary Technology and Fuel Characteristics Benefits Risks Construction Lead Time Concentrating Photovoltaics (CPV) Uses mirrors or lenses on a single-axis or dual-axis tracking system to concentrate sunlight onto high-efficiency PV cells. Performs best in high-sunlight regions. Efficiency is not affected by high ambient temperatures. Trackers allow for high levels of power production through the day. Less land and land disturbance required relative to conventional PV systems. Costs are two to three times higher than more conventional solar technologies. CPV market is still young and not well developed. 1 year 24 Phillips, Simon et al. Current Status of Concentrator Photovoltaic (CPV) Technology, Version 1.2, February Page - 135
136 Tucson Electric Power Concentrating Solar Power Technology (CSP) Concentrating Solar Power is another type of solar power generation, and is considered an ideal technology for warm climates that are prevalent in Arizona. Concentrating solar power uses mirrors to reflect and concentrate sunlight onto receivers that collect the solar energy and convert it into thermal energy. This thermal energy can then be used to produce electricity via a steam turbine or heat engine driving a generator. In virtually all applications, CSP is large in scale, on the order of 100 MW or larger. These large systems are similar in many respects to traditional coal, natural gas, or nuclear generator systems and utilize synchronous generators to produce electricity. While the CSP systems generally do not operate 24/7 because of the diurnal nature of the sun, they do provide grid support when they are operational because of the synchronous generation. This important feature of grid support is an important technical factor when comparing CSP to PV generation systems that utilize inverters, which do not currently provide inertia to the grid. There are three generic CSP system architectures: line-focus (trough systems), point-focus central receiver (power towers), and point-focus distributed receiver (dish-engine systems). Power Tower CSP Systems Power tower systems consist of a field of large, nearly flat mirror assemblies, known as heliostats, which track the sun and focus the light onto a receiver at the top of a tower. In a typical configuration, a heattransfer fluid, such as water, water and glycol mixtures, or molten nitrate salts is pumped through the receiver, and used to generate steam to power a conventional steam-turbine power cycle generating electricity. In some systems, excess thermal energy can be stored during daylight hours to provide electricity at times when the sun is not available and at night. An advantage of power tower systems over linear concentrator systems is that higher temperatures can be achieved in the working fluid, leading to higher efficiencies and lower-cost electricity. Sunlight can be utilized from a large area, and concentrated on a small area on the tower, and that approach reduces the distance that heat capturing fluids must travel to generate power and energy. Page - 136
137 2017 Integrated Resource Plan CSP Technology Summary Technology and Fuel Characteristics Concentrating Solar Power Technology (CSP) Mirrors concentrate sunlight onto a fluid that can generate steam for electric generators. Benefits Electric generators can be synchronized to the grid, thereby providing inertia. For some CSP technologies, thermal storage can be used to address intermittency issues and provide power after sunset. Risks Costs are two to three times higher than more conventional solar technologies. Construction Lead Time 4 to 5 years Page - 137
 The Ivanpah Solar Electric Generating Station is located in Ivanpah Dry Lake, Calif.")


138 Tucson Electric Power Ivanpah Solar Electric Generating Station Figure 19 - Figure 8 - Ivanpah Solar Electric Generating Station (392 MW) The Ivanpah Solar Electric Generating Station is located in Ivanpah Dry Lake, Calif., approximately 40 miles southwest of Las Vegas. BrightSource began development in 2006, and construction commenced in October 2010, led by engineering, procurement, and construction partner Bechtel. The station was first connected to the grid in September 2013 and went into commercial operation in late The station is comprised of three separate units and has long-term PPAs in place with Pacific Gas & Electric (Units 1 and 3) and Southern California Edison (Unit 2). Image Page - 138


139 2017 Integrated Resource Plan The Ivanpah Solar Electric Generating System is comprised of three separate units with a total capacity of 392 MW. Ivanpah is a joint effort between NRG Energy, Google, Bechtel, and BrightSource Energy. The station uses over 300,000 software-controlled heliostats that concentrate sunlight onto three 459-foot towers. Four types of heliostats are used depending on the distance from the tower; the furthest out are more than half a mile away. The heliostats are capable of withstanding 85-mph winds. Ivanpah Computer Controlled Heliostats Ivanpah Solar Receiver and Condensers Each tower supports a 2,100-ton boiler that directs steam into a turbine generator at ground level. Natural gas is used to warm the boiler up from a cold start, but in normal use, it retains enough heat from the previous day to start up on sunlight alone. A 110-ton counterweight is continually repositioned to keep the tower stable. The concentrated sunlight generates steam in the tower-top boilers. The facility relies on aircooled condensers to condense the turbine exhaust, reducing water consumption by as much as 95% less than a wet-cooled thermal plant. The plant s only water requirements are boiler makeup water and for cleaning, and the water is obtained from two wells on the site. One of Three 130 MW Solar Power Close up of Solar Receiver Page - 139
 that is currently operating or under construction.")
140 Tucson Electric Power Ivanpah s $2.2 billion cost was supported by $1.6 billion in loan guarantees from the DOE s Loan Programs Office 25 (LPO). The plant is just a portion of the 2.8 GW of LPO-financed large-scale solar (CSP and PV) that is currently operating or under construction. The LPO currently oversees a portfolio of more than $30 billion in loans, loan guarantees, and commitments that support more than 30 closed and committed projects. LPOsupported facilities include one of the world s largest wind farms as well as several of the world s largest solar generation and thermal energy storage systems. Stirling Engine Dish Technology The solar Stirling Engine is well beyond the research and development phase, with more than 20 years of recorded operating history. The Stirling technology is based on an electrical solar dish system, which consists of a unique radial solar concentrator dish structure that supports an array of curved glass mirror facets, designed to automatically track the sun, collect and concentrate solar energy onto a Power Conversion Unit (PCU). The PCU is coupled with, and powered by, a SES Stirling engine that generates grid-quality electricity. Figure 20 - Stirling Engine Dish 25 Page - 140

141 2017 Integrated Resource Plan The conversion process in the PCU involves a closed-cycle, high-efficiency four-cylinder, reciprocating Solar Stirling Engine utilizing an internal working fluid that is recycled through the engine. The Solar Stirling Engine operates with heat input from the sun that is focused by the dish assembly mirrors onto the PCU s solar receiver tubes that contain hydrogen gas. The PCU solar receiver is an external heat exchanger that absorbs the incoming solar thermal energy. This heats and pressurizes the gas in the heat exchanger tubing, and this gas in turn powers the solar Stirling Engine. Figure 21 - Solar Parabolic Dish-Engine System - 25 kw (NREL) A generator is connected to the solar Stirling Engine, and waste heat from the engine is transferred to the ambient air via a radiator system. The gas is cooled by a radiator system and is continually recycled within the engine during the power cycle. The conversion process does not consume water, as is required by most thermal-powered generating systems. Page - 141
142 Tucson Electric Power Parabolic Trough Power Plants (PTPP) 26 A PTPP system is typically oriented in a north-south direction and tracks the sun from east to west focusing solar energy on a long tubular receiver. The working fluid in a trough system is usually a synthetic oil that is heated to approximately 390 C (734 F). The hot oil is used to generate steam for use in a conventional Rankine cycle steam turbine system. The predominant CSP systems in operation in the United States are linear concentrators using parabolic trough collectors. In addition, trough systems can be hybridized (natural gas co-firing) or may use thermal storage in order to dispatch power when most valuable to electric utilities, which is usually during peak load times during the late afternoons. 26 For more information, see Page - 142
 Figure 23 - Schematic of a Parabolic Trough")
 Source: https://www.mtholyoke.")
143 2017 Integrated Resource Plan Figure 22 - Harper Lake Solar CSP Project (NREL) Figure 23 - Schematic of a Parabolic Trough Power Plant (PTPP) with thermal storage. (Mount Holyoke College) Source: Page - 143


144 Tucson Electric Power Parabolic Trough Power Plant Technology As shown in the PTPP example below, the solar trough field heats synthetic transfer oil that is used to generate superheated, high-pressure steam that is delivered to a steam turbine. This turbine powers an electrical generator, creating electricity that can be delivered to the bulk power system for utility use. Figure 24 - Solar PTPP Schematic Mojave PTPP Project The Mojave Solar Project consists of two 125 MW parabolic trough power plants for a total of 250 MW. The Mojave Solar technology uses mirrors to concentrate the thermal energy of the sun to drive a conventional steam turbine. The plant is located about 20 miles from Barstow, California, and was completed in December of 2014 by Abengoa. Abengoa secured a $1.2billion loan guarantee from the US DOE. Pacific Gas & Electric has agreed to purchase the power generated from the solar thermal facility as part of a 25 year PPA with Abengoa Solar. Figure 25 - Mohave Solar Collectors Page - 144
 is burned generally on a combustion chamber of a gas turbine.")
145 2017 Integrated Resource Plan Hybridized Configuration with Natural Gas Co-Firing ISCC technology combines the benefits of solar energy with the benefits of a combined cycle. The operation of a solar combined hybrid plant is similar to a conventional combined cycle plant. The fuel (preferably natural gas) is burned generally on a combustion chamber of a gas turbine. The heat coming from the solar field is added to escape gases that are directed to the heat retriever, resulting in increased steam generation and, consequently, an increase of electricity production from the steam turbine. Figure 26 - Solar CSP Hybrid with Natural Gas Co-Firing Storage Configuration based on Two-Tank Molten Salt System Concentrating solar power technologies are being enhanced with the addition of energy storage systems. With the use of a thermal energy storage system, solar plants are able to produce energy output during nondaylight hours. One of the materials being used to store the sun s thermal capacitance is molten-nitrate salt. In this design configuration, large insulated tanks filled with molten salt are used with PTPP technology to store the heat from the synthetic transfer oil. This stored heat is used to improve the dispatchability of the solar resource by providing power after the sun goes down. Systems employing this storage technology may benefit from the stored heat and produce power for 6-8 hours after sundown. Page - 145

146 Tucson Electric Power Figure 27 - Solar CSP with Thermal Storage Solana Generating Station Solana solar thermal plant, a PTPP concentrating solar power CSP plant and the first in the U.S. with thermal energy storage began commercial operations in October The 280-MW plant, near Gila Bend in Arizona, employs molten salt to store about six hours of thermal energy at full power, allowing the facility to continue operating during periods of peak evening demand. The addition of thermal storage also allows the facility to smooth out any intermittency in generation as a result of cloudy periods during the day, which allows the plant to operate more like a traditional thermal generating system. The three-square mile facility employs 2,700 parabolic trough mirrors and a pair of 140-MW steam turbines. Heated oil from the mirrors is used to heat molten salt in six pairs of hot and cold tanks with a capacity of 125,000 metric tons. Solana sells all its power to Arizona Public Service, the state s largest utility, through a 30-year PPA. The facility cost approximately $2 billion to build, and was financed in part with a $1.45 billion loan guarantee from the Department of Energy. 27 For more information see Page - 146


147 2017 Integrated Resource Plan Aerial View of Solana Solar Field Parabolic Trough Collector Thermal Energy Storage Tanks Solana s Power Blocks Page - 147

148 Tucson Electric Power Wind Power Resource Characteristics Wind power is the process of mechanically harnessing kinetic energy from the wind and converting it into electricity. The most common form of utility-scale wind technology uses a horizontal-axis rotor with turbine blades to turn an electric generator mounted at the top of a tall tower. For utility-scale wind power production, dozens of wind turbines may be grouped together at a wind farm project. Power generated by the wind turbines is collected at a substation where transformers increase the voltage and the power is then fed into the transmission system. Because air has low mass, the wind itself has low energy density. The amount of wind power that can be produced at a given project site is dependent on the strength and frequency of wind. Wind velocity determines quantity of power that can be produced. For example, a doubling of wind speed allows roughly eight times as much power to be produced. Over the last twenty years, the use of wind power has increased rapidly, making it the predominant form of new renewable generation resource, with many large-scale installations around the world. Major advances in wind power technology were achieved in the 1990s and 2000s, allowing much larger turbines to be developed. For example, wind turbines with a capacity of 1.5 megawatts to 5 megawatts are now common and wind turbines larger than 8 megawatts are being developed. This has created economies of scale, driving down the unit cost of energy from wind power resources. Figure 28 - Kingman Wind Farm (10 MW Project) UNS Electric Wind Project A small wind farm outside of Kingman, Arizona developed by Western Wind Energy Corporation. Page - 148

149 2017 Integrated Resource Plan U.S. Wind Resource Map Map 5 - U.S. Wind Resource Map Page - 149

150 Tucson Electric Power Arizona Wind Resource Map The U.S. Department of Energy's Wind Program and the NREL published an 80-meter (m) height wind resource map for Arizona 28. The Arizona Wind Resource Map shows the predicted mean annual wind speeds at an 80-m height. Areas with annual average wind speeds around 6.5 meters per second and greater at 80-m height are generally considered to have a resource suitable for wind development. Utility-scale, land-based wind turbines are typically installed between 80m and 100m high. NREL publishes wind resource maps at elevations of 30m, 50m, 80m, 90m (offshore), and 100m. Map 6 - Arizona NREL Wind Resource Map 28 Page - 150
151 2017 Integrated Resource Plan Arizona Wind Resource Potential It is estimated that Arizona s wind resource capacity potential is approximately 10,900 MW based on an annual capacity factor of 30%. On an annual basis this results in 30,600 GWh of potential annual wind generation for the state. Chart 32 - Arizona NREL Wind Resource Potential Page - 151


152 Tucson Electric Power New Mexico Wind Resource Map The U.S. Department of Energy's Wind Program and the NREL published an 80-m height wind resource map for New Mexico. The New Mexico Wind Resource Map shows the predicted mean annual wind speeds at an 80-m height. Areas with annual average wind speeds around 6.5 meters per second and greater at 80-m height are generally considered to have a resource suitable for wind development. Utility-scale, land-based wind turbines are typically installed between 80 and 100 m high. As mentioned above, NREL publishes wind resource maps at elevations of 30m, 50m, 80m, 90m (offshore), and 100m. Map 7 - New Mexico NREL Wind Power Map 80m Page - 152
153 2017 Integrated Resource Plan New Mexico Wind Resource Potential It is estimated that New Mexico s wind resource capacity potential is approximately 492,000 MW based on an annual capacity factor of 30%. On an annual basis this results in 1,645,000 GWh of potential annual wind generation for the state. Chart 33 New Mexico Wind Resource Potential Page - 153
154 Tucson Electric Power Wind Resource Technology As the wind starts to blow, yaw motors turn a turbine s nacelle so that the rotor and blades face directly into wind. The blades are shaped with an airfoil cross section (similar to an aircraft wing) and this causes air to move more quickly over one side than the other. This difference in speed causes a difference in pressure, which in turn causes the blade to move, the rotor to turn, and a rotational force (or torque) to be generated. The rotor is connected to a gearbox (on most turbines) and in turn to a generator housed in the nacelle that converts the torque into electricity. The electricity is then fed into a transformer located either inside or just outside the turbine which steps up the voltage to reduce losses in the transmission of electricity. From there the electricity travels through underground cables to an electricity sub-station, usually on or near the wind farm site, where the voltage is stepped up with power transformers and exported to the local grid. There are four types of utility-scale wind turbines now in use, with the majority of new installations being types III and IV due to their use of power electronics to control behavior and generate at a much wider window of wind speeds. Type I: Squirrel cage induction generator Type II: Wound-rotor induction generator with adjustable external rotor resistance Type III: Doubly-fed induction generator Type IV: Induction generator with full converter interface Typically turbines begin to generate electricity at wind speeds of 3-4 m/s (7-9 mph). The amount of torque (and thus electricity) generated increases with wind speed up to around 15 m/s (34 mph) where the maximum (or rated) capacity of the turbine is reached. Output is then maintained at this level until a turbine is shut down when the wind reaches high speeds of around 25m/s (57 mph) to protect it from excessive loads - though the turbines are in fact designed and certified to withstand wind speeds up to 70 m/s (157 mph). Page - 154

155 2017 Integrated Resource Plan Figure 29-3D Drawing of Nordex N80/2500kW Wind Turbine HOW A WIND TURBINE WORKS 1. Rotor assembly of three blades mounted on a hub that is connected via the main shaft to the gearbox. 2. Pitch motors change the angle of attach of the blades so as to control rotational speed and torque. 3. Gearbox converts the rotational speed of the rotor to a suitable speed for the generator. 4. Yaw motors continually turn the nacelle so as to ensure the rotor faces into the wind. 5. Tower supports the nacelle and rotor. The tower contains electrical cables and access ladders. 6. Generator converts the torque generated by the rotor to electrical energy. Wind Technology Summary Technology and Fuel Wind Power Characteristics Kinetic energy of the wind is transformed into mechanical energy through a rotor, and then into electrical energy by a generator housed inside the nacelle of a wind turbine tower. Benefits Risks Historically one of the cheapest forms of renewable energy in most of the US. Can provide energy at any time of the day/night. Generally more intermittent and less predictable than the output from solar facilities. Construction Lead Time 1 year. Page - 155

156 Tucson Electric Power Bioenergy/Bio-Resources Biofuels are a set of energy resources that are produced using biological processes, and can be derived directly from plants or indirectly through other processes including agricultural waste. Some types of biofuel power plants utilize the heat produced from the combustion of biological materials to produce electricity. Biofuel generation, from multiple sources, is a relatively mature, proven technology. In addition, biomass resources, like other forms of renewable energy, can be at or near carbon-neutral. Being carbon-neutral refers to achieving net zero carbon emissions by balancing a measured amount of carbon released with an equivalent amount sequestered or offset. The National Renewable Energy Laboratory publishes maps that provide data related to the available annual biomass for fuel and other use. Most of this biomass is based on agricultural waste from U.S. farms. Map 8 U.S. NREL Biomass Map Page - 156


157 2017 Integrated Resource Plan Arizona Biomass Map The Arizona NREL Biomass Map illustrates the biomass resources available in Arizona by county. Biomass feedstock data are analyzed both statistically and graphically using a Geographic Information System (GIS). The following feedstock categories are evaluated: crop residues, forest residues, primary and secondary mill residues, urban wood waste, and methane emissions from manure management, landfills, and domestic wastewater treatment. Map 9 Arizona NREL Biomass Map Page - 157


158 Tucson Electric Power New Mexico Biomass Map The New Mexico NREL Biomass Map illustrates the biomass resources available by county in New Mexico. Biomass feedstock data are analyzed both statistically and graphically using a GIS. The following feedstock categories are evaluated: crop residues, forest residues, primary and secondary mill residues, urban wood waste, and methane emissions from manure management, landfills, and domestic wastewater treatment. The map shows the available biomass resources, as do the other maps shown in this report for various regions, but does not indicate actual use of those resources. Map 10 New Mexico NREL Biomass Map Page - 158
159 2017 Integrated Resource Plan Biomass Technology Overview Biofuel energy sources can be divided into two broad categories: biomass and biogas. Biomass: This category includes all solid biological materials. The most common source of biomass fuel is wood. However this category can also include manure, sewage sludge, agricultural waste, and even cultivated biomass agricultural products such as grasses. Biomass power plants operate in a manner very similar to coal and natural gas power plants. In general, the heat produced from combustion of the biomass is used to produce steam that in turn is used to spin a turbine and produce electricity. In addition to dedicated biomass power plants, there is also the potential for using biomass sources as a co-firing fuel with traditional resources such as coal. Biogas: This category includes the capture of gasses naturally produced as a part of biological processes. One of the most common biogas is methane, and is often collected from the process of decay at landfills. Another potential source is the methane produced from bacterial digestion of manure. Biogas resources may be used to produce electricity as part of a dedicated plant in the same manner as a traditional natural gas plant, and biogases are sometimes used to supplement other fuel sources. Transmission and Siting Requirements Biofuel resources may or may not require significant electric transmission upgrades depending on the location of the source of fuel. For instance, plants utilizing wood waste or gas produced as a part of sewage treatment would likely be located near load centers and require minimal additional transition resources. On the other hand, a plant utilizing agricultural or forest thinning waste would likely be located a significant distance from load centers and may require electric transmission upgrades. Dispatch Characteristics One of the potential advantages for the adoption and use of biomass power plants is that it can be used as a dispatchable, reliable, base load resource (in contrast to many other renewables). Direct-fired biomass power plants often operate at capacity factors of 85% and above, similar to coal and natural gas powered plants. Environmental Attributes The principal environmental advantage for using biofuels is that biofuels are considered carbon-neutral. While the process of burning biofuels does release CO2, a nearly equal amount of CO2 is absorbed from the atmosphere as the biological source of the fuel grows. While the burning of biofuels is carbon-neutral, it does entail significant emissions of NOx and PM, requiring the use of scrubbing technology at the power plant. In addition to some unfavorable emissions, the use of biomass also risks other negative environmental impacts if the fuel is not collected in a sustainable manner. In general, however, biofuels are harvested from waste sources, and sustainability is generally an insignificant issue. Page - 159
160 Tucson Electric Power Biomass Technology Summary Technology and Fuel Characteristics Benefits Risks Biomass Electricity generated through the combustion of biologic material or biologic material byproducts (i.e., biogas). Similar in concept to traditional thermal-based power plants. Carbon emissions can be partially or fully offset through CO2 sequestration by the replacement feedstock. Currently about twice the cost of other renewable energy sources. Construction Lead Time 5 years. Natural Gas Resources Advances in natural gas exploration and development, such as directional drilling and hydraulic fracturing, have dramatically increased the amount of proven reserves in the US and consequently brought prices down to about one-fourth of their peak in This, plus the increasing costs of controlling emissions from coal-fired power plants, has led to an increase in electricity generation from natural gas-fired power plants, which now exceeds generation from coal-fired power plants nationally. There are a number of ways natural gas can be used to generate electricity. As with other fossil fuels, it can be burned in boilers to generate steam. A more efficient process, and the one used predominantly to generate electricity from natural gas, is the combined cycle process, which is described below. Finally, natural gas can be used in simple cycle combustion turbines to produce electricity. This technology is not as efficient as combined cycle but has operational advantages over steam and combined cycle technologies, such as cycling on and off more frequently (and at less cost) and changing its output more rapidly to follow rapid load changes or to compensate for rapid power changes from solar and wind resources. Combustion turbines thus have the most value when used as grid balancing resources and are discussed further in Chapter 7. Natural gas combined cycle technology is the most efficient and cost-effective way of generating electricity from natural gas. The basic principle of NGCC is to produce power in a gas turbine which can be converted to electric power by a coupled generator, and to use the hot exhaust gases from the gas turbine to produce steam in a heat recovery steam generator (HRSG). This steam is then used to drive a turbine and generator to produce more electric power. The use of both gas and steam turbines in a single plant results in higher conversion efficiencies and lower emission. Additionally, natural gas can be fired in the HRSG to produce additional steam and associated output for meeting peak loads a process commonly referred to as duct firing. The heat rate will increase during duct-fired operation, but this incremental duct-fired heat rate is generally less than the resultant heat rate from a similarly sized simple cycle natural gas power plant. Page - 160
161 2017 Integrated Resource Plan NGCC Technology Summary Technology and Fuel Natural Gas Combined Cycle (NGCC) Characteristics Benefits Risks Construction Lead Time Uses natural gas to power one or more combustion turbines whose exhaust is used to generate steam for an additional turbine, resulting in a highly-efficient electricitygeneration process. Produces electricity more efficiently and with fewer emissions than other fossilfired technologies. Capable of changing out put more rapidly and following load more closely than other fossil-fired technologies. Over the long term, costs are subject to natural gas prices and greenhouse gas regulations. 3 years. Page - 161
162 Tucson Electric Power Coal Resources As shown on Chart 34, below, the percentage of U. S. electric power generation from coal has been on a decline since This decline is largely due to reduced costs of competing sources of generation such as natural gas, solar and wind. However, in 2017 and 2018, as natural gas prices are expected to increase, coal is predicted to regain some share of the electricity generation mix, and coal production is expected to increase slightly. Chart 34 - U.S. Net Electricity Generation 2,500,000 2,000,000 Thousands of MWhs 1,500,000 1,000, , Axis Title Coal Gas Solar Source: U.S. Energy Information Administration, Short-Term Energy Outlook, February The U.S. Energy Information Administration expects the share of U.S. total utility-scale electricity generation from natural gas will fall from 34% last year (2016) to an average of 32% in 2017 as a result of higher expected natural gas prices. The forecast natural gas share is forecast to rise slightly to 33% in Coal's generation share rises from 30% in 2016 to average 31% in both 2017 and Non-hydropower renewables are forecast to provide 9% of electricity generation in 2017 and 10% in Page - 162
163 2017 Integrated Resource Plan Pulverized Coal Technology Summary and Costs Technology and Fuel Characteristics Benefits Risks Construction Lead Time Sub-Critical Design, Pulverized Coal Unit capacity can range in size from 250 to 600 MW. Performance characteristics range anywhere from 9,500 to 10,500 Btu per kwh. Annual capacity factors for these units range from 80 to 90% Units Mature technology. Fuel price stability and abundant supply. Resources are used to serve base load obligations. Coal plant plants are often used for system regulation and meeting spinning reserve requirements. Coal plants are typically sited in remote locations requiring high capital investment in both plant and transmission. High CO2 emissions risk and high cooling water requirements. 7 Years Integrated Gasification Combined-Cycle (IGCC) Technology and Fuel Characteristics Benefits Risks Combined Cycle Plants, Coal Gasification Newer technology. Unit capacity can range in size from 400 to 600 MW. Performance characteristics range anywhere from 9,000 to 11,000 Btu per kwh. Annual capacity factors for these units average 75% Designs that incorporate carbon capture and storage (CCS) are projected to be less expensive than coal facilities equipped with CCS. Higher capital costs than other coal and natural gas resources. Carbon capture and storage technology unproven. Construction Lead Time 8 Years for IGCC without CCS, 9 Years for IGCC with CCS Page - 163
164 Tucson Electric Power Coal Market Prices TEP currently has ownership shares in four coal-fired power plants in Arizona and New Mexico, most of which are under long-term contracts for coal supply. Chart 35 TEP Coal Price Assumptions $4.50 $4.00 $3.50 $3.00 Nominal $/mmbtu $2.50 $2.00 $1.50 $1.00 $0.50 $ Baseline High Technology High Economy Page - 164
165 2017 Integrated Resource Plan Nuclear Resources When large-scale nuclear power plants went online over 60 years ago, it was a promising technology that delivered safe, reliable and most importantly, clean energy. In 2015, nuclear energy production was approximately 800 TWh or 20% of the total U.S. electric generation. The downside to nuclear power plants is the cost. The plants are expensive to develop, construct and expensive to operate. As the cost of renewable energy continues to decline and new technologies deliver low carbon power more reliably, the costs of nuclear plants become more unattractive. Combine these factors with projected low natural gas prices, nuclear becomes even more costly by comparison. In the last 5 years, a handful of nuclear power plants have been retired, including San Onofre in southern California in 2012 and Pacific Gas & Electric, owner and operator of Diablo Canyon Power Plant, announced that it will retire 2,160 MW when licenses expire in in 2024 and Small Modular Nuclear Reactors Small modular nuclear reactors (SMR), approximately one-third the size of current nuclear plants, are compact in size (300 MW or less) and are expected to offer many benefits in design, scale, and construction (relative to the current fleet of nuclear plants) as well as economic benefits. As the name implies, being modular allows for factory construction and freight transportation to a designated site. The size of the facility can be scaled by the number of modules installed. Capital costs and construction times are reduced because the modules are selfcontained and ready to be dropped-in to place. A World Nuclear Association 2015 report on SMR standardization of licensing and harmonization of regulatory requirements, said that the enormous potential of SMRs rests on a number of factors: Because of their small size and modularity, SMRs could almost be completely built in a controlled factory setting and installed module by module, improving the level of construction quality and efficiency. Their small size and passive safety features make them favorable to countries with smaller grids and less experience with nuclear power. Size, construction efficiency and passive safety systems (requiring less redundancy) can lead to easier financing compared to that for larger plants. Moreover, achieving economies of series production for a specific SMR design will reduce costs further. The World Nuclear Association lists the features of an SMR, including: Small power, compact architecture and usually employment of passive concepts (at least for nuclear steam supply system and associated safety systems). Therefore, there is less reliance on active safety systems and additional pumps, as well as AC power for accident mitigation. The compact architecture enables modularity of fabrication (in-factory), which can also facilitate implementation of higher quality standards. Lower power leading to reduction of the source term as well as smaller radioactive inventory in a reactor (smaller reactors). Potential for sub-grade (underground or underwater) location of the reactor unit providing more protection from natural (e.g. seismic or tsunami according to the location) or man-made (e.g. aircraft impact) hazards. The modular design and small size lends itself to having multiple units on the same site. Page - 165

166 Tucson Electric Power Lower requirement for access to cooling water therefore suitable for remote regions and for specific applications such as mining or desalination. Ability to remove reactor module or in-site decommissioning at the end of the lifetime The World Nuclear Association website has detailed information related to SMRs. The website is located at: Figure MWe NuScale Power Module NuScale Power TM is developing 50 MWe modules that can be scaled up to 600 MWe (12 modules). The scalability of SMRs allows for small utilities like TEP to consider their viability while lessening the financial risk. In December of 2013, NuScale was awarded a grant by the DOE that would cover half (up to $217 million) to support development and receive certification and licensing from the Nuclear Regulatory Commission (NRC) on a single module. In the fall of 2014, NuScale signed teaming agreements with key utilities in the Western region, which include Energy Northwest in Washington State and the Utah Association of Municipal Power Systems (UAMPS), representing municipal power systems in Utah, Idaho, New Mexico, Arizona, Washington, Oregon, and California. This initial project, known as the UAMPS Carbon Free Power Project, would be sited in eastern Idaho and is being developed with partners UAMPS, which will be the plant owner, and Energy Northwest, which will be the operator. The team expects that the 12-module SMR will be operation in Page - 166

167 2017 Integrated Resource Plan Figure 31 - NuScale Cross-section of Typical NuScale Reactor Building Permitting and Time to Commercial Operation As mentioned above, the UAMPS Carbon Free Power Project is expected to be in operation by The project timeline and milestone targets are tightly coordinated to complete the project in 11 years. Design and engineering is complete in the first 7 years and it overlaps with the licensing timeline. Construction and fabrication spans the remaining 5 years of the schedule. SMR Technology Summary Technology and Fuel Small Modular Nuclear Reactor (SMR), Plutonium Characteristics Benefits Risks Unit Capacity can range in size and modules are combined to achieve economy of scale. SMR is typically considered under 300 MW. Base-load type capacity factors (95%). NuScale Power is developing a power plant with funding and partnership with the DOE. Zero emissions and high capacity factors. Modular and factory-built, assembled on site. High capital costs and no large scale production. Prototypes are being developed. Spent nuclear fuel disposal and maximum security required. Construction Lead Time 11 years Page - 167
168 Tucson Electric Power Page - 168
169 2017 Integrated Resource Plan GRID BALANCING AND LOAD LEVELING RESOURCES CHAPTER 7 Energy Storage New challenges presented by greater amounts of renewable generation have prompted a greater interest in electric energy storage. The term Energy Storage System (ESS) covers many different types of technology. Each technology has specific attributes and applications that lead to using them based on individual system requirements for an identified need. The energy storage technologies are made up of systems such as pumped hydro, compressed air energy storage, various types of batteries, and flywheels. Pumped Hydro-Power This technology has been in use for nearly a century worldwide. Pumped hydro accounts for most of the installed storage capacity in the United States. Pumped hydro plants use lower cost off-peak electricity to pump water from a low-elevation reservoir to a higher reservoir. When the utility needs the electricity or when power prices are higher, the plant releases the water to flow through hydro turbines to generate power. Typical pumped hydro facilities can store enough water for up to 10 or more hours of energy storage. Pumped hydro plants can absorb excess electricity produced during off-peak hours, provide frequency regulation, and help smooth the fluctuating output from other sources. Pumped hydro requires sites with suitable topography where reservoirs can be situated at different elevations and where sufficient water is available. Pumped hydro is economical only on a large (250-2,000 MW) scale, and construction can take several years to complete. The round-trip efficiency of these systems usually exceeds 70 percent. Installation costs of these systems tend to be high due to siting requirements and obtaining environmental and construction permits presents additional challenges. Pumped hydro is a proven technology with high peak use coincidence. Page - 169
170 Tucson Electric Power Compressed Air Energy Storage (CAES) A leading alternative for bulk storage is compressed air energy storage. CAES is a hybrid generation/storage technology in which electricity is used to inject air at high pressure into underground geologic formations. CAES can potentially offer shorter construction times, greater siting flexibility, lower capital costs, and lower cost per hour of storage than pumped hydro. A CAES plant uses electricity to compress air into a reservoir located either above or below ground. The compressed air is withdrawn, heated via combustion, and run through an expansion turbine to drive a generator. The dispatch typically will occur at high power prices but also to meet system needs. CAES plants can use several types of air-storage reservoirs. In addition to salt caverns, underground storage options include depleted natural gas fields or other types of porous rock formations. EPRI studies show that more than half the United States has geology potentially suitable for CAES plant construction. Compressed air can also be stored in above-ground pressure vessels or pipelines. The latter could be located within right-ofways along transmission lines. Responding rapidly to load fluctuations, CAES plants can perform ramping duty to smooth the intermittent output of renewable generation sources as well as provide spinning reserve and frequency regulation to improve overall grid operations. Batteries Several different types of large-scale rechargeable batteries can be used for ESS, including lead acid, lithium ion, sodium sulfur (NaS), and redox flow batteries. Batteries can be located in distribution systems closer to end users to provide peak management solutions. An aggregation of large numbers of dispersed battery systems in smart-grid designs could even achieve near bulk-storage scales. In addition, if electric and plug-in hybrid electric vehicles become widespread, their onboard batteries could be used for ESS, by providing some of the supporting or ancillary services in the electricity market, such as providing capacity, spinning reserve, or regulation services, or in some cases, by providing load-leveling or energy arbitrage services by recharging when demand is low to provide electricity during peak demand. Flywheels These rotating discs can be used for power quality applications since they can charge and discharge quickly and frequently. In a flywheel, energy is stored by using electricity to accelerate a rotating disc. To retrieve stored energy from the flywheel, the process is reversed with the motor acting as a generator powered by the braking of the rotating disc. Flywheel systems are typically designed to maximize either power output or energy storage capacity, depending on the application. Low-speed steel rotor systems are usually designed for high power output, while high-speed composite rotor systems can be designed to provide high energy storage. A major advantage of flywheels is their high cycle life more than 100,000 full charge/discharge cycles. Scale-power versions of the system, a 100 kw version using modified existing flywheels which was a proof of concept on approximately a 1/10th power scale, performed successfully in demonstrations for the New York State Energy Research and Development Authority and the California Energy Commission. Page - 170


171 2017 Integrated Resource Plan Energy Storage Applicability Although the list of energy storage technologies discussed above is not all-inclusive, it begins to illustrate the point that not every type of storage is suitable for every type of application. Typical use applications for energy storage technologies may include: Energy Management Batteries can be used to provide demand reduction benefits at the utility, commercial and residential level. Batteries can be designed to replace traditional gas peaking resources. They can also be used as short-term replacement during emergency conditions. Load and Resource Integration Energy storage systems can be designed to smooth the intermittency characteristics of specific loads and/or renewable energy systems. Ancillary Services Flywheels, batteries and pumped hydro have the potential to balance power and maintain frequency, voltage and power quality at specified tolerance bands. Grid Stabilization Pumped Hydro, CAES and various batteries can improve transmission grid performance as well as assist with renewable generation stabilization. NextEra Energy Resources (10 MW) Lithium nickel-manganese-cobalt battery DeMoss Petrie Substation In-service January 2017 Ancillary Service Target: Frequency Response 10 MW In 10 seconds to 15 minutes (2.5 MWh) Page - 171
172 Tucson Electric Power Because of the different use case potentials the technologies can be implemented in a portfolio strategy. There are four challenges related to the widespread deployment of energy storage: Cost Competitive Energy Storage Technologies (including manufacturing and grid integration) Validated Reliability & Safety Equitable Regulatory Environment Industry Acceptance TEP shows the need to develop a portfolio of future storage technologies that will support long-term grid reliability. The need for future storage technologies is focused on supporting the need for quick response time ancillary services. These services are listed below: Load Following/Ramping Regulation Voltage Support Power Quality Frequency Response Figure 32 Energy Storage Value Proposition Page - 172
173 2017 Integrated Resource Plan Energy Storage Technology Summary Batteries Technology and Fuel Batteries Characteristics Benefits Risks Various storage chemistries and energy/power configurations are available. High degree of flexibility in terms of siting, application (e.g., energy vs ancillary services), and scalability. Single systems can serve multiple purposes. Prices for most battery types are rapidly declining. Levelized costs are still higher than other forms of energy storage, industry standards are still evolving, and some benefits can be difficult to monetize. Construction Lead Time Pumped Hydro Technology and Fuel Characteristics Benefits Risks Construction Lead Time 6 months. Pumped Hydro Water is pumped from a lower reservoir to a higher reservoir, and the energy is recovered by releasing the water through hydro turbines. Mature technology capable of storing large amounts of energy for use over many hours at a time. Requires suitable topography for the upper and lower reservoirs and a large upfront capital investment. 5 years. Compressed Air Energy Storage Technology and Fuel Compressed Air Energy Storage (CAES) Characteristics Benefits Risks Construction Lead Time Air is compressed, typically in underground geologic formations, and the energy is recovered by using the compressed air to supply a combustion turbine. Mature technology capable of storing large amounts of energy for use over many hours at a time. Very little commercial experience and requires a large up-front capital investment. 3 years. Page - 173
 and combustion turbines (CTs) are the preferred technology that will assist in mitigating renewable energy intermittency and variability.")
174 Tucson Electric Power Fast Response Thermal Generation TEP s 30% by 2030 renewable energy target will necessitate the construction or acquisition of fast-responding generating resources. Reciprocating internal combustion engines (RICE) and combustion turbines (CTs) are the preferred technology that will assist in mitigating renewable energy intermittency and variability. RICE have quicker start-up and ramping capabilities than most CTs. Aeroderivative CTs are based on aircraft jet engine design with increased cycling capabilities. These units can ramp faster than large frame combustion turbines making them well-suited for peaking and load-following applications. Large frame CTs have higher heat rates than aeroderivative and RICE but they produce higher temperature exhaust, so it makes them more suitable for combined cycle configurations. Reciprocating Internal Combustion Engines RICE are simply combustion engines that are used in automobiles, trucks, railroad locomotives, construction equipment, marine propulsion, and backup power applications. Modern combustion engines used for electric power generation are internal combustion engines in which an air-fuel mixture is compressed by a piston and ignited within a cylinder. RICE are characterized by the type of combustion: spark-ignited, like in a typical gas powered vehicle or compression-ignited, also known as diesel engines. Figure 33 Wartsila-50SG An emerging use of these engines is in large-scale electric utility generation. The combustion engine is not a new technology but advances in efficiency and the need for fast-response generation make it a viable option to stabilize variable and intermittent electric demand and resources. RICE has demonstrated a number of benefits; Page Fast Start Times The units are capable of being on-line at full load within 5 minutes. The fast response is ideal for cycling operation. RICE can be used to smooth out intermittent resource production and variability. Run Time - The units operate over a wide range of loads without compromising efficiency, and can be maintained shortly after shut down. After shut down, the unit must be down for 5 minutes, at a minimum to allow for gas purging. Reduced O&M Cycling the unit has no impact on the wear of RICE. The unit is impacted by hours of operation and not by starts and cycling operations as is the case with combustion turbines. Fast Ramping At start, the unit can ramp to full load in 2 minutes on a hot start and in 4 minutes on a warm start. Once the unit is operational, it can ramp between 30% and 100% load in 40 seconds. This ramping is comparable to the rate that many hydro facilities can ramp at.

175 2017 Integrated Resource Plan Minimal Ambient Performance Degradation Compared to Aeroderivative and Frame type combustion turbines, RICE output and efficiency is not as drastically impacted by temperature. The site altitude does not significantly impact output on RICE below 5,000 feet mean sea level. Gas Pressure RICE can run on low pressure gas, as low as 85 PSI. Most CT s require a compressor for pressure at 350 PSI. Reduced Equivalent Forced Outage Rate ( EFOR ) Each RICE has an EFOR of less than 1%. A facility with multiple RICE will have a combined EFOR that is exponentially less by a factor of the number of units at the facility. Low Water Consumption RICE use a closed-loop cooling system that requires minimum water. Modularity Each RICE unit is built at approximately 2 to 20 MWs and is shipped to the site. An intriguing application for RICE is its potential for regulating the variability and intermittency of renewable resources. Figure 34 Reciprocating Internal Combustion Engine Facility Page - 175
176 Tucson Electric Power RICE Technology Summary Technology and Fuel Reciprocating Internal Combustion Engine (RICE), Natural Gas or Diesel Characteristics Benefits Risks Unit capacity can range in size, TEP is evaluating 10 and 20 MW sized units that run on natural gas. Expected heat rate is approximately 8,000 Btu/kWh. These engines have a proven performance record as they ve been used in marine crafts for decades. The units scaled for electric generation will deliver load-serving and grid-balancing services. The units are quick starting and fast responding. RICE meets the need for peak capacity and more importantly for fast response to renewable intermittency and variability. The units use circulating water for cooling and therefore require minimal water. RICE is modular in size and can start within 2 to 5 minutes. Natural gas price volatility Construction Lead Time 2 years Large Frame Combustion Technology Summary Technology and Fuel Characteristics Benefits Risks Construction Lead Time Combustion Turbines (Large Frame), Natural Gas Unit capacity can vary from 50 to 350 MW. Expected heat rate can range from 9,300 Btu/kWh for the larger units while the smaller units demonstrate a heat rate near 11,000 Btu/kWh. Typical start time is slower than RICE or Aeroderivative but equipment options from manufacturers can bring them closer. Large frame CTs can meet a need for intermediate and base-load applications. The units can be coupled for combined-cycle generation. Capital cost per kw are below Aeroderivative and RICE. Natural gas price volatility 2.5 years Page - 176
177 2017 Integrated Resource Plan Aeroderivative Combustion Turbine Technology Summary Technology and Fuel Characteristics Benefits Risks Combustion Turbines (Aeroderivative), Natural Gas Unit capacity can vary from 20 to 100 MW. Performance during summer peak conditions is approximately 10,000. Faster start and ramp than large frame simple cycle CTs Meet the need for peaking capacity and load following applications. The units can be sited locally and help to reduce transmission infrastructure. Reduced water consumption. Natural gas price volatility Construction Lead Time 3 years Demand Response Demand Response refers to a class of programs offered by the utility to incentivize customers, generally C&I customers with high energy demand, to reduce their energy demand (kw) based on system needs. DR programs may be used to support standard benefits which include avoided firm capacity required to meet reserve requirements, reduced or avoided open-market power purchases during periods of high energy prices, and greater grid stability and reduction in outages due to reduced grid demand. Although DR has traditionally been focused on providing capacity through a reduction (i.e. curtailment) in customer demand during peak periods, it is increasingly being considered for additional services such as ramping or load leveling, wherein energy demand is rescheduled versus curtailed. Customers enter into DR agreements voluntarily and in doing so receive a financial incentive, such as a reduced electricity rate, in exchange for committing some portion of their energy demand to the utility s control. These agreements typically have limitations including the amount of energy demand the customer commits to the utility, as well as the number and duration of events during which the utility can call on the demand reductions. Some agreements even provide customers the option to opt out of a particular call event, which makes certain portion of the DR capacity less than 100% dispatchable. Strategies used by customers under DR agreements include: Reduction of HVAC load Reduction of other mechanical load (compressors, motors) Reduction of lighting load Curtailment of production lines Page - 177
178 Tucson Electric Power The specific strategies that customers use to meet their DR commitments will depend on certain external conditions such as time of day, season, weather, etc., and can also depend on the amount of advance notice provided by the utility. Because customers have energy needs specific to their line of business, DR programs are most effective at meeting predictable utility needs such as summer peak where a utility can provide a dayahead notice based on high forecast temperatures. DR is less effective (i.e. less dispatchable) at meeting unexpected or intermittent energy demands. Demand Response Technology Summary Technology Characteristics Benefits Risks Utility installed thermostats and switches at customer site used to control customer demand. The goal of DR is to reduce customer peak demand rather than overall energy use. Programs target summer peak periods to offset the utilities need to procure additional resource capacity. Programs may utilize cycling methodologies, load shifting, or direct interruption during summer peaks or system emergencies. Depending on program design, DLC is often utilized as a dispatchable resource as part of utility operations. Can decrease utility ramping demand as well as well as load leveling and providing peak capacity, potentially deferring or delaying the need for additional generation or transmission capacity. Challenges include limited customer participation, minimum yearly call options and low dispatch duration. Program Lead Time 1 Year Rate Design One element of the provision of electric utility services that affects customer usage patterns and, therefore, impacts future capacity needs is retail rate design. However, consideration of the impact of rate design on resource planning is often neglected in the IRP process. This section provides an overview of approaches to retail rate design that may affect future resource needs and should be considered as components of the IRP process. The two broad rate design categories discussed in this section are demand rates and time-varying rates. That is followed by a brief discussion of the effects of increased penetration of DG on system operations and future capacity needs and the implications for rate design. The section ends with an overview of TEP s approach retail rate design as it relates to resource planning. Page - 178
179 2017 Integrated Resource Plan Demand Rates The most basic electric utility rate design is the two-part rate, which consists of a fixed basic service charge and volumetric energy charges assessed on the kwh consumed during a billing period. Most residential and small commercial customers receive service on a two-part rate structure. Demand rates, or three-part rates, assess charges on a customer s peak demand during a billing period in addition to a fixed charge and volumetric energy charges. The peak demand upon which the customer is billed may be measured as the customer s maximum kw over time intervals ranging from instantaneous to a one-hour interval. Billing demand may also be defined as the maximum demand over the entire billing period or only during defined on-peak periods and may incorporate a demand ratchet. A demand ratchet further defines billing demand as the maximum of measured demand and some percentage of maximum billing demand for a set number of prior billing periods. Because system peak demand is a major driver in the need for additional generating capacity, charging customers directly for their contribution to system peak may provide a price signal that reduces peak demand and therefore results in delaying the need for future capacity additions. Medium and large commercial customers and industrial customers usually take service on some variation of a three-part demand rate. Time-Varying Rates Time-varying rates, if designed properly, may be used to induce load shifting from peak to off-peak periods by providing a price signal that results in higher prices during peak periods and lower prices during off-peak periods. Shifting loads may reduce the need for additional capacity by reducing the need for energy supply at peak times. Time-varying rates may also be used in a three-part demand rate structure and both the demand and energy components of the rate design can have time-varying elements. Time-varying electric rates include Time-of-use (TOU) rates, critical peak pricing, and real-time pricing (RTP). TOU is the most basic and by far the most commonly used of time-varying approaches to retail electric pricing and consists of pre-defined peak and off-peak time periods with differentiated pricing for each. RTP is the most sophisticated and variable approach, with hourly prices determined by day-ahead market prices or real-time spot market prices for electricity. Critical peak pricing rates are fixed rates where customers are charged higher prices during peak demand events that are announced in advance. A variation of critical peak pricing is a pricing regime where customers receive a rebate for reducing usage during a pre-announced peak demand event. Distributed Generation The increased penetration of DG, predominantly rooftop solar, in the TEP service area creates some challenges for both system operations and system capacity planning and the Company recognizes the need to adapt its rate design to address these challenges. The peak period for rooftop solar production occurs during midday and does not coincide with the TEP system peak periods, which occur in the late afternoon during the summer and morning and late afternoon to early evening during the winter. As a result, rooftop solar energy output is highest on the system during midday when energy resources are abundant. However, increasing solar generation may have only a minor impact on reducing system peak demand. Therefore, future rate designs should focus more on shifting consumption away from the system peak periods into the periods of peak solar production, which has the benefit of improving system load factor and operations and also alleviates the need for future capacity additions to serve peak demand. From a rate design perspective, combining TOU rates with demand rates and expanding off-peak hours to include more hours with abundant rooftop solar energy will serve to modernize utility rate design and address the challenges put forth by increased DG development. Page - 179
180 Tucson Electric Power TEP Rate Design Currently, TEP offers optional TOU rates to all retail customer classes except Large Power Service (LPS) customers who take service only on a TOU rate. Residential and Small General Service customers have historically taken service on two-part rates and the LGS and LPS customer classes have mandatory three-part demand rate structures. TEP has formed a Medium General Service (MGS) customer class where customers will be moved predominantly from the Small General Service class and placed on a three-part demand rate following a transition period. TEP recognizes the impacts that increasing rooftop solar penetration will have on system load shapes and the challenges that poses for system operations and capacity planning. In the Company s 2015 rate case, TEP proposed, and the ACC approved, several changes to its existing retail rates to address these challenges with a more modern rate design. For example, TEP expanded rate options for Residential and Small General Service customers to include three-part demand rates. These rate options also have TOU variants for energy charges and billing demand is defined as the maximum one-hour measured kw demand during on-peak periods for all options. In addition, TEP expanded the summer and winter off-peak hours in its Residential TOU and Residential TOU demand rate tariffs. More information can be found at TEP s website: Page - 180

181 2017 Integrated Resource Plan Desert Southwest Wholesale Power Markets - Transformation Wholesale Power Market Overview Historically, the wholesale power markets have served the Desert Southwest as an efficient mechanism for utility operators to buy and sell standard market-based products as a means to optimize their resource portfolios. However, with the rapid increase in renewable resource penetration throughout the region, a transformation of market fundamentals is currently underway and is changing how both load-serving entities and wholesale merchants transact within these markets. While these changes will have economic implications for day-ahead and real-time operations, resource portfolios of the future will also need to adapt with fast start, fast-ramping, flexible generation in order to take advantage of short duration price fluctuations in order to minimize portfolio costs for customers. Non-Dispatchable Renewable Must Run Resources Because most solar and wind resources are non-curtailable resources, utility operators must dispatch around the solar and wind output. In today s wholesale power markets, solar generation typically displaces on-peak generation, causing a downward shift in market prices from the hours of 8 AM to 4 PM. In some hours throughout the year, this surplus power results in the market clearing price going negative due to generation exceeding system demand. Chart 36 Impact of Solar Surplus on the Wholesale Power Markets Page - 181
182 Tucson Electric Power Impacts on Baseload Generation Resources In addition to surplus renewable generation, low cost shale gas production has also played a significant role in transforming the supply and demand economics of natural gas. As we saw in 2015 and 2016, expanded natural gas production from shale formations is directly impacting the economic viability of many baseload coal and nuclear resources. Unlike renewables, most thermal plants like coal and nuclear, have higher operating costs that cannot be fully recovered in the wholesale market. Thus, the ultimate effect of high penetrations of renewables and low cost natural gas will likely be an accelerated retirement of older and higher cost coal and nuclear resources. Alternatively, resources like NGCC units that have lower operating costs are more competitive in today s wholesale power markets. This competitive advantage will likely set the stage for NGCC units to displace coal and nuclear as baseload resources since they are better positioned to maintain profitability in a market driven by low natural gas prices. Chart 37 - Comparisons of Coal vs. Natural Gas Combined Cycle Resources Page - 182
183 2017 Integrated Resource Plan Reduction in Overall Natural Gas Demand and Commodity Prices In addition to the market changes listed above, renewable resources are dramatically reducing the power sector s overall demand for natural gas consumption. 30 Low load growth coupled with a higher penetration of renewable energy and historically low natural gas prices, have resulted in low wholesale power prices during the last two years. This trend is likely to continue for some time due to the increased efficiencies in shale production and the declining cost of renewable energy resources, which are below the cost of traditional fossil fuel resources on a long-term levelized basis. As noted in the Wood MacKenzie Base Case, despite uncertainty regarding U.S. energy policy changes, recent analysis suggests low natural gas prices are one of the biggest disruptors of the power sector. This low price trajectory will cause natural gas to increasingly displace coal in the foreseeable future. Because of this trend and steady growth in renewables, wholesale power prices will likely stay depressed over the long term NREL Study: A Retrospective Analysis of the Benefits and Impacts of U.S. Renewable Portfolio Standards Long-term forecast projections based on Wood-Mackenzie, North America Gas, Power and Coal Markets No Carbon Case. February Page - 183
184 Tucson Electric Power Arizona Gas Storage Project As TEP reduces its reliance on coal, cleaner, more efficient natural gas will play a bigger role in maintaining the Company s grid operations. Today, TEP relies on the El Paso and Transwestern pipeline networks to deliver natural gas primarily from the San Juan and Permian supply basins to support its long-term, as well as real-time power generation needs. In other regions of the country, natural gas storage provides a reliability backstop to a multitude of pipeline operational constraints that can impact the delivery of natural gas. However, in Arizona there are currently no natural gas storage facilities. As part of the Company s 2017 IRP integration strategy, TEP is in the process of evaluating local natural gas storage as a resource which may in improve TEP s system reliability by meeting its future hourly gas balancing and generation ramping requirements as the Company integrates higher levels of renewable resources. Kinder Morgan 2017 Open Season On January 31, 2017, Kinder Morgan issued an open season 32 for an Arizona based natural gas storage project that would offer storage related services including no-notice transportation (NNT) 33. AGS project will consist of four to eight natural gas salt storage caverns to be located in Pinal County Arizona, near Eloy having an initial design working inventory of one (1) billion cubic feet (Bcf) per cavern for a total capacity of at least four Bcf and having a projected minimum aggregate injection capacity of 168, ,000 thousand cubic feet (Mcf) per day and a projected minimum aggregate withdrawal capacity of 400,000 Mcf per day. TEP is still evaluating the proposal from Kinder Morgan and will continue to evaluate proposals from entities which present the greatest opportunity for increasing system flexibility, and providing the greatest support for reliability at the least cost. 32 A natural gas construction project can take an average of about three years from the time it is first announced until the project is placed in service. The first step in the process is to conduct an open season to determine market interest. An open season is held for 1-2 months, giving potential customers an opportunity to enter into an agreement to sign up for a portion of the capacity rights that will be available. If enough interest is shown during the open season, the sponsors will develop a preliminary project design and move forward. If not enough interest is evident, the project will most likely be dropped or placed on indefinite hold. Notices/EPNG-Notices/NOTICE_16834_Arizona_Gas_Storage_Project.pdf 33 No-notice transportation services allow LDCs and utilities to receive natural gas from pipelines on demand to meet peak service needs for its customers, without incurring any penalties. These services include access to storage facilities that provide increased flexibility to receipt and delivery points on a real-time basis. Page - 184
185 2017 Integrated Resource Plan REGIONAL TRANSMISSION PLANNING CHAPTER 8 Overview Ninth Biennial Transmission Assessment TEP participates in the Biennial Transmission Assessment (BTA) conducted by the Commission to assess the adequacy of Arizona s transmission system to reliably meet existing and future energy needs of the state. The 9 th BTA concluded that the existing and planned transmission system is adequate to reliably serve the needs of the state during the study period. Reliability Must Run (RMR) Assessment An RMR condition exists for the Tucson load pocket because the TEP load exceeds the system import limit of the existing and planned transmission system. However, the projected load can be served through a combination of power imports and local generation. In the 7 th BTA, the Commission ordered the suspension of RMR studies pending review of criteria that will trigger restarting RMR studies. TEP has not met any of the criteria, therefore, RMR studies were not performed for the 9 th BTA. Ten Year Snapshot Study TEP participated in the Ten Year Snapshot Study conducted by the Southwest Area Transmission Arizona Subcommittee (SWAT-AZ) participants. This study concluded that the Arizona 2025 transmission plan is robust and can withstand simulated contingencies and that delaying any single planned project beyond 2025 did not have significant impact on system performance. Extreme Contingency Study TEP conducted powerflow analysis of outages involving TEP corridors that include 3 or more lines and TEP substations that include 3 or more transformers with a low side voltage of 100kV and higher. This evaluation is considered Critical Energy Infrastructure Information (CEII) and was filed with the Commission under a confidentiality agreement. Effects of Distributed Generation and Energy Efficiency Programs As required in the 8 th BTA, TEP performed a sensitivity analysis to determine the effects of DG and EE programs on future transmission needs. This analysis determined that no additional transmission facilities are required due to these programs. Page - 185

186 Tucson Electric Power WestConnect TEP actively participates in WestConnect regional planning and interregional coordination activities in compliance with FERC Order WestConnect is one of four planning regions that was established to develop and implement FERC approved regional planning processes designed to facilitate joint regional transmission planning among the transmission owning entities that participate in the WestConnect Planning Region. Participants may join one of five sectors consisting of the Transmission Owner with Load Serving Obligations (TOLSO) 34, Transmission Customer, Independent Transmission Developer (ITD), State Regulatory Commission and Key Interest Group. Currently there are eighteen (18) Transmission Owners in the TOLSO sector, eight (8) developers in the ITD sector and one (1) participant in the Key Interest Group. The Transmission Customer and State Regulatory Commission sectors have no participants. Members of sectors participate in WestConnect governance that consists of the Planning Management Committee (PMC) with subcommittees including Planning Subcommittee (PS), Cost Allocation Subcommittee (CAS), Contracts and Compliance Subcommittee and Legal Subcommittee. TEP is active on the PMC, PS and CAS as well as on various task forces as required. WestConnect s regional planning process is biennial and is implemented according to the following timeline. Figure 35 - WestConnect Planning Timeline Coordination with the other three Western Planning Regions (CAISO, Columbia Grid (CG) and the Northern Tier Transmission Group (NTTG)) occurs throughout the process beginning with development of the study plan. The footprints of the respective Western Planning Regions (WPR) are shown in the following Western Planning Regions map. 34 TEP / UNSE is an enrolled member of TOLSO. Page - 186

 as approved by the WECC Board on December 6, 2016.")
187 2017 Integrated Resource Plan Map 11 - Western Planning Regions Participating in WestConnect and interregional coordination activities is essential to maintaining data and modeling accuracy and to ensuring consistency among local, regional and Western Interconnection-wide transmission plans. Coordination with WECC, as described in the following section is evolving. WECC TEP participates on the Planning Coordinating Committee (PCC) and Transmission Expansion Planning Policy Committee (TEPPC), as well as their respective subcommittees. These committees are in the process of being replaced by the Reliability Assessment Committee (RAC) as approved by the WECC Board on December 6, The approved proposal states, The RAC would replace the current TEPPC and PCC and assume responsibility for all products currently under the purview of both committees. The RAC would be a single reliability Page - 187
188 Tucson Electric Power assessment organization within WECC that would facilitate a unified approach to evaluating potential reliability risks and efficiently use stakeholders expertise. 35 RAC governance is accomplished through four subcommittees consisting of the Scenario Development, Studies, Modeling and Data Subcommittees reporting to the RAC. Representation on each of the subcommittees includes a single member representing the four WPR plus two International Planning Regions (IPR) 36, along with the other participants as described in the WECC Board approved RAC proposal. The key deliverable of RAC is a process to create an Anchor Data Set (ADS) that will begin and conclude with the biennial Transmission Plans of the WPR. The ADS will be a combination of solved power flow and production cost models that may be used by WECC, the WPR s and other entities as a consistent starting point for reliability assessment and other regional studies. TEP participated with WestConnect on development of the ADS process in collaboration with the other three WPR and WECC. Multi-Regional & Interconnection-Wide Transmission Planning TEP participates in the Southwest Area Transmission (SWAT) Group that is comprised of transmission regulators/governmental entities, transmission users, transmission owners, transmission operators and environmental entities. SWAT Transmission Owner membership systems are included in the states of Texas (El Paso), New Mexico, Arizona, Nevada and California. SWAT participates in the WestConnect regional planning process, representing its members, primarily in coordinating model development. The initial investigation of the implications of pending EPA rules was coordinated through SWAT. This study effort was subsequently expanded to the systems in WestConnect, California and beyond. SWAT created a Coal Reduction Assessment Task Force (CRATF) in February 2013 for the purpose of assessing the reliability impacts of anticipated as well as hypothetical coal retirements in the southwest. In the Eighth BTA, the CRATF reported on the first phase of a reliability study and was ordered in Decision No to file the results of the study within 30 days of completion. Currently being led by TEP, the ultimate goal is to evaluate the impacts from reduced availability of coal generation within the scope and timeline of the WestConnect Regional Study Plan. TEP participated with Arizona Electric Power Cooperative (AEPCO), Arizona Public Service Company (APS), SRP and the Western Area Power Administration (WAPA), in developing a realistic Arizona Utility Clean Power Plan (CPP) Compliant scenario that was submitted to WestConnect. The WestConnect PMC adopted that scenario as a WestConnect Utility scenario that is currently in the process of evaluation, along with other higher renewable penetration/coal retirement scenarios, to identify transmission system opportunities. The WestConnect cases and study work will be used to assess the impact of the CPP on the reliability of the Arizona transmission system as ordered by the ACC in the 9 th BTA. The objective of coordinating with the WestConnect biennial regional planning process was to gain access to the most current and accurate data sets for the systems surrounding Arizona. Evolving Resource Mix Challenges The Arizona transmission system was designed to accommodate the large coal generation fleet that is geographically distant from the load centers. The integration of renewable energy projects and the simultaneous reduction of coal resources is likely to have an impact on the operation of the transmission grid. 35 Source: Recommendation 1. Create a Reliability Assessment Committee (RAC) of the JPTRTF Proposal Revised October 5, The IPR include the Baja Mexico and western Canadian regions. Page - 188
189 2017 Integrated Resource Plan The loss of system inertia and dynamic reactive capability, as well as changes in power flows, pose significant risks and updates should continue to be filed in the BTA process. TEP gave a presentation at the RETI 2 Western Outreach Workshop in Las Vegas on September 1, The main purpose was, to better understand the transmission implications of accessing renewable energy from elsewhere in the West, as well as identifying potential markets for California's own excess renewable energy production that may help meet California s 2030 RPS and GHG goals most efficiently. Key concerns expressed by TEP were: An Integrated Regional Resource Plan that defines the necessary energy resources and transmission assets with a coordinated strategy to deploy them does not yet exist Such an Integrated Regional Resource Plan is necessary to conduct comprehensive regionally coordinated reliability studies. Short timeline for expected rate of renewable resource deployment and coal plant retirements Key Issues: Coal Plant Retirements/Replacement Resources are uncertain Changing California Imports/Exports driven by Nuclear and Gas OTC Retirements, Increasing Renewable Penetration and Wind Resources from New Mexico & Wyoming Loss of inertia associated with coal plant shutdown, resulting in possible stability and/or frequency response impact Change in generation pattern and resource mix will impact Path Ratings New requirements that include, but are not limited to, ramping, frequency response, voltage regulation and dynamic reactive capability will have to be determined through separate studies among the regions. Therefore TEP is interested in obtaining frequency response and stability information based on system analyses that take rapidly changing operating conditions resulting from high renewable resource penetration, coal- and gas-fired generation retirements and materially revised resource mix into consideration. Such analysis is intended to be used to identify additional alternative market mechanisms based on demonstration of actual anticipated physical transmission system benefits. These efforts will require further continued coordination and cooperation among the Arizona utilities and stakeholders, SWAT, WestConnect, the other WPR and IPR, and WECC. The ADS will be among the most critical assets to allow credible analyses to be completed to inform resource and transmission planning decisions. Page - 189

190 Tucson Electric Power Other Regional Transmission Projects Other large projects proposed for interconnection in eastern and southeastern Arizona may influence TEP s long-term resource planning decisions. Nogales DC Intertie The Nogales Interconnection Project is a proposed direct current interconnection, commonly known as a DC tie, which will allow for an asynchronous interconnection between the electric grids in southern Arizona and the northwest region of Mexico. The project will support the reliability of the electric system, including providing bidirectional power flow and voltage support, as well as emergency assistance, as needed, for the electric system both north and south of the border. Map 12 - Nogales DC Intertie Study Area and Route The first phase would consist of a new 150 MW DC tie located on property currently owned by TEP; a new 3- mile 138 kilovolt (kv) transmission line that would originate at UNSE's Valencia Substation in Nogales, Arizona and extend to the west and south to the new Gateway Substation; and a new approximately 2-mile 230 kv transmission line that would extend south from the Gateway Substation to the U.S.-Mexico border where it would interconnect with a transmission line to be constructed in Mexico. The second phase would expand the DC Tie capacity to 300 MW. The timing of the second phase is not yet certain. Page - 190

191 2017 Integrated Resource Plan Picture 1 Sharyland HVDC on the Texas-Mexico Border SunZia Southwest Transmission Project SunZia is a double-circuit 500 kv line that will originate in central New Mexico at a proposed substation near Ancho, New Mexico and terminate at the proposed Pinal Central substation near Casa Grande, Arizona. It is being planned to provide New Mexico and Arizona additional access to renewable energy resources. SunZia could increase import capacity from New Mexico by as much as 3,000 MW. The SunZia Southwest Transmission Project is planned to be approximately 515 miles of two single-circuit 500 kv transmission lines and associated substations that interconnect SunZia with numerous 345 kv lines in both states. SunZia will connect and deliver electricity generated in Arizona and New Mexico to population centers in the Desert Southwest. The electricity distributed by SunZia should help meet the Southwest Region and California s demand for renewable energy. On January 23, 2015, the BLM issued a Record of Decision (ROD) that approved SunZia s application for a rightof-way across federally owned property. The ROD concluded the six and half year effort to comply with NEPA. Page - 191

192 Tucson Electric Power Map 13 - Sunzia Proposed Project Route The Southline Transmission Project The Southline Transmission Project is a proposed transmission line designed to collect and transmit electricity across southern New Mexico and southern Arizona, bringing potential electric system benefits to the Desert Southwest. The project is being designed to minimize land and resource impacts by developing a route along existing linear features and by upgrading existing transmission lines where feasible. The project will provide up to 1,000 megawatts of transmission capacity in both directions, and will interconnect with up to 14 existing substation locations. The project consists of two sections: The New Build Section would involve the construction of approximately 240 miles of new 345kV double-circuit electric transmission lines in New Mexico and Arizona. The New Build is defined by end points of the existing Afton Substation, south of Las Cruces, New Mexico, and the existing Apache Substation, south of Wilcox, Arizona. The Upgrade Section would consist of double-circuit 230-kV lines connecting the Apache Substation to the existing Saguaro Substation northwest of Tucson, Arizona. The Upgrade Section would rebuild approximately 120 miles of existing single-circuit 115-kV transmission lines, currently owned by WAPA, providing up to 1,000 MW of transmission capacity between these substations. A new line segment approximately 2 miles in length will be required to interconnect with the existing TEP Vail Substation, located just north of the existing Western line. The upgrade section will also interconnect at TEP s Tortolita and DeMoss Petrie substations. Page - 192

193 2017 Integrated Resource Plan Map 14 - Southline Proposed Project Route Western Spirit Clean Line The Western Spirit Clean Line will collect renewable power from east-central New Mexico and deliver approximately 1,000 MW of power to markets in the western United States that have a strong demand for renewable energy. The energy will be transported via an approximately 140-mile transmission line to the existing electric grid in northwestern New Mexico where it interconnects with the TEP transmission system at San Juan. Page - 193
 Rio Puerco substation.")
194 Tucson Electric Power Figure 36 - Western Spirit Clean Line Project The project will begin near Corona, New Mexico and will terminate northwest of Albuquerque at the Public Utility of New Mexico's (PNM) Rio Puerco substation. Clean Line and RETA have worked with a wide range of interested parties to select a route, including federal, state and county agencies, environmental NGOs, and Native American tribes. Clean Line will meet with each landowner affected by the Western Spirit Clean Line and will take landowner feedback into consideration when determining structure placements and possible route adjustments. Energy Imbalance Markets Energy imbalance on an electrical grid occurs when there is a difference between real-time demand, or load consumption, and generation that is prescheduled. Prior to the emergence of renewable energy technology on the grid, balancing occurred to correct operating limits within 30 minutes. Flows are often managed manually by system operators and typically bilaterally between power suppliers. The intermittent characteristics of wind and solar resources have raised concerns about how system operators will maintain balance between electric generation and demand in smaller than thirty minute increments. EIMs create a much shorter window market opportunity for balancing loads and resources. An EIM can aggregate the variability of resources across much larger footprints than current balancing authorities and across balancing authority areas. The sub hourly clearing, in some cases down to 5 minutes potentially provides economic advantage to participants in the market. EIMs propose to moderate, automate and effectively expand system-wide dispatch which can help with the variability and intermittency of renewable resources. EIMs boast to create significant reliability and renewable integration benefits by sharing resource reserves across much larger footprints. CAISO Energy Imbalance Market EIM On November 1, 2014, the CAISO welcomed PacifiCorp into the western EIM. Nevada-based NV Energy began active participation in the EIM on December 1, Recently Arizona based Arizona Public Service and Washington based Puget Sound Energy entered into the real-time market on October 1, This voluntary market service is available to other grids in the West. Several Western utilities have committed to join the EIM. Portland General Electric has filed their intent to join in October of Idaho Power has announced their intent to join the western EIM in April of In December of 2016, Seattle City Light signed an agreement to join the market in April of And Mexico grid operator CENACE has formally agreed to explore participation of its Baja California Norte grid in the market. Page - 194
195 2017 Integrated Resource Plan Participants in the EIM expect to realize at least three benefits: Produce economic savings to customers through lower production costs Improve visibility and situational awareness for system operations in the Western Interconnection Improve integration of renewable resources TEP contracted with the energy consulting firm E3 to perform a study to evaluate the economic benefits of TEP participating in the energy imbalance market. E3 evaluated the EIM benefits to TEP based on a set of study scenarios defined through discussions with TEP to reflect TEP system information, including loads, resources, and potential transmission constraints for access to markets for real-time transactions. The project analysis began in February 2016 and was completed in December, Results of the study place approximately two-thirds of any estimated saving occurring 7% of the time from extreme real-time pricing. With the size of TEP s generation fleet combined with 40% of TEP s generation limited from EIM participation due to system restrictions, TEP estimates an annual benefit of approximately $2.5 million. It is expected that this benefit will diminish over time. TEP has started the process of determining the relevant costs associated with joining the CAISO EIM market as well as evaluating what other western EIM market options may be available, if any. It is estimated that the cost analysis will be completed sometime during the summer of Page - 195

196 Tucson Electric Power Map 15 - CAISO EIM Map Page - 196

197 2017 Integrated Resource Plan Regional Transmission Organizations (RTOs) A group consisting of investor owned utilities, cooperative power providers and public power entities was formed to consider and analyze potential alternatives to joining the CAISO EIM. The group, known as the Southwest Regional EIM Alternatives Working Group ( Working Group ) was formed in order to evaluate the potential regional synergies and opportunities of joining or forming a regional market. Based on the recent expansion of the CAISO EIM, both in terms of participants and market opportunities, the Working Group recognized the need to evaluate the merits of the CAISO EIM and alternative market structures. The working group also recognized the need to evaluate the implications for existing bi-lateral markets and potential impacts to regional grid operations in the Southwest Map 16 - WestConnect Subregional Planning Groups Page - 197
198 Tucson Electric Power The Working Group includes AEPCO/ACES Energy Management; El Paso Electric Company (EPE); Public Service Company of New Mexico (PNM); SRP; Tri-State Generation and Transmission Association ( Tri-State ); TEP; UNSE; and WAPA. The objectives of the Working Group are as follows: Determine economic benefits of potential alternatives and weigh opportunities for market participation, Determine if the CAISO EIM and regulated markets in the Midwest and Mountain west offer certain economic benefits related to more efficient utilization of generating assets and transmission infrastructure, Evaluate operational benefits especially as they relate to renewable resource integration and system regulation, Establish if EIM/Regulated Markets and certain alternatives may offer reliability benefits related to the grid operations, and Consider governance structure and implications for resource control. The Working Group evaluated the costs and benefits of various regional market options including 1) establishing a regional market by joining an existing market, 2) establishing its own regional market or 3) a hybrid of the two options (i.e. using resources of an existing market operator to establish and operate a nascent southwest market). The Working Group discussed various options with the CAISO, the Southwest Power Pool, and the Mountain West Transmission Group. At this point there is recognizable value to establishing a regional market as well as potential benefits. However, the cost of joining or establishing a regional market have yet to be determined and fully evaluated. TEP will continue to engage with market operators to determine the best path forward for its customers. Page - 198
199 2017 Integrated Resource Plan CHAPTER 9 TEP EXISTING RESOURCES TEP s Existing Resource Portfolio This section provides an overview of TEP s existing thermal generation, renewable generation, and transmission resources. For the thermal generation resources it provides details on each station s ownership structure, fuel supply, environmental controls, historical emissions, and a brief future outlook. For the renewable generation resources, it provides capacity and technology information as well as certain details on the construction of the facilities. Information on connections to the bulk electric system is provided in the transmission section. In addition, this chapter highlights its current use of the wholesale power market for firm capacity resources. TEP s existing thermal resource capacity is 2,649 MW. In addition, the Company also relies on the wholesale market for firm capacity PPAs to meet its summer peak obligations. Table 18 below provides a summary of TEP s existing thermal resources. Table 18 - TEP Existing Thermal Resources Generating Station Unit Fuel Type Net Nominal Capability MW Commercial Operation Year Operating Agent TEP s Share % TEP Planning Capacity Springerville 1 Coal TEP Springerville 2 Coal TEP San Juan 1 Coal PNM San Juan 2 Coal PNM Navajo 1 Coal SRP Navajo 2 Coal SRP Navajo 3 Coal SRP Four Corners 4 Coal APS 7 55 Four Corners 5 Coal APS 7 55 Sundt Steam 1-4 Gas TEP Luna Energy Facility 1-2 Gas PNM Gila River 3 Gas TEP Combustion Turbines Gas/Oil TEP Total Planning Capacity 2,649 Page - 199

200 Tucson Electric Power Map 17 - TEP System Map Page - 200

201 2017 Integrated Resource Plan Coal Resources Map 18 - Map of Coal Generation and Primary Fuel Sources Page - 201

202 Tucson Electric Power Springerville Generating Station Springerville Generating Station Springerville Generating Station ( Springerville ) is a four unit, base-load coal-fired steam electric generating station located 15 miles northeast of Springerville, Arizona. TEP operates all four units. Units 1 and 2 are owned by TEP. Tri-State Generation and Transmission owns Unit 3, and Salt River Project owns Unit 4. Ownership Structure: Units Tri-State 415 MW SRP 417 MW Capacity (MW) In- Service Date Planned Retirement Unit Not Planned Unit Not Planned Unit Not Planned Unit Not Planned Participation Agreement: Expires January 1, 2078 TEP 793 MW Coal Supply: Agreement signed June 17, 2003 with Peabody Energy sourced from El Segundo / Lee Ranch, expires December 31, Pollution Controls: Unit SO 2 NOx PM Hg 1 SDA LNB SOFA FF ACI, CaBR 2 2 SDA LNB SOFA FF ACI, CaBR 2 3 SDA SCR FF ACI, CaBR 2 4 SDA SCR FF ACI CaBR 2 SDA Spray Dry Absorber FF Fabric Filter (Bag house) LNB SOFA Low NOx burners Separated overfired air SCR Selective catalytic reduction CaBR 2 Calcium bromide (added to coal) ACI Activated carbon injection SO2 and NOx, tons Historical Emissions, TEP Share 25,000 20,000 15,000 10,000 5, SO2 NOx Outlook: Units 1 and 2 will be subject to Reasonable Progress provisions of the Regional Haze rule, which could mandate emission reductions in the 2025 to 2027 timeframe. Given current controls and recent reductions at other regional plants, TEP does not believe additional controls are likely. Page - 202
203 2017 Integrated Resource Plan San Juan Generating Station San Juan Generating Station San Juan Generating Station ( San Juan ) is a four unit, coal-fired base-load steam electric generating station located 17 miles west of Farmington, New Mexico. Public Service Company of New Mexico (PNM) is the operating agent for all four units. Units 1 and 2 are owned by TEP and PNM. Units 2 and 3 will be retired at the end of Remaining owners will include TEP, PNM, the City of Farmington New Mexico, the County of Los Alamos, New Mexico and the Utah Associated Municipal Power System (UAMPS) Ownership Structure (after 2017): Units Los Alamos 36 MW COF 108 MW TEP 170 MW Capacity (MW) Entered Service Planned Retirement Unit (1) Unit December 2017 Unit December 2017 Unit Not planned (1) TEP does not plan to extend its participation agreement for San Juan 1 beyond June Participation Agreement: Expires June 30, 2022 UAMPS 37 MW PNM 496 MW Coal Supply: Agreement with Westmoreland Coal Company sourced from San Juan Mine is effective from January 2016 through June Pollution Controls: Unit SO 2 NOx PM Hg 1 FGD SNCR FF ACI 2 FGD LNB SOFA FF ACI 3 FGD LNB SOFA FF ACI 4 FGD SNCR FF ACI FGD Flue Gas Desulphurization-wet FF Fabric Filter (Bag house) LNB SOFA Low NOx burners Separated overfired air SNCR Selective non-catalytic reduction ACI Activated carbon injection SO2 and NOx, Tons 7,000 6,000 5,000 4,000 3,000 2,000 1,000 - Historical Emissions, TEP Share SO2 NOx Outlook: TEP intends to end its participation in San Juan at the end of June 2022, coinciding with the expiration of the plant participation agreement. Page - 203
204 Tucson Electric Power Navajo Generating Station Navajo Generating Station Navajo Generating Station ( Navajo ) is a three unit, coal-fired base-load steam electric generating station located five miles east of Page, Arizona Salt River Project is the operating agent for all three units. Plant participants include TEP, SRP, US Bureau of Reclamation, Los Angeles Department of Water and Power, Arizona Public Service, and NV Energy. Ownership Structure: Pollution Controls: Unit SO 2 NOx PM Hg 1 FGD LNB SOFA ESP ACI, CaBR 2 2 FGD LNB SOFA ESP ACI, CaBR 2 3 FGD LNB SOFA ESP ACI, CaBR 2 FGD Flue Gas Desulphurization-wet ESP Electrostatic Precipitator LNB SOFA Low NOx burners Separated overfired air ACI Activated carbon injection CaBR 2 Calcium bromide (added to coal) Historical Emissions, TEP Share NV Energy 255 MW TEP 168 MW SRP 965 MW SO2 and NOx, tons 3,000 2,000 1,000 - SO2 NOx USBR 547 MW APS 315 MW Outlook: Final Regional Haze requirements for Navajo call for the retirement of one unit at the end of 2019, and the addition of Selective Catalytic Reduction on the remaining units by the end of Units Capacity (MW) In- Service Date Planned Retirement Unit Unit Unit Participation Agreement: Extends to the expiration date of the plant s lease with the Navajo Nation, which is December 20, In February 2017, TEP joined other Navajo owners in voting in to continue operations at the plant through December 2019 if a lease extension agreement can be reached with the Navajo Nation. A lease extension would continue power production, maintain plant employment and preserve revenues for the Navajo Nation and Hopi Tribe, providing continued support for the area economy through Without the lease extension, the owners would be forced to cease power production in 2017 to allow for decommissioning work to be completed before the current lease expires. TEP has expressed its willingness to work with the Navajo Nation in search of long-term solutions for Navajo that balances the needs of the plant s many stakeholders and serves the best interests of TEP s customers. Coal Supply: Agreement with Peabody Energy sourced from Kayenta Mine expires December Page - 204

205 2017 Integrated Resource Plan Four Corners Power Plant Four Corners Power Plant Four Corners Power Plant ( Four Corners ) is a two unit, coal-fired baseload steam electric generating station located 18 miles west of Farmington, New Mexico. APS is the operating agent for both units 4 and 5. Plant participants include TEP, APS, SRP and PNM. Ownership Structure: TEP SRP 110 MW 150 MW PNM 200 MW Pollution Controls: Unit SO 2 NOx PM Hg 4 FGD SCR (1) FF WFGD, FF, CaBR 2 5 FGD SCR (1) FF WFGD, FF, CaBR 2 APS 1,080 MW (1) Required by end of July 2018 to comply with Regional Haze BART requirements FGD Flue gas desulfurization-wet FF Fabric Filter (Bag house) SCR Selective catalytic reduction CaBR 2 Calcium bromide (added to coal) Historical Emissions, TEP Share 2,500 Units (1) Capacity (MW) In- Service Date Planned Retirement Unit Unit (1) APS shut down units 1-3 in December 2013 to comply with Regional Haze BART requirements. SO2 and NOx, Tons 2,000 1,500 1, Participation Agreement: Co-tenancy agreement expires July SO2 NOx Coal Supply: Agreement with Navajo Transitional Energy Company sourced from the Navajo Mine expires July Outlook: TEP anticipates that the plant will close after expiration of current coal supply contract in TEP will continue to evaluate the long-term viability of its coal operations at Four Corners in subsequent IRP planning cycles. Page - 205
 is a four unit, peak and intermediate-load, steam electric generating station located in Tucson, Arizona.")
206 Tucson Electric Power H. Wilson Sundt Generating Station H. Wilson Sundt Generating Station Sundt Generating Station ( Sundt ) is a four unit, peak and intermediate-load, steam electric generating station located in Tucson, Arizona. Units 1, 2, and 3 are gas or oil burning generating units and Unit 4 fires natural gas and landfill gas. Ownership: Sundt Generating Station is 100% owned and operated by TEP. Units Capacity (MW) Entered Service Planned Retirement Unit Unit Unit Unit Not Planned Fuel Supply: The primary fuel at Sundt Generating Station is natural gas. The station is supplied by gas purchased on the spot market and through gas hedging agreements that are consistent with TEP s hedging policy. Natural gas is delivered through the Kinder Morgan natural gas pipeline which is located adjacent to the Sundt property. Outlook: In 2015, the depletion of the Company s existing coal inventory at the Sundt Generation Station and low natural gas prices supported the permanent transition of Sundt Unit 4 from coal to natural gas two and one half years ahead of the December 2017 deadline in its agreement with the EPA. This transition to natural gas has reduced TEP s nearterm fuel supply costs for customers and marks the end of Sundt s 27 years of operations on coal. Pollution Controls: Unit SO 2 NOx PM Hg 1 NA LNB NA NA 2 NA LNB NA NA 3 NA LNB NA NA 4 NA LNB SOFA NA NA LNB SOFA Low NOx burners Separated overfire air NA Not Applicable Page - 206
, and a GE D11 steam turbine.")
207 2017 Integrated Resource Plan Luna Energy Facility Luna Energy Facility Luna Energy Facility ( Luna ) is a 555 MW natural gas-fired power plant consisting of a single 2 on 1 combined cycle power block. The power block utilizes two GE 7FA gas turbines, two heat recovery steam generators (HRSGs), and a GE D11 steam turbine. The facility is located three miles north of the town of Deming, New Mexico. Ownership: Luna ownership shares are divided by one-third PNM, one-third TEP and one-third Samchully Co. Ltd. PNM is the plant operator. Samchully 184 MW PNM 184 MW TEP 184 MW Pollution Controls: Luna Energy Facility is a natural gas-fired combined cycle combustion turbine with dry LNB and SCR for NOx control. As a greenfield site, a Prevention of Significant Deterioration (PSD) permit was obtained prior to construction. A PSD permit requires that Best Available Control Technology (BACT) be applied for control of SO2 and NOx, and the facility must comply with the Acid Rain program limits for SO2 and NOx. Unit SO 2 NOx PM Hg 1 NA SCR NA NA 2 NA SCR NA NA SCR Selective Catalytic Reduction NA Not Applicable Units Entered Service Planned Retirement Power Block Not Planned Fuel Supply: Each Luna participant manages its own gas supply. TEP purchases natural gas on the spot market and through hedging contracts that are consistent with the UNS Energy Hedging policy. Outlook: Luna s fast ramping capabilities provide TEP with low-cost, intermediate load resource to support the integration of renewables. Page - 207

208 Tucson Electric Power Gila River Generating Station Gila River Generating Station Gila River Generating Station ( Gila River ) is a 2200 MW four block, 2 on 1 natural gas-fired combined cycle electric generating station located three miles north of the town of Gila Bend, in Maricopa County, Arizona. Ownership: Units 1 and 2 are owned by Beal Bank, Unit 3 is owned 75% by TEP and 25% by UNSE. Unit 4 was purchased in 2016 by Salt River Project. Under that agreement, Salt River Project will take ownership of the unit in UNSE 138 MW Units SRP 550 MW TEP 412 MW Capacity (MW) Entered Service Beal Bank 1,100 MW Planned Retirement Power Block Not Planned Power Block Not Planned Power Block Not Planned Power Block Not Planned Pollution Controls: Block SO 2 NOx PM Hg 1 NA SCR NA NA 2 NA SCR NA NA 3 NA SCR NA NA 4 NA SCR NA NA SCR Selective Catalytic Reduction NA Not Applicable Outlook: Low natural gas prices make Gila River Block 3 one of lowest cost generation assets for both TEP and UNSE. Gila River s fast ramping capabilities, along with its real-time integration into TEP s balancing authority, provide both TEP and UNS Electric with an ideal resource to support the integration of future renewables. Fuel Supply: Each Gila River participant manages its own gas supply. TEP and UNSE purchases natural gas on the spot market and through hedging contracts that are consistent with the UNS Energy Hedging policy. Page - 208

209 2017 Integrated Resource Plan Combustion Turbines Combustion Turbines The Company has 219 MW of gas or oil fired combustion turbines for peaking capacity. This capacity is comprised of 6 units at three locations, 50 MW split between two units at Sundt, 94 MW split between four units at North Loop, and one 75 MW unit at DeMoss Petrie. All locations are in or around Tucson and are all operated from the Sundt Station. Ownership: The combustion turbines are 100% owned by TEP. North Loop Generating Station Units Capacity (MW) Entered Service Planned Retirement Sundt CT Unit Sundt CT Unit DeMoss Petrie 75 Not 2001 Unit 1 Planned North Loop Unit North Loop Unit North Loop Unit North Loop Unit 4 21 Not 2001 Planned Fuel Supply: The Company purchases natural gas for its combustion turbines on the spot market. Natual gas for the units at North Loop and DeMoss Petrie is delivered through Southwest Gas. Natural gas for the two Sundt turbines is delivered from TEP s Sundt connection to the Kinder Morgan pipeline. Page - 209
210 Tucson Electric Power Future Plan to Move to Cycling Operations TEP is well on its way to achieving a 30% renewable target by In Chapter 3 of this document, we discuss the challenges characteristic of high solar PV penetration, as it pertains to the summer peak demand. Chapter 3 deals primarily with the topic of resource adequacy; the task of securing or acquiring resources to meet the summer peak demand. This chapter also presents a discussion of operations and intrahour dispatch. As TEP moves forward to achieving its renewable target, the issue of coal generation minimums and potential thermal unit cycling arises, especially on clear-sky, winter months. Chart 38 Typical Winter Load and Dispatch Operations Net (with 2030 solar) Retail (2030) Net (with 2017 solar) Net (with 2020 solar) Net (with 2025 solar) MW Coal Minimum Generation Coal Minimum Generation Typical Peak Day (Hours) Chart 38 above illustrates a typical winter day, with a dual peak and a progressing duck curve with a deeper belly through the years. The topmost shape (dotted) represents a typical 24-hour winter retail demand projected for The thick black line represents retail demand that is adjusted for solar PV (utility-scale and DG). We immediately observe that the belly of the Net (with 2017 solar) curve is intersecting with the aggregate coal unit minimum generation (for 2017). This is not yet a problem as TEP makes system sales that keep total load above this minimum. In this IRP, however, TEP assumes that it divests itself of the Navajo and San Juan coal plants, with Springerville and Four Corners remaining. The minimum coal generation for 2023 drops to approximately 400 MW and remains at that level until TEP will continue to push against its generator minimums with additional solar generation by TEP is beginning to explore solutions at its power plants for modifications to generating units that will allow for lower minimums and/or potential cycling capabilities. If a plant is capable of cycling during the day, larger measures such as seasonal shut-downs may be avoided. Page - 210
211 2017 Integrated Resource Plan Existing Renewable Resources Over the last several years, TEP has constructed or entered into purchased PPAs for solar and wind resources to provide renewable energy for its service territory. This is part of TEP s commitment to meeting the Arizona RES requirement of serving 15% of its retail load with renewable energy by Table 19 below lists TEP s existing solar and wind renewable resources. Table 19 TEP s Existing Solar and Wind Renewable Resources Project Name Owned or PPA Location Operator Completion/Estimated Date Capacity MW dc Fixed Photovoltaic Springerville Owned Springerville, AZ TEP Dec Solon UASTP II Owned Tucson, AZ TEP Jan Gato Montes PPA Tucson, AZ Astrosol Jun Solon Prairie Fire Owned Tucson, AZ TEP Oct TEP Roof tops Owned Tucson, AZ TEP Dec Ft Huachuca I Owned Sierra Vista, AZ TEP Dec Ft Huachuca II Owned Sierra Vista, AZ TEP Jan Single-Axis Tracking Photovoltaic Solon UASTP I Owned Tucson, AZ TEP Dec E.ON UASTP Owned Tucson, AZ TEP Dec FRV Picture Rocks PPA Tucson, AZ Macquire Oct NRG Solar Avra Valley PPA Tucson, AZ First Solar Oct E.ON Valencia PPA Tucson, AZ Areva Jul Avalon Solar I PPA Sahuarita, AZ Avalon Dec Red Horse Solar PPA Willcox, AZ Torch Sep Avalon Solar II PPA Sahuarita, AZ Avalon Feb Cogenera PPA Tucson, AZ SunPower Dec Concentrated Photovoltaic Amonix UASTP II PPA Tucson, AZ Amonix Apr White Mountain Owned Springerville, AZ TEP Dec Concentrated Solar Power Areva Solar Owned Tucson, AZ TEP Dec Wind Macho Springs PPA Deming, NM Element Power Nov Red Horse Wind PPA Willcox, AZ Torch Sep Notes: PPA Purchased Power Agreement - Energy is purchased from a third party provider Fixed PV Fixed Photovoltaic Stationary Solar Panel Technology SAT PV Single Axis Tracking Photovoltaic CPV Concentrated Photovoltaic Not listed is the Sundt s Landfill Gas project. Its capacity is estimates at 4 MW, representative of capacity that would have been utilized by Sundt Unit 4 if burning conventional natural gas Page - 211

212 Tucson Electric Power Existing Fixed Axis Solar PV Projects Springerville Solar TEP currently has 6.4 MWdc of solar at the Springerville site. The solar project is a fixed PV facility located on the property of the Springerville Generating Station, 12 miles north of Springerville, Arizona. TEP expanded its 4.6 MW solar facility in Springerville at the end of 2010 by adding an additional 1.8 MW solar field adjacent to the current site. The combined systems generate enough electricity to power about 1,350 homes. Picture 2 - Springerville Solar The system produces the most power capacity during the cooler months of the year when the sun is near latitude angle. The system operates as an unmanned site and is monitored continuously via an Internet based communications channel. The Springerville location has room for expansion. Technologies of various types for any future expansion are being considered, including Fixed Tilt PV and SAT PV. TEP will continue to evaluate these technologies and their relative performance over time to aid in future design considerations. Page - 212
. The fixed tilt array sits on 34 acres and is powered by twentyone thousand high efficiency modules.")

213 2017 Integrated Resource Plan Solon / TEP UASTP II SOLON II is a 5 MWdc fixed PV system designed and built by SOLON Corporation, and installed at University of Arizona Science and Technology Park (UASTP). The fixed tilt array sits on 34 acres and is powered by twentyone thousand high efficiency modules. Picture 3 - Solon II Solar Gato Montes Gato Montes is a 6 MWdc PV system designed and built by Astroenergy, and installed at the UASTP. Duke Energy now owns the Gato Montes site. The solar PV thin film, amorphous silicon technology used in this project is a first in the Duke Energy Renewables Fleet. This technology makes the solar modules extremely thin compared to other polycrystalline modules. It began operation in December 2012 and consist of over 48,000 panels which produces enough energy to power over 1,200 homes. Duke Energy sells its output to TEP through a 20-year PPA. Picture 4 - Gato Montes Solar Page - 213

214 Tucson Electric Power Solon Prairie Fire Prairie Fire is a 5 MWdc solar facility located in Pima County off Valencia Road east of Kolb Road in Tucson. The PV technology used is a crystalline fixed system module. The plant consists of 17,604 panels. Prairie Fire began providing power to TEP customers in late December TEP owns and operates this system, and will continue to manage operations, monitoring and maintenance. Picture 5 - Solon Prairie Fire Solar Page - 214


215 2017 Integrated Resource Plan Ft. Huachuca Phase I Fort Huachuca Phase I is owned by TEP. Phase I is a 17.2 MWdc fixed PV system installed at the Ft. Huachuca Army base in Sierra Vista, Arizona. The fixed tilt array is sited on 300 acres and is powered by 57,600 high efficiency modules manufactured by BYD Company Limited. This project began providing power in December of 2014 and is the largest single site owned by TEP. Picture 6 - Ft. Huachuca Phase I Ft. Huachuca Phase-II Phase II is a 5 MWdc fixed PV system powered by 46,480 Frist Solar Watt modules. Phase II was commissioned in January of 2017 bringing Fort Huachuca s total solar plant capacity to 22.6 MWdc. Picture 7 - Ft. Huachuca Phase II Page - 215


216 Tucson Electric Power Existing Single Axis Tracking Projects Cogenera Cogenera is a 1.38 MWdc SAT system that uses the Cogenera proprietary Dense Cell Interconnect technology of 72 cell solar modules, which can deliver 15% more power than conventional solar modules covering the same area. The Cogenera is installed at the UASTP and is owned by Washington Gas and Electric. Picture 8 - Cogenera DCI Technology Solon UASTP I Bringing solar power to Tucson residents, SOLON Corporation designed and installed this turnkey, 1.6 MW single-axis tracking system in 2010 for TEP's Bright Tucson Community Solar Program at the UASTP. Picture 9 - Solon UATSP I Solar Page - 216


217 2017 Integrated Resource Plan E.ON UASTP This 6.6 MW single-axis tracking plant is located in the Solar Zone at the UASTP. The project represents E.ON s first solar project in the U.S. The project consists of over 23,000 crystalline PV modules installed on a singleaxis tracker, situated on 37-acres. TEP purchases power generated at the plant through a 20-year PPA. Picture 10 - EON UATSP Solar Picture Rocks This 25 MWdc single-axis tracking system is located on a 305-acre site owned by Tucson Water just west of Tucson. The project deploys over 89,000 poly-crystalline modules which are mounted on horizontal-axis trackers that rotate with the sun s position in order to optimize electricity production. Picture 11 - Picture Rocks Solar Page - 217


218 Tucson Electric Power E.ON Valencia The 13.2 MWdc EON Valencia project is located near Valencia road and the I-10 freeway in Tucson, Arizona. E.ON owns this SAT system that utilizes more than 47,500 poly-crystalline modules. E.ON sells its output to TEP through a 20-year PPA. Picture 12 - EON Valencia Solar Avalon Solar I and II Avalon Solar I and Avalon Solar II are adjacently located near the Asarco LLC Mission Mine 12 miles south of Tucson, Arizona and both are single axis tracking PV system. Avalon I is a 35 MW plant and Avalon II is a 21.5 MW plant. The plants use similar single-axis-tracking technology with Avalon I deploying over 116,000 polycrystalline solar modules and Avalon II over 71,000. Combined, the plants produce just under a 100 GWh of energy or enough energy to power 12,000 homes. Both plants were developed by Idaho based Clenera, LLC and constructed by Swinerton Renewable Energy. Picture 13 - Avalon Solar I Page - 218


219 2017 Integrated Resource Plan Avalon Solar I was commissioned in December of 2014 and was sold to Coronal Energy. Avalon Solar II was commissioned in March of 2016, and Clenera retained ownership. TEP will buy power from these project under a 20-year PPA. Picture 14 - Avalon Solar II Red Horse Solar II At this unique renewable energy project in Wilcox, Arizona, a 51.3 MW PV solar array is complemented by a 30 MW wind farm. Solar and wind components are fairly close together, with the wind turbines on a mountain ridge next to the solar field (for more information on the wind farm please see the Wind Assets section below). Red Horse II deploys over 170,000 polycrystalline solar modules mounted on a single-axis-tracker to maximize production. The project was developed by DE Shaw and TEP purchases electricity generated from the project through a PPA. Picture 15 - Red Horse II Page - 219

220 Tucson Electric Power NRG Solar The 34.4 MWdc NRG Solar project is a SAT PV system located on 320 acres on the Lupari Farm in Avra Valley, Arizona about 20 miles northwest of Tucson. The facility will produce clean, renewable electricity that will be sold to TEP under a 20-year PPA. At full capacity, the Avra Valley Solar Project will generate enough power to supply approximately 7,300 homes. Picture 16 - NRG Solar Red Horse II Solar Page - 220

221 2017 Integrated Resource Plan Existing Concentrating PV Projects Amonix UASTP II Amonix UASTP II is a 2 MWdc CPV system designed and built by Amonix, Inc., and installed at the UASTP. The project consists of 12 acres lined with 34 dual-axis trackers that reach up to 50 feet off the ground on pedestals that track the sun horizontally and vertically. Amonix will sell its output to TEP through a 20-year PPA. Picture 17 - Amonix Concentrating PV System Page - 221


222 Tucson Electric Power White Mountain White Mountain Solar, also located at the Springerville site, is a combination of Single Axis Tracking CPV and fixed tilt PV. The 10 MW plant consists of two types of technology. An innovative 7.3 MW low-concentrated PV single-axis tracking system uses multiple mirrors to reflect and concentrate sunlight onto a row of PV cells. Produced by SunPower, this is the third array of its kind in use in the United States. The second system includes 2.83 MWs of SunPower s T5 rooftop panels mounted on a specialized rack and angled to maximize production. Picture 18 - SunPower T5 Technology Picture 19 - SunPower C7 Technology Existing Concentrating Solar Power Projects Page - 222

223 2017 Integrated Resource Plan Areva Solar Areva Solar is TEP s first use of solar thermal technology to augment existing steam generation at the Sundt Generating Station. Named the Sundt Solar Boost Project, the project is a 5 MW equivalent renewable resource. Integrated with the existing Sundt Unit 4, the Areva addition is expected to boost peak capacity of the unit by 5 MW. Areva's Compact Linear Fresnel Reflector technology uses mirrors to concentrate sunlight to directly create steam power. Rather than using trough- or dish-shaped mirrors common to other concentrating solar systems, Areva's technology uses a system of nearly flat mirrors, arranged in louver like arrays and motorized to track the sun, to heat up water passing overhead through a linear absorber. The Areva system also is designed to heat water directly, compared with other systems that generate steam indirectly with heat-transfer fluids such as oil or molten salt. Picture 20 - Areva Solar Sundt Generating Station Page - 223

224 Tucson Electric Power Existing Wind Resources Macho Springs Macho Springs Wind Farm, located in Luna County, New Mexico commenced operation in November The wind farm is located approximately 20 miles northeast of Deming, NM, and is owned by Capital Power. The 50 MW wind farm, consisting of 28 Vestas V MW wind turbines, will generate enough clean energy to provide electricity for more than 20,000 homes. The project is situated on approximately 1,900 acres of privately owned land. Each of the 28 turbines is installed on an 80-meter (264 feet) tower, and has a rotor diameter of 100-meters (328 feet). The energy output from the project is contracted to TEP through a long term PPA. The project s output is delivered via El Paso Electric s existing transmission line that runs through the project area. Picture 21 Macho Springs Wind Farm in New Mexico (50 MW Project) Page - 224

225 2017 Integrated Resource Plan Red Horse 2 Wind Project The Red Horse Wind project is a 30-megawatt wind farm including fifteen 2 MW wind turbines sited on 220 acres. Each turbine stands more than 450 feet high and is owned by Red Horse 2 LLC which was formed by Torch Renewables Energy. The project, located at Allen Flat, about 20 miles west of Wilcox, Arizona, achieved commercial operation in August of TEP buys power from this project under a 20-year PPA. Picture 22 - Red Horse 2 Wind Project Page - 225

226 Tucson Electric Power Existing Biomass Projects Sundt Biogas TEP uses methane gas from the Los Reales Landfill in Tucson and pipes it 3.5 miles to TEP's Sundt Generating Station to co-fire with pipeline natural gas in the Unit 4 boiler. Methane gas is a byproduct of decay in landfills, and it has a Global Warming Potential that is 22 times more than carbon dioxide. Picture 23 Los Reales Landfill The Los Reales Landfill covers approximately 370 acres in Tucson, Arizona and is owned and operated by the city of Tucson's Department of Environmental Service. Page - 226

227 2017 Integrated Resource Plan TEP s Energy Storage Projects The primary advantage of an Energy Storage System, in the context of a large utility, is often in its ability to very rapidly change power output levels, much faster than the proportional governor response rate of any conventional thermal generation system. This naturally leads to the usage cases of an ESS being centered on short term balancing-type activities. An additional strength is that operating costs of an ESS are generally fixed and independent of usage. In contrast, gas turbine systems have a limited number of start and stop cycles and therefore have an appreciable cost to activate, and they are not necessarily on line when needed. In the spring of 2015, TEP issued a request for proposals for design and construction of a utility-scale energy storage system. TEP sought a project partner to build and own a 10 MW storage facility under a 10-year agreement. TEP was looking for a cost-effective, proven energy storage system that would help integrate renewable energy into its electric grid. Figure 37 Lithium Ion Battery Storage Plant The aggressive nature of the bidding companies far exceeded expectations. In its solicitation TEP received a total of 21 bids; 20 bids for battery technology and one bid for flywheel technology. Within the battery category, there were seven different battery types proposed. Ultimately, TEP was able to select two winning bids. One including a 10 MW, Lithium Nickel-Manganese-Cobalt battery; and a separate one including a 10 MW, Lithium Titanate battery together with a 2 MW solar facility. With these projects, TEP will be able to assess the operational impacts of two of the predominant Lithium technologies available today. Both systems were commissioned during the early months of Page - 227

228 Tucson Electric Power Distributed Generation Resources Distributed Generation resources are small-scale renewable resources sited on customer premises. The Renewable Energy Standard requires that a portion of renewable energy requirements be obtained from residential and commercial DG systems. The required DG percentage in the Arizona RES is 30% of the total renewable energy requirement. By the end of 2016, TEP had approximately 190 MW of rooftop solar PV. DG is expected to supply at least 342 GWh of energy in Only a very small portion of this generation is attributable to the TEP-owned rooftop solar program that was initiated in Map 19 TEP s Distributed Solar Resources Sites Page - 228

229 2017 Integrated Resource Plan Davis Monthan Air Force Base Distributed Generation Project The February 2014 completion of a 16 MW solar addition at Davis Monthan Air Force Base (DM) has expanded the total solar resources for the base to 21 MWs making DM the site of the Department of Defense s largest solar facility. The 2014 addition is comprised of over 57,000 fixed tilt panels on 170 acres. Owned by SunEdison, it is contracted to supply the Air Force base with power over the next 25 years for an expected taxpayer savings of $ 500,000 per year. Picture 24 Davis Monthan Air Force Base Distributed Generation Project Page - 229


230 Tucson Electric Power Transmission Overview Transmission resources are a key element in TEP s resource portfolio. Adequate transmission capacity must exist to meet TEP s existing and future load obligations. TEP s resource planning and transmission planning groups coordinate their planning efforts to ensure consistency in development of its long-term planning strategy. On a statewide basis, TEP participates in the ACC s BTA which produces a written decision by the ACC regarding the adequacy of the existing and planned transmission facilities in Arizona to meet the present and future energy needs of Arizona in a reliable manner. TEP s Existing Transmission Resources TEP s existing transmission system was constructed over several decades to support the delivery of the base load coal generation resources in northern Arizona and New Mexico. Today, TEP owns approximately 473 miles of 46kV lines, 405 miles of 138 kv lines, and is owner and part owner of 1,110 miles of 345 kv lines and 655 miles of 500 kv lines. As shown in Map 20 the Tucson service territory area is interconnected to the Western Interconnection Bulk Electric System (BES) via 345 kv interconnections at the South Loop and Vail substations, and a 500 kv interconnection at the Tortolita substation. These three substations interconnect and deliver energy from the EHV transmission network to the local TEP 138 kv system. Map 20 - TEP s Existing Transmission Resources (includes rights on other systems) Page - 230
 transmission connection between Tucson and the Palo Verde wholesale power market.")

231 2017 Integrated Resource Plan Pinal Central to Tortolita 500 kv Transmission Upgrade In November 2015, TEP energized its newest 500 kv transmission expansion project that interconnects at the 500 kv Pinal Central Switchyard. The Pinal Central to Tortolita 500 kv line adds a second extra high voltage (EHV) transmission connection between Tucson and the Palo Verde wholesale power market. This line ties in at the existing Salt River Project Southeast Valley transmission project that extends from Palo Verde to Pinal Central into Tortolita. This new transmission interconnection improves TEP s access to a wide range of renewable and wholesale market resources located in the Palo Verde area while improving TEP s system reliability. Map 21 - Pinal Central - Tortolita 500kV Project Page - 231
232 Tucson Electric Power Pinal West to South Upgrade Project The Pinal West to South 345kV line is undergoing equipment replacement that will increase the thermal rating of the line. This is expected to increase the Total Transfer Capability of the line, which will allow TEP to schedule more power to the TEP load pocket from remote resources. Page - 232
233 2017 Integrated Resource Plan FUTURE RESOURCE REQUIREMENTS CHAPTER 10 Future Energy Efficiency Assumptions TEP's EE programs will continue to comply with the Arizona EE Standard that targets a cumulative energy savings of 22 % by For this IRP, EE is modeled as a resource and is dispatched to meet load based on the EE shape described in Chapter 5. The energy savings reflected in our reference case forecast through 2020, represent an estimate of the energy savings needed to meet the standard, excluding savings associated with program credits 37. From 2021 through the end of the planning period, the estimated annual savings are based on an assessment of achievable potential in energy savings from EE programs conducted by EPRI 38. This achievable potential represents an estimate of savings attainable through actions that encourage adoption of energy efficient technologies, taking into consideration technical, economic, and market constraints 39. Market constraints include both market acceptance factors such as transactional, informational, behavioral, and financial barriers, as well as program implementation factors which account for recent utility experience with EE programs 40. TEP will pursue a range of cost-effective and industry-proven programs to meet future EE targets. TEP s proposed EE portfolio, in addition to maintaining compliance with the Arizona EE Standard, is also expected to be compliant ready under the provisions of the CPP. Given the uncertainty around the status of the CPP, TEP notes that EE is an effective compliance tool under virtually any policy aimed at reducing carbon emissions. Under a mass-based approach, EE aids in compliance by displacing actual fossil generation and the associated emissions. Under a rate-based approach, similar to the CPP, EE measures that undergo appropriate, Evaluation, Measurement and Verification (EMV), can be used to reduce the emission rate of affected fossil-fired generators. By 2032, this offset to future retail load growth is expected to reduce TEP s annual energy requirements by approximately 1,894 GWh and reduce TEP s system peak demand by 318 MW. 37 Arizona Administrative Code, R C.- G. 38 U.S. Energy Efficiency Potential Through 2035, Electric Power Research Institute, dated April Ibid, p. v 40 Ibid p Page - 233
234 Tucson Electric Power Future Renewable Energy Assumptions In the Company s most recent general rate case proceeding, TEP committed to diversifying its generation resource portfolio with a goal of serving 30% of its retail load with cost-effective renewable resources. The state s renewable requirement remains at 15% by 2025, and the Company expects to achieve 15% by the end of As of the end of 2016, the Company has nearly 400 MW of combined utility scale renewable generation capacity on its system, and supplied approximately 10% of its retail sales with renewable resources. The Company anticipates adding approximately 800 MW of renewable energy capacity by 2030, based on current technology and cost projections, in order to achieve its desired 30% renewable target. TEP recently signed a 100 MW wind PPA with NextEra Energy Resources, scheduled for completion by early TEP is also evaluating responses from a 100 MW solar RFP, also scheduled for completion in early Immediately beyond these significant additions, TEP expects to focus on the introduction of large scale storage facilities and fast response thermal generation to facilitate the addition of the next tranche of large scale renewable systems. Page - 234
, 5% Utility Scale")
, 5% Utility Scale Renewable Resources, 26% Coal Generation, 38% Market Purchases, 5% Natural Gas, 26% The portfolio")

235 2017 Integrated Resource Plan Distributed Generation (DG), 4% Utility Scale Renewable Resources, 7% TEP s 2017 Reference Case Plan Portfolio Energy Mix 2017 Portfolio Energy Mix Market Purchases, 9% Natural Gas, 11% Coal Generation, 69% Distributed Generation (DG), 5% Utility Scale Renewable Resources, 14% 2023 Portfolio Energy Mix Market Purchases, 3% Natural Gas, 28% Coal Generation, 50% 2032 Portfolio Energy Mix Distributed Generation (DG), 5% Utility Scale Renewable Resources, 26% Coal Generation, 38% Market Purchases, 5% Natural Gas, 26% The portfolio energy charts shown above represents the energy resource mix to serve TEP s retail customers. Wholesale market sales are excluded from these results. By 2030, TEP s retail customers will be served from 30% renewables. This is based on a combination of utility-scale and distributed generation resources. Page - 235
236 Tucson Electric Power Technology Considerations In order to achieve the Company s stated goals, the Company continues to evaluate on an on-going basis, the most cost-effective renewable energy options currently available. This evaluation includes the most current market costs of renewable technology such as wind and solar, system integration availability and associated technologies to facilitate greater renewable penetration, as well as existing and planned transmission availability for regions located outside the Company s service territory. As expected with the current technology cost declines, current tax incentive policies, and solar insolation values in southern Arizona, utility-scale PV solar is the least cost resource on an energy-only basis, followed closely by higher-capacity wind resources located in central eastern portions of Arizona and western region of New Mexico. Although the Company expects to have a higher percentage of solar resources within its service territory, primarily due to favorable production curves, low costs, and lack of available transmission to import other resources, this will ultimately result in operational challenges as discussed above in Chapter 3, including the Company s ability to manage its own duck curve. These integration issues, including the addition wind resources, will require new technologies to manage the variability of these resources. The Company sees this challenge as an opportunity to both explore and utilize newer, fast-acting storage technologies to mitigate system variability due to the intermittent nature of these resources. Diversity of Resources As the Company has previously discussed, the potential impact on grid operations due to increased renewable penetration is expected to dramatically alter the Company s traditional resource portfolio, requiring greater flexibility and newer fast-acting generation resources. In order to minimize the impact of variable generation resources and their impact on operations, the Company must maintain a mix of variable renewable generation resources. These technologies will focus on those technologies readily available to the Company with the capability to be delivered to the consumer. This mix of technologies will primarily be large scale wind resources in eastern Arizona and western New Mexico that are able to utilize existing transmission facilities and capacity, including expected available capacity from planned plant retirements, and multiple solar resources. The solar resources will be a mix of fixed PV and tracking PV, in the scale of MW, which can be more easily interconnected with the Company s subtransmission and distribution systems. The Company has chosen not to pursue PV or solar technologies that have a high consumption of water, such as concentrating solar thermal. Utility Scale Project Ownership TEP has had a long-standing policy of utility investment in large scale solar resources. This policy is based on the concept of the utility owning and operating utility scale solar resources in order to provide a balance of contracted versus owned facilities, as well as provide greater operational flexibility by having the ability to regulate and curtail operations as necessary. Historically, the Company has strived for approximately 25% owned (solar) facilities and 75% contracted through PPA s. The Company believes this is an appropriate balance to maintain some system operational control while providing the industry an opportunity to support solar development in southern Arizona. While the Company firmly believes it should maintain a percentage of renewable ownership, it also recognizes the challenges associated with its renewable energy development targets. As previously noted, significant integration of solar resources into the Company s generation portfolio will create a considerably more pronounced TEP duck curve. Due to the significantly lower PPA prices associated with solar and wind, the concept of curtailable resources while ensuring the third party owner remains economically unharmed is in Page - 236
237 2017 Integrated Resource Plan many cases one of the least-cost options for mitigating the impacts of excessive generation during periods of high penetration. Future Grid Balancing Resources As described in Chapter 3, it is critical for TEP to maintain adequate resources that can balance load and generation, especially as increased use of renewable energy leads to greater intermittency of generation and greater ramping requirements of non-renewable energy resources. This section of the IRP describes the addition of new grid-balancing and load-leveling resources assumed in the Reference Case Plan. Energy Storage In addition to the 20 MW of battery ESS installed in 2017, the Reference Case Plan assumes the implementation of three battery ESSs: one each in the years 2019, 2021, and The systems in 2019 and 2021 would each be 50 MW with a storage capacity of 50 MWh. The system in 2031 would be 100 MW x 100 MWh. The primary purpose of the 2019 and 2021 systems is to facilitate the integration of more renewable energy into TEP s resource mix. Specifically, the systems would provide ancillary power services such as frequency response and regulation and voltage support, which are more challenging for traditional power sources to maintain under the demands of a system with high levels of renewable energy penetration. The system in 2019 would correspond with the largest addition of renewable energy capacity to TEP s system over the planning period (180 MW). The system in 2021 would further support renewable energy integration (e.g., as more DG comes on line) while providing more time to gain experience with battery ESSs and for such systems to further decline in cost. Finally, these ESSs would provide energy capacity value. In the Reference Case Plan, it is assumed that half of their capacity (50 MW) would be available if necessary under peak demand. By 2031, substantially more renewable energy is expected to be on line. Thus, the Reference Case Plan assumes another ESS (100 MW x 100 MWh) to be implemented by then. Again, the primary purpose would be to provide grid-balancing and load-leveling resources. It is assumed these resources would be provided throughout most of the year (e.g., when ramping requirements are high in the non-summer months), but that this system would provide primarily energy capacity services in the summer (100 MW). Although the Company has had considerable discussion regarding the location of the initial storage facilities, and the appropriate voltage level at which to obtain the maximum system benefits, it was ultimately determined that they would interconnect at the distribution system level. There were advantages to siting the storage facilities inside company owned substations, as well as the R&D advantages of siting one project at the University of Arizona Science and Tech Park. Additionally, being the first of their technology within our system, jurisdictional siting and permitting policies had to be determined through close collaboration with the City of Tucson and Pima County. Page - 237
238 Tucson Electric Power In the future, the siting of larger scale storage facilities will depend on a number of circumstances, including: Primary purpose of facility (distribution or transmission level voltage support, frequency response, generation smoothing and ramping, etc.) Secondary and tertiary ancillary services available from facility relative to its location Engineering studies Size of facility Interconnection feasibility Company or third-party owned facility Although a number of instability issues have been identified as a result of future wind and solar penetration on the grid, actual transmission and distribution system operations will determine the actual location and timing of any planned storage additions to the system. The Company is closely following the technology advances in large scale energy storage, specifically as it relates to the development of large-scale (>10 MW), long duration (>4 hrs.), energy storage. The Company s first utility scale storage facilities have been lithium-ion based chemistry, and this chemistry is making significant advances towards longer-term, higher capacity energy storage. Additionally, the Company is tracking advancements that have been made in flow-based energy systems, particularly Vanadium, Iron, Zinc, and Redox Flow technologies. Also, TEP is closely monitoring the progress of pumped hydro storage projects in the West. Although these technologies are still on the high end of the cost curve, their potential to provide long term, high capacity energy storage with long life cycles holds significant promise for the utility industry. Fast Response Thermal Generation As renewable penetration increases, fast responding resources will be needed to smooth out the oft-occurring variability of solar and wind generators. Additionally, a certain level of thermal resources with mechanical inertia will have to be maintained in order to help balance the electric system. RICEs are fast to respond to renewable variability but can also provide 100% ELCC during peak periods. The units are only degraded by run-time hours and can withstand multiple start-ups within a day. The units are also capable of running at 30% of their designed capacity. A 10 MW unit can idle down to 3 MWs and spin or stand ready to react to disturbances or renewable generation reductions. In its fleet of generating resources, TEP has targeted two aging gas-steam generating units for retirement at Sundt Generating Station. Units 1 and 2 are each 81 MW units that are increasingly requiring more O&M and capital expenditures. These 1960 s vintage units have high heat rates and are often only run for summer reliability contingency mitigation. Sundt Units 1 & 2 are not well suited to respond or participate in mitigating renewable generator intermittency. TEP performed an internal study to determine the economic and operational benefits of replacing these units. The recommendation made is that Sundt Units 1 and 2 should be retired in 2020 and 2022 respectively and replaced in those years with 100 MWs of RICE. The study showed that RICE bettered each Sundt unit by a LCOE difference of approximately $26/MWh. The capital expended on RICE overcame the Sundt units because RICE is more efficient and it performs at higher capacity factors. As mentioned above, cycling RICE has no impact on O&M and the 3 to 5 minute start times are not equaled by any existing generator in the TEP fleet. The RICE units will equally provide summer peaking capability but more importantly, these fast, responsive and efficient units are a better fit with renewable energy. Reliability is increased as well because the probability of outages is spread across multiple units. Page - 238
239 2017 Integrated Resource Plan Demand Response TEP currently implements a voluntary DLC program for larger commercial and industrial customers in TEP s service territory. During peak hours (late afternoon and evening) of the summer months, commercial and industrial load represents a total of approximately 22% of system demand. Controls for chillers, rooftop AC units, lighting, fans, and other end uses are modified to allow for curtailment of load, thus reducing power demand from customers at specified times. Participating customers voluntarily reduce their electricity consumption during times of peak electricity demand or high wholesale electricity prices (when alerted by TEP). Customers are compensated with incentives for their participation at negotiated levels that will vary depending on multiple factors including the size of the facility, amount of kw under load control, and the frequency with which the resource can be utilized. The program has had slower growth than originally expected due to the small industrial based customer load in Tucson. TEP uses a third-party vendor to administer the DLC program and is targeting enrollment of enough customers by 2020 to reach 42 MW of summer peak demand reduction, available for up to 80 hours per year, with a typical load control event lasting 3-4 hours. For planning purposes, TEP assumes approximately 4% annual growth in DR capacity after 2020 resulting in 67 MW available in 2032 with 2% annual increase in fees needed to achieve that level of growth. These growth assumptions would likely require expanding DLC beyond the Commercial and Industrial sectors. Comparing the cost of TEP s current DLC program to short-term capacity market prices, TEP does not anticipate that DR will be an economically feasible option for short-term capacity prior to 2022, and beyond that time, TEP does not project a significant need for short-term capacity. Therefore, TEP intends to shift toward designing DLC programs that are capable of cost-effectively addressing periods of significant ramping, anticipated with high penetration of renewable resources. Page - 239
240 Tucson Electric Power Future Transmission Transmission resources are a key element in TEP s resource portfolio. Adequate transmission capacity must exist to meet TEP s existing and future load obligations. TEP s resource planning and transmission planning groups coordinate their planning efforts to ensure consistency in development of its long-term planning strategy. On a statewide basis, TEP participates in the ACC s BTA to develop a transmission plan that ensures that Arizona s transmission organizations are coordinated in their efforts to maintain system adequacy and reliability. Ten-Year Transmission Plan On an annual basis, TEP develops and submits to the Commission a ten year transmission plan for its EHV and local transmission networks. This plan reflects planned and conceptual projects on the EHV transmission network used to bring power from remote resources into the Tucson load pocket and the local 138kV local network used to deliver power to the local distribution substations. TEP s EHV and 138kV transmission system is planned to meet performance requirements of the NERC Transmission System Planning Performance Requirements (TPL-001-4) standard and the WECC Transmission System Planning Performance (TPL-001- WECC-CRT-3.1) criteria. This plan includes new or reconductored transmission projects, transformer capacity upgrades, and reactive power compensation facility additions at 115kV or above. This plan ensures that TEP has sufficient load serving capability and Total Transfer Capability to provide service to its customers under normal conditions and following outages as specified in the NERC standards and WECC criteria. TEP s 2016 ten year transmission plan included the following: 1 planned EHV transmission line project 7 conceptual EHV transmission line projects 0 EHV planned or conceptual EHV reactive compensation projects 13 planned 138kV transmission line projects 5 conceptual 138kV transmission line projects 4 planned 138kV reactive compensation projects 0 conceptual 138kV reactive compensation projects Transmission Substation Reconfiguration Projects To improve system reliability and maintainability of the transmission system and meet new requirements of the NERC Planning Standards, TEP is converting four substations from a ring bus to a breaker-and-a-half configuration. The Greenlee (Phil Young) and South Loop 345kV substation conversions will take place in The Irvington and DeMoss Petrie 138kV conversions will take place in 2020 and 2021, respectively. Conceptual Future Local Area 345 kv EHV Transmission Projects The Irvington-Vail, Irvington-South Loop 345 kv projects are two conceptual projects that were analyzed as possible long term transmission scenarios to improve local area transmission capacity. These are two phase projects that are part of a larger EHV reach-in strategy to serve the growing load in Tucson without requiring EHV lines across the central metro area. In addition, these projects are coordinated with the potential build out of local generation resources at Sundt Generating Station. In Phase 1, a new 26 mile 345kV line would be constructed between the Irvington and South Loop Substations. Phase 2 of this project would complete a new 10 mile 345 kv line interconnecting the Irvington and Vail Substations. Phase 1 would be expected to precede Phase 2 by several years. New Phase 1 facilities would include a 345 kv termination at Vail and a 345/138 kv substation at Irvington. Page - 240

241 2017 Integrated Resource Plan Map 22 Local Area Conceptual 345 kv EHV Projects Transmission Resources Needed for New Generating Resources Additional transmission resources will be needed for specific generation interconnections. For purposes of this resource plan, the resource planning group developed a set of transmission cost assumptions based on the list of potential generation resources. These generation resource options include the additional costs associated with any transmission improvements that would be required to connect the resources to the transmission system. For example, some of the larger base load resource options are expected to be constructed far from the TEP service territory and would require significant transmission infrastructure improvements with the construction of the generation facility. Smaller generation facilities such as gas turbines would likely be constructed within the Tucson metro area and would require a much smaller interconnection investment. Finally, in addition to construction capital, the resource plan also includes the costs of the on-going O&M that is required to maintain these transmission facilities. Page - 241
242
243 2017 Integrated Resource Plan CHAPTER 11 ALTERNATIVE FUTURE SCENARIOS AND FORECAST SENSITIVITIES Modeling the performance of a resource portfolio involves making assumptions about future conditions such as economic growth, fuel and wholesale power markets, regulatory conditions (e.g. emission prices), and the pace of technological development. TEP seeks to identify a reference case portfolio that provides solid performance under the assumptions selected while maintaining optionality to make course adjustments in response to actual emerging conditions. Due to the inherent uncertainty about these future assumptions, it is necessary to test the performance of each resource portfolio against a range of future conditions to better assess whether a portfolio is robust under varying conditions. Because certain market conditions do not move independently of each other, alternative future scenarios must be identified that capture a range of future conditions, yet represent plausible outcomes in terms of the relative movement of different market forces. PACE Alternative Future Scenarios TEP hired PACE to develop a base case set of assumptions and two alternative future scenarios for modeling the performance of each resource portfolio. These three future states of the world are characterized by discrete scenarios with varying economic drivers that represent three separate forecasts of forward market conditions (See Appendix A). These scenarios are defined as: 1. Base Case Scenario 2. High Technology Scenario 3. High Economy Scenario The Base Case Scenario features existing regulations, gradually rising mid-term gas prices (in real terms), continuing technological growth, low load growth and generally moderate market outcomes. Power market participants are able to adapt and adjust in a timely manner to changing market forces. The High Technology Scenario is characterized by significant advances in energy storage technology, renewable energy deployment, emissions reduction and CO2 removal technology, high efficiency natural gas-fired generation, and also natural gas extraction productivity improvements. These conditions tend to subdue fuel prices, power prices and capital costs, and put pressure on coal plant economics, resulting in additional retirements. However, there are also significant developments in technologies that improve EE, which helps to mitigate load growth that might otherwise be expected in a high technology scenario with robust economic growth. The High Economy Scenario is characterized by a robust and growing U.S. economy that keeps upward pressure on all of the major market outcome categories, including load growth, fuel costs, power prices, and capital costs. This growth is in the absence of a major technological breakthrough. Existing generation resources are needed to maintain this economic expansion, limiting the number of retirements while accelerating the number of capacity additions. While this scenario shares many of the attributes of the previous High Technology scenario, the pace of technological innovation is not as dynamic and therefore beneficial to keeping prices and costs in check. Page - 243
244 Tucson Electric Power Under the High Technology and High Economy Scenarios, key market indices such as fuel prices, emission prices, and retirements move in opposite directions relative to the base case, thereby providing the range of outcomes desired for portfolio modeling. The table below represents trends for each variable in the Base Case Scenario and the directional shift in trend relative to the base case outlook in L, H, and M under the High Economy Scenario and the High Technology Scenario. The L symbol represents a decline or a reduction in trend compared to the base case projection, whereas the H symbol represents an increase or a rise relative to the base case projection for the corresponding period. Finally, the M symbol represents identical movement to the base case or a convergence to the base case for the specific period if the previous trend has caused the variable to go above or below the base case. Table 20 Summary of PACE s Key Planning Drivers Scenarios Key Planning Base Case Scenario High Economy Scenario High Technology Scenario Drivers Base Case Natural Gas Pricing High Natural Gas Pricing Low Natural Gas Pricing Planning Horizon Short- Mid- Long- Short- Mid- Long- Short- Mid- Long- Term Term Term Term Term Term Term Term Term Natural Gas Prices B Upward Level Trend Trend B H M B L L Coal Prices B Upward Upward Trend Trend B H H B L L Load Growth B Level Upward Trend Trend B H M B L** L** CO 2 Compliance Prices B Upward Upward Trend Trend B H H B L L Wholesale Power Prices B Upward Level Trend Trend B H H B L L Capital Costs B Upward Upward Trend* Trend* B H H B L L Coal Plant Retirements B Upward Upward Trend Trend B L M B H M Resource Additions B Upward Upward Trend Trend B H M B H M Notes: All scenarios are similar to the Base Case (B) in the short-term, then move low (L), high (H), or moderate (M) relative to the base case. Planning Horizon: Short-Term = , Mid-Term = , Long-Term = *Certain renewable technologies are on a downward capital cost trend as the technologies continue to mature **Slightly lower Page - 244
245 2017 Integrated Resource Plan Natural Gas Prices Chart 39 shows the Henry Hub natural gas price assumptions for the three PACE scenarios. $12.00 Chart 39 - Permian Basin Natural Gas Price Sensitivities $10.00 $8.00 Nominal $/mmbtu $6.00 $4.00 $2.00 $ Baseline High Technology High Economy Page - 245
246 Tucson Electric Power Coal Prices TEP currently has ownership shares in four coal-fired power plants in Arizona and New Mexico, most of which are under long-term contracts for coal supply. San Juan: The plant is a mine-mouth facility that receives coal from the San Juan mine. It has recently signed a short-term contract through July Springerville: The plant has access to local coal from the El Segundo mine in New Mexico via rail deliveries. Springerville can burn both Western subbituminous coal as well as coal sourced from Powder River Basin. Navajo: The plant receives coal from the Kayenta mine, located 80 miles south of the plant, via a dedicated rail line. TEP is under a long-term coal supply agreement through Four Corners: The Four Corners Power plant is sourced from the Navajo Coal mine, which is minemouth facility, operated by the Navajo Transitional Energy Company. The Four Corners coal supply agreement runs through June TEP s assumptions for coal prices are based on contract indices and escalators that are driven by the PACE coal market outlook to establish coal price projections for the TEP fleet. Chart 40 reflects the TEP weighted average coal pricing for the three scenarios. Chart 40 TEP Coal Price Assumptions $4.50 $4.00 $3.50 $3.00 Nominal $/mmbtu $2.50 $2.00 $1.50 $1.00 $0.50 $ Baseline High Technology High Economy Page - 246
247 2017 Integrated Resource Plan Capital Costs The capital cost for new resources are based on the Lazard s Levelized Cost of Energy Analysis v.10.0, which presents costs in 2016 dollars. Future nominal costs include an inflation adjustment as well as innovation adjustment developed by PACE to reflect that that installed costs of certain technologies are expected to decrease as the technology itself matures in addition to improvements in manufacturing and delivery processes and supply chain efficiencies. Chart 41 below presents the capital cost assumptions for the technologies representing the majority of future resource additions for each of the three scenarios. Chart 41 Capital Cost Assumptions, Solar Technology Solar Fixed PV Solar Single Axis Tracking $1,800 $2,000 $1,600 $1,800 Installed Cost, $/kw $1,400 $1,200 $1,000 $800 $600 $400 $200 Installed Cost, $/kw $1,600 $1,400 $1,200 $1,000 $800 $600 $400 $200 $ $ Base Case High Economy High Technology Base Case High Economy High Technology Page - 247
248 Tucson Electric Power Chart 42 Capital Cost Assumptions, Wind Wind Resources Installed Cost, $/kw $2,500 $2,000 $1,500 $1,000 $500 $ Base Case High Economy High Technology Chart 43 Capital Cost Assumptions, Natural Gas Technology Natural Gas Combined Cycle Reciprocating Engines $2,000 $2,000 Installed Cost, $/kw $1,500 $1,000 $500 $ Installed Cost, $/kw $1,500 $1,000 $500 $ Base Case High Economy High Technology Base Case High Economy High Technology Page - 248
249 2017 Integrated Resource Plan Palo Verde (7x24) Market Prices Chart 44 shows the Palo Verde market price assumptions for the three PACE scenarios. Chart 44 - Palo Verde (7x24) Market Price Sensitivities $90.00 $80.00 $70.00 $60.00 Nominal $/mmbtu $50.00 $40.00 $30.00 $20.00 $10.00 $ Baseline High Technology High Economy Page - 249
250 Tucson Electric Power Load Growth Scenarios Due to the need for comparability between alternative portfolios, the base case load assumption will be used for all alternative portfolios. Varying assumptions on load growth is analyzed against the Reference Case Plan portfolio only. The 2017 Reference Case Plan projects TEP peak demand growing approximately 0.7% per year between 2020 and This change in growth is highly influenced by the assumption of a significant mining expansion occurring by Other than this expansion, TEP doesn t forecast any significant increase in load from TEP s large industrial and mining customers. The 2017 Reference Case Plan also shows a steady decline in firm wholesale obligations as current contracts expire. For the load growth scenarios, these base case conditions will be modified to create a High Load and Low Load scenarios. The load growth scenarios are described below. Results of this scenario analysis along with changes that would be required in the Reference Case Plan are summarized in Chapter 12. Page - 250
251 2017 Integrated Resource Plan High Load Scenario For purposes of testing the Reference Case portfolio against a scenarios in which energy use and demand are greater than in the base case, TEP assumed a continuation of firm wholesale contracts at levels consistent those in the near term. Under base case load, existing firm wholesale obligations are modeled according to their contract terms and are dropped upon the current contract expiration. It is likely that certain contracts will be extended or new long-term wholesale contracts will be entered into. Table 21 represents the firm wholesale obligations under the High Load Scenario. Table 21 High Load Firm Wholesale Obligations, System Peak Demand (MW) Demand MW Base Case Firm Wholesale Demand Reserve Margin, % 21% 15% 15% 15% 15% 15% 15% 15% 19% 20% 20% 21% 18% 18% 17% 17% High Load Case Firm Wholesale Demand Reserve Margin, % 21% 15% 15% 15% 15% 15% 15% 15% 16% 16% 17% 15% 16% 16% 15% 15% Low Load Scenario For purposes of testing the Reference Case portfolio against a scenario in which energy use and demand are lower than in the base case, TEP assumes no significant new large customer or mining expansions occur within the planning horizon. Under this assumption, there is an 80MW reduction in peak load beginning in Page - 251
252 Tucson Electric Power Fuel, Market and Demand Risk Analysis TEP developed explicit market risk analytics for each portfolio through the use of computer simulation analysis using AuroraXMP 41. Specifically a stochastic based dispatch simulation was used to develop a view on future trends related to fuel prices 42, wholesale market prices, and retail demand. The results of this modeling was employed to quantify the risk of uncertainty and evaluate the cost performance of each portfolio. This type of analysis ensures that the selected portfolio not only has the lowest expected cost, but is also robust enough to perform well against a wide range of possible load and market conditions. As part of the Company s 2017 resource plan, TEP conducted risk analysis around the following key variables: Natural Gas Prices Wholesale Market Prices Retail Load and Demand Delivered Coal Prices 41 AURORAxmp is a stochastic based dispatch simulation model used for resource planning production cost modeling. Additional information about AURORAxmp can be found at 42 Both natural gas and coal. Page - 252
253 2017 Integrated Resource Plan Permian Natural Gas Prices As part of 2017 IRP analysis, TEP ran one hundred risk simulations to quantify the risk of uncertainty related to Permian natural gas prices. Chart 43 below details PACE Global Base Case (Clean Power Plan) Scenario and the natural gas price simulations against which the portfolios were evaluated. Chart 45 - Permian Basin Natural Gas Price Iterations ($/mmbtu) $16.00 $14.00 $12.00 $10.00 $/mmbtu $8.00 $6.00 $4.00 $2.00 $0.00 Jan-16 Jan-18 Jan-20 Jan-22 Jan-24 Jan-26 Jan-28 Jan-30 Jan-32 Jan-34 Jan-36 Page - 253
 $12.00 $10.00 $8.00 $/mmbtu $6.00 $4.")
254 Tucson Electric Power Permian Natural Gas Price Distributions Chart 46 shows the expected price distributions for natural gas sourced from the Permian Basin. These distributions are based on the stochastic data simulations shown in Chart 45 shown above. Chart 46 - Permian Basin Natural Gas Price Distributions ($/mmbtu) $12.00 $10.00 $8.00 $/mmbtu $6.00 $4.00 $2.00 $- Jan-16 Jan-18 Jan-20 Jan-22 Jan-24 Jan-26 Jan-28 Jan-30 Jan-32 Jan-34 Jan-36 95% Percentile 75% Percentile 50% Percentile 25% Percentile 5% Percentile Page - 254
255 2017 Integrated Resource Plan Palo Verde (7x24) Wholesale Power Prices As part of the 2017 IRP analysis, TEP ran one hundred risk simulations to quantify the risk of uncertainty related to wholesale power prices. Chart 47 below details PACE Global Base Case (Clean Power Plan) Scenario and the wholesale power price simulations against which the portfolio were evaluated. Chart 47 Palo Verde Wholesale Power Price Iterations ($/MWh) $ $ $ $/MWh $80.00 $60.00 $40.00 $20.00 $0.00 Jan-16 Jan-18 Jan-20 Jan-22 Jan-24 Jan-26 Jan-28 Jan-30 Jan-32 Jan-34 Jan-36 Page - 255
 Market Price Distributions $120.00 $100.00 $80.00 $/MWh $60.00 $40.00 $20.")
256 Tucson Electric Power Palo Verde (7x24) Market Price Distributions Chart 48 shows the expected price distributions for wholesale power sourced from the Palo Verde market. These distributions are based on the stochastic data simulations shown in Chart 47 shown above. Chart 48 - Palo Verde (7x24) Market Price Distributions $ $ $80.00 $/MWh $60.00 $40.00 $20.00 $- Jan-16 Jan-18 Jan-20 Jan-22 Jan-24 Jan-26 Jan-28 Jan-30 Jan-32 Jan-34 Jan-36 95% Percentile 75% Percentile 50% Percentile 25% Percentile 5% Percentile Page - 256
257 2017 Integrated Resource Plan Load Variability and Risk As outlined in the previous sections, load is also varied within each of the 100 simulations in accordance with the movement of natural gas and wholesale power prices. In this way, a wide variety of possible load growth scenarios are also considered in the simulation analysis and are therefore inherent in the resulting risk profiles. Chart 49 - TEP Peak Retail Demand (MW) 3,500 3,000 2,500 Peak Demand, MW 2,000 1,500 1, Page - 257
258
259 2017 Integrated Resource Plan CHAPTER 12 REFERENCE CASE PLAN TEP s 2017 IRP Reference Case Plan continues the Company s long-term strategy of resource diversification by taking advantage of near-term opportunities to reduce its higher cost coal capacity, expanding the deployment of renewable energy resources with a target of serving 30% of its retail load using renewable energy by 2030, continuing development and implementation of cost-effective EE measures, and adding high-efficiency natural gas resources. Resource Diversification In September 2016, TEP acquired the remaining 50.5% share of Springerville Unit 1, bringing its total capacity at Springerville to 793 MW with full ownership and operational control of Units 1 and 2. As part of the 2017 IRP Reference Case Plan, TEP plans to make the following coal capacity reductions over the next five years. By 2018 TEP will reduce its coal capacity at the San Juan Generation Station from 340 MW to 170 MW with the retirement of San Juan Unit 2. TEP will further reduce its overall coal capacity by 169 MW assuming the Navajo Generating Station ceases operation at the end of Finally, TEP will exit San Juan entirely when the current coal supply agreement ends in July The 2017 Reference Case Plan includes two large renewable energy projects coming online in These projects, consisting of 100 MW of wind and 80 MWAC of solar PV, are currently in procurement as PPAs. Further renewable energy is assumed to be added to the system between 2023 and 2030, consisting of a diversified mix of solar PV (fixed axis and SAT) and wind. To support the system in light of this high penetration of intermittent renewable energy, and to provide replacement capacity for the retirement of older, less efficient natural gas steam units at Sundt (Units 1 and 2), it is assumed that TEP installs approximately 192 MW of natural gas fired RICEs between 2020 and Additional renewable energy support and other ancillary services are to be provided with a number energy storage projects assumed to come on line between 2019 and These systems are assumed to be 50 MW projects with a storage discharge capacity of 50 MWh. 43 The 2019 retirement date is dependent upon receiving an extension of the lease agreement to allow for plant decommissioning prior to expiration of the lease. Without an extension of the current lease, plant closure would need to take place as early as this year to allow for decommissioning by the end of Page - 259
260 Tucson Electric Power Loads and Resource Assessment Chart 50 TEP s 2017 Loads and Resource Assessment Battery Stroage 100 MW 2019 to 2021 Battery Stroage 100 MW 2031 MW RICE 96 MW 2020 NGCC 412 MW & RICE 96 MW % Renewables by 2030 RICE 144 MW Coal Resources Natural Gas Resources Renewable Resources Demand Response Market Purchases Net Retail, Firm & Reserves Page - 260
261 2017 Integrated Resource Plan Addition of Resources to Meet System Requirements In considering future resources, the resource planning team evaluates a mix of load serving and grid balancing technologies. This mix of technologies includes both commercially available resources and developing technologies that are likely to become technically viable in the near future. The IRP process takes a high-level approach and focuses on evaluating resource technologies relevant to the needs of the system, rather than focusing on specific projects. Candidate resource additions designed to meet planning reserve requirements are identified for modeling and through an iterative process, a specific configuration in terms of technology, timing and capacity is arrived at based on cost factors (capital expense and Net Present Value [NPV]), reliability needs, and environmental performance. This approach allows the resource planning team to develop a widerange of scenarios and contingencies that result in a resource acquisition strategy that contemplates future uncertainties. Addition of Load Serving Resources To replace the near-term coal capacity reductions (508 MW between 2017 and 2022), TEP plans to add approximately 400 MW of NGCC capacity in NGCC is a high-efficiency intermediate to baseload resource, and given the current outlook on natural gas prices, represents the lowest LCOE among fully-dispatchable loadserving resources. NGCC units are also capable of load-following and, in the proper configuration, can provide fast ramping response. Addition of Grid Balancing and Load Leveling Resources An additional 150 MW of RICE capacity is assumed to commence operation in 2031 as the renewable energy capacity increases, and as older combustion turbine and natural gas steam units are retired, in addition to the retirement of Four Corners. The high efficiency of these units combined with their modular arrangement and fast start and fast ramp capabilities make them a highly flexible, cost effective alternative for addressing renewable intermittency as well as peak capacity. In addition to the 120 MW of battery ESS installed by 2021, the 2017 IRP Reference Case Plan assumes the addition of energy storage in This system would be 100 MW x 100 MWh and could provide a combination of ancillary, peak capacity and load-leveling services. Reference Case Plan Summary and Timeline Chart 51 and Chart 52 show the Reference Case Plan resource capacity additions and retirements by year, respectively. Chart 51 gives an indication of the source of replacement and make-up power due to unit retirements and increasing load. Figure 38 details the significant resource planning decisions assumed for the 2017 IRP Reference Case Plan. Page - 261
262 Tucson Electric Power Chart 51 - Reference Case Plan - New Resource Capacity Resource Capacity, MW 2,000 1,800 1,600 1,400 1,200 1, New Renewable Resources New Demand Response New NGCC Resources New Peaking Resources New Energy Storage Resources New SMR Resources Chart 52 - Reference Case Plan - Resource Retirements 1,200 1,000 Resource Capacity, MW Coal Resources Natural Gas Resources Combustions Turbines Page - 262

263 2017 Integrated Resource Plan Figure IRP Reference Case Plan Resource Timeline For modeling purposes, the 2017 IRP Reference Case Plan does not include any significant new transmission upgrades over the 15-year timeframe. The TEP Ten-Year Transmission Plan only includes one Planned project, which is a relatively small project anticipated for construction in Several conceptual projects were identified in the plan, however, the timing of these projects is expected to be determined through future transmission planning activities. TEP will update these conceptual project descriptions in future IRP filings as they are clarified. 44 Hassayampa Pinal West project is a 500kV line loop-in of 3 spans or less to connect an existing line to the Jojoba Switchyard - Page - 263

264 Tucson Electric Power Reference Case Plan Attributes The primary objective of the Reference Case Plan is to provide a portfolio of resources that reliably meets our customers energy needs at an affordable rate, while identifying and addressing potential risks to cost and reliability. TEP s 2017 Reference Case Plan achieves both of these objectives. Chart 53 and Chart 54, below show the growing diversity in energy and peak capacity, respectively, over the planning period. Chart 53 - Reference Case Plan, Annual Energy by Resource Chart 54 - Reference Case Plan, Total Coincident Peak Capacity Page - 264
265 2017 Integrated Resource Plan Existing Renewable Integration Requirements TEP s Reference Case Plan targets serving 30% of its retail load using renewable resources by These renewable resource additions result in a significant amount of new intermittent capacity, which requires a corresponding increase in Grid Balancing services to provide back-up capacity when those renewable resources are unavailable. As a measure of the ability to maintain reliability, Chart 57Chart 55, below shows TEP s existing 10-minute ramping capacity in comparison to the Company s projected reserve and ramping requirements. Chart 56 details TEP s current 10-minute ramping capacity by resource. Chart 55 TEP s Existing 10-Minute Ramping Capacity versus Projected Requirements Resource Capacity, MW Contingency Reserve Required Spinning Reserve Required Intermittent Renewable Ramping Requirements Portfolio 10 Minute Ramping Capacity Chart 56 - TEP s Existing 10-Minute Ramping Capacity by Resource Resource Capacity, MW Four Corners Navajo San Juan Springerville Gila River Luna Energy Sundt Units 1-4 DMP and North Loop 4 Page - 265
266 Tucson Electric Power Reference Case Plan Renewable Integration Requirements As shown on Chart 57 and Chart 58, TEP s Reference Case Plan portfolio additions of new reciprocating engines and battery storage in the 2020 timeframe will enable the Company to meet its near term and longer term 10- minute ramping requirements to reliability integrate the target of 30% renewable resources by Chart 57 TEP s Reference Case Plan 10-Minute Ramping Capacity versus Projected Requirements Resource Capacity, MW Contingency Reserve Required Spinning Reserve Required Intermittent Renewable Ramping Requirements Portfolio 10 Minute Ramping Capacity Chart 58 TEP s Reference Case Plan 10-Minute Ramping Capacity by Resource Resource Capacity, MW Four Corners Navajo San Juan Springerville Gila River Luna Energy Sundt Units 1-4 RICE Units DMP and North Loop 4 New Energy Storage Resources New Demand Response New NGCC Resources Page - 266
267 2017 Integrated Resource Plan Clean Power Plan Compliance As discussed in Chapter 3, TEP assumes that Arizona would adopt a subcategorized rate based approach for CPP compliance, while New Mexico and the Navajo Nation would adopt a mass-based approach. In addition, due to the economic advantages inherent in trading, TEP assumes that all three jurisdictions would enter a national trading pool. Chart 59 shows TEP s compliance position in Arizona under the Reference Case Plan. TEP s significant investment in renewable energy resources and continued EE deployment result in a surplus of ERC s that would be available for sale or could be banked for future compliance periods. Chart 59 - TEP Reference Case Plan CPP Compliance, Arizona Page - 267
268 Tucson Electric Power Chart 60 shows TEP s compliance position in New Mexico and the Navajo Nation, combined. The significant retirement of affected coal-fired units in these jurisdictions results in a surplus of emission allowances during each compliance period. Chart 60 - TEP Reference Case Plan CPP Compliance, New Mexico and Navajo Nation TEP Tribal and New Mexico Emission Allowances (million short tons) TEP Affected Emissions TEP Allowances Page - 268
269 2017 Integrated Resource Plan Reference Case Plan Risk Dashboard While there are many risk factors directly or indirectly associated with each resource portfolio, they all stem from the fact that operating under a fully integrated electric utility model requires very large capital investments that generally need to be paid for over many years. Our goal is to develop a Reference Case Plan that provides optionality to make adjustments should there be a major change in future market and regulatory outcomes. Still, risk cannot be eliminate; therefore, key risk factors need to be identified and measured. TEP developed a Risk Dashboard below as a means to bring attention to the primary risk factors effecting future resource decisions. CO2 Emissions While the Reference Case Plan is evaluated for comliance with the CPP as discussed above, the ultimate outcome of the CPP litigation is uncertain, and the current IRP planning horizon extends beyond the CPP implementation period. TEP believes that CO2 emission reductions will eventually be required, though the timing and magnitude of those reductions remains uncertain. TEP believes that the Reference Case Plan CO2 emission reductions (in excess of 30% by 2032) represents a balanced position in the event of a future CO2 emission compliance requirement. Water Consumption Water availability for power generation is an ongoing concern, especially in the Desert Southwest. Low surface water levels due to drought and changing weather patters suggest that a long-term goal to reduce surface water consumption is appropriate. Consumption of groundwater is much more site-specific. TEP believes that the 100% reduction in surface water consumption and nearly 30% reduction in water consumption overall by 2032 realized under the Reference Case Plan is a significant outcome in terms of managing future water supply risk. Natural Gas Usage Over the past five decades, TEP s resource mix has been dominated by coal-fired generation. While making a strategic effort to diversify its resource portfolio, which includes replacing coal-fired generation with natural gas and renewable resources, the Company is mindful of not going too far, thus creating an overreliance on natural gas. TEP believes the Reference Case Plan resource mix appropriately manages the risk of overreliance on one resource type. Capital Expenditures A long-term resouce plan should provide the optionality to make course corrections to address uncertainties (market performance, technolgy development, regulatory changes, etc.) and well as unforeseen circumstances. That optionality can be lost due to large, near-term capital investments. The 2017 Reference Case Plan portfolio stages major capital investments farily evenly over the 15-year planning period. Page - 269
270 Tucson Electric Power Chart 61 Reference Case Plan Risk Dashboard 40% 35% 30% 25% 20% 15% 10% 5% 0% CO 2 Emission Reductions 12,000 34% 29% 30% 10,000 26% 26% 8,000 16% 6,000 4,000 2, Tons (000) 7,000 6,000 5,000 4,000 3,000 2,000 1,000 - Water Consumption, million gallons Surface Water Groundwater Natural Gas Usage, GWh 16,000 14,000 12,000 10,000 8,000 6,000 4,000 2, Natural Gas/Purchase Power Coal Renewables $2,500 $2,000 $1,500 $1,000 $500 $0 $337 Cumulative CapEx, $millions, Nominal $643 $1,831 $1,512 $1,647 $2, Page - 270

271 2017 Integrated Resource Plan Load Growth Scenario Analysis High Load Scenario The high load growth scenario assumes a continuation of firm wholesale contracts at levels consistent with those in the near term. Under the Reference Case load, firm wholesale obligations remain steady through 2022 at just over 150 MW, then begin to decrease as current contracts expire. The high load scenario maintains firm wholesale obligations at 160 MW from 2023 through the end of the planning period, which results in an increase in peak demand ranging from 31 to 116 MW compared to the Reference Case Plan. The Reference Case Plan has excess reserve beginning in 2025 due to the significant increase in renewable energy as well as the ramping resources needed with that high level of renewable penetration. Therefore, the capacity of additional resources needed under the high load scenario do not need to match the 116 MW increase observed between the Reference Case and the high load scenario in order to maintain an adequate reserve margin. Between 36 MW and 72MW of additional capacity was determined to be sufficient. The high load scenario utilizes RICE resources to fill this additional capacity need. Adjustments to the 2017 Reference Case Plan to meet the high load scenario are presented on Figure 39. Figure 39 - High Load Scenario Adjustments to the 2017 Reference Case Plan Page - 271

272 Tucson Electric Power Low Load Scenario The low load growth scenario assumes that there is no new mining expansions within the planning period, which results in a decrease in peak demand, and load, of approximately 80 MW compared with the Reference Case Plan, beginning in 2022, and extending through the end of the planning period. The timing of this decrease coincides with RICE and NGCC resource additions in the Reference Case Plan. Therefore, decreasing the amount of additional capacity is a logical approach for adjusting to this decrease in load. Given the nature of mining load (approximately 85% load factor), and the fact that the RICEs are intended to support increases in renewable energy resources, the low load scenario reduces the amount of additional NGCC capacity needed in Adjustments to the 2017 Reference Case Plan to meet the low load scenario are presented on Figure 40. Figure 40 - Low Load Scenario Adjustments to the 2017 Reference Case Plan Page - 272
273 2017 Integrated Resource Plan CHAPTER 13 ALTERNATIVE PORTFOLIOS The following sections present a description and the results of alternative portfolios analyzed as part of this IRP. The list of portfolios analyzed is presented below. Energy Storage Case Plan Small Nuclear Reactors Case Plan (combined with Full Coal Retirement) Expanded Energy Efficiency Case Plan High Solar Case Plan (substituted for the Expanded Renewables Case Plan) This list of alternative portfolios varies slightly from the list presented in the March 2016 Preliminary Integrated Resource Plan. High load and low load growth scenarios were analyzed in the context of the Reference Case Plan in Chapter 12, where adjustments were made to the portfolio to account for those differing load assumptions. The Full Coal Retirement Case Plan was combined with the Small Nuclear Reactor Case plan based on the view that coal and nuclear resources provide the same service (fully dispatchable load serving resources), and as a means of maintaining some resource diversity in the absence of coal-fired generation. A Market-Based Reference Case Plan was not analyzed because under the Reference Case Plan, TEP has capacity in excess of the 15% reserve margin in all years beyond the five years where market purchases can be included in the portfolio. The Expanded Renewables Case Plan was substituted with a High Solar Case Plan as the Reference Case Plan portfolio already had high renewable energy assumptions. The High Solar Case Plan allows for analyzing the effects of lower diversity in the renewable energy mix. Page - 273
274 Tucson Electric Power Overview of the Energy Storage Portfolio In the Expanded Energy Storage Portfolio, the 100 MW x 100 MWh ESS implemented in 2031 in the Reference Case Plan is replaced with a pair of bulk energy storage systems implemented in 2022 and Each bulk system is assumed to be 100 MW x 400 MWh. Unlike the ESSs included in the Reference Case Plan, which are intended to provide ancillary services, the bulk ESSs are intended to provide both ancillary and energy services, such as capacity, levelization of thermal-based electricity generation, and following of load. Bulk storage systems can also reduce operating costs by storing energy when it is relatively inexpensive to generate and releasing it when it would otherwise be most expensive to generate, and such arbitrage opportunities are expected to become more common in the Southwest as the increased use of renewable energy creates greater intra-day wholesale electricity price variations. The first bulk ESS in this portfolio is assumed to be operating by This coincides with the expected timing of greater arbitrage opportunities and the full retirement of the San Juan Generating Station, which would have the effect of reducing emissions associated with recharging the ESS. This ESS would also obviate the need for the five RICEs assumed to come on line in 2022 in the Reference Case Plan, which are therefore removed from the Energy Storage Portfolio. The second bulk ESS is assumed to be operating by 2025, which coincides with the highest year of assumed renewable energy expansion after Implementing this second ESS in 2025, as opposed to implementing both in 2022, also provides more time for ESSs to improve in terms of performance and costs. In fact, analyses by Lazard and DNV GL suggest that by 2025 the cost of lithium-ion bulk ESSs will be approximately the same as pumped hydro energy storage, which may also be an energy storage option around that time. Finally, a 2025 implementation date would allow three combustion turbines at North Loop and two at Sundt to retire three years earlier than planned in the Reference Case Plan. Both bulk ESSs in this portfolio are modeled as lithium-ion battery technology, partly because of their rapidly declining costs and partly because of the greater flexibility they provide over more traditional forms of energy storage in terms of modularity, scaling, siting, and multiple uses e.g. energy services, ancillary services, and transmission and distribution cost deferral. However, the results of the analysis would likely hold for other forms of energy storage such as pumped hydro. Expanded Energy Storage Portfolio adjustments to the Reference Case Plan are presented on Figure 41. Page - 274

275 2017 Integrated Resource Plan Figure 41 - Expanded Energy Storage Adjustments to the Reference Case Plan Page - 275

276 Tucson Electric Power Overview of the SMR - Full Coal Retirement Portfolio In Decision No , as a result of the 2014 IRP, the ACC requested that load-serving entities study a scenario that includes the addition of SMRs. As ordered by the ACC in the 2012 IRP, TEP generated a scenario called Full Coal Retirement Case. This case was studied in the 2014 IRP in anticipation of potential alternative outcomes resulting from EPA Regional Haze mandates. The Clean Power Plan further instigated a review of expanded coal retirements. As TEP was analyzing and designing each of these scenarios, it was evident that any scenario involving SMR would assume a replacement of base-load generation. The full coal requirement would need base-load type replacement; it only made sense to merge these two scenarios. Small Nuclear Reactors Full Coal Retirement Case Small Nuclear Reactors are a technology that can be utilized to lower CO2 emissions, as well as other pollutants, while providing reliable, sustained and efficient power output. In this case, TEP studied the impact of SMRs as a resource to supplant retiring base load coal assets. This case was designed to fully meet the EE standards as well as exceed the renewable standard with the TEP 30% target as described throughout this document. The assumptions in the Reference Case Plan remain, except for the changes illustrated in Figure 42 below. In addition to the coal unit closures presented in the Reference Case Plan, the following closures were also assumed: Springerville Unit 1 in 2025, and Four Corners Units 4&5 in Replacement capacity is also shown in the figure below-- an additional 200 MW of RICE and 105 MW of NGCC is needed in The storage project assumed for 2031 in the Reference Case Plan, was advanced to 2028 in this scenario. The lead time for a nuclear project is over 10 years, this scenario assumes a commission date for 500 MWs of SMR in Figure 42 SMR & Coal Retirement Case Resource Timeline for Existing Resources Page - 276
277 2017 Integrated Resource Plan Overview of Expanded Energy Efficiency For purposes of this portfolio, it is assumed that TEP realizes additional EE in the time period from 2021 through the The higher levels of EE assumed under this portfolio are based on the high achievable potential estimated by EPRI 45. In comparison with the achievable potential assumed in the Reference Case Plan, in which market constraints include both market acceptance factors as well as program implementation factors, the high achievable potential excludes program implementation factors. Higher levels of energy savings will necessitate greater investment in DSM program activities. However, it is difficult to estimate the amount of additional DSM investment needed to attain a particular energy savings goal. Therefore, for this portfolio, TEP estimated no annual incremental DSM program cost escalation. In other words, the 1 st -year $/MWh cost is the same in the Expanded Energy Efficiency Case as it is in the Reference Case Plan. This likely underestimates that cost of achieving the savings assumed in the Expanded Energy Efficiency Case. Under this portfolio, the total energy savings realized by the Company in 2032 is 2,140 GWh, compared with 1,894 GWh in the reference case (see Chart 62). Total DSM program investment for the period from 2021 through 2032 under the Expanded Energy Efficiency portfolio was $584M compared with $365M in the reference case. Combining system fuel savings with additional program expenses, the Expanded Energy Efficiency portfolio was $35M net present value more expensive than the Reference Case Plan over the planning period. However, for programs in the latter part of the planning period, energy savings extending beyond the planning period are not captured in the net present value calculation. The additional energy savings in this portfolio also provides a slight capacity benefit, as the average reserve margin form 2025 to 2030 is 19.6% compared with 18.4% in the reference case. However, for purposes of this portfolio, no deferrals in additional capacity or earlier retirement of existing capacity were deemed appropriate. Much of the excess reserve margin is associated with a ramp up in renewable energy starting in 2023, in combination with firm resources needed to balance the intermittency of that renewable energy. Chart 62 - Projected Energy Savings (GWh) 2,500 2,000 1,500 GWh 1, Reference Case This Case 45 U.S. Energy Efficiency Potential Through 2035, Electric Power Research Institute, dated April Page - 277
278 Tucson Electric Power Due to the uncertainty in estimating the DSM program investment needed to achieve the energy savings projected in the Expanded Energy Efficiency portfolio, it may be informative to divide the fuel savings resulting from the expanded energy savings (based on EPRI s high achievable potential ) by the total incremental energy savings, without considering any incremental DSM program costs. This provides a target investment for additional DSM programs as presented in Table 22 below. Table 22 - Target Investment for Additional Energy Savings Incremental NPV Fuel Savings $30,950,000 Incremental Energy Savings 1,286 GWh Target Investment (2017$) $24.07/MWh As stated previously, TEP does not anticipate that DR will be an economically feasible option for short-term capacity prior to 2022, and beyond that time, TEP does not project a significant need for short-term capacity. Therefore, TEP did not incorporate expanded DR programs into this portfolio. TEP intends to shift toward designing DLC programs that are capable of cost-effectively addressing periods of significant ramping, anticipated with high penetration of renewable resources, and will evaluate higher levels of DR in future IRP planning cycles. Page - 278

279 2017 Integrated Resource Plan Overview of the Expanded Renewable Portfolio The Reference Case Plan implements a diversified renewable portfolio that targets serving 30% of TEP s retail load by The renewable portfolio under the Reference Case Plan is comprised of 60% solar resources and 40% wind resources. In comparison, the Expanded Renewable plan examines the long-term cost impacts of a heavy solar portfolio. Even though solar projects are projected to be less expensive and the solar output has a greater coincidence with TEP s system peak (particularly single axis tracking), the heavy solar portfolio results in higher 10-minute ramping requirements. In comparison with the Reference Case Plan, the Expanded Renewable portfolio requires additional 100 MW of fast start reciprocating engines in The Expanded Renewable portfolio with a high concentration of solar resources is shown in Figure 43 below. Figure 43 Expanded Renewable Portfolio (Heavy Solar) vs. Reference Case Plan Page - 279
280 Tucson Electric Power Chart 63 shows how the 10-minute ramping requirements under the Expanded Renewable portfolio with a high concentration of solar resources increases beyond the 10-minute ramping requirements in the Reference Case Plan. Chart 64 shows the 10-minute ramping requirements for the Reference Case Plan. Chart 63 Expanded Renewable Portfolio 10-Minute Ramping Requirements 800 Resource Capacity, MW Solar Fixed 38% Solar SAT 50% Wind 12% Contingency Reserve Required Spinning Reserve Required Intermittent Renewable Ramping Requirements Portfolio 10 Minute Ramping Capacity Chart 64 Reference Case Plan 10-Minute Ramping Requirements 800 Resource Capacity, MW Solar Fixed 27% Solar SAT 33% Wind 40% Contingency Reserve Required Spinning Reserve Required Intermittent Renewable Ramping Requirements Portfolio 10 Minute Ramping Capacity Page - 280
281 2017 Integrated Resource Plan Overview of Major IRP Assumptions by Portfolio Table 23 below summaries the major assumptions and environmental upgrades that are included in each case. Table 23 Major IRP Assumptions by Case Major Assumptions Reference Expanded Storage Expanded Renewables Expanded Energy Efficiency SMR - Coal Retirement Energy Efficiency Renewable Energy Fully compliant with the Arizona EE Standard (22% by 2020). From 2021 on, EE Programs based on EPRI s estimate of Achievable Savings. Targets Serving 30% of Retail Load from both Utility Scale Renewables and DG by % Solar & 40% Wind (utility scale) Same as Reference Case Plan Same as Reference Case Plan Same as Reference Case Plan Targets 30% by 2030 Sourced from 90% Solar & 10% Wind Same as Reference Case Plan. From 2021 on, EE Programs based on EPRI s estimate of High Achievable Savings Same as Reference Case Plan Same as Reference Case Plan Same as Reference Case Plan Storage Resources 220 MW 205 MWh In-Service by MW 905 MWh In-Service by 2025 Same as Reference Case Plan Same as Reference Case Plan Same as Reference Case Plan Coal Capacity Reductions 36% by % by 2032 Same as Reference Case Plan Same as Reference Case Plan Same as Reference Case Plan 63% by % by 2032 Production Changes 2017 versus 2032 Reference Case Plan Expanded Storage Expanded Renewables Expanded Energy Efficiency SMR - Coal Retirement Water Consumption -17% -17% -17% -17% -33% CO2 Emissions -21% -21% -24% -22% -75% NOx Emissions -40% -40% -40% -40% -90% SO2 Emissions -17% -17% -17% -17% -100% Natural Gas Consumption +91% +91% +78% +84% +136% CapEx (Nominal $millions) Reference Case Expanded Storage Expanded Renewables Expanded Energy Efficiency SMR - Coal Retirement CapEx $993 $1,164 $1,031 $993 $993 CapEx $480 $641 $851 $480 3,892 Total CapEx $1,473 $1,805 $1,882 $1,473 $4,885 Page - 281
282 Tucson Electric Power Summary of NPV Revenue Requirements by Scenario Chart 65 below summarizes the net present value revenue requirements (NPVRR) for each of the PACE Global scenarios modeled in the 2017 IRP. The Reference Case Plan results in the lowest cost portfolio under the Base Case and the High Economy scenarios whereas the Expanded Renewable Case is the lowest cost portfolio under the High Technology scenario because capital costs for solar technologies decline at a faster rate than that of wind. Chart 65 NPV Revenue Requirements by Scenario $15,500,000 Portfolio Net Present Value ($000) $15,000,000 $14,500,000 $14,000,000 $13,500,000 $13,000,000 Reference Expanded Storage Expanded Renewable High Energy Efficiency SMR - Coal Retirement High Economy Scenario Base Case High Technology Scenario Page - 282
283 2017 Integrated Resource Plan Summary of NPV Revenue Requirements Base Case Scenario Table 24 below summaries the NPVRR for each portfolio under the Base Case scenario. Table 24 NPV Revenue Requirements Base Case Scenario Non Fuel Revenue Requirements, $000 Reference Expanded Storage Expanded Renewable High Energy Efficiency SMR - Coal Retirement Existing T&D Resources $4,061,825 $4,061,825 $4,061,825 $4,061,825 $4,061,825 Existing Generation Resources $3,909,337 $3,905,335 $3,909,337 $3,909,337 $3,732,095 New Generation Resources $695,575 $593,721 $758,243 $695,575 $1,707,209 Storage Resources $140,203 $454,732 $140,203 $140,203 $149,131 New Renewable Resources $79,736 $79,736 $176,658 $79,736 $79,736 Total Non-Fuel Revenue Requirements $8,886,676 $9,095,349 $9,046,266 $8,886,676 $9,729,996 Existing Transmission Expenses $237,009 $237,009 $237,009 $237,009 $237,009 Total Non-Fuel Revenue Requirements $9,123,685 $9,332,358 $9,283,275 $9,123,685 $9,967,005 Fuel & Purchase Power, $000 Reference Expanded Storage Expanded Renewable High Energy Efficiency SMR - Coal Retirement Total PPFAC Costs $4,133,336 $4,074,618 $3,955,869 $4,102,386 $4,170,264 Energy Efficiency and Renewables, $000 Reference Expanded Storage Expanded Renewable High Energy Efficiency SMR - Coal Retirement Energy Efficiency $285,450 $285,450 $285,450 $351,404 $285,450 Demand Response $39,714 $39,560 $39,532 $39,665 $39,803 Total Energy Efficiency $325,164 $325,010 $324,982 $391,069 $325,253 Total Renewables $400,139 $400,139 $451,998 $400,139 $400,139 Total Energy Efficiency and Renewables $725,303 $725,149 $776,980 $791,208 $725,392 Total System Revenue Requirements $13,982,324 $14,132,125 $14,016,124 $14,017,279 $14,862,661 NPV Difference from Reference Case Plan $149,800 $33,799 $34,954 $880,336 Page - 283
284 Tucson Electric Power Summary of NPV Revenue Requirements High Economy Scenario Table 25 below summaries the NPVRR for each portfolio under the High Economy scenario. Table 25 NPV Revenue Requirements High Economy Scenario Non Fuel Revenue Requirements, $000 Reference Expanded Storage Expanded Renewable High Energy Efficiency SMR - Coal Retirement Existing T&D Resources $4,061,825 $4,061,825 $4,061,825 $4,061,825 $4,061,825 Existing Generation Resources $3,909,337 $3,905,335 $3,909,337 $3,909,337 $3,732,095 New Generation Resources $753,202 $648,331 $818,773 $753,202 $1,766,772 Storage Resources $144,302 $481,654 $144,302 $144,302 $151,944 New Renewable Resources $94,246 $94,246 $204,728 $94,246 $94,246 Total Non-Fuel Revenue Requirements $8,962,912 $9,191,391 $9,138,965 $8,962,912 $9,806,882 Existing Transmission Expenses $237,009 $237,009 $237,009 $237,009 $237,009 Total Non-Fuel Revenue Requirements $9,199,921 $9,428,400 $9,375,974 $9,199,921 $10,043,891 Fuel & Purchase Power, $000 Reference Expanded Storage Expanded Renewable High Energy Efficiency SMR - Coal Retirement Total PPFAC Costs $4,677,093 $4,563,367 $4,457,733 $4,635,803 $4,840,984 Energy Efficiency and Renewables, $000 Reference Expanded Storage Expanded Renewable High Energy Efficiency SMR - Coal Retirement Energy Efficiency $285,450 $285,450 $285,450 $351,404 $285,450 Demand Response $40,167 $39,969 $39,904 $40,100 $40,305 Total Energy Efficiency $325,617 $325,419 $325,354 $391,504 $325,755 Total Renewables $299,841 $299,841 $382,211 $299,841 $299,841 Total Energy Efficiency and Renewables $625,458 $625,260 $707,565 $691,345 $625,596 Total System Revenue Requirements $14,502,472 $14,617,027 $14,541,272 $14,527,069 $15,510,471 NPV Difference from Reference Case Plan $114,555 $38,800 $24,597 $1,007,999 Page - 284
285 2017 Integrated Resource Plan Summary of NPV Revenue Requirements High Technology Scenario Table 26 below summaries the NPVRR for each portfolio under the High Technology scenario. Table 26 NPV Revenue Requirements High Technology Scenario Non Fuel Revenue Requirements, $000 Reference Expanded Storage Expanded Renewable High Energy Efficiency SMR - Coal Retirement Existing T&D Resources $4,061,825 $4,061,825 $4,061,825 $4,061,825 $4,061,825 Existing Generation Resources $3,909,337 $3,905,335 $3,909,337 $3,909,337 $3,732,095 New Generation Resources $622,882 $525,553 $681,195 $622,882 $1,620,599 Storage Resources $129,934 $380,104 $129,934 $129,934 $145,764 New Renewable Resources $62,402 $62,402 $104,930 $62,402 $62,402 Total Non-Fuel Revenue Requirements $8,786,380 $8,935,219 $8,887,221 $8,786,380 $9,622,685 Existing Transmission Expenses $237,009 $237,009 $237,009 $237,009 $237,009 Total Non-Fuel Revenue Requirements $9,023,389 $9,172,228 $9,124,230 $9,023,389 $9,859,694 Fuel & Purchase Power, $000 Reference Expanded Storage Expanded Renewable High Energy Efficiency SMR - Coal Retirement Total PPFAC Costs $3,464,140 $3,453,215 $3,344,143 $3,449,172 $3,411,727 Energy Efficiency and Renewables, $000 Reference Expanded Storage Expanded Renewable High Energy Efficiency SMR - Coal Retirement Energy Efficiency $285,450 $285,450 $285,450 $351,404 $285,450 Demand Response $39,282 $39,199 $39,186 $39,255 $39,314 Total Energy Efficiency $324,732 $324,649 $324,636 $390,659 $324,764 Total Renewables $525,799 $525,799 $538,852 $525,798 $525,799 Total Energy Efficiency and Renewables $850,531 $850,448 $863,488 $916,457 $850,563 Total System Revenue Requirements $13,338,060 $13,475,891 $13,331,861 $13,389,018 $14,121,984 NPV Difference from Reference Case Plan $137,831 ($6,199) $50,958 $783,924 Page - 285
286 Tucson Electric Power Distribution of NPV Revenue Requirements by Portfolio The degree to which each portfolio is able to adequately meet future load serving requirements at a reasonable cost is measured by examining the distribution of its NPVRR outcomes for each portfolio across multiple stochastic iterations. The performance of each portfolio is summarized in the following charts. Chart 66 shows each histogram comparing the frequency of outcomes for each of the candidate portfolios. All histograms are represented on the same scale. Portfolios showing a large number of outcomes (higher bars) on the right side of the graph represent high cost options relative to the others resource portfolios. Higher risk is reflected by lower bars spread over more tranches. Chart 66 Distribution of NPVRR by Portfolio Reference Case Portfolio Expanded Storage Portfolio Frequency Frequency More 14,450,000 14,375,000 14,300,000 14,225,000 14,150,000 14,075,000 14,000,000 13,925,000 13,850,000 More 14,450,000 14,375,000 14,300,000 14,225,000 14,150,000 14,075,000 14,000,000 13,925,000 13,850,000 NPV Revenue Requirements ($000) NPV Revenue Requirements ($000) Expanded EE Portfolio Expanded Renewable Portfolio Frequency Frequency More 14,450,000 14,375,000 14,300,000 14,225,000 14,150,000 14,075,000 14,000,000 13,925,000 13,850,000 More 14,450,000 14,375,000 14,300,000 14,225,000 14,150,000 14,075,000 14,000,000 13,925,000 13,850,000 NPV Revenue Requirements ($000) NPV Revenue Requirements ($000) Page - 286
287 2017 Integrated Resource Plan Distribution of NPV Revenue Requirements by Portfolio Chart 67 below shows the distribution of NPVRR on the same chart. Chart 67 Aggregated NPVRR by Portfolio Frequency More 14,500,000 14,475,000 14,450,000 14,425,000 14,400,000 14,375,000 14,350,000 14,325,000 14,300,000 14,275,000 14,250,000 14,225,000 14,200,000 14,175,000 14,150,000 14,125,000 14,100,000 14,075,000 14,050,000 14,025,000 14,000,000 13,975,000 13,950,000 13,925,000 13,900,000 13,875,000 13,850,000 NPV Revenue Requirements ($000) Reference Case Portfolio Expanded EE Portfolio Expanded Renewable Portfolio Expanded Storage Portfolio Page - 287
288 Tucson Electric Power NPVRR Mean and Worst Case Risk Chart 68 summarizes each portfolio with respect to both the expected average NPVRR and the worst case outcome risk as represented by the 95 th percentile of its NPVRR outcomes. Values lower on the graph and farther to the left, represent lower risk and lower cost portfolios. Chart 68 Summary of NPVRR Mean and Risk 15,000,000 14,900,000 Coal Retirement & SMR Portfolio 14,800,000 95th Percentile of NPVRR ($000) 14,700,000 14,600,000 14,500,000 14,400,000 14,300,000 14,200,000 Expanded Storage 14,100,000 14,000,000 Reference Case Expanded EE Expanded Renewables 13,900,000 13,800,000 14,000,000 14,200,000 14,400,000 14,600,000 14,800,000 15,000,000 15,200,000 Expected Nominal NPVRR ($000s) Page - 288
289 2017 Integrated Resource Plan CHAPTER 14 FIVE-YEAR ACTION PLAN The 2017 Reference Case Plan was chosen as the preferred portfolio plan based on current forecasts and assumptions. TEP has developed a five year action plan based on the resource decisions that are contemplated in this IRP. Under this action plan, additional detailed study work will be conducted to validate all technical and financial assumptions prior to any final implementation decisions. TEP s action plan includes the following: TEP plans to continue with its community-scale build out of renewable energy to achieve a diverse portfolio that targets 30% of retail load from renewable generation by As a result, over the next five years, TEP is targeting the addition of 100 MW of utility-scale wind and 100 MW of utility-scale solar resources. As part of TEP s portfolio diversification strategy, the Company is reducing its coal resource capacity by 508 MW over the next five years, which represents 36% of our current coal capacity. These planned coal retirements will enable TEP to take advantage of near-term opportunities to reduce costs and rebalance its resource portfolio over the longer-term. This reduction in coal resources will result in significant costs saving 46 for TEP customers and will result in meaningful reductions in air emissions and water consumption 47. In order to accommodate increased renewable energy resources, and to allow for the retirement of older gas steam units at the Sundt Generating Station, TEP plans to move forward with a generating resource modernization plan at Sundt over the next few years. As part of this current resource planning cycle, TEP conducted a Flexible Generation Technology Assessment 48 with Burns & McDonnell in The results of this study indicate that RICE technology is the preferred technology that will provide capacity and assist in mitigating renewable energy intermittency and variability. TEP plans to move forward with issuing a Request for Proposal for these fast-responding resources that will meet the 2020 and 2022 timeline. TEP will continue to implement cost-effective EE programs based on the Arizona EE Standard. TEP will closely monitor its EE program implementations and adjust its near-term capacity plans accordingly. TEP will continue to monitor closely and implement DR programs that are mutually beneficial to the Company and its customers. TEP is optimistic about the potential of energy storage systems as a technology and as an economically viable solution to provide peak capacity and renewable intermittency mitigation. The Reference Case 46 As part of the 2014 IRP analysis, TEP avoided approximately $165 in pollution controls with its commitment to retire San Juan Unit 2 at the end of In the 2017 IRP analysis, TEP s customers will realize an additional net present value savings of approximately $179 million related to the retirement of TEP s ownership interest in Navajo at the end of 2019 and the retirement of TEP s ownership interest in San Juan Unit 1 at the end of June The retirement of both Navajo and San Juan Units 1 and 2 results in reductions in TEP s total system emissions of 15.8% for carbon dioxide (CO2), 29.8% for nitrous oxides (NOx), and 9.8% for sulfur dioxide (SO2). In addition, the retirement of the Navajo and San Juan units show water consumption is reduced by approximately 2,599 acre feet per year, an overall savings of 16.18%. 48 See the 2017 Flexible Generation Technology Assessment in Appendix B. Page - 289
290 Tucson Electric Power Plan includes the addition of a 50 MW battery project for 2019 and another 50 MWs for TEP will continue to monitor the advance of ESS and may opt to issue a RFP in the near future. TEP s 2017 Reference Case Plan recommends the addition of 413 MW of natural gas combined cycle capacity in As part of its near-term portfolio strategy, TEP will continue to utilize the wholesale market for the purchase of short-term market based capacity products. In addition, TEP will continue to monitor the wholesale market for other resource alternatives such long-term PPAs and near-term low cost plant acquisitions. TEP will also monitor and adjust its natural gas hedging requirements as it reduces its reliance on coal based generation in favor of natural gas resources. Recommendations will be made on potential fuel hedging changes if they become necessary. TEP and other Arizona utilities continue to evaluate the potential benefits of in-ground natural gas storage. Local storage would improve the ability of natural gas generation units to respond to changing loads as well as the intermittency caused by renewable resource. Due to the distance of Arizona s largest load pockets of Phoenix and Tucson from the San Juan and Permian natural gas production basins, local natural gas storage (if available and constructed) would be able to more quickly supply natural gas during shortfalls and store excess natural gas during periods when the natural gas mainlines experienced operational limitations. As with any planning analysis, the 2017 IRP represents a snapshot in time based on known and reasonable planning assumptions. It is important to note that eventual closure of San Juan and Navajo Generating Stations is given a high probability to occur. Even after the 2017 IRP filing date, TEP anticipates that the plant participants will continue to work through the complex issues surrounding plant operating agreements, fuel contracts, land leases, economic analysis and environmental impact reviews before the final resource decisions are made. Given the confidential nature of these decisions, TEP plans to communicate any major change in its anticipated resource plan with the ACC as part of its ongoing planning activities. TEP hopes this dialog will engage the Commission on important resource planning issues while providing TEP with greater regulatory certainty with regards to future resource decisions. TEP requests that the Commission approve its 2017 Integrated Resource Plan as provided in A.A.C. R B. and the associated actions herein. Figure 44 -TEP s 2017 IRP Reference Case Plan Milestone Timeline Page - 290
291 2017 Integrated Resource Plan APPENDIX A PACE GLOBAL FUTURE STATES OF THE WORLD


292 4401 Fair Lakes Court Fairfax, VA USA Phone: Pace Global Future States of the World Tucson Electric Power and UNS Electric 2017 Integrated Resource Planning Scenarios December 2016 Setting the Pace in energy since 1976 Pace Global LLC
293 TABLE OF CONTENTS Introduction... 3 Natural Gas - Base Case Scenario... 6 Natural Gas High Technology Scenario... 6 Natural Gas High Economy Scenario... 7 Coal Base Case Scenario... 8 Coal High Technology Scenario... 8 Coal High Economy Scenario... 8 Load Growth Base Case Scenario Load Growth High Technology Scenario Load Growth High Economy Scenario CO2 Emission Prices Base Case Scenario CO2 Emission Prices High Technology Scenario CO2 Emission Prices High Economy Scenario Capital Costs Base Case Scenario Capital Costs High Technology Scenario Capital Costs High Economy Scenario Energy Prices Base Case Scenario Energy Prices High Technology Scenario Energy Prices High Economy Scenario Coal Plant Retirements and Resource Additions Base Case Scenario Coal Plant Retirements and Resource Additions High Technology Scenario Coal Plant Retirements and Resource Additions High Economy Scenario EXHIBITS Exhibit 1: Pace Global s Fundamental Supply and Demand Models... 3 Exhibit 2: Pace Global Scenarios with Indicative Market Movements... 5 Exhibit 3: Henry Hub Natural Gas Price Outlook... 7 Exhibit 4: Powder River Basin ( PRB ) and Arizona New Mexico Coal Price Outlook... 8 Exhibit 5: Arizona Average and Peak Demand Forecast Exhibit 6: CO2 Emission Price Outlook Exhibit 7: Capital Cost Outlook Exhibit 8: Arizona Wholesale Power Price Outlook Proprietary & Confidential Page 2 Pace Global LLC
 2017 Integrated Resource Planning assumptions and developed deterministic market inputs for")
294 INTRODUCTION Pace Global s future states of the world are characterized by three discrete scenarios with varying economic drivers that represent three separate forecasts of forward market conditions. Pace Global identified three market scenarios that were most relevant for Tucson Electric Power s ( TEP ) 2017 Integrated Resource Planning assumptions and developed deterministic market inputs for each scenario. These forecasts were developed utilizing Pace Global s fundamental supply & demand models 1 which derive long-term natural gas and forward wholesale power prices. Exhibit 1: Pace Global s Fundamental Supply and Demand Models Pace Global s analysis was performed under three states of the world intended to capture a range of potential outcomes in order to test various resource portfolios against uncertain market conditions. These scenarios are defined as: 1. Base Case Scenario 2. High Technology Scenario 3. High Economy Scenario The Base Case Scenario features existing regulations, gradually rising mid-term gas prices (in real terms), continuing technological growth, low load growth and generally moderate market outcomes. Power market participants are able to adapt and adjust in a timely manner to changing market forces. The High Technology Scenario is characterized by significant advances in energy storage technology, renewable energy deployment, emissions reduction and CO2 removal technology, high efficiency natural gas-fired generation, and also natural gas extraction productivity improvements. These conditions tend to 1 Pace Global utilizes AuroraXMP and the Gas Pipeline Competition Model ( GPCM ) to develop its long term natural gas and energy prices. Proprietary & Confidential Page 3 Pace Global LLC
295 subdue fuel prices, power prices and capital costs, and put pressure on coal plant economics, resulting in additional retirements. However, there are also significant developments in technologies that improve energy efficiency, which helps to mitigate load growth that might otherwise be expected in a high technology scenario with robust economic growth. The High Economy Scenario is characterized by a robust and growing U.S. economy that keeps upward pressure on all of the major market outcome categories, including load growth, fuel costs, power prices, and capital costs. This growth is in the absence of a major technological breakthrough. Existing generation resources are needed to maintain this economic expansion, limiting the number of retirements while accelerating the number of capacity additions. While this scenario shares many of the attributes of the previous High Technology scenario, the pace of technological innovation is not as dynamic and therefore beneficial to keeping prices and costs in check. Under the High Technology and High Economy Scenarios, key market indices such as fuel prices, emission prices, and retirements move in opposite directions relative to the base case, thereby providing the range of outcomes desired for portfolio modeling. Pace Global provided TEP with the initial input variables for the scenarios, which were then refined to reflect TEP s market view on potential outcomes and to simulate a similar divergence of outcomes in other market indices such as load growth and capital costs. The base line capital cost for certain technologies was adjusted as part of this review. The following report provides a summary of the market forces affecting the key input assumptions (fuel prices, load growth, emission prices, and capital costs) and the corresponding long-term outlook under each scenario. Proprietary & Confidential Page 4 Pace Global LLC
296 Exhibit 2: Pace Global Scenarios with Indicative Market Movements TEP is seeking to develop a reference case and alternative world view scenarios for its Integrated Resource Plan (IRP) process. To assist in this effort, Pace Global has proposed a Base Case, a High Economy Case, and a High Technology Case states of the world. The High Economy scenario is characterized by a robust and growing U.S. economy that keeps upward pressure on all of the major market outcome categories, including load growth, fuel costs, power prices, and capital costs. This growth is in the absence of a major technological breakthrough. The High Technology case represents a state of the world where the rate of technology progress in renewable, storage, energy efficiency and power system control technologies substantially exceed current expectations. The High Technology state of the world reflects a consistent and plausible narrative of the impact of faster technology progress on the overall power system environment. These scenarios are shown as indicative market movements by time frame in Exhibit 1. These proposed scenarios are described in narrative form herein, taking into account feedback loops and evolving market drivers over different time horizons. The table below represents trends for each variable in the Base Case Scenario and the directional shift in trend relative to the base case outlook in L, H, and M under the High Economy Scenario and the High Technology Scenario. The L symbol represents a decline or a reduction in trend compared to the base case projection, whereas the H symbol represents an increase or a rise relative to the base case projection for the corresponding period. Finally, the M symbol represents identical movement to the base case or a convergence to the base case for the specific period if the previous trend has caused the variable to go above or below the base case. Key Planning Base Case Scenario High Economy Scenario High Technology Scenario Drivers Base Case Natural Gas Pricing High Natural Gas Pricing Low Natural Gas Pricing Planning Horizon Short- Mid- Long- Short- Mid- Long- Short- Mid- Long- Term Term Term Term Term Term Term Term Term Natural Gas Prices B Upward Level Trend Trend B H M B L L Coal Prices B Upward Upward Trend Trend B H H B L L Load Growth B Level Upward Trend Trend B H M B L** L** CO 2 Compliance Prices B Upward Upward Trend Trend B H H B L L Wholesale Power Prices B Upward Level Trend Trend B H H B L L Capital Costs B Upward Upward Trend* Trend* B H H B L L Coal Plant Retirements B Upward Upward Trend Trend B L M B H M Resource Additions B Upward Upward Trend Trend B H M B H M Notes: All scenarios are similar to the Base Case (B) in the short-term, then move low (L), high (H), or moderate (M) relative to the base case. Planning Horizon: Short-Term = , Mid-Term = , Long-Term = *Certain renewable technologies are on a downward capital cost trend as the technologies continue to mature **Slightly lower Proprietary & Confidential Page 5 Pace Global LLC
297 Natural Gas - Base Case Scenario Pace Global s Base Case Scenario represents a rise in Henry Hub gas prices in the medium term followed by a flattening price in the long term. The upward trend in gas price is characterized by a ramp-up in liquefied natural gas ( LNG ) demand from , which puts upward price pressure on the Henry Hub. However, the market is poised to resume growth in early 2017, which will allow supplies to match the demand growth. It s important to note that much of the production growth in the Marcellus is distant from where much of the consumption growth will be on the Gulf Coast. But despite added transportation costs, Marcellus shale gas will be competitive with Gulf Coast sources which helps moderate price growth. Pace Global s short- to medium-term expectation for Southern California ( SoCal ) Border basis (SoCal Border minus Henry Hub) is that basis prices will increase rapidly to $0.25/MMBtu by 2020 but then maintain that price level for the duration of the forecast. California remains a constrained market with increasing competition for West Texas supply from pipeline exports to Mexico and indirectly from LNG exports. Mexico has finished the tendering process for the two West Texas pipeline projects from Waha Hub into Mexico, which will account for 2,500 MMcf/d of new export capacity to Mexico by The source gas for these pipelines is the same Permian Basin natural gas that supplies much of El Paso Natural Gas and Transwestern, two pipelines that supply Southern California and the Desert Southwest. Colorado Interstate Gas ( CIG ) Rockies basis is currently negative and will further lower as Marcellus and Utica gas production resume strong growth in Rockies gas production has been significantly impacted by competition from Marcellus/Utica gas, gas from the Bakken and Western Canada regions, and gas from the Midcontinent region. Rockies gas is still important for western markets via Ruby Pipeline and Kern River Transmission, but the supply currently outweighs demand. CIG Rockies basis will decline from - $0.20/MMBtu to -$0.35/MMBtu in the early 2020 s before starting to climb higher, reaching zero basis (parity with Henry Hub) by Finally, NNG Demarc basis remains negative throughout the forecast, due to gas-on-gas supply competition from the west (Rockies), east (Marcellus/Utica), south (Mid-Con), and north (Western Canada), generally moving between -$0.06/MMBtu to -$0.16/MMBtu. In the long-term, we continue to see the drilling productivity gains earned over the last five years becoming integrated into the outlook, which is combined with revisions upward of estimated ultimate recovery ( EUR ) of natural gas resources in shale plays like the Utica. Producers like Cabot in the Eagle Ford have reported shale drilling efficiency gains of 60% from 2011 to 2015 and reductions in cost of 55% during the same five years. The 55% reduction in costs to drill new wells and bring natural gas to market also helps to lower the breakeven price point for producers. These gains are now fairly broadly felt across the upstream sector, helping to keep the Base Case Scenario outlook consistent. Natural Gas High Technology Scenario The main characteristic of the High Technology Scenario is that in the timeframe a technology breakthrough occurs in the renewables market and the storage market, such that the cost for renewables declines dramatically, which in turn encourages a faster shift to renewables from fossil fuels. This breakthrough results in an incremental reduction in natural gas demand, in the latter half of the mediumterm, as compared to the Base Case. In the long term, fuel costs continue to remain relatively lower than the Base Case. The pace of retirements and capacity additions continues in the High Technology Scenario, albeit slightly lower than otherwise would be with lower capital costs (as a result of interest rates that remain high). Most of the retirements coming from older gas plants (including simple-cycle peaking units) while most of the additions coming from residential and commercial solar, wind, combined heat and power ( CHP ), and natural gas combined-cycle ( NGCC ) facilities. There are fewer feedback mechanisms at play in this scenario, as the technology improvements over time help to maintain low fuel and capital costs and keep the energy sector on a steady path of moderate growth. Proprietary & Confidential Page 6 Pace Global LLC
298 Natural Gas High Economy Scenario For the High Economy Scenario, while the short-term outlook in this scenario begins with many positive indicators that continue into the medium-term, the expansion of the economy becomes a partial victim of its own success. In other words, the strong economic growth in the U.S. market helps to push energy sales higher, which in turn pushes underlying fuel costs higher. In the long-term, global economic activity begins to increase as developing markets such as India move to the forefront and drive growth. This global growth begins to apply upward pressure to global LNG and coal costs as well as commodity costs for materials. Exhibit 3: Henry Hub Natural Gas Price Outlook Source: Pace Global. Proprietary & Confidential Page 7 Pace Global LLC
299 Coal Base Case Scenario Pace Global s long-term fundamental coal basin forecasts are shown below. In the Base Case Scenario, commodity markets recover in the medium-term as the overall economy continues to improve, pushing up material costs and consequently capital costs. Through the years after the CPP goes into effect in 2022, coal plant retirements will continue to be driven by plant-specific going-forward economics. Meanwhile, capacity additions largely come from NGCC, solar, and wind facilities. Coal High Technology Scenario In the High Technology Scenario, coal plant retirements continue at a relatively high rate. Whereas previously these retirements were driven primarily by competition with existing coal and natural gas-fired generation, they are increasingly being replaced by renewables and high efficiency NGCC plants. Accordingly, the high rate of retirements and capacity additions/replacements drive coal prices downward in the medium and long-term due to lower demand. Coal High Economy Scenario In the High Economy Scenario, because technology does not necessarily play as large a role in this scenario, existing technology continues to remain very important to maintaining the high rate of load growth. In this scenario, very few coal, gas, or other plants are retired for economic or regulatory reasons, while new plants are added on a relatively consistent basis. Accordingly, Pace Global projects higher coal prices in the medium and long term driven by higher demand. Exhibit 4: Powder River Basin ( PRB ) and Arizona New Mexico Coal Price Outlook Source: Pace Global. Proprietary & Confidential Page 8 Pace Global LLC
300 Nominal $/mmbtu $4.50 $4.00 $3.50 $3.00 $2.50 $2.00 $1.50 $1.00 $0.50 $0.00 TEP Weighted Average Coal Prices Baseline High Technology High Economy Source: Tucson Electric Power. Proprietary & Confidential Page 9 Pace Global LLC
301 Load Growth Base Case Scenario The Base Case Scenario is characterized by reasonable and balanced levels of growth and drivers that lead to moderate market outcomes. Power market participants are able to adapt and adjust in a timely manner to changing market forces. In the medium-term, demand-side management and energy efficiency mostly offset the theoretical growth in energy sales from a growing customer base. However, overall load growth continues to occur at a moderate pace, driven by the growing economy. To 2035, the suite of market outcomes and drivers in this Base Case scenario settle into a pattern of moderate growth based on a well-balanced market. Energy demand grows as electric vehicle sales take hold but are offset by continued gains in distributed generation and energy efficiency measures. Load Growth High Technology Scenario In the High Technology Scenario, there are significant developments in technologies that improve energy efficiency, which helps to mitigate the load growth that might otherwise be expected in a High Technology scenario with robust economic growth. Consequently, Pace Global projects an increase in direct load control programs in medium and long term under the High Technology case. Load Growth High Economy Scenario On the other hand, Pace Global assumes higher load in the High Economy Scenario. Energy sales growth remains strong, as do capacity additions, but tighter global markets put upward pressure on several of the other market outcomes. As a result, the long-term outlook in the High Economy Scenario begins to push toward an era of high prices, high costs, high capacity additions, and high load growth. Proprietary & Confidential Page 10 Pace Global LLC
302 Exhibit 5: Arizona Average and Peak Demand Forecast Source: Pace Global. Proprietary & Confidential Page 11 Pace Global LLC
303 CO 2 Emission Prices Base Case Scenario Pace Global reviewed the baseline federal CO2 price outlook based on detailed analysis of the Clean Power Plan ( CPP ) under currently expected market conditions and our interpretation of EPA s draft rules regarding state compliance approaches. Outlined below are factors we believe could potentially drive price deviations under the Base Case Scenario, provided all other assumptions remain constant. Exhibit 6: CO2 Emission Price Outlook Source: Pace Global. Changes to the timing, state goals, and structure of the CPP that may result from the ongoing legal challenges to the rule certainly impact the timing and level of pricing. Even if the rule is upheld by the courts in its entirety, the timing of the rule is likely to be delayed by a year or more in line with the full duration of the stay. The potential for states to either 1) adopt a rate-based goal, or 2) adopt a mass based goal but not opt into the federal allowance trading program can have significant impacts on the available supply of the allowances to other states. This in turn would result in higher reduction requirements at higher overall costs in the remaining states that opt into the federal allowance trading program. If EPA relaxes its position on leakage, it could result in CO2 emission prices lower than those shown above. If gas prices are considerably above our current forecast, which could occur with greater LNG exports, rising shale costs, or regulations impacting the cost of extraction, carbon prices could be considerably higher than shown. CO 2 Emission Prices High Technology Scenario In the High Technology Scenario, CO2 emission prices fall short of the base case outlook as sufficient renewable penetration and technological advancement induce higher carbon-free generation resources, reducing the value of CO2 by about half of what is projected in the Base Case Scenario. Proprietary & Confidential Page 12 Pace Global LLC
304 CO 2 Emission Prices High Economy Scenario Under the High Economy Scenario, however, the growing economy incentivizes new builds that consume fossil fuels while maintaining existing thermal units. Under this scenario, Pace Global assumes that the market will attempt to build more thermal units to maintain reliability requirements. This higher utilization of thermal resources will put pressure on compliance limits, which in turn, will increase emission prices. Proprietary & Confidential Page 13 Pace Global LLC
305 Capital Costs Base Case Scenario In general, technology costs continued to decline in 2016, though rates varied by technology. In the Base Case Scenario, solar capital costs for utility scale photovoltaic ( PV ) plants declined 17.4% from the second half of 2015 to the same period in Similarly, prices for utility scale solar single axis tracking ( SAT ) technology, which is rapidly becoming the de facto choice because of higher capacity factors, declined 15.4% over the same period. On the other hand, capital costs for conventional technologies, typified by gas-fired combustion turbines and combined cycle power plants remained steady over the previous six months or so. However, this relatively stable price trend for combustion turbine based technologies masks a significant underlying market change. For the past 20 years, F class technology and its evolutionary variants, have been the industry standard for reliable high performance combustion turbine based power plants. As that technology platform has aged, the major combustion turbine technology providers have focused on a new class of turbines, the G/G/J class, depending upon the manufacturer. These larger units offer lower heat rates and greater operating flexibility, so that equipment starts and ramping better aligns with the influx of renewables. As a result, prices for F class technologies have declined by approximately 10-15%. Further, flat to negative demand growth in many regions coupled with increasingly competitive renewables technologies, have pressured combustion turbine providers forcing reductions in typical equipment margins to maintain sales. Capital Costs High Technology Scenario The High Technology Scenario outlook represents a consistent trend as that of the Base Case as we continue to see a steep decline in capital cost for renewable technology. However, we project that the capital cost for solar technologies fall at a faster pace than that of wind, causing solar to become attractive sooner than the Base Case forecast. As more renewable builds penetrate the market due to significant technological advancements, capital cost for thermal units decline as turbine providers are squeezed out of the market. Capital Costs High Economy Scenario Under the High Economy Scenario, we see the least decline in capital cost as the continuous rise in the economy drives higher demand and need for additional capacity. Proprietary & Confidential Page 14 Pace Global LLC
306 Exhibit 7: Capital Cost Outlook Proprietary & Confidential Page 15 Pace Global LLC
307 Source: Pace Global. Proprietary & Confidential Page 16 Pace Global LLC
308 Energy Prices Base Case Scenario In the Base Case Scenario, we observe about 2.8 GW of new generation capacity, mostly solar, being constructed in the Western Electricity Coordinating Council ( WECC ) region in the near term, which keeps energy prices low for the next few years. However, moderate load growth in the medium term, coupled by carbon regulations starting in 2022 drive energy prices higher. In the long term, prices remain relatively flat as energy efficiency and technological improvements partly offset load growth and higher renewable penetration prevent prices from rising significantly over the longer term. Energy Prices High Technology Scenario In the High Technology Scenario, many of the expected costs that are associated with CPP compliance are mitigated by advances in natural gas generation, utility scale renewables, distributed generation, and storage technologies. Gas prices on the Gulf Coast push higher in the near-term, given the tighter supply/demand dynamics with exports and power sector demand. However, these higher gas prices prompt another wave of improvements in drilling and fracking technology, helping to push supply higher and reduce gas prices back to relatively low levels. This decline in gas prices is coupled with lower gas demand in the latter half of the medium-term as renewable development begins to expand. Interest rates continue to move higher, which in turns pushes capital costs higher than in the Base Case. In addition, renewable generation plays a much greater role, given advances in battery technology, gains in photovoltaic costs, and a more coordinated approach to managing intermittent generation across regional transmission organizations (RTO) and independent system operators (ISO). Given advances in battery technologies, there is a higher penetration rate of electric vehicles than in the Base Case. This increases load growth but also allows for a more efficient management of utility resources, as the growing fleet of vehicle batteries help to manage peak demand and power price volatility. Energy Prices High Economy Scenario In the High Economy Scenario, energy sales growth remains strong, as do capacity additions, but tighter global markets put upward pressure on several of the other market drivers. As a result, the medium and long-term outlook in the High Economy Scenario begins to push toward an era of high power prices, high fuel costs, high capital costs, and high load growth. Proprietary & Confidential Page 17 Pace Global LLC
309 Exhibit 8: Arizona Wholesale Power Price Outlook Proprietary & Confidential Page 18 Pace Global LLC
310 Source: Pace Global. Proprietary & Confidential Page 19 Pace Global LLC
311 Coal Plant Retirements and Resource Additions Base Case Scenario In the Base Case Scenario, we observe about 5 GW of coal retirements as a rise in CO2 compliance cost and higher coal prices relative to natural gas prices make coal generation less economical. Emissions compliance is the primary driver for announced coal retirements in the near term, but retirements pick up more aggressively starting in 2022 (2.4 GW coal retirement between 2022 and 2025), when CO2 prices begin to escalate. Approximately 1 GW of coal capacity remains throughout the study period to maintain reliability and to serve baseload. Amid an increase in load, the loss of coal capacity is replaced during the mid-term primarily by natural gas plants, which show a net increase of about 5GW, and also by an increase in solar and wind builds that perpetuate across the study period, consisting of about 1.4 GW net builds each. Coal Plant Retirements and Resource Additions High Technology Scenario In the High Technology Scenario, we continue to observe about 5 GW of coal retirements throughout the study period, consistent with the base case outlook; however, we project a slower tapering of coal plants as lower CO2 prices that increase more slowly prolong the viability of existing coal plants. Consequently, lower demand and higher coal capacity in short and mid-term reduce the total net installed capacity across the study period to less than 200 MW and delay natural gas and renewable capacity from coming online. The total amount of new capacity additions may be less than that of the base case, but the High Technology Scenario results in the highest renewable penetration as a percentage of total net build. This is mostly driven by a steep decline in capital cost for renewables especially during the mid-term, resulting in approximately 40% of new builds to come from renewables. Of the 40%, new solar builds consist of more than half as capital cost for solar falls more sharply than wind does and becomes less expensive than wind by 2021, incentivizing more solar than wind builds. Coal Plant Retirements and Resource Additions High Economy Scenario In the High Economy Scenario, load growth exceeds that of the base case, as do capacity additions. Of the total net capacity additions, which exceed 6.7 GW, natural gas combined cycle accounts for the greatest amount of builds (8.9 GW) to replace about 5 GW of coal retirements by This results in a forecast that is dominated by thermal capacity of more than 80% by We expect the net wind and solar capacity to increase by 2.9 GW, resulting in 24% of new builds to be renewables. In order to serve Arizona s rise in demand, natural gas plants continue to be built and coal plants persist for the longest period (least amount of retirement until mid-term) compared to those of the other two scenarios. However, the introduction of the CPP in 2022 leads to a precipitous increase in CO2 prices, causing existing coal plants to retire rapidly and those to be replaced by natural gas plants. The High Economy Scenario shows the least amount of renewable penetration as we assume less decline in renewable capital cost versus that in the Base Case Scenario. As a result, the medium and long-term outlook in the High Economy Scenario begins to push toward an era of high power prices, high fuel costs, high capital costs, and high load growth. Proprietary & Confidential Page 20 Pace Global LLC
312 Tucson Electric Power
313 2017 Integrated Resource Plan 2017 FLEXIBLE GENERATION TECHNOLOGY ASSESSMENT APPENDIX B


314 2017 Flexible Generation Technology Assessment Tucson Electric Power 2017 Flexible Generation Technology Assessment Project No Revision 1 March 2017
315 2017 Flexible Generation Technology Assessment prepared for Tucson Electric Power 2017 Flexible Generation Technology Assessment Tucson, Arizona Project No Revision 1 March 2017 prepared by Burns & McDonnell Engineering Company, Inc. Kansas City, Missouri COPYRIGHT 2017 BURNS & McDONNELL ENGINEERING COMPANY, INC.
316 Flexible Generation Technology Assessment Revision 1 Table of Contents TABLE OF CONTENTS Page No. 1.0 INTRODUCTION Evaluated Technologies Assessment Approach Statement of Limitations STUDY BASIS AND ASSUMPTIONS Scope Basis and Assumptions Matrix General Assumptions EPC Project Indirect Costs Owner Costs Cost Estimate Exclusions Operating and Maintenance Assumptions SIMPLE CYCLE GAS TURBINE TECHNOLOGY Simple Cycle Technology Description Aeroderivative Gas Turbines Frame Gas Turbines Simple Cycle Emissions Controls Simple Cycle Performance Simple Cycle Cost Estimates Simple Cycle O&M RECIPROCATING ENGINE TECHNOLOGY Reciprocating Engine Technology Description Reciprocating Engine Emissions Controls Reciprocating Engine Performance Reciprocating Engine Cost Estimates Reciprocating Engine O&M COMBINED CYCLE GAS TURBINE TECHNOLOGY Combined Cycle Technology Description Combined Cycle Emissions Controls Combined Cycle Performance Combined Cycle Cost Estimate Combined Cycle O&M RENEWABLE TECHNOLOGY - SOLAR PHOTOVOLTAIC PV General Description PV Emission Controls PV Performance Tucson Electric Power TOC-1 Burns & McDonnell
317 Flexible Generation Technology Assessment Revision 1 Table of Contents 6.4 PV Cost Estimate PV O&M RENEWABLE TECHNOLOGY - WIND Wind General Description Wind Energy Emission Controls Wind Performance Wind Cost Estimate Wind O&M BATTERY STORAGE TECHNOLOGY Battery General Description Flow Batteries Conventional Batteries High Temperature Batteries Battery Emissions Controls Battery Storage Performance Battery Storage Cost Estimate Battery Storage O&M CONCLUSIONS APPENDIX A - SCOPE MATRIX APPENDIX B - SUMMARY TABLE APPENDIX C - RENEWABLE ENERGY MAPS Tucson Electric Power TOC-2 Burns & McDonnell
318 Flexible Generation Technology Assessment Revision 1 Introduction 1.0 INTRODUCTION Tucson Electric Power Company (TEP or Owner) retained Burns & McDonnell Engineering Company (BMcD) to evaluate various flexible generation technologies in support of its future resource planning efforts. As TEP looks to expand its renewable energy resources, it also anticipates a need for flexible generation to offset the intermittency associated with some renewable technologies. Flexible generation refers to an electric source that can be quickly dispatched in response to an immediate need, typically in a matter of minutes (as opposed to hours for baseload generation). Flexible generation is also characterized by low turndown, allowing the amount of dispatched load to vary appropriately with the power needed. TEP anticipates approximately 200 MW of additional flexible generation capacity will be needed in the coming years in order to avoid future operational issues. The 2017 Flexible Generation Technology Assessment (Assessment) includes a screening level comparison of technical features, cost, performance, and emissions characteristics of the generation technologies listed below. It is BMcD s understanding that the information in this Assessment will be treated as preliminary. Any technologies of interest to TEP should be followed up with further project development. 1.1 Evaluated Technologies Aeroderivative simple cycle gas turbines (SCGT): o 6x 45 MW (based on GE LM6000 PF / GE LM6000 PF+) o 4x 45 MW (based on LM6000 Hybrid EGT) o 4x 65 MW (based on GE LM9000) o 2x 100 MW (based on GE LMS100 PB+) Frame SCGT: o 1x 220 MW F-class (based on GE 7FA.05) Reciprocating engines: o 20x 10 MW (based on MAN 20V35/44G) o 10x 20 MW (based on MAN 18V51/60G) Combined cycle gas turbines (CCGT): o 200 MW 3x1 Configuration based on Siemens SGT-800 featuring: Air Cooled Condenser (ACC) Duct firing Evaporative inlet cooling Solar Photovoltaics (PV): Tucson Electric Power 1-1 Burns & McDonnell
319 Flexible Generation Technology Assessment Revision 1 Introduction o 100 MW block (with incremental next unit option) featuring: Polycrystalline silicon modules Single axis tracking system Wind Generation (200 MW) Battery Storage (50 MW / 200 MWh lithium ion storage with incremental next unit option) 1.2 Assessment Approach This report supports the Technology Assessment Summary Table spreadsheet file (Summary Table) developed by BMcD. This report compiles the assumptions and methodologies used by BMcD during the development of the Summary Table. Appendix A includes a scope assumptions matrix that tabulates major scope items in a table format. The Summary Table can be found in Appendix B. Appendix C includes renewable energy maps for solar and wind, developed by the National Renewable Energy Laboratory (NREL), and developed from WindPro data. 1.3 Statement of Limitations Estimates and projections prepared by BMcD relating to performance, construction costs, and operating and maintenance costs are based on experience, qualifications, and judgment as a professional consultant. BMcD has no control over weather, cost and availability of labor, material and equipment, labor productivity, construction contractor s procedures and methods, unavoidable delays, construction contractor s method of determining prices, economic conditions, government regulations and laws (including interpretation thereof), competitive bidding and market conditions or other factors affecting such estimates or projections. Actual rates, costs, performance ratings, schedules, etc., may vary from the data provided. Tucson Electric Power 1-2 Burns & McDonnell
320 Flexible Generation Technology Assessment Revision 1 Study Basis and Assumptions 2.0 STUDY BASIS AND ASSUMPTIONS 2.1 Scope Basis and Assumptions Matrix Scope and economic assumptions used in developing the Assessment are presented below. A spreadsheet-based Scope Matrix is included for reference in Appendix A, as agreed upon with TEP at project kickoff. 2.2 General Assumptions The assumptions below govern the overall approach of the Assessment: All estimates are screening-level in nature, do not reflect guaranteed costs, and are not intended for budgetary purposes. Estimates concentrate on differential values between options and not absolute information. All information is preliminary and should not be used for construction or permitting purposes. All capital and O&M estimates are stated in 2017 US dollars (USD). Escalation for the simple cycle, reciprocating engine, and combined cycle options is included to a COD in 2020, assuming a Q notice to proceed. Estimates assume an Engineer, Procure, Construct (EPC) fixed price contract for project execution. All options are based on a generic greenfield site with no existing structures or demolition required, with the following assumptions and clarifications made: o Utility connections are assumed available at the site boundary. Infrastructure costs for natural gas, water, and communications are excluded. Fuel source will be pipeline quality natural gas. Dual fuel options are excluded. Available natural gas pressure at the site boundary is assumed to be 200 psig. Fuel gas compression will be required for the simple cycle and combined cycle options, but is assumed unnecessary for the reciprocating engines. o Waste water is assumed to be delivered to the site boundary. Wastewater treatment facilities are excluded from applicable options. o Demolition or removal of hazardous materials is not included. Sites are assumed to be flat, with minimal rock and soils suitable for spread footings. Piling is included under heavily loaded foundations. Ambient conditions for performance ratings are as follows: o Elevation: 2620 ft. Tucson Electric Power 2-1 Burns & McDonnell
321 Flexible Generation Technology Assessment Revision 1 Study Basis and Assumptions o ISO Conditions: 59 F, 60% relative humidity o Summer Conditions: 105 F, 25% relative humidity All performance estimates assume new and clean equipment and do not include operating degradation. Duct firing is included in the capital cost and performance estimate for the combined cycle option. Fuel and power consumed during construction, startup, and/or testing are included. A preliminary review of BACT requirements provides a basis for the assumed air pollution control equipment included in the capital and O&M costs. Emissions are estimated at steady state, base load operation at ISO conditions. 2.3 EPC Project Indirect Costs The following project indirect costs are included in capital cost estimates: Performance and pre operational testing Startup technical service Site surveys Engineering and construction management Freight Startup spare parts EPC fees & contingency Escalation Bonds 2.4 Owner Costs Allowances for the following Owner s costs are included in the pricing estimates: Project development Owner s project management Owner s engineering Owner s legal fees Operator training (although existing Sundt personnel will be used, training will be needed) Permitting & licensing fees Builder s risk insurance Tucson Electric Power 2-2 Burns & McDonnell
322 Flexible Generation Technology Assessment Revision 1 Study Basis and Assumptions Operating spare parts Permanent plant equipment and furnishings Owner s contingency (allowance included at 5% for screening purposes) Temporary utilities Startup testing fuels and consumables Political concessions and area development fees Site security 2.5 Cost Estimate Exclusions The following costs are excluded from all estimates: Switchyard Land Water rights Water supply/discharge Water treatment equipment Natural gas infrastructure Sales tax Interest during construction (IDC) Financing fees Transmission Black start capability Auxiliary boiler (combined cycle option) Administration building and warehouse Utility demand costs 2.6 Operating and Maintenance Assumptions Operations and maintenance (O&M estimates are based on the following assumptions: Staffing costs are excluded (except training). Existing Sundt staff assumed for operations and maintenance. O&M costs are based on new and clean equipment. O&M costs are in 2017 USD. O&M costs exclude emissions credit costs, property taxes, and property insurance. Power demand costs are excluded. Tucson Electric Power 2-3 Burns & McDonnell
323 Flexible Generation Technology Assessment Revision 1 Study Basis and Assumptions Where applicable, variable O&M costs include routine maintenance, makeup water, water treatment, SCR reagent, catalyst replacement, and other consumables not including fuel. Fuel costs are excluded from O&M estimates. Where applicable, major maintenance costs are shown separately from variable O&M costs. Gas turbine and reciprocating engine major maintenance assumes third party contract with recommended maintenance schedule set forth by the original equipment manufacturer (OEM). Base O&M costs are based on performance estimates at ISO conditions. Tucson Electric Power 2-4 Burns & McDonnell
324 Flexible Generation Technology Assessment Revision 1 Simple Cycle Gas Turbine Technology 3.0 SIMPLE CYCLE GAS TURBINE TECHNOLOGY 3.1 Simple Cycle Technology Description A simple cycle gas turbine (SCGT) plant utilizes natural gas to produce power in a gas turbine generator. The gas turbine (Brayton) cycle is one of the most efficient cycles for the conversion of gaseous fuels to mechanical power or electricity. Simple cycle gas turbines are typically used for peaking power due to their fast load ramp rates and relatively low capital costs. However, the units have high heat rates compared to combined cycle technologies. Simple cycle gas turbine generation is a widely used, mature technology. Evaporative coolers or inlet foggers are often used to cool the air entering the gas turbine by evaporating additional water vapor into the air, which increases the mass flow through the turbine and therefore increases the output. Evaporative coolers or inlet foggers, depending on the turbine OEM, are included as options on all SCGT technologies in this assessment. While this is a mature technology category, it is also a highly competitive marketplace. Manufacturers are continuously seeking incremental gains in output and efficiency while reducing emissions and onsite construction time. Frame unit manufacturers are striving to implement faster starts and improved efficiency. Advances in combustor design allow improved ramp rates, turndown, fuel variation, efficiency, and emissions characteristics. Aeroderivative turbines also benefit from the research and development (R&D) efforts of the aviation industry, including advances in metallurgy and other materials. Low load or part load capability may be an important characteristic depending on the expected operating profile of the plant. Low load operation allows the SCGT s to remain online and generate a reduced amount of power while having the ability to quickly ramp to full load without going through the full start sequence. Most turbines are able to sustain stable operation at the minimum emissions compliant load (MECL), or the minimum load at which the OEM can meet the guaranteed emissions for the project. While further turndown is technically possible, loads below MECL will generally result in unacceptable emissions levels. MECL can vary slightly from turbine to turbine. For purposes of this assessment, MECL is equated with minimum load, and is assumed to be 50% Aeroderivative Gas Turbines Aeroderivative gas turbine technology is based on aircraft jet engine design, built with high quality materials that allow for increased turbine cycling. The output of commercially available aeroderivative turbines ranges from less than 20 MW to approximately 100 MW in generation capacity. In simple cycle Tucson Electric Power 3-1 Burns & McDonnell
325 Flexible Generation Technology Assessment Revision 1 Simple Cycle Gas Turbine Technology configurations, these machines typically operate more efficiently than larger frame units and also exhibit shorter ramp up and turndown times, making them ideal for peaking and load following applications. Aeroderivative units typically require fuel gas to be supplied at higher pressures (i.e. 675 psig to 960 psig for many models) than traditional frame units. A desirable attribute of aeroderivative turbines is the ability to start and ramp up load quickly. Most manufacturers will guarantee ten minute starts, measured from the time the start sequence is initiated to when the unit reaches 100 percent load. Simple cycle starts are generally not affected by cold, warm, or hot conditions. However, all gas turbine start times in this Assessment assume that all start permissives are met, which can include purge credits, lube oil temperature, fuel pressure, etc. Aeroderivative turbines are commercially available from several vendors, including General Electric (GE), Siemens (including Rolls Royce turbines), and Mitsubishi-owned Pratt & Whitney Power Systems (PWPS). These machines have been used in power generation applications for decades. However, as mentioned previously, manufacturers are continually refining designs and introducing new options. This assessment evaluates the GE LM6000 PF, GE LM6000 PF+, GE LM6000 Hybrid EGT, GE LM9000, and GE LMS100 PB+. The PF+, Hybrid EGT, and LM9000 are all relatively new options in the aeroderivative market Frame Gas Turbines Frame style turbines are industrial engines that are typically used in intermediate to baseload applications. In simple cycle configurations, these engines typically have higher heat rates when compared to aeroderivative engines. The smaller frame units have simple cycle heat rates around 11,000 Btu/kWh (HHV) or higher while the largest units exhibit heat rates approaching 9,250 Btu/kWh (HHV). However, frame units produce higher exhaust temperatures (~1,100 F) compared to aeroderivative units (~850 F), making them more efficient in combined cycle operation because exhaust energy is further utilized. Frame units typically require fuel gas at lower pressures than aeroderivative units (i.e. ~500 psig). Traditionally, frame turbines exhibit slower startup times and ramp rates than aeroderivative models, but manufacturers are consistently improving these characteristics. Conventional start times are commonly 30 minutes for frame turbines, but fast start options allow 10 to 15 minute starts. This Assessment includes a fast start option in the capital cost for the F class option. Frame engines are offered in a large range of sizes by multiple vendors, including GE, Siemens, and Mitsubishi. Commercially available frame units range in size from approximately 50 MW up to 350 MW. Continued development by manufacturers has resulted in the separation of frame gas turbines into Tucson Electric Power 3-2 Burns & McDonnell
326 Flexible Generation Technology Assessment Revision 1 Simple Cycle Gas Turbine Technology several classes, grouped by output and firing temperature: E class turbines (nominal 85 to 100 MW); F class turbines (nominal 200 to 240 MW); G/H class turbines (nominal 270 to 300 MW); and J class turbines (nominal 325 to 370 MW). This Assessment includes an F class frame option, with performance and cost based on the GE 7FA.05 model. 3.2 Simple Cycle Emissions Controls Emissions levels and required NO x and CO controls vary by technology and site constraints. Historically, natural gas SCGT peaking plants have not required post-combustion emissions control systems because they normally operate at low capacity factors. However, permitting trends suggest post-combustion controls may be required depending on annual number of gas turbine operating hours, proximity of the site to a non-attainment area, and current state regulations. In addition, there is a New Source Performance Standard (NSPS) limit for NO x emissions measured in parts per million (ppm), independent of operating hours. Per NSPS, units with heat inputs below 850 MMBtu/hr have a NO x limit of 25 ppm, but units with heat inputs greater than 850 MMBtu/hr have a NOx limit of 15 ppm. Furthermore, in the event the overall facility has the potential to emit greater than 250 tons per year of NO x emissions, selective catalytic reduction (SCR) may be required or the units may be limited in the number of operating hours available. Turbine manufacturers will typically guarantee emissions down to MECL, which for this Assessment is assumed to be 50 percent load for all simple cycle options. Below this load, turbine emissions may spike. As such, emissions on a ppm basis may be significantly higher at low loads. Gas turbines commonly have options for DLN combustors or water injection to limit NOx emissions to the ppm range. All simple cycle options presented in this assessment include DLN combustors for NO x control. Emissions estimates are shown in the Summary Table for each option on a per unit basis, for steady state baseload operation, at ISO conditions. A summary of the required emissions controls for each option is as follows: Except for the LMS100 PB+, all aeroderivative options have heat inputs below the NSPS threshold of 850 MMBtu/hr and meet the corresponding 25 ppm NO x limit. Therefore it is assumed that an SCR will not be required for these options. The LMS100 PB+ is expected to require an SCR. NO x emissions presented in the Summary Table are reflective of this. Although the F class turbine has a higher fuel input, it is expected to produce NO x emissions below the required 15 ppm. Therefore, an SCR is assumed not to be required. Tucson Electric Power 3-3 Burns & McDonnell
327 Flexible Generation Technology Assessment Revision 1 Simple Cycle Gas Turbine Technology Oxidation (CO) catalyst can be used to control CO emissions when operating on natural gas fuel. It is assumed that CO catalyst will only be required for the LMS100 PB+ option. CO emissions presented in the Summary Table are reflective of this. Outside of good combustion practices, it is assumed that emissions control equipment is not required for CO 2 and particulate matter (PM). Sulfur dioxide emissions are not controlled and are therefore a function of the sulfur content of the fuel burned in the turbines. 3.3 Simple Cycle Performance Estimated simple cycle performance results are shown in the Summary Table, and are based on data outputs from proprietary OEM software and correspondence with OEMs. The general assumptions in Section 2.0 apply to the evaluation of all SCGT options, and additional assumptions are listed in the scope matrix in Appendix A. Full load and minimum load performance estimates are provided for ISO and summer ambient conditions. Minimum load is defined as the minimum emissions compliant load (MECL) and is assumed to be 50% load for all simple cycle options. Incremental performances are also provided with evaporative coolers in service. The Summary Table includes startup times to full load. SCGT start times assume that purge credits are available. For the F class option, startup times are shown with and without the fast-start package. Outage and availability statistics are also shown in the Summary Table. This data was collected using the NERC Generating Availability Data System (GADS). Simple cycle GADS data is based on operating statistics for applicable North American units that came online in 2006 or later. 3.4 Simple Cycle Cost Estimates Simple cycle cost estimate results are included in the Summary Table. Cost estimates for each option were developed using in-house information from past BMcD project experience, and based on an EPC contracting approach. The EPC costs include all equipment procurement, construction, and indirect costs associated with simple cycle projects. A high-level list of items included in the EPC cost is given below: Engineering Major equipment supply: o Gas turbine(s) (including evaporative cooling) o GSU transformer(s) Tucson Electric Power 3-4 Burns & McDonnell
328 Flexible Generation Technology Assessment Revision 1 Simple Cycle Gas Turbine Technology o SCR/CO catalyst and associated BOP (LMS100 PB+ option only) o Hybrid wet/dry cooling system (LMS100 PB+ option only) BOP Equipment and Materials: o Mechanical equipment, electrical equipment, instrumentation and controls, chemical storage, fire protection equipment, and other miscellaneous items required. o Includes fuel gas compression equipment (assuming 200 psig available at site boundary). Construction: o Includes major equipment erection, civil/structural construction, mechanical construction, and electrical construction o Construction management and startup o Indirects and fees o EPC contingency o Escalation to COD, assuming a project notice to proceed of Q Per the Scope Assumptions in Appendix A, the following items are excluded from the EPC cost estimate: Administrative/control building, warehouse, and other buildings Dual fuel capability Black start capability Demineralized water treatment system (assumes that trailers or other demineralized water supply will be available for turbine water washes, cooling water makeup, etc.) On site potable water well treated water is assumed to be available at the site boundary Interest during construction, financing fees, and taxes Natural gas infrastructure Owner s costs for a 138 kv switchyard, grid interconnection, and transmission costs 3.5 Simple Cycle O&M BMcD evaluated the O&M needs for the simple cycle options based on the project specific scope. Estimates for fixed O&M (FOM) and variable O&M (VOM) costs are presented in the Summary Table. Major maintenance costs for SCGT engines are estimated on a dollar per gas turbine hourly operation ($/GTG-hr) basis and are not affected by number of starts. In line with the assumptions found in Appendix A, O&M estimates for the plant are based on the following: For aeroderivative gas turbines, major maintenance cost is on a $/hr basis. For frame gas turbines, major maintenance is on a $/hr basis when annual hours/start are greater than 27 and on a $/start basis when annual hours/start are less than 27. Tucson Electric Power 3-5 Burns & McDonnell
329 Flexible Generation Technology Assessment Revision 1 Simple Cycle Gas Turbine Technology Major maintenance costs are per engine or gas turbine. VOM assumes the use of temporary trailers or other source for demineralized water needs, such as CT water washing, cooling water makeup, etc. FOM costs assume existing Sundt staff to be used for operations and maintenance, therefore no additional personnel or salary costs are included. A SCR system is included in the O&M evaluation for the LMS100 PB+ option, and assumes operation with 19% aqueous ammonia and a 5 year catalyst life. Tucson Electric Power 3-6 Burns & McDonnell
330 Flexible Generation Technology Assessment Revision 1 Reciprocating Engine Technology 4.0 RECIPROCATING ENGINE TECHNOLOGY 4.1 Reciprocating Engine Technology Description The internal combustion, reciprocating engine operates on a four-stroke cycle for the conversion of pressure into rotational energy. Utility scale engines are commonly compression-ignition models, but some are spark-ignition engines. By design, cooling systems are typically closed-loop radiators, minimizing water consumption. Reciprocating engines are generally more tolerant of altitude and ambient temperature than gas turbines. With site conditions below 6,000 feet and 100 F, altitude and ambient temperature have minimal impact on the electrical output of reciprocating engines, though the efficiency may be slightly affected. Fuel gas pressure requirements are also comparatively low (i.e psig). Reciprocating engines can start up and ramp load more quickly than most gas turbines, but it should be noted that the engine jacket temperature must be kept warm to accommodate start times under 10 minutes. However it is common to keep water jacket heaters energized during all hours that the engines may be expected to run (associated costs have been included within the fixed O&M costs). Many different vendors, such as Wärtsilä, Fairbanks Morse, Caterpillar, General Electric, Kawasaki, Mitsubishi, etc. offer reciprocating engines and they are becoming popular as a means to follow wind turbine generation with their quick start times and operational flexibility. There are slight differences between manufacturers in engine sizes and other characteristics, but all largely share the common characteristics of quick ramp rates and quick start up when compared to gas turbines. The 200 MW plants evaluated in this Assessment are based on MAN natural gas fueled engines, models 20V35/44G and 18V51/60G. These heavy duty, medium speed engines are easily adaptable to grid-load variations. 4.2 Reciprocating Engine Emissions Controls Emissions estimates are shown in the Summary Table are per unit, for steady-state baseload operation at ISO conditions, assuming natural gas operation. In addition to good combustion practices, it is expected that reciprocating engines will require SCR and CO catalyst to control NO x and CO emissions. Operation on natural gas fuel with an SCR yields reduction of NO x emissions to 5 ppm at 15 percent O 2, while a CO catalyst results in anticipated CO emissions of 15 ppm. It is assumed that emissions control equipment is not required for CO 2 and particulate matter (PM). Tucson Electric Power 4-1 Burns & McDonnell
331 Flexible Generation Technology Assessment Revision 1 Reciprocating Engine Technology Sulfur dioxide emissions are not controlled and are therefore a function of the sulfur content of the fuel burned in the gas turbines. Sulfur dioxide emissions are estimated to be less than lb/mmbtu. 4.3 Reciprocating Engine Performance Reciprocating engine performances in the summary tables are based on data from OEM ratings. Base load and minimum load performance estimates are shown for ISO and summer ambient conditions. Minimum load assumes a single engine at 50% load. The general assumptions in Section 2.0 apply to the reciprocating engine evaluation, as well as the assumptions listed in the scope matrix in Appendix A. The Summary Table includes startup time the reciprocating engine models considered. Reciprocating engines typically exhibit start times of 5-10 minutes, assuming the engines are maintained in standby mode. Outage and availability statistics are also shown in the Summary Table, which were collected from NERC GADS data. It should be noted that EFOR data from GADS may not accurately represent the benefits of a reciprocating engine plant, depending on how outage events are recorded. Typically, a maintenance event will not impact all engines simultaneously, so only a portion of the plant would be unavailable. Reciprocating engines consume minimal water (approximately two gallons per engine, per week for cooling loop makeup). Depending on site conditions and access to water, the low water consumption rate can be advantageous in comparison to other simple cycle plants. 4.4 Reciprocating Engine Cost Estimates Reciprocating engine cost estimate results are included in the Summary Table. Cost estimates were developed using in-house information from past BMcD project experience, and based on an EPC contracting approach. The EPC costs include all equipment procurement, construction, and indirect costs associated with reciprocating engine projects. Additional cost clarifications and assumptions are shown below: SCR and CO catalysts are included It is assumed that natural gas is available at approximately 200 psig and that fuel compression will not be required The reciprocating engine plant includes an indoor engine hall with associated facilities It is assumed that two GSUs will be used for the 20 MW engines, and four GSUs for the 10 MW engines Tucson Electric Power 4-2 Burns & McDonnell
332 Flexible Generation Technology Assessment Revision 1 Reciprocating Engine Technology 4.5 Reciprocating Engine O&M The results of the reciprocating engine O&M evaluations are shown in the Summary Table. Additional assumptions are listed in the scope matrix in Appendix A. It is assumed that an LTSA would be executed with the OEM or other third party. Fixed O&M costs are similar to the simple cycle assumptions, including allowances for administrative expenses, safety equipment, building/grounds maintenance, environmental testing, communications, and unplanned engine maintenance. An allowance is also included for estimated standby power costs to maintain engine temperatures required for 5-10 minute startup times. Variable O&M costs account for lube oil consumption, urea consumption, minor engine maintenance, BOP equipment maintenance, and water consumption. Consumption rates and cost information are based on OEM correspondence and BMcD experience. Minor engine maintenance costs account for scheduled maintenance intervals (i.e. every 2,000, 4,000, or 10,000 hours), but not major overhauls. It is assumed that the LTSA includes supervision and scheduled parts from the OEM. Water consumption is minimal for reciprocating engines, as each engine requires approximately 5-10 gallons per week for cooling loop makeup and turbo rinsing. Major maintenance costs are shown as $/hour per engine, regardless of configuration. Major maintenance costs assume that the LTSA includes all parts and labor for major overhaul intervals (i.e. approximately 30,000 and 50,000 hours). Major maintenance also includes SCR and CO catalyst replacements. Major maintenance costs are levelized over a 30 year period without escalation. Tucson Electric Power 4-3 Burns & McDonnell
333 Flexible Generation Technology Assessment Revision 1 Combined Cycle Gas Turbine Technology 5.0 COMBINED CYCLE GAS TURBINE TECHNOLOGY 5.1 Combined Cycle Technology Description The basic principle of the combined cycle gas turbine (CCGT) plant is to utilize natural gas to produce power in a gas turbine which can be converted to electric power by a coupled generator, and to also use the hot exhaust gases from the gas turbine to produce steam in a heat recovery steam generator (HRSG). This steam is then used to drive a steam turbine and generator to produce electric power. The use of both gas and steam turbine cycles (Brayton and Rankine) in a single plant to produce electricity results in high conversion efficiencies and low emission. Additionally, natural gas can be fired in the HRSG to produce additional steam and associated output for peaking load, a process commonly referred to as duct firing. The heat rate will increase during duct fired operation, though this incremental duct fired heat rate is generally less than the resultant heat rate from a similarly sized SCGT peaking plant. For this Assessment, BMcD evaluated a combined cycle power plant in a 3x1 configuration based on the Siemens SGT-800 gas turbine. 5.2 Combined Cycle Emissions Controls Emissions estimates are shown in the Summary Table are per unit, for steady-state baseload operation at ISO conditions, assuming natural gas operation. Combined cycle power plants are typically designed for capacity factors consistent with intermediate or base load operation, therefore it is expected that NO x and CO emissions will need to be controlled. An SCR will be required to reduce NO x emissions by approximately 90% which correlates to lb/mmbtu. It is expected that a CO catalyst would also be required to reduce CO emissions. This Assessment assumes CO emissions will be controlled to 2 ppmvd corrected to 15 percent O 2, which correlates to approximately lb/mmbtu. The use of an SCR and CO catalyst requires additional site infrastructure. An SCR system injects ammonia into the exhaust gas to absorb and react with NO x molecules. This requires on-site ammonia storage and provisions for ammonia unloading and transfer. The costs associated with these requirements have been included in this Assessment. CO 2 emissions are estimated to be 120 lb/mmbtu. Sulfur dioxide emissions are not controlled and are therefore a function of the sulfur content of the fuel burned in the gas turbines. Sulfur dioxide emissions are estimated to be less than lb/mmbtu. Tucson Electric Power 5-1 Burns & McDonnell
334 Flexible Generation Technology Assessment Revision 1 Combined Cycle Gas Turbine Technology 5.3 Combined Cycle Performance BMcD estimated performance of 3x1 SGT-800 combined cycle plant using EBSILON heat balance software. Results from the EBSILON model were cross checked against preliminary heat balance information obtained from Siemens. The general assumptions in Section 2 as well as those listed in Appendix A apply to the evaluation of the CCGT option. Estimated performance results are presented in the Summary table, and reflect the following: Natural gas firing only. Inlet evaporative cooling is reflected in both ISO and summer ambient performances. Incremental performance for duct firing is shown for both ISO and Summer Ambient Conditions. Incremental performance statistics are based on the duct firing portion only, exclusive of the CTGs. Incremental heat rate does not represent total plant heat rate when duct firing is operational. Maximum duct firing to 1,600 F burner outlet temperature is assumed. Performance is based on heat rejection through an air cooled condenser (ACC). CCGT emissions estimates reflect inclusion of SCR and CO catalyst. Estimated water consumption with and without evaporative cooling is provided at ISO conditions. The Summary Table includes estimated combined cycle start times to unfired base load according to cold, warm, and hot start conditions. Start times reflect unrestricted, conventional starts for all gas turbines. Outage and availability statistics shown were collected from NERC GADS data. Combined cycle GADS data is based on operating statistics for applicable North American units that came online in 2006 or later. 5.4 Combined Cycle Cost Estimate The estimated cost of the 3x1 SGT-800 combined cycle plant is included in the Summary Table. Cost estimates were developed using in-house information from past BMcD project experience, and based on an EPC contracting approach. Owner s costs as outlined in Appendix A are also estimated. The EPC project cost includes all equipment procurement, construction, and indirect costs associated with combined cycle projects. Note that the combined cycle option will require a longer construction schedule than the other options. The Summary Table shows an estimated project timeline of 3.5 years, requiring an aggressive schedule to achieve the assumed COD in Tucson Electric Power 5-2 Burns & McDonnell
335 Flexible Generation Technology Assessment Revision 1 Combined Cycle Gas Turbine Technology A high-level list of items included in the EPC cost is given below: Engineering Major equipment supply: o Gas turbines (including evaporative cooling) o HRSGs (including duct firing, SCR/CO catalyst, and associated BOP) o Steam turbine o ACC o GSU transformers BOP Equipment and Materials: o Mechanical equipment, electrical equipment, instrumentation and controls, chemical storage, fire protection equipment, and other miscellaneous items required. o Includes fuel gas compression equipment (assuming 200 psig available at site boundary). o Onsite demineralized water treatment equipment Construction: o Includes major equipment erection, civil/structural construction, mechanical construction, and electrical construction o Construction management and startup o Indirects and fees o EPC contingency o Escalation to COD, assuming a project notice to proceed of Q Per the Scope Assumptions in Appendix A, the following items are excluded from the EPC cost estimate: Administrative/control building, warehouse, and other buildings Duel fuel capability Black start capability Auxiliary boiler ZLD system On site potable water well treated water is assumed to be available at the site boundary Interest during construction, financing fees, and taxes Natural gas infrastructure Owner s costs for a 138 kv switchyard, grid interconnection, and transmission costs Tucson Electric Power 5-3 Burns & McDonnell
336 Flexible Generation Technology Assessment Revision 1 Combined Cycle Gas Turbine Technology 5.5 Combined Cycle O&M Estimates for fixed and variable O&M costs are presented in the Summary Table. In line with the assumptions found in Appendix A, O&M estimates for the plant are based on the following: Gas turbine major maintenance costs are based on information provided by vendors and assume that the end user enters into a long term service agreement with the OEM. FOM costs assume existing Sundt staff to be used for operations and maintenance, therefore no additional personnel or salary costs are included. SCR system is included in the O&M evaluation and assumes operation with 19% aqueous ammonia, and a 5 year catalyst life. Two different water consumption estimates are given (with and without evaporative cooling); VOM is based on the higher water consumption rate. VOM costs assume an onsite demineralized water treatment system (included in the capital cost estimate). Water discharge costs are excluded. Tucson Electric Power 5-4 Burns & McDonnell
337 Flexible Generation Technology Assessment Revision 1 Renewable Technology - Solar Photovoltaic 6.0 RENEWABLE TECHNOLOGY - SOLAR PHOTOVOLTAIC 6.1 PV General Description The conversion of solar radiation to useful energy in the form of electricity is a mature concept with extensive commercial experience that is continually developing into a diverse mix of technological designs. PV cells consist of a base material (most commonly silicon), which is manufactured into thin slices and then layered with positively (i.e. Phosphorus) and negatively (i.e. Boron) charged materials. At the junction of these oppositely charged materials, a "depletion" layer forms. When sunlight strikes the cell, the separation of charged particles generates an electric field that forces current to flow from the negative material to the positive material. This flow of current is captured via wiring connected to an electrode array on one side of the cell and an aluminum back-plate on the other. Approximately 15% of the solar energy incident on the solar cell can be converted to electrical energy by a typical silicon solar cell. As the cell ages, the conversion efficiency degrades at a rate of approximately 0.5% per year. At the end of a typical 30 year period, the conversion efficiency of the cell will still be approximately 85% of its initial efficiency. 6.2 PV Emission Controls No emission controls are necessary for a PV system. 6.3 PV Performance BMcD simulated performance of a 100 MW (AC) plant in Tucson, AZ using PVsyst software. Per the agreed upon scope assumptions, the performance simulation was based on polycrystalline silicon modules with use of a single axis tracking system. Performance was based on the SolarWorld XL SW 325 module specifically, intended only to provide representative performance. Similar results could be expected from other manufacturers as well. In general, capacity factors are better when using tracking systems, though racking costs are higher. The benefits of using tracking as opposed to a fixed tilt system will depend on the site (latitude) as well as season; however, tracking costs have declined in recent years often making projects cheaper on a $/kw basis than they would be utilizing fixed tilt. The resultant capacity factor for the simulated plant is shown in the Summary Table. The system assumes a 1.25 DC-AC ratio. Panel technologies may also exhibit different performance characteristics depending on the site. Thin film technologies are typically cheaper than silicon per panel, but they are also less energy dense, so it s likely that more panels would be required to achieve the same output. In addition, the two technologies respond differently to shaded conditions. Tucson Electric Power 6-1 Burns & McDonnell
338 Flexible Generation Technology Assessment Revision 1 Renewable Technology - Solar Photovoltaic For reference, Appendix C includes solar radiation maps generated by NREL. Additional assumptions are listed in the scope matrix in Appendix A. 6.4 PV Cost Estimate The estimated cost of a 100 MW PV plant is included in the Summary Table, and is based on BMcD project experience and industry research. Major equipment costs include the polycrystalline silicon PV modules (assuming a 1.25 DC:AC ratio), the power conditioning system (PCS) which includes inverters and intermediate transformers, and a single GSU for step up to 138 kv. Interconnection, substation, land, and other Owner s costs are excluded as shown in Appendix A. Cost information is shown for a First Unit and Next Unit. The first unit assumes a complete 100 MW plant with all costs described herein, and in Appendix A. The next unit cost represents the incremental increase for each addition beyond the first installed unit. This methodology assumes that all units are constructed up front in a single project, and therefore the estimates are not valid for adding a unit to an existing plant at a later date. 6.5 PV O&M O&M costs for the 100 MW PV system are shown in the Summary Table. O&M costs are derived from BMcD project experience and vendor information. The following assumptions also apply to PV O&M: O&M costs assume that the system is remotely operated and that all O&M activities are performed through a third party contract. Therefore all O&M costs are modeled as fixed costs, shown in terms of $/kwac. O&M costs include a sinking fund for inverter replacements. The latest inverters are expected to last about years, so they may need to be replaced at least once during the life of the plant. O&M costs account for an annual panel cleaning, security monitoring, grounds maintenance, inverter maintenance, and other routine activities. Tucson Electric Power 6-2 Burns & McDonnell
339 Flexible Generation Technology Assessment Revision 1 Renewable Technology - Wind 7.0 RENEWABLE TECHNOLOGY - WIND 7.1 Wind General Description Wind turbines convert the kinetic energy of wind into mechanical energy, and are typically used to pump water or generate electrical energy that is supplied to the grid. Wind turbine energy conversion is a mature technology and can generally be split into two design types: Vertical-axis wind turbines, with the axis of rotation perpendicular to the ground. Horizontal-axis wind turbines, with the axis of rotation parallel to the ground. Subsystems for either configuration typically include a blade or rotor to convert the energy in the wind to rotational shaft energy; a drive train, usually including a gearbox and a generator; a tower that supports the rotor and drive train; and other equipment, including controls, electrical cables, ground support equipment and interconnection equipment. Over 95 percent of turbines larger than 100 kw are the horizontal-axis type. Wind turbine capacity is directly related to wind speed and equipment size, particularly to the rotor/blade diameter. The power generated by a turbine is proportional to the cube of the prevailing wind, that is, if the wind speed doubles, the available power will increase by a factor of eight. Because of this relationship, proper siting of turbines at locations with the highest possible average wind speeds is vital. According to the Department of Energy s (DOE) National Renewable Energy Laboratory (NREL), Class 3 wind areas (wind speeds of 14.5 mph) are generally considered to have suitable wind resources for wind generation development. Appendix C includes sample NREL wind resource maps for both Arizona and New Mexico. 7.2 Wind Energy Emission Controls No emission controls are necessary for a wind energy installation. 7.3 Wind Performance BMcD estimated the net capacity factor (NCF) of a 200 MW plant by using WindPro software to extract regional wind resource data at an assumed hub height of 80 meters. Two locations were considered for the site: first in eastern Arizona near the Springerville Generating Station, and second in New Mexico directly east of Albuquerque. Using a Rayleigh distribution and power curves for several different turbine models, a range for gross annual capacity factor (GCF) was estimated for each site. Annual losses for a wind energy facility were estimated at approximately 15 percent, which is a common assumption for Tucson Electric Power 7-1 Burns & McDonnell
340 Flexible Generation Technology Assessment Revision 1 Renewable Technology - Wind screening level estimates in the wind industry. This loss factor was applied to the gross capacity factor estimates to derive a net annual capacity factor (NCF) for each potential site. Due to its limited wind resources, the Arizona location resulted in a significantly lower NCF range (approximately 18-28%) than the New Mexico site (36-44%). Ideally, a utility-scale generation project should have an NCF of 30 percent or better. For this reason, the New Mexico site is the one represented in the Summary Table. The NCF estimate is provided as a range to show that it differs depending on turbine selection. Smaller turbines generally have higher NCFs but would require more turbines to achieve 200 MW capacity. For all other purposes of this Assessment the Siemens SWT turbine was utilized as a reasonable basis. Wind resource maps for both locations are provided in Appendix C. 7.4 Wind Cost Estimate The wind energy cost estimate is shown in the Summary Table. Costs are based on BMcD project experience and industry research for utility scale wind farms. In addition to the turbines, equipment costs include intermediate transformers, a 34.5 kv collector bus, and two GSUs for interconnection at 138 kv. Specific scope assumptions and exclusions can be found in Appendix A. Typical Owner s costs are also shown. It should be noted that while transmissions costs have been excluded from this estimate, they would be higher for the wind option due to the New Mexico site location. The estimated land usage for wind shown in the Summary Table is based on an assumed 1 acre per turbine as the directly affected land area. In reality, more land will likely need to be leased for turbine spacing, although disturbance of this land would be minimal. Per Appendix A, land costs have been excluded from this Assessment. 7.5 Wind O&M O&M costs for the evaluated wind site are shown in the Summary Table. The O&M costs are derived from in-house information based on BMcD project experience and vendor information. Fixed costs include all annual service and maintenance agreements. Therefore, variable O&M falls within the fixed cost figure rather than a $/MWh estimate commonly associated with fossil fuel plants. It is assumed that 20% of annual fixed O&M expenses are set aside for unscheduled maintenance not covered by the service agreements. Tucson Electric Power 7-2 Burns & McDonnell
341 Flexible Generation Technology Assessment Revision 1 Battery Storage Technology 8.0 BATTERY STORAGE TECHNOLOGY 8.1 Battery General Description Electrochemical energy storage systems utilize chemical reactions within a battery cell to facilitate electron flow, converting electrical energy to chemical energy when charging and generating an electric current when discharged. Electrochemical technology is continually developing as one of the leading energy storage and load following technologies due to its modularity, ease of installation and operation, and relative design maturity. Development of electrochemical batteries has shifted into three categories, commonly termed flow, conventional, and high temperature battery designs. Each battery type has unique features yielding individual advantages when compared to one another Flow Batteries Flow batteries utilize an electrode cell stack with externally stored electrolyte material. The flow battery is comprised of positive and negative electrode cell stacks separated by a selectively permeable ion exchange membrane, in which the charge-inducing chemical reaction occurs, and liquid electrolyte storage tanks, which hold the stored energy until discharge is required. Various control and pumped circulation systems complete the flow battery system in which the cells can be stacked in series to achieve the desired voltage difference. The battery is charged as the liquid electrolytes are pumped through the electrode cell stacks, which serve only as a catalyst and transport medium to the ion-inducing chemical reaction. The excess positive ions at the anode are allowed through the ion-selective membrane to maintain electroneutrality at the cathode, which experiences a buildup of negative ions. The charged electrolyte solution is circulated back to storage tanks until the process is allowed to repeat in reverse for discharge as necessary. In addition to external electrolyte storage, flow batteries differ from traditional batteries in that energy conversion occurs as a direct result of the reduction-oxidation reactions occurring in the electrolyte solution itself. The electrode is not a component of the electrochemical fuel and does not participate in the chemical reaction. Therefore, the electrodes are not subject to the same deterioration that depletes electrical performance of traditional batteries, resulting in high cycling life of a flow battery. Flow batteries are also scalable such that energy storage capacity is determined by the size of the electrolyte storage tanks, allowing the system to approach its theoretical energy density. However, flow batteries are typically more capital intensive than some conventional batteries and require additional installation and operation costs associated with balance of plant equipment. Tucson Electric Power 8-1 Burns & McDonnell
342 Flexible Generation Technology Assessment Revision 1 Battery Storage Technology Conventional Batteries A conventional battery contains a cathodic and an anodic electrode and an electrolyte sealed within a cell container than can be connected in series to increase overall facility storage and output. During charging, the electrolyte is ionized such that when discharged, a reduction-oxidation reaction occurs, which forces electrons to migrate from the anode to the cathode thereby generating electric current. Batteries are designated by the electrochemicals utilized within the cell; the most popular conventional batteries are lead acid and lithium ion type batteries. Lead acid batteries are the most mature and commercially accessible battery technology, as their design has undergone considerable development since conceptualized in the late 1800s. The Department of Energy (DOE) estimates there is approximately 110 MW of lead acid battery storage currently installed worldwide. Although lead acid batteries require relatively low capital cost, this technology also has inherently high maintenance costs and handling issues associated with toxicity, as well as low energy density (yields higher land and civil work requirements). Lead acid batteries also have a relatively short life cycle at 5 to 10 years, especially when used in high cycling applications. Lithium ion (Li-ion) batteries contain graphite and metal-oxide electrodes and lithium ions dissolved within an organic electrolyte. The movement of lithium ions during cell charge and discharge generates current. Li-ion technology has seen a resurgence of development in recent years due to its high energy density, low self-discharge, and cycling tolerance. The life cycle of Li-ion batteries can range from 2,000 to 3,000 cycles (at high discharge rates) up to 7,000 cycles (at very low discharge rates). Many Li-ion manufacturers currently offer 15 year warranties or performance guarantees. Consequently, Li- ion has gained traction in several markets including the utility and automotive industries. The DOE estimates there is now approximately 1,240 MW of Li-ion battery storage installed worldwide. Li-ion battery prices are trending downward, and continued development and investment by manufacturers are expected to further reduce production costs. While there is still a wide range of project cost expectations due to market uncertainty, Li-ion batteries are anticipated to expand their reach in the utility market sector High Temperature Batteries High temperature batteries operate similarly to conventional batteries, but utilize molten salt electrodes and carry the added advantage that high temperature operation can yield heat for other applications simultaneously. The technology is considered mature, with ongoing commercial development at the grid level. The most popular and technically developed high temperature option is the Sodium Sulfur (NaS) Tucson Electric Power 8-2 Burns & McDonnell
343 Flexible Generation Technology Assessment Revision 1 Battery Storage Technology battery. Japan-based NGK Insulators, the largest NaS battery manufacturer, recently installed a 4 MW system in Presidio, Texas in 2010 following operation of systems totaling more than 160 MW since the project s inception in the 1980s. The NaS battery is typically a hermetically sealed cell that consists of a molten sulfur electrolyte at the cathode and molten sodium electrolyte at the anode, separated by a Beta-alumina ceramic membrane and enclosed in an aluminum casing. The membrane is selectively permeable only to positive sodium ions, which are created from the oxidation of sodium metal and pass through to combine with sulfur resulting in the formation of sodium polysulfides. As power is supplied to the battery in charging, the sodium ions are dissociated from the polysulfides and forced back through the membrane to re-form elemental sodium. The melting points of sodium and sulfur are approximately 98 o C and 113 o C, respectively. To maintain the electrolytes in liquid form and for optimal performance, the NaS battery systems are typically operated and stored at around 300 o C, which results in a higher self-discharge rate of 14 percent to 18 percent. For this reason, these systems are usually designed for use in high-cycling applications and longer discharge durations. NaS systems are expected to have an operable life of around 15 years, and are one of the most developed chemical energy storage technologies. However, unlike other battery types, costs of NaS systems have historically held, making other options more commercially viable at present. 8.2 Battery Emissions Controls No emission controls are currently required for battery storage facilities. However, lead acid batteries may produce hydrogen off-gassing via electrolysis when charging. Additionally, Li-ion batteries can release large amounts of gas during a fire event. While not currently issues, there is potential for increased scrutiny as more battery systems are placed into service. 8.3 Battery Storage Performance This Assessment includes an option for a 50 MW / 200 MWh battery storage system based on Li-ion technology. Lithium ion systems can respond in seconds and exhibit excellent ramp rates and round trip cycle efficiencies. Because the technology is still maturing, there is some uncertainty regarding estimates for cycle life, and these estimates vary greatly depending on the application and depth of discharge. For purposes of this Assessment, the 50 MW / 200 MWh system is assumed to perform one full cycle per day. Additionally, GADS performance statistics do not cover battery storage applications, so the availability was estimated based on BMcD experience and research. Tucson Electric Power 8-3 Burns & McDonnell
344 Flexible Generation Technology Assessment Revision 1 Battery Storage Technology 8.4 Battery Storage Cost Estimate The estimated cost of a 50 MW / 200 MWh Li-ion battery system is included in the Summary Table, based on BMcD experience and industry research. The key cost elements of a battery system are the battery cells, the inverter, the interconnection, and the installation. Per the agreed upon scope assumptions for this Assessment, interconnection costs and land costs (among others) have been excluded. A detailed breakdown of scope assumptions is found in Appendix A. Also, the capital costs reflect an overbuilt battery capacity to account for normal degradation over time and limited failures. This ensures the net capacity remains the same over the life of the project. It is assumed that the battery system will operate at 480V, include inverters and intermediate transformers up to 34.5 kv, and include a single GSU for step up to 138 kv. Cost information is shown for a First Unit and Next Unit. The first unit assumes a complete 50 MW / 200 MWh site with all costs described herein, and in Appendix A. The next unit cost represents the incremental increase for each addition beyond the first installed unit. This methodology assumes that all units are constructed up front in a single project, and therefore the estimates are not valid for adding a unit to an existing site at a later date. 8.5 Battery Storage O&M O&M estimates for the Li-ion battery system are shown in the Summary Table, and are based on BMcD experience and industry research. The battery storage system is assumed to be operated remotely. The technical life of a battery project is expected to be 15 years, and battery cells may need to be replaced every 5-10 years. The fixed O&M costs include purchase of a performance guarantee from the OEM, covering repairs and replacement as necessary. The battery capacity is overbuilt to account for normal degradation over time and limited battery failures. Variable O&M costs are primarily based on the cost of parasitic load to run HVAC. Tucson Electric Power 8-4 Burns & McDonnell
345 Flexible Generation Technology Assessment Revision 1 Conclusions 9.0 CONCLUSIONS This Flexible Generation Technology assessment provides information to support TEP s future resource planning efforts. TEP is anticipating a need for flexible generation capacity to help offset intermittency associated with increased renewable penetration. This Assessment is intended to help TEP decide on a suitable technology to meet this need. Information provided in this assessment is preliminary in nature and is intended to highlight indicative, differential costs associated with each technology evaluated. BMcD recommends that TEP pursue additional engineering studies for technologies of interest to define project scope, budget, and timeline. Of all the technologies evaluated, the simple cycle F class plant exhibits the lowest capital cost per kw generated. The F class gas turbine is a mature product, which has continually evolved as OEMs have improved output and heat rate. However due to emissions related limitations, a single F class engine would be limited in turndown to approximately 92 MW in the summer. Aeroderivative turbines generally exhibit excellent heat rates, fast start and ramp rates, and reliable operation, but they also tend to be more expensive than frame units on a $/kw scale. However, having multiple aeroderivative units as opposed to a single frame unit would allow more operational flexibility and plant turndown. Reciprocating engine plants offer the lowest heat rates and fastest start times among simple cycle options. They also offer the most flexibility in dispatching load compared to other plants of equal capacity. Due to their smaller size, a single reciprocating engine can run at a lower load than a single gas turbine. As additional load becomes necessary, additional engines could be started until full plant capacity is reached. The recent strength of the U.S. dollar compared to the Euro has led to reduced costs for engines imported from Europe, making reciprocating engines a cost competitive option. It is expected that all reciprocating engine options will require SCR and CO catalyst systems for emissions control, resulting in higher variable O&M costs for engine plants than some turbine options. Combined cycle plants offer better heat rates than all other combustion plants evaluated. However, the 3x1 SGT-800 option evaluated is estimated to be more expensive than simple cycle options and less suited for cyclical operation. Renewable options include solar PV and wind systems. PV capital costs have continued to decline steadily in recent years. PV is a proven technology for daytime power and a viable option to pursue renewable goals. Wind energy generation is a proven renewable option as well. Due to limited wind Tucson Electric Power 9-1 Burns & McDonnell
346 Flexible Generation Technology Assessment Revision 1 Conclusions resources in Arizona, a wind option would likely need to be developed out of state. BMcD considered New Mexico in evaluating performance. Utility scale battery storage systems are being installed in varied applications from frequency response to arbitrage, and recent cost reduction trends are expected to continue. Lithium ion technology is achieving the greatest market penetration, but other technologies may be viable as well. Tucson Electric Power 9-2 Burns & McDonnell
347 APPENDIX C - RENEWABLE ENERGY MAPS

348 114 0'0"W 113 0'0"W 37 0'0"N 112 0'0"W 111 0'0"W 37 0'0"N 110 0'0"W 36 0'0"N 36 0'0"N Coconino Mohave Navajo Apache 35 0'0"N 35 0'0"N Yavapai 34 0'0"N 34 0'0"N La Paz Gila Phoenix Maricopa Greenlee 33 0'0"N Pinal Graham 33 0'0"N Yuma 114 0'0"W Pima 113 0'0"W Cochise 32 0'0"N 112 0'0"W Santa Cruz 111 0'0"W 110 0'0"W Model estimates t of monthly average daily total t radiation, kwh/m 2 /Day averaged from hourly estimates of direct normal irradiance over 8 years ( ). The model inputs are hourly visible irradiance from the GOES geostationary satellites, and monthly average aerosol optical depth, precipitable water vapor, and ozone sampled at a 10km resolution. > < 2 Miles This map was produced by the National Renewable Energy Laboratory ry for the U.S. Department t of fe Energy. September 25, 2007
349 Tower9196 Tower9196 Tower9195 Tower9195 Grand Junction Saint George Las Vegas Henderson North Las Vegas Path: C:\Users\ksandven\Desktop\Kieran\Tuscan - Arizona Wind NCF \ArcMaps\Tuscan_Springerville_Wind_Speed_Sites.mxd Coordinate System: NAD 1983 UTM Zone 13N Units: Meter Chino Vista Carlsbad LEGEND Hesperia Yucaipa Perris Hemet Temecula La Mesa Santee El Cajon Chula Vista NV CA UT AZ SON P NM CHI Indio CO COA!# Wind Data Point extrapolated to 80m Yuma COPYRIGHT 2016 BURNS & McDONNELL ENGINEERING COMPANY, INC. PROPRIETARY & CONFIDENTIAL KS TX OK MO AR LA Wind Speed 80 m/s Lake Havasu City Surprise Buckeye Tempe Mesa Phoenix Gilbert Goodyear REFERENCE MILES KILOMETERS Flagstaff Tucson ± Wind Data Point ( m)!# TUCSON ELECTRIC TECHNOLOGY ASSESSMENT East Arizona Wind Data Point LOCATION: Tucson, Arizona CLIENT: TEP PROJ. NO.: CREATED: 01/26/2017 Santa Fe Rio Rancho Albuquerque Las Cruces El Paso

350
351 Grand Junction Colorado Springs Pueblo Santa Fe Flagstaff Rio Rancho Albuquerque Wind Data Point 50m) - 80m)!# Mesa Tempe Chandler Path: C:\Users\ksandven\Desktop\Kieran\Tuscan - Arizona Wind NCF \ArcMaps\Tuscan_Wind_Speed_Sites.mxd Coordinate System: NAD 1983 UTM Zone 13N Units: Meter NV CA LEGEND UT AZ SON Tucson NM CHI CO!# Wind Data Point extrapolated to 80m P COA KS TX OK MO AR LA Wind Speed 80 m/s Las Cruces El Paso REFERENCE MILES KILOMETERS ± TUCSON ELECTRIC TECHNOLOGY ASSESSMENT East New Mexico Wind Data Point LOCATION: Tucson, Arizona CLIENT: TEP PROJ. NO.: CREATED: 01/22/2017 Odessa COPYRIGHT 2016 BURNS & McDONNELL ENGINEERING COMPANY, INC. PROPRIETARY & CONFIDENTIAL
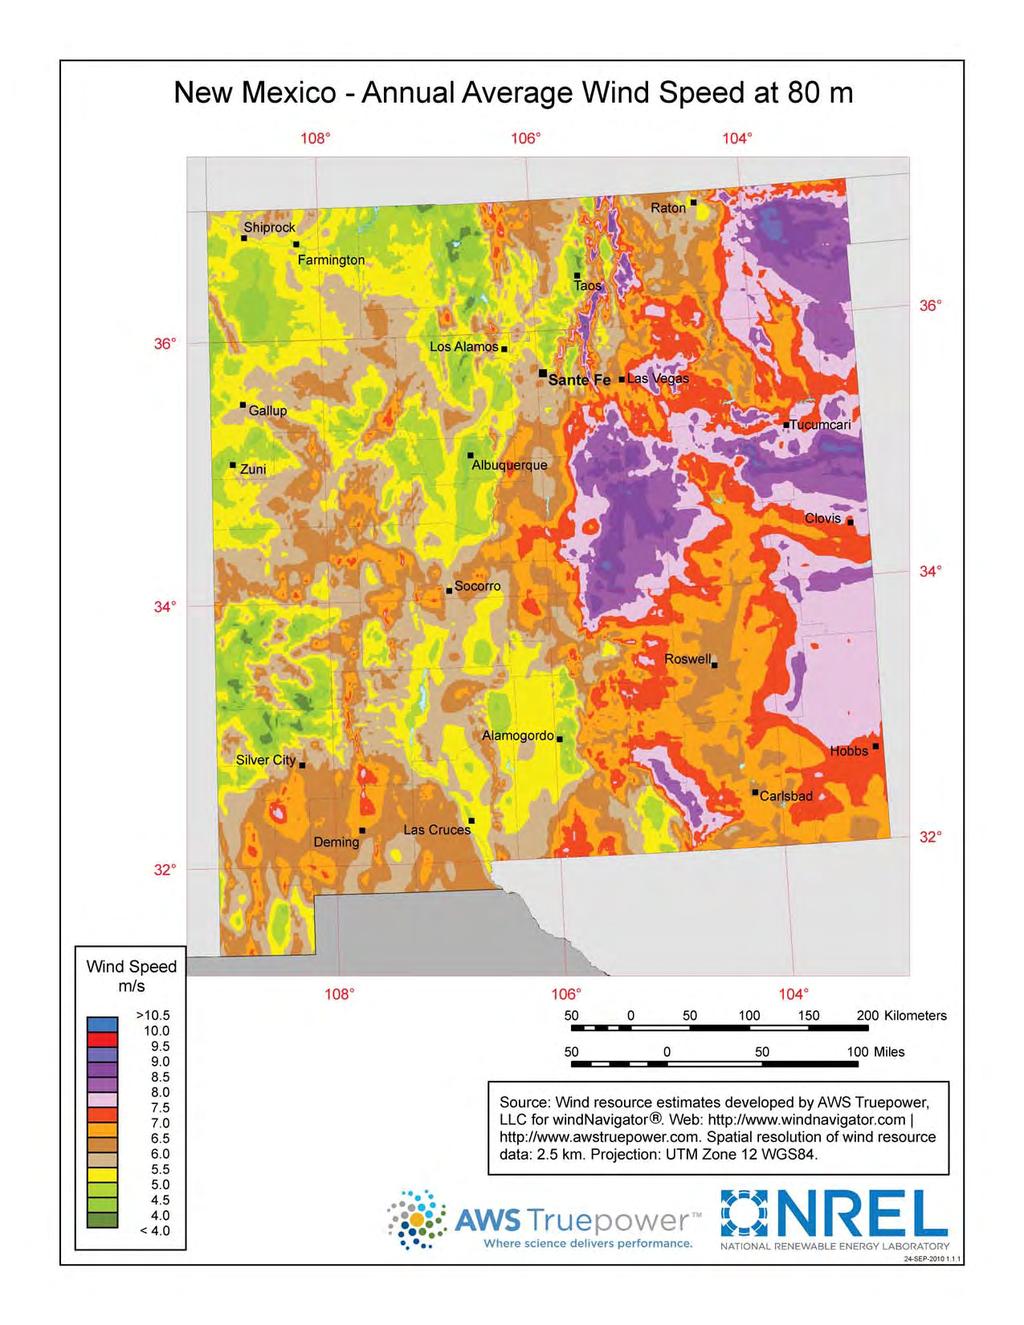
352
Tucson Electric Power 2017 Integrated Resource Plan. Southern Arizona Regional Solar Partnership Jeff Yockey, PE
 Tucson Electric Power 2017 Integrated Resource Plan Southern Arizona Regional Solar Partnership Jeff Yockey, PE May 2017 Integrated Resource Plan (IRP) Overview Just a Plan Additional steps for specific
UNS Electric Inc Integrated Resource Plan. April 3, 2017
 2017 Integrated Resource Plan UNS Electric Inc. 2017 Integrated Resource Plan April 3, 2017 Page - 1 UNS Electric, Inc. Page - 2 2017 Integrated Resource Plan Acknowledgements UNS Electric Inc. IRP Team
2016 Preliminary Integrated Resource Plan
 Tucson Electric Power Company Tucson Electric Power 2016 Preliminary Integrated Resource Plan March 1, 2016 Page 1 2016 Preliminary Integrated Resource Plan Page 2 Tucson Electric Power Company Foreword
UniSource Energy Integrated Resource Plan. April 1, UNS Electric, Inc.
 UniSource Energy 2014 Integrated Resource Plan April 1, 2014 UNS Electric, Inc. UniSource Electric Page - 2 2014 Integrated Resource Plan Acknowledgements UNS Electric Company IRP Team Mike Sheehan, Director,
Renewable Resources. David Jacobs Manager, Resource Planning and Procurement
 Renewable Resources David Jacobs Manager, Resource Planning and Procurement October 22, 2009 Demand (MW) 4,000 Tucson Electric Power Capacity Requirements with 15% Energy Efficiency Target by 2020 and
2016 Preliminary Integrated Resource Plan
 UNS Electric UNS Electric, Inc. 2016 Preliminary Integrated Resource Plan March 1, 2016 Page 1 2016 Preliminary Integrated Resource Plan Page 2 UNS Electric Foreword New environmental regulations, emerging
EXECUTIVE SUMMARY. In accordance with New Mexico Administrative Code, Integrated Resource Plan for Electric Utilities.
 July 3, 2017 EXECUTIVE SUMMARY Background Every three years, PNM is required to prepare an Integrated Resource Plan (IRP). 1 In this IRP, PNM has analyzed cost-effective power supply plans under two scenarios:
DATA ASSUMPTIONS AND DESCRIPTION OF STUDIES TO BE PERFORMED 2014 EGSL & ELL Integrated Resource Plans
 ENTERGY GULF STATES LOUISIANA, L.L.C. & ENTERGY LOUISIANA, LLC LPSC DOCKET NO. I-33014 DATA ASSUMPTIONS AND DESCRIPTION OF STUDIES TO BE PERFORMED 2014 EGSL & ELL Integrated Resource Plans This version
ENTERGY NEW ORLEANS 2015 IRP RENEWABLES TECHNICAL CONFERENCE
 ENTERGY NEW ORLEANS 2015 IRP RENEWABLES TECHNICAL CONFERENCE Technology, Cost and Regulation of CO 2 SEPTEMBER 22, 2014 Note: All IRP materials presented here are marked preliminary subject to change prior
Non-Technical Summary
 Non-Technical Summary I. Introduction Southern Indiana Gas and Electric Company d/b/a Vectren Energy Delivery of Indiana, Inc. ( Vectren ) engaged in a planning exercise during 2016 to evaluate its electric
Beyond LCOE: The Value of CSP with Thermal Energy Storage
 CSP Beyond LCOE: The Value of CSP with Thermal Energy Storage energy.gov/sunshot Mark S. Mehos, Program Manager, CSP NREL Discussion SunShot and LCOE Understanding the Value of CSP with Thermal Energy
Electricity Markets. Rapid Conference May 17, Mike Rencheck Rencheck Consulting LLC
 Electricity Markets Rapid Conference May 17, 2016 Mike Rencheck Rencheck Consulting LLC Topics Market Formation - Basics 2016 / 2017 Forecasts Natural Gas, Renewable Portfolio Standards, and Climate Change
2017 IRP Update. Proposed Long Term Resource Strategy Proposed Conservation
 2017 IRP Update Proposed Long Term Resource Strategy Proposed Conservation + 10-Year Potential Estimate + 2018/2019 Conservation Target Proposed Action Plan Commission Briefing October 2, 2017 Pre-Decisional
Zero Net Carbon Portfolio Analysis
 Zero Net Carbon Portfolio Analysis Prepared for: Platte River Power Authority December 5, 2017 This Report was produced by Pace Global, a Siemens business ( Pace Global ) and is meant to be read as a whole
Greenhouse Gas Emissions. Climate Change: Taking Action for the Future
 Greenhouse Gas Emissions Climate Change: Taking Action for the Future The energy industry across the United States is undergoing a major transformation by seeking lower-carbon energy sources while meeting
PGE s 2013 Integrated Resource Plan
 PGE s 2013 Integrated Resource Plan OPUC Public Meeting 2014 Portland General Electric. All rights reserved. Today s topics IRP public process Load-resource balance Assumptions and inputs E3 low-carbon
Potential Impacts of a Renewable and Energy Efficiency Portfolio Standard in Kentucky
 Potential Impacts of a Renewable and Energy Efficiency Portfolio Standard in Kentucky Prepared for the Mountain Association for Community Economic Development & the Kentucky Sustainable Energy Alliance
Energy Imbalance Market Overview
 Energy Imbalance Market Overview Presentation to: Portland General Electric EIM OATT Stakeholder Meeting David Timson Account Manager CAISO Strategic Alliances October 14, 2016 Topics for Discussion ISO
TREASURE COAST REGIONAL PLANNING COUNCIL M E M O R A N D U M. To: Council Members AGENDA ITEM 8
 TREASURE COAST REGIONAL PLANNING COUNCIL M E M O R A N D U M To: Council Members AGENDA ITEM 8 From: Date: Subject: Staff February 20, 2009 Council Meeting Report on Florida Renewable Energy Potential
CHAPTER 1 EXECUTIVE SUMMARY
 CHAPTER 1 EXECUTIVE SUMMARY The 2016 SD Electricity Supply Resource Procurement Plan The 2016 South Dakota Electricity Supply Resource Procurement Plan ( Plan ) evaluates NorthWestern Energy s ( NorthWestern
California Grid Operations: Current Conditions and Future Needs
 California Grid Operations: Current Conditions and Future Needs Jim Detmers Vice President, Operations Global Climate & Energy Project November 1, 2007 STANFORD UNIVERSITY Our objective today is identify
EMS of the Future. EMS Users Conference Chicago, Illinois. John McDaniel September 20, Proprietary 1 Experience you can trust.
 EMS of the Future EMS Users Conference Chicago, Illinois John McDaniel September 20, 2010 Proprietary 1 Experience you can trust. Overview Key Issues Shaping EMS Implementations Operational Issues Being
SCE s Experience In Energy Storage
 SCE s Experience In Energy Storage October 19, 2016 Dhaval Dagli Principal Manager, Regulatory Policy Regulatory Affairs Southern California Edison Southern California Edison (SCE) Highlights One of the
MTEP18 Futures. Planning Advisory Committee June 14, 2017
 MTEP18 Futures Planning Advisory Committee June 14, 2017 Overview Objective: Present final MTEP18 Futures and an overview of stakeholder feedback Key Takeaways: Four Futures to be used in MTEP18 to consider
INTEGRATED RESOURCE PLAN
 HOOSIER ENERGY INTEGRATED RESOURCE PLAN 2016 UPDATE WHAT IS RESOURCE PLANNING? Key features Inputs Resource mix n Member input n Board policies n Regulatory requirements n Risk adjusted least cost Energy
Consideration of Action to Approve a Post-2019 Power Portfolio
 Agenda Number 9biv CONTACT: Thomas W. McCann (623) 869-2343 tmccann@cap-az.com MEETING DATE: April 5, 2018 AGENDA ITEM: Consideration of Action to Approve a Post-2019 Power Portfolio LINKAGE TO STRATEGIC
Before the Public Utilities Commission of the State of South Dakota. In the Matter of the Application of Black Hills Power, Inc.
 Direct Testimony Mark Lux Before the Public Utilities Commission of the State of South Dakota In the Matter of the Application of Black Hills Power, Inc. For the Phase In of Rates Regarding Construction
Zero Net Carbon Portfolio Analysis
 Zero Net Carbon Portfolio Analysis Prepared for: Platte River Power Authority December 12, 2017 www.paceglobal.com Agenda Background Methodology Assumptions Cases Findings and Recommendations Page 2 Background
The Husker Power Plan: A New Energy Plan for Nebraska
 The Husker Power Plan: A New Energy Plan for Nebraska By Sommer Energy, LLC Anna Sommer President Tel. 315-386-3834 anna@sommerenergy.com Applied Economics Clinic Elizabeth A. Stanton, PhD Director and
APSC Docket No U Entergy Arkansas, Inc Integrated Resource Plan
 Entergy Arkansas, Inc. APSC FILED Time: 10/31/2012 2:33:12 PM: Recvd 10/31/2012 2:30:51 PM: Docket 07-016-U-Doc. 24 425 West Capitol Avenue P. O. Box 551 Little Rock, AR 72203-0551 Tel 501 377 4457 Fax
Generation Technology Assessment & Production Cost Analysis
 SPO Planning Analysis Generation Technology Assessment & Production Cost Analysis EAI Stakeholder Meeting July 31, 212 Technology Life Cycle Technology Deployment Over Time Conceptual Research & Development
The Transformation of the New England Electric Grid and the Importance of Situational Awareness Tools
 SEPTEMBER 26, 2017 SPRINGFIELD, MA The Transformation of the New England Electric Grid and the Importance of Situational Awareness Tools North American SynchroPhasor Initiative NASPI Work Group Meeting
Utility Scale Integration of Wind and Solar Power
 Utility Scale Integration of Wind and Solar Power Charles Reinhold WestConnect Project Manager Southwest Renewable Energy Conference Flagstaff, AZ Presentation Overview WestConnect Background Area Control
Entergy New Orleans, Inc.
 . Entergy New Orleans, Inc. An Integrated Resource Plan (2009 2028) Scope and Structure This document describes Entergy New Orleans, Inc. s ( ENOI ) long-term integrated resource plan ( IRP ) 1 for the
THERMAL EFFICIENCY OF GAS FIRED GENERATION IN CALIFORNIA
 STAFF PAPER THERMAL EFFICIENCY OF GAS FIRED GENERATION IN CALIFORNIA Michael Nyberg Electricity Analysis Office Electricity Supply Analysis Division California Energy Commission DISCLAIMER This paper was
Entergy Louisiana, LLC
 . Entergy Louisiana, LLC An Integrated Resource Plan (2009 2028) Scope and Structure This document describes Entergy Louisiana, LLC s ( ELL ) long-term integrated resource plan ( IRP ) 1 for the period
Electrification and its Implications for the California Electricity System
 Electrification and its Implications for the California Electricity System Lorenzo Kristov, Ph.D. Principal, Market & Infrastructure Policy EPRI-IEA Workshop: Challenges in Electricity Decarbonization
Michael Sampson - June 21, Regulatory Challenges of Technical Innovation POWER SYSTEM TRANSFORMATION
 Michael Sampson - June 21, 2017 Regulatory Challenges of Technical Innovation POWER SYSTEM TRANSFORMATION Overview The Regulatory Challenges of Technical Innovation as seen on the Electric Power System
Electricity Supply. Monthly Energy Grid Output by Fuel Type (MWh)
") For the first quarter of 2015, Ontario experienced overall demand that was typical for the province in winter, and strong generator output. Demand for Ontario electricity increased as a result of cold
For the first quarter of 2015, Ontario experienced overall demand that was typical for the province in winter, and strong generator output. Demand for Ontario electricity increased as a result of cold
What is driving the increase in utility capex and what lies ahead?
 What is driving the increase in utility capex and what lies ahead? NARUC Accounting and Finance Subcommittee Spring Meeting Andrew Slaughter, Managing Director, Deloitte Services LP Suzanna Sanborn, Senior
Power Sector Transition: GHG Policy and Other Key Drivers
 Power Sector Transition: GHG Policy and Other Key Drivers JENNIFER MACEDONIA ARKANSAS 111(D) STAKEHOLDER MEETING MAY 28, 214 5/23/14 POWER SECTOR TRANSITION: GHG POLICY AND OTHER KEY DRIVERS 2 Purpose
UNDERSTANDING YOUR UTILITY PARTNERS UTILITY ENERGY EFFICIENCY DRIVERS AND DESIGN CONSIDERATIONS
 UNDERSTANDING YOUR UTILITY PARTNERS UTILITY ENERGY EFFICIENCY DRIVERS AND DESIGN CONSIDERATIONS CEE INDUSTRY PARTNERS MEETING MINNEAPOLIS, SEPTEMBER 2017 WHY INTENTIONALLY SELL LESS ENERGY? DRIVER #1:
New England Electricity Outlook
 O C T O B E R 2 1, 2 0 1 6 S O U T H P O R T L A N D, M E New England Electricity Outlook Environmental and Energy Technology Council of Maine (E2Tech) Eric Johnson D I R E C T O R, E X T E R N A L A F
Con Edison. Evolution of Con Edison efforts in Energy Efficiency and Demand Management:
 Evolution of Con Edison efforts in Energy Efficiency and Demand Management: Innovative programs and technologies, and their impacts on customers, contractors and the markets Con Edison Con Edison - Overview
Renewable Portfolio Standards
 Renewable Portfolio Standards Lisa Schwartz Presentation to Oregon State University Energy Economics Class Feb. 22, 2010 The Regulatory Assistance Project China EU India United States About the Regulatory
Client Name/Presentation Title
 Client Name/Presentation Title MARCH 2 Introduction This presentation will address the following topics: Comparative levelized cost of energy for various technologies on a $/MWh basis, including sensitivities,
Eagle Mountain Pumped Storage Project Draft License Application Exhibit D Project Costs and Financing
 Eagle Mountain Pumped Storage Project Draft License Application Exhibit D Project Costs and Financing Palm Desert, California Submitted to: Federal Energy Regulatory Commission Submitted by: Eagle Crest
Highlights and Key Results
 Highlights and Key Results June 15, 2015 Eric Lantz National Renewable Energy Laboratory 1 Program Name or Ancillary Text eere.energy.gov Wind Vision: Goals Understand the potential role of wind power
High Voltage Direct Current
 High Voltage Direct Current And Large Scale Wind Integration Iowa State University April 2014 Wayne Galli, Ph.D., P.E. Executive Vice President Transmission and Technical Services Clean Line Energy Partners
CAISO s Plan for Integration of Renewable Resources
 CAISO s Plan for Integration of Renewable Resources July 21, 2008 CEC 33% Renewables Workshop Presented by David Hawkins Program Tracks 2008-9 CAISO Work Plan Track 1 - Develop Operational Tools Wind and
Jan Strack and Huang Lin March 14, 2017
 SDG&E Request for Economic Planning Study of the Renewable Energy Express Transmission Project as part of CAISO s 2017-2018 Transmission Planning Process (TPP) Jan Strack (jstrack@semprautilities.com)
Electricity Grid of the Future. Program Director: Dr. Sonja Glavaski
 Electricity Grid of the Future Program Director: Dr. Sonja Glavaski Outline ARPA-e Overview US Energy Landscape DERs and Grid Integration Grid of the Future (Vision & Long Term Goals) Going Forward The
REGULATORY FRAMEWORKS BEHIND DISTRIBUTED ENERGY RESOURCE MARKETS
 REGULATORY FRAMEWORKS BEHIND DISTRIBUTED ENERGY RESOURCE MARKETS Joe Wharton, Ph.D. The Brattle Group Presented to Seminar on Transactive Energy & Distributed Markets Annenberg Auditorium Caltech April
Public Utility Regulatory Policy Act Standards
 Document Type: EA Administrative Record Index Field: Final Environmental Document Project Name: PURPA Standards Project Number: 2007-4 FINAL ENVIRONMENTAL ASSESSMENT TENNESSEE VALLEY AUTHORITY Public Utility
Nuclear Power Economics and Preservation. Presentation Prepared for NARUC Subcommittee on Accounting and Finance Michael Purdie March 29, 2017
 Nuclear Power Economics and Preservation Presentation Prepared for NARUC Subcommittee on Accounting and Finance Michael Purdie March 29, 2017 What is NEI? Our mission is, with member participation: - Develop
Solar Integration into the PJM Grid
 Solar Integration into the PJM Grid Ken Schuyler Manager, Renewable Services PJM Interconnection September 14, 2017 Integrating Solar in PJM PJM Background PJM Initiatives to Address Impacts Analysis of
Hydroelectric Pumped Storage Potential and Renewable Energy Integration in the Northwest
 Hydroelectric Pumped Storage Potential and Renewable Energy Integration in the Northwest Wind generation on Bonneville Power Administration s (BPA) system in the Northwest grew from almost nothing in 1998
2012 Integrated Resource Plan
 2012 Integrated Resource Plan Entergy System This document describes the Entergy System s Integrated Resource Plan for the period 2012 2031. The Integrated Resource Planning Process results in a Preferred
Portland General Electric 2016 Integrated Resource Plan. OPUC Public Meeting December 20, 2016
 Portland General Electric 2016 Integrated Resource Plan OPUC Public Meeting December 20, 2016 Agenda Process and Compliance Approach and Summary Analysis Action Plan Next steps 2 2013 IRP Order Resource
ABENGOA SOLAR Solar Power for a Sustainable World
 Project Scale: A CSP Developer s Perspective Presented To: GovEnergy 06 August, 2008 Phoenix, AZ Index 1 A little about Abengoa Solar 2 3 A little about CSP CSP is big 4 Optimizing project scale 5 6 Optimizing
Evolution of the Grid in MISO Region. Jordan Bakke, David Duebner, Durgesh Manjure, Laura Rauch MIPSYCON November 7, 2017
 Evolution of the Grid in MISO Region Jordan Bakke, David Duebner, Durgesh Manjure, Laura Rauch MIPSYCON November 7, 2017 1 MISO s mission is to ensure reliable delivery of low-cost energy through efficient,
USEA Briefing Washington DC. Neil Kern, July 21, 2016
 USEA Briefing Washington DC Neil Kern, July 21, 2016 Safe Harbor Statement This document includes forward-looking statements within the meaning of Section 27A of the Securities Act of 1933 and Section
Lakeland Electric and the Orlando Utilities Commission should retire the C.D. McIntosh Unit 3 coal-fired power plant in the near future.
 Lakeland Electric and the Orlando Utilities Commission should retire the C.D. McIntosh Unit 3 coal-fired power plant in the near future. Retirement of the plant would benefit the utilities, their customers
Financial Issues and the Future of Coal
 Financial Issues and the Future of Coal David Schlissel January 10, 2012 45 Horace Road, Belmont MA 02478 david@schlissel-technical.com (office) 617-489-4840 (cell) 617-947-9507 Economic vs. Financial
California s Renewable Portfolio Standard
 California s Renewable Portfolio Standard Northwest Power and Conservation Council California Power Markets Symposium September 5, 2013 William A. Monsen MRW & Associates, LLC Oakland, California wam@mrwassoc.comcom
2017 INTEGRATED RESOURCE PLAN UPDATE. May 1, 2018
 2017 INTEGRATED RESOURCE PLAN UPDATE May 1, 2018 This 2017 Integrated Resource Plan Update is based upon the best available information at the time of preparation. The IRP action plan will be implemented
Bulk Power System Integration of Variable Generation - Program 173
 Program Description Program Overview Environmentally driven regulations such as state-mandated renewable energy standards and federal air and water standards, along with improved economic viability for
Regional Coordination in the West: Benefits of PacifiCorp and California ISO Integration
 Regional Coordination in the West: Benefits of PacifiCorp and California ISO Integration Technical Appendix October 2015 Regional Coordination in the West: Benefits of PacifiCorp and California ISO Integration
Rice Solar Energy Project
 Rice Solar Energy Project Tom Georgis June 2012 Copyright 2012 SolarReserve. All Rights Reserved. Company Overview & Highlights Leading solar thermal technology lowest priced CSP, integrated energy storage
Frequently Asked Questions : Asset Strategy, Planning and Risks
 Frequently Asked Questions : Asset Strategy, Planning and Risks Q. How does Southern Company view, assess and manage carbon risks? Southern Company is committed to providing clean, safe, reliable, and
Integrated Resource Plan
 2011 Integrated Resource Plan Addendum Let s turn the answers on. June 27, 2011 For more information, contact: PacifiCorp IRP Resource Planning 825 N.E. Multnomah, Suite 600 Portland, Oregon 97232 (503)
General Session. Four Decades of Pursuing a Diversified Energy Portfolio at MIKE KOTARA. Senior Vice President
 General Session Four Decades of Pursuing a Diversified Energy Portfolio at CPS Energy SPEAKER MIKE KOTARA Senior Vice President CPS Energy CPS Energy Background Electric & Gas utility serving the greater
Summary of the California State Agencies PATHWAYS Project: Long-term Greenhouse Gas Reduction Scenarios
 Summary of the California State Agencies PATHWAYS Project: Long-term Greenhouse Gas Reduction Scenarios April 6, 2015 Introduction California statute requires a reduction in greenhouse gas (GHG) emissions
Water Use, Electric Power, and Nuclear Energy: Environmental Stewardship. William Skaff Nuclear Energy Institute September 15, 2009
 Water Use, Electric Power, and Nuclear Energy: A Holistic Approach to Environmental Stewardship William Skaff Nuclear Energy Institute September 15, 2009 Assumption: Energy Diversityit In addition to efficiency
MACRO OVERVIEW OF DESERT SOUTHWEST POWER MARKET - CHALLENGES AND OPPORTUNITIES
 Power Task Force Agenda Number 4. MACRO OVERVIEW OF DESERT SOUTHWEST POWER MARKET - CHALLENGES AND OPPORTUNITIES CENTRAL ARIZONA PROJECT POWER TASK FORCE MEETING MAY 18, 2017 DALE PROBASCO MANAGING DIRECTOR
Loads and Resources Methods and Assumptions
 Loads and Resources Methods and Assumptions WECC Staff September 2014 155 North 400 West, Suite 200 Salt Lake City, Utah 84103-1114 Loads and Resources Methods and Assumptions ii Contents Purpose... 1
Acreage Needed in 2050 for Renewable Generation to Meet California s GHG Emission Reduction Goals California Energy Commission May 9, 2011
 Acreage Needed in 2050 for Renewable Generation to Meet California s GHG Emission Reduction Goals California Energy Commission May 9, 2011 The Energy Commission has developed a calculator to assist the
Solar Grand Plan. Ken Zweibel PrimeStar Solar February 2008
 Solar Grand Plan Ken Zweibel PrimeStar Solar February 2008 1 The Solar Century? A Proper Skepticism, but 120,000 terawatts of power The only big number out there (Lewis and Smalley) Solution to CO 2 build
Arizona Solar Energy and Economics Outlook By George Frisvold, William P. Patton, and Stan Reynolds
 Arizona Solar Energy and Economics Outlook By George Frisvold, William P. Patton, and Stan Reynolds Prepared for Arizona Solar Energy and Economics Summit January 09, 2009 1 TABLE OF CONTENTS EXECUTIVE
An Economic Assessment of the Benefits of Storage in South Africa. by Jeremy Hargreaves, Energy & Environmental Economics
 An Economic Assessment of the Benefits of Storage in South Africa by Jeremy Hargreaves, Energy & Environmental Economics USTDA/IDC Storage Assessment IDC commissioned the South Africa Energy Storage Technology
An economic assessment of the benefits of storage in South Africa
 An economic assessment of the benefits of storage in South Africa by Jeremy Hargreaves, Energy & Environmental Economics and Paul Frink, Energy Solutions, Parsons Energy storage technologies have many
New England States Committee on Electricity
 Renewable and Clean Mechanisms 2.0 Study Phase I: Scenario Analysis Winter 2017 New England States Committee on Electricity Overview Context Analytical Approach and Modeling Assumptions Scenario Analysis
Understanding the Scale of the Problem: US Energy Sources and CO2 Emissions
 Understanding the Scale of the Problem: US Energy Sources and CO2 Emissions Pete Wilcoxen Departments of Economics and Public Administration The Maxwell School, Syracuse University BUA/ECS 650/EST 696
May 9, This presentation will summarize some key takeaways from the most recent Pacificorp Integrated Resource Plan (IRP) filed in April 2017
 filed in April 2017") Henry Lorenzen Chair Oregon Bill Bradbury Oregon Guy Norman Washington Tom Karier Washington W. Bill Booth Vice Chair Idaho James Yost Idaho Jennifer Anders Montana Tim Baker Montana May 9, 2017 MEMORANDUM
Henry Lorenzen Chair Oregon Bill Bradbury Oregon Guy Norman Washington Tom Karier Washington W. Bill Booth Vice Chair Idaho James Yost Idaho Jennifer Anders Montana Tim Baker Montana May 9, 2017 MEMORANDUM
The Promises and Challenges Facing Renewable Electric Power Generation
 NAE Convocation of the Professional Engineering Societies The Promises and Challenges Facing Renewable Electric Power Generation April 20, 2009 Larry Papay America s Energy Future Changing Focus of Energy
Energy Sense. Power System Engineering, Inc. Tom Butz.
 Energy Sense www.powersystem.org Tom Butz Power System Engineering, Inc. June 15, 2017 Energy Sense Energy Education Making Boring Facts Interesting Making Complicated Concepts Easier to Understand Unique
2014 Integral Analytics, Inc.
 1 2 3 4 5 6 7 Company Overview Putting Advanced Analytics into Software to Manage Utility Costs & Risks Smart Grid Solutions T&D Planning Storage & Renewable Evaluation DSM Planning & Evaluation Marketing
Exploring the Impacts of California s Renewable Portfolio Standard
 Exploring the Impacts of California s Renewable Portfolio Standard System Planning Committee April 2010 Table of Contents Purpose... 1 Vocabulary... 1 System Planning Committee s Initial Assessment...
WWSIS - 3: Western Frequency Response and Transient Stability Study
 WWSIS - 3: Western Frequency Response and Transient Stability Study GE Energy Nicholas W. Miller (PM) Miaolei Shao Slobodan Pajic Rob D Aquila NREL Kara Clark (PM) NERC ERSTF Briefing Atlanta December
1. Executive Summary Ameren Missouri
 Ameren Missouri Ameren's Energy Vision for the Future Ameren's vision is "Leading the Way to a Secure Energy Future," and its mission is "To Power the Quality of Life." At the center of that vision and
EPA s Clean Power Plan Proposal Review of PJM Analyses Preliminary Results
 EPA s Clean Power Plan Proposal Review of PJM Analyses Preliminary Results Paul Sotkiewicz Chief Economist Muhsin Abdur-Rahman Senior Engineer, Market Simulation Members Committee Webinar November 17,
California ISO Preparing California for a Greener and Smarter Grid
 California ISO Preparing California for a Greener and Smarter Grid Presented by Jim McIntosh Director Operations Executive Advisor California ISO Agenda CAISO Overview Current & Future Challenges Renewables
Frequently Asked Questions : Asset Strategy, Planning and Risks
 Frequently Asked Questions : Asset Strategy, Planning and Risks Q. How does Southern Company view, assess and manage carbon risks? Southern Company is committed to providing clean, safe, reliable, and
SB 838: Oregon Renewable Energy Act Establishing an Oregon Renewable Energy Standard
 SB 838: Oregon Renewable Energy Act Establishing an Oregon Renewable Energy Standard Section-by-Section Summary SB 838, C-engrossed version As passed by Oregon House of Representatives, May 23 rd, 2007.
Reduced Network Modeling of WECC as a Market Design Prototype
 PAPER 2011GM0942 1 Reduced Network Modeling of WECC as a Market Design Prototype James E. Price, Member, IEEE, and John Goodin Abstract California s administration, legislature, and energy regulators have
THERMAL ENERGY STORAGE AS AN ENABLING TECHNOLOGY FOR RENEWABLE ENERGY
 THERMAL ENERGY STORAGE AS AN ENABLING TECHNOLOGY FOR RENEWABLE ENERGY Paul Denholm National Renewable Energy Laboratory 1617 Cole Blvd. Golden, CO, USA e-mail: paul.denholm@nrel.gov Sean Ong National Renewable
Liquid Air Energy Storage
 Liquid Air Energy Storage Pumped Hydro Capability No Geographical Constraints 2017 www.highview-power.com In Operation: The Pilot Plant ran from 2011 2014 connected to SSE s biomass facility near London.
Survey of Modeling Capabilities and Needs for the Stationary Energy Storage Industry
 Survey of Modeling Capabilities and Needs for the Stationary Energy Storage Industry Prepared for: Energy Storage Association 1155 15th Street, NW Suite 500 Washington, DC 20005 202.293.0537 energystorage.org
The Economics of Small Modular Reactors
 The Economics of Small Modular Reactors September 14, 2017 Executive Summary This report evaluates the market opportunities, commercialization timeframe, and cost competitiveness of light water small modular
How German Energiewende s Renewables Integration Points the Way
 How German Energiewende s Renewables Integration Points the Way Reliability Increased BY MICHAEL HOGAN, CAMILLE KADOCH, CARL LINVILL AND MEGAN O REILLY 48 PUBLIC UTILITIES FORTNIGHTLY FEBRUARY 218 XT he