Using Data and Models for Informed Decision-Making in Urban Freight Planning
|
|
|
- Ashlyn Hines
- 6 years ago
- Views:
Transcription
1 Using Data and Models for Informed Decision-Making in Urban Freight Planning


2 VREF conference Break out session - USING DATA AND MODELS FOR AN INFORMED URBAN FREIGHT PLANNING AND DECISION MAKING Mathieu Gardrat, LAET
3 Mathieu Gardrat, VREF Conference Gothenburg, October 2016 Freight data collection, modelling and public policies What uses? Diagnosis? Urban planning projects? (medium term) Strategy (transport and urbanism master plans)? (long term) What means? For what purposes in urban policies? Pollution, Safety, Noise, Competitiveness, Congestion
4 Mathieu Gardrat, VREF Conference Gothenburg, October 2016 Data, modelling and decision-making process Diagnosis = Identifying the stakes Surveys (most expensive) Combining existing data Modelling Prioritise: Strong policy Identifying the easiest / most efficient measures Simulation = identifying the relevant measures and their effects Modelling (forecasting) Ex-post evaluation 3

 Establishment survey Log book (1")


5 Mathieu Gardrat, VREF Conference Gothenburg, October 2016 General informations Phone contact UGM surveys (France) Establishment survey Log book (1 week) Pick-ups /deliveries Driver survey Driver questionnaire First visit Description of pick-ups and deliveries Goods Route Second visit Stops Carrier survey Trip sections (source : Toilier et al. 2016) 4
6 Mathieu Gardrat, VREF Conference Gothenburg, October 2016 Combining data sources (France) Surveys and transport data capture: Freight transport surveys (mandatory) Light commercial vehicles surveys (mandatory) UGM surveys Shipper surveys Consumer surveys (end-consumer trips, e- commerce) Data from local authorities where freight transport can be identified Traffic counts Accidents Infractions (parking) Roadside/Cordons surveys Regulation Data giving information on freight transport indirectly (modelling) Census Establishments databases Infrastructures Real estate Vehicle fleets (licence plates) Data from the private sector, big data 5
 (source : Urban freight observatory for the greater Lyon,")
7 Mathieu Gardrat, VREF Conference Gothenburg, October 2016 Combining data sources (Lyon) (source : Urban freight observatory for the greater Lyon, 2016) 6
8 Mathieu Gardrat, VREF Conference Gothenburg, October 2016 Freight modelling 7


9 Mathieu Gardrat, VREF Conference Gothenburg, October
")
10 Mathieu Gardrat, VREF Conference Gothenburg, October 2016 (source : SIRENE 2012, Freturb) 9
 (source : SIRENE 2012,")
11 Mathieu Gardrat, VREF Conference Gothenburg, October 2016 (source : open data Grand Lyon) 25% 20% 15% 10% 5% 0% Distribution of movements during the day (source : SIRENE 2012, Freturb) (source : SIRENE 2012, Freturb) 10


12 Mathieu Gardrat, VREF Conference Gothenburg, October 2016 (Lyon ; source : SIRENE 2012, Freturb) 11

13 Mathieu Gardrat, VREF Conference Gothenburg, October 2016 (Geneva ; usource: Freturb, VISUM, 2010) 12


 Evolution")


14 Mathieu Gardrat, VREF Conference Gothenburg, October 2016 Freight transport simulation Prospective Freight transport in urban planning: Evolution of the urban structure (economy, infrastructures) Evolution of logistics organisations Urban structure Urban structure N+ N+1 Logistics organisations Logistics organisations N Urban structure Logistics organisations Diagnosis 13

15 1 18 OCTOBER 2016 Using data for informed decision-making in urban freight planning Ian Wainwright Head of Freight and Fleet Programmes VREF Conference on Urban Freight 2016

16 2 Why do we need data on freight? Deliveries and servicing impacts street performance Loading location not always matched to the delivery and servicing demand in an area Delivery and servicing vehicle activity is driven by convenience; drivers use kerbside, parking bays, bus stops and even pedestrian crossings Legal provision is not always available Has a knock on effect on traffic flow, congestion and air-quality, pedestrian permeability, safety and the overall environment of the street


17 3 Street surveys - a new methodology Scheme Feasibility 1 How to survey 2 How to manage 3 Without extra time Preliminary Design Consultation Detailed Design Implementation Post implementation


18 4 Data Collection Local data collection including land use is key
19 5 What the data shows Freight activity is approx. 7% of all kerbside activity Activity is mainly food, office and waste Land use is key (high street v high road) All streets are different (even the same type/category) Deliveries occur every day, both weekday and weekend activity varies Peak times differ, even without restrictions Physical access barriers affect delivery location Front access is preferred, even when rear facilities available Data in isolation doesn t show a broken street but comparing data can show if one area is better or worse It needs a LOCAL approach - one size doesn t fit all...


20 6 Using the data to identify the conflict... On site On street Shared
21 7 What next? Demystify freight for designers: it s goods and services What s the hook? Safety, air quality, congestion, place? Look for non-freight issues: sometimes it s parking, pedestrian access or improving the trading environment Methodology must be flexible Embed delivery and servicing activity in all future projects and schemes using project governance approach Involve all stakeholders: operators, business, regulators, politicians, city/local authorities

22 8 Contact


23 DATA DRIVEN LOGISTICS PUBLIC POLICY: BOGOTÁ CASE Juan P Castrellón Manager of the Public Private logistics office for Bogotá - Cundinamarca October 18th, 2016
24 Agenda 2 Logistics information: a coordination issue Bogotá s approach to Data Driven Logistics public policy Trends and opportunities


25 Logistics information: a coordination issue Urbanfreight deliveries information 1 What the sales people thinks it is 2 What the driver thinks it is 3 What the logistics service provider thinks it is 4 What the Logistics Platform manager think it is


26 Logistics information: a coordination issue Action of managing dependencies among entities and their joint efforts to achieve the established common goals (Wang, Zhou, & Wang, 2010).


27 Bogotá s approach to Data Driven Logistics public policy Institutional framework Bogotá Collaborative strategy between public and private agencies for the implementation of the Regional Logistics Plan" The office s mission is to encourage initiatives that facilitate urban-regional logistics activities with the objective of improving the competitiveness of Bogotá and Cundinamarca through the articulation of the public, private and academic sectors. Cundinamarca
28 Bogotá s approach to Data Driven Logistics public policy Logisticsinformationin Bogotá Especial projects Private sector information Freight Flows Economic development Infrastructure availability Territory planning


29 Bogotá s approach to Data Driven Logistics public policy Logisticsinformationin Bogotá
30 Bogotá s approach to Data Driven Logistics public policy Logisticsinformationin Bogotá Challenges Freight generation rates per logistics zones Detailed logistics information about city micro zones Analysis Space usage and interest from private sector to invest in particular projects and zones Challenges Analysis Decisions Decisions Territory plans and infrastructure focused on logistics Logistics performance index for municipalities


31 Bogotá s approach to Data Driven Logistics public policy Logisticsinformationin Bogotá Origin destination matrix Freightvehicle per corridor


32 Bogotá s approach to Data Driven Logistics public policy Logisticsinformationin Bogotá Parking zones availability Bay availability On Street availability Loading and unloading activities in the city


33 Bogotá s approach to Data Driven Logistics public policy Logisticsinformationin Bogotá Challenges Real time information Platforms for sharing information from private sector Challenges Decisions Analysis Decisions Analysis


34 Bogotá s approach to Data Driven Logistics public policy Logisticsinformationin Bogotá Off-hour deliveries in Bogotá
35 Bogotá s approach to Data Driven Logistics public policy Logisticsinformationin Bogotá Scorecard built directly from private sector information
36 Bogotá s approach to Data Driven Logistics public policy Logisticsinformationin Bogotá Challenges Open platforms for sharing information Analytics Challenges Decisions Decisions Programs leaded by public and private authorities Analysis Private companies performances Needs from the private sector Analysis
37 Trends and opportunities Enablers of coordination in logistics data sharing strategies The model of a collaborative process of local government as a policy maker requires to take into account the following facts (Witkowski, J. & Kiba-Janiak, M., 2014): Web 2.0 & social networking A collaborative process should include all stakeholders of city logistics and starts from the stakeholders needs analysis. Dialogue is a key principle that should build trust among all stakeholders. There must be considered a process of mutual understanding of the needs and expectitations as well as stakeholders involvement. Advanced analytics Open standards and ecosystems Open Access to public data Geospatial platforms Digitally controlled devices Internet of things All the stakeholders should be involved in developing strategic plans, using available tolos and methids. Ubiquitous connectivity Anytime / anyplace devices Collaboration platforms Cloud computing Source: (Katarzyna Nowicka, 2014)

38 Thank you! JUAN PABLO CASTRELLON Manager of the Public Private logistics office for Bogotá Cundinamarca

39 Applications of Data from Establishment Surveys 1
40 Data Problem? or Knowledge Problem? 2
41 The main challenge 3 Lack of knowledge, not lack of data The way to overcome the challenge Obviously, taking steps to enhance knowledge

42 Knowledge, Models, and Data 4 Data do not necessarily lead to Knowledge, D K Models cannot be developed without Knowledge Knowledge/Model inform Data collection: K+M D We need integrative developments: K+M+D Knowledge Models Data
43 Implications, treating the challenge as: 5 a data problem ( the Brute Force approach ): Bad idea, it is not feasible to collect all data we need: Too expensive Time consuming Will not provide the knowledge needed as an information inference problem: Cost effective: Key data are collected, models used to infer data gaps Requires research on freight modeling (a good thing) Model improvements would lead to better inference and better data collection procedures
44 Main Uses To gain insight into the commercial sector s perception of priorities, issues, etc. To quantify commercial establishment demand for freight and services To determine the behavioral response from the commercial sector to public sector initiatives (projects, programs, policies) 6
45 Pros/Cons of Establishment Surveys (and Models) Commercial Establishment Surveys: Provide a better connection between an expression of commercial activity and the attributes of the establishment Expression of commercial activity freight generation, freight trip generation, service trip generation, mode choice etc. Attributes of the establishment size, commodity type(s), line of business, industry sector, etc. Require less data than aggregate approaches, are more efficient using the data Lead to better models Could be aggregated to any level of geography Require a solid idea about the sectors that create demand...
46 Industry Sectors in Metro/Micropolitan Statistical Areas NAICS Freight-intensive Sectors (FIS) NAICS Non-freight-intensive Sectors (non-fis) 11 Agriculture, Forestry, Fishing, Hunting 51 Information 21 Mining, Quarrying, Oil / Gas 52 Finance and Insurance 22 Utilities 53 Real Estate and Rental and Leasing 23 Construction 54 Professional,Scientific,Tech. Services Manufacturing 55 Management of Companies / 42 Wholesale Trade 56 Administrative,Support,Waste Manag Retail Trade 61 Educational Services Transportation and Warehousing 62 Health Care and Social Assistance 72 Accommodation and Food Services 71 Arts, Entertainment, and Recreation 81 Other Services 92 Public Administration 45% of commercial establishments and 50% of employment 8 2.8% of commercial establishments and 3.6% of employment
47 Key Considerations The Industry Sector, Establishment Size, and Type of Commodity transported (somewhat determined by Industry Sector) heavily influence: Freight Generation Freight Trip Generation Service Trip Generation The behavioral attitude towards public sector policies Understanding behavior and generation patterns at the establishment level is essential Commercial Establishment Surveys are KEY 9
48 Case #1: Freight Generation, Freight Trip Generation, and Service Trip Generation
49 FG/FTG/STG analyses To estimate the amount of freight, freight-trips, and servicetrips Key for planning, analyses of parking demand, traffic impact analyses, and land use planning at a fine level of detail Generation of demand/cargo (FG): A manifestation of the production/consumption processes Implication: FG will increase with (economic) inputs Generation of traffic (FTG): Result of logistical decisions Implication: FTG may not increase with (economic) inputs Generation of Service Trips (STG): Determined by needs for outside support

50 Background Based on surveys: Establishment-level surveys CFS microdata Estimated FTG models Establishment-level Economic based Using publicly available data as independent variables Validated them Outperformed the alternatives Free-software available The second phase produced models to estimate freight generation, freight trip generation, and service trip generation (to be released later this year) This presentation is based on the 12 old models
")
51 Survey form (from NCFRP Report 19) 13

 and production (FTP).")
52 Freight Trip Generation (FTG) Software Tool to identify main locations where freight is an issue in terms of freight trips produced and attracted. It applies FTG models at ZIP code and 2 digit NAICS codes. Module 1: preprocesses County Business Pattern data from the census bureau and generates a database at a ZIP Code and 2 digit NAICS code level. Module 2: applies FTG models and produces estimations of freight trip attraction (FTA) and production (FTP). Module 3: allows modifying the coefficients used in the estimation of FTG models and selecting employment size Advanced features: 4 types of models available 14 Freight Trip Generation Estimator:
53 FTG at Metro/Micro-politan Areas 15 Thousands Total FTG Total of establishments Total employment FTG = * Population FTG = * Establishments FTG = * Employment 0 Population (Millions)

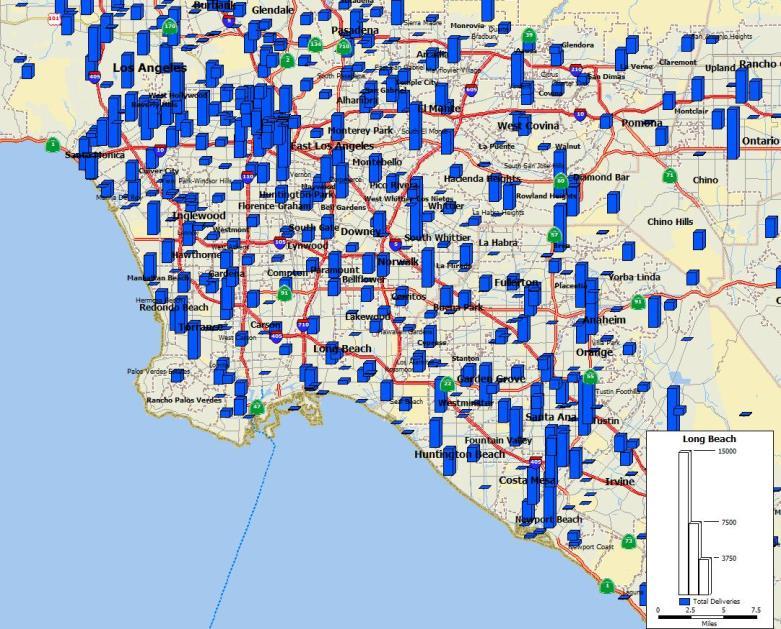


54 Freight Trip Generation by ZIP Code Long Beach Portland 16 Houston DC-Baltimore
55 Case #2: Freight Behavior Research to Support Freight Policy Making


56 Supply Chains Need to Change Behavior (Not Only the Carriers) The shippers The carriers The receivers The Economy 18
57 Successful freight policy-making requires: A clear understanding of: The role of the key agents: shippers, carriers, and receivers What they could decide on their own, and what could not What decisions they need to make for change to happen The policies and policy targets to induce the desired change Policies that require multi-agent coordination work much better if the policies target the agent with most power (which typically is not the carrier) Complex problems require complex solutions, there is no way to escape complexity In complex problems, obvious solutions are almost always wrong 19
58 Freight Behavior Research Conducted partial list Technology acceptance by freight carriers: Container Status Inquiry Systems Electronic Toll Collection systems Reactions to time-of-day tolls Reactions to time-distance tolls in intercity travel Policies to foster off-hour deliveries Carrier focused Receiver focused (Receiver) Inclination to consolidate deliveries to increase sustainability Freight/vehicle mode choice
59 Behavioral research conducted Behavioral surveys assessed the responses of carriers/receivers to policies to induce Assisted/Unassisted Off-Hour Deliveries Assisted OHD: 400 carriers and 400 receivers Unassisted OHD: 260 receivers Policies studied (Assisted OHD): Carriers: Customer request from receivers, request & toll savings. request & parking, request & paid permit Receivers: Financial incentive, Shipping discounts Policies studied (Unassisted OHD): Receivers: Financial incentive, Shipping discounts, Trusted Vendors, Business Support Services, Public Recognition The data were used to estimate behavioral choice models 21
60 Assisted OHD: Behavioral Research Findings Freight Carriers: All of them are HEAVILY influenced by the receivers decision on time of delivery Only the carriers in Petroleum/coal, Wood/lumber, Food, Textiles/clothing are sensitive to tolls Receivers of supplies: All receivers are moderately sensitive to tax deductions Receivers in these sectors are more sensitive than the rest: Wood, Alcohol, Paper, Medical Supplies, Food, Printed Materials, and Metal 22
61 Unassisted OHD: Behavioral Research Findings Key determinants in participation in Unassisted OHD: One-Time-Incentive (financial) Discounts from vendors (financial) Business support is worth Public recognition is worth Trusted vendor is worth Suggestion: Public sector Incentives and public recognition Carriers/vendors Shipping discounts Industry groups Create a Trusted vendor program 23
62 Freight Behavior Research Instrumental in the success of the OHD project Helped us find the: Right industry segment Right combination of incentives Right amount of incentives The prevailing wisdom was that OHD would not work, freight behavior research cleared the path for a transformative project 24
63 How could we improve these techniques?
64 Recommendations for Improvements The models are as good as the data Although progress has been made, improvements are needed Collect freight generation, freight trip generation, and service trip generation from different jurisdictions Use the pooled data to estimate models Foster use of freight behavior research to support policy making In complex systems like this one, professional intuitions though valuable are not always right Data driven policy making is key to facilitate implementation More experience is needed to develop a stronger knowledge base 26
65 Resources from TRB NCFRP Report 19: Freight Trip Generation and Land Use (2012) NCHRP Synthesis 410: Freight Transportation Surveys (2011) NCHRP Synthesis 385: Forecasting Metropolitan Commercial & Freight Travel (2008) 27
66 Additional Resources FMIP website: TMIP website: SHRP2 Freight Demand Modeling and Data Improvement (Project C20): ight_demand_modeling_and_data_improvement Freight Trip Generation Estimator: 28

67 Using Data and Models for Informed Decision-Making in Urban Freight Planning
68 Results from Mentimeter
69 Results from Mentimeter
70 Results from Mentimeter
71 Results from Mentimeter

72 Results from Mentimeter
73 Results from Mentimeter
74 Results from Mentimeter
75 Results from Mentimeter
76 Thanks for attending the break out session! Iván Sánchez-Díaz
José Holguín-Veras, William H. Hart Professor Director of the VREF Center of Excellence for Sustainable Urban Freight Systems
 1 Enhancing Freight Mobility? Correction: Enhancing Freight No, We Mobility? Need to Enhance the Economy José Holguín-Veras, William H. Hart Professor Director of the VREF Center of Excellence for Sustainable
Ivan Sanchez-Diaz (corresponding), Rensselaer Polytechnic Institute
, Rensselaer Polytechnic Institute") Paper Author (s) Jose Holguín-Veras, Rensselaer Polytechnic Institute (jhv@rpi.edu) Ivan Sanchez-Diaz (corresponding), Rensselaer Polytechnic Institute (sanchi2@rpi.edu) Miguel Jaller, Rensselaer Polytechnic
Paper Author (s) Jose Holguín-Veras, Rensselaer Polytechnic Institute (jhv@rpi.edu) Ivan Sanchez-Diaz (corresponding), Rensselaer Polytechnic Institute (sanchi2@rpi.edu) Miguel Jaller, Rensselaer Polytechnic
A MICRO-APPROACH TO UNDERSTANDING URBAN COMMERCIAL VEHICLE MOVEMENTS: PRELIMINARY RESULTS FROM A WEB-BASED ESTABLISHMENT SURVEY
 A MICRO-APPROACH TO UNDERSTANDING URBAN COMMERCIAL VEHICLE MOVEMENTS: PRELIMINARY RESULTS FROM A WEB-BASED ESTABLISHMENT SURVEY GEORGIANA MADAR AND HANNA MAOH Department of Civil and Environment Engineering,
Labor and Business Statistics For Fidalgo Island (Zip code 98221)
") Labor and Business Statistics For Fidalgo Island (Zip code 98221) May 27, 2016 Prepared for Anacortes Chamber of Commerce Prepared by Table of Contents Notes About This Report... 3 About the Authors...
Labor and Business Statistics For Fidalgo Island (Zip code 98221) May 27, 2016 Prepared for Anacortes Chamber of Commerce Prepared by Table of Contents Notes About This Report... 3 About the Authors...
STRATEGIC MOBILITY PLAN ADVISORY COMMITTEE MEETING 2 MAY 16, 2017
 STRATEGIC MOBILITY PLAN ADVISORY COMMITTEE MEETING 2 MAY 16, 2017 1 AGENDA 1. Summary of public & stakeholder input 2. Review of market findings and forecast, trends and opportunities and threats 3. Work
MASTER PLAN. Public Workshop Overview Presentation
 MASTER PLAN Public Workshop Overview Presentation MURRAY CITY HALL September 27, 2018 Purpose of the Project Assess the built environment and development conditions Understand the physical and environmental
SWOT Analysis of Commodity Flow Datasets
 SWOT Analysis of Commodity Flow Datasets prepared for FDOT Transportation Statistics Office prepared by RS&H, Inc. 5/6/2015 Background Many users work with commodity flow data Modelers GIS analysts Policy
BUSINESSES CHOOSE TO BE NEAR TRANSIT
 BUSINESSES CHOOSE TO BE NEAR TRANSIT Data Shows Importance of Proximity to Bus or Rail Stop The business community understands the benefits that accrue from transit-accessible locations, which help explains
Parking and Urban Deliveries: Role of Parking Pricing
 Parking and Urban Deliveries: Role of Parking Pricing José Holguín-Veras, William H. Hart Professor, Director of the Center for Infrastructure, Transportation, and the Environment Rensselaer Polytechnic
THE TRANSSHIPMENT PROBLEM IN TRAVEL FORECASTING: TOUR STRUCTURES FROM THE ONTARIO COMMERCIAL VEHICLE SURVEY
 THE TRANSSHIPMENT PROBLEM IN TRAVEL FORECASTING: TOUR STRUCTURES FROM THE ONTARIO COMMERCIAL VEHICLE SURVEY University of Wisconsin Milwaukee Paper No. 09-3 National Center for Freight & Infrastructure
City of Hamilton Annual. Employment Survey 2016 AND 2017 TABLES AND CHARTS
 City of Hamilton Annual Employment Survey 2016 AND 2017 TABLES AND CHARTS Table of Contents KEY HIGHLIGHTS... 2 CITY-WIDE EMPLOYMENT... 4 EMPLOYMENT BY AREA... 9 HAMILTON URBAN GROWTH AREA... 9 EMPLOYMENT
A Comparison of Contributions to the Canadian Economy of Key Bulk Commodity Shippers and Rail Freight Carriers
 Policy and Economic Analysis Program Rotman School of Management University of Toronto 140 St. George St., Ste 325 Toronto, Ontario M5S 3G6 Final Report October 2009 A Comparison of Contributions to the
Volvo Research Foundation Future Urban Transport Symposium
 Urban freight for liveable cities Volvo Research Foundation Future Urban Transport Symposium 15 th October 2012 Peter Hendy CBE Commissioner, Transport for London Contents Freight in London London Freight
GRAND RAPIDS AND REGION Economic Profile
 GRAND RAPIDS AND REGION Economic Profile This report contains demographic, job and business data. The data in this report provides basic information about the economy of the region in order to inform the
Creating New Dynamism, Fostering a Shared Future on the Asia-Pacific
 2016/ISOM/SYM/005 Session I Creating New Dynamism, Fostering a Shared Future on the Asia-Pacific Submitted by: PECC Symposium on on Priorities for APEC 2017 Ha Noi, Viet Nam 8 December 2016 Symposium on
VREF conference on Urban Freight 2016: Plan for the future sharing urban space
 VREF conference on Urban Freight 2016: Gothenburg 17-19 October 2016 Venue: University of Gothenburg Lindholmen Science Park The second international conference organised by the Urban Freight Platform
Freight Transportation Challenge More Trucks, More Fuel, More GHGs?
 Freight Transportation Challenge More Trucks, More Fuel, More GHGs? presented to Thirteenth Biennial Conference on Transportation Energy and Policy Asilomar Conference Center Pacific Grove, California
Who Earns $15 in St Paul?
 The St Paul Minimum Wage Study Committee Supplement 06--08-A Who Earns $ in St Paul? Committee Question Supplement SHORT ANSWER: In the City of St Paul, 3 percent of workers earn $ an hour or less, with
FLIN FLON AND REGION Economic Profile
 FLIN FLON AND REGION Economic Profile This report contains demographic, job and business data. The data in this report provide basic information about the economy of the region in order to inform the strategic
Partnering to Create an Off Peak Delivery Pilot Program in Metropolitan Chicago. June 4, 2015 Jim LaBelle
 Partnering to Create an Off Peak Delivery Pilot Program in Metropolitan Chicago June 4, 2015 Jim LaBelle The Premise Businesses generally want deliveries during normal hours. Truckers need to meet those
José Holguín-Veras, William H. Hart Professor Director of the VREF s Center of Excellence for Sustainable Urban Freight Systems
 1 Urban Freight Transport: The Final Frontier (and our role as the pioneers ) José Holguín-Veras, William H. Hart Professor Director of the VREF s Center of Excellence for Sustainable Urban Freight Systems
How to make your community freight friendly.. September 21, 2011
 How to make your community freight friendly. September 21, 2011 Purpose/products: NCFRP 15 Urban Goods Movements Comprehensive guidebook For public decision makers Focused on consumer goods urban pick
2. Goals and Objectives
 Pedestrians in Charlotte s busy Uptown. CRTPO Mission The mission of the Charlotte Regional Transportation Planning Organization (CRTPO) is to plan for transportation options that ensure mobility, respect
DYNAMIC MODELING AND BORDER EFFECTS
 DYNAMIC MODELING AND BORDER EFFECTS Regional Economic Models, Inc. REMI Presenters Scott Nystrom, M.A. Senior Economic Associate (202) 713-1397 Chris Brown Managing Economic Associate
AN ECONOMIC DESCRIPTION OF THE AGRICULTURAL SECTOR IN PERSHING COUNTY
 TECHNICAL REPORT UCED 2006/07-15 AN ECONOMIC DESCRIPTION OF THE AGRICULTURAL SECTOR IN PERSHING COUNTY UNIVERSITY OF NEVADA, RENO An Economic Description of the Agricultural Sector in Pershing County Report
Delivering to London. John Crosk Operations Manager EPA- Polis Parking Workshop Stuttgart, 17 th May 2011
 Delivering to London John Crosk Operations Manager EPA- Polis Parking Workshop Stuttgart, 17 th May 2011 Introduction Tradeteam is the UK s leading drinks logistics business. It was formed in 1995 with
Counts and Density of All Jobs in Work Selection Area in All Workers
 OnTheMap Work Area Profile Report All Jobs for All Workers in. Created by the U.S. Census Bureau s OnTheMap http://onthemap.ces.census.gov on 02/18/2014 s and Density of All Jobs in Work Selection Area
José Holguín-Veras, William H. Hart Professor Director of the VREF Center of Excellence for Sustainable Urban Freight Systems
 1 The Off-Hours Delivery Project in New York City José Holguín-Veras, William H. Hart Professor Director of the VREF Center of Excellence for Sustainable Urban Freight Systems jhv@rpi.edu The USDOT/RITA
2011 Sherman-Denison Work Place and Special Generator Travel Survey Technical Summary
 2011 Sherman-Denison Work Place and Special Generator Travel Survey Technical Summary Prepared by by the Texas Texas A&M A&M Transportation Institute February January 2019 2014 2011 Sherman-Denison Work
actsheet Prices, taxes and subsidies
 actsheet Prices, taxes and subsidies This paper was prepared by: SOLUTIONS project This project was funded by the Seventh Framework Programme (FP7) of the European Commission Solutions project www.uemi.net
Counts and Density of All Jobs in Work Selection Area in All Workers
 OnTheMap Work Area Profile Report All Jobs for All Workers in. Created by the U.S. Census Bureau s OnTheMap http://onthemap.ces.census.gov on 02/18/2014 s and Density of All Jobs in Work Selection Area
CityLab London Workshop: Urban Logistics policies developments, Consolidation and Efficiency
 1 12 MAY 2017 CityLab London Workshop: Urban Logistics policies developments, Consolidation and Efficiency Steve Steele, Efficient Deliveries Programme Manager, Transport for London 2 The London freight
Stakeholder Consultation Outcomes
 City of Hobart TRANSPORT STRATEGY 2018-2030 Consultation Phase MODULE 1 FREIGHT, PORT AND AIR Stakeholder Consultation Outcomes November 2016 in association with T ABLE OF C ONTENTS 1. Background 2. Consultation
Policy Brief. Three Transportation Revolutions: Synergies with Transit. Summary. Introduction
 INSTITUTE OF TRANSPORTATION STUDIES Policy Brief February 2017 In November 2016, the Institute of Transportation Studies at the University of California, Davis (ITS- Davis) convened leading academic, government,
Regional Competitive Industry Analysis
 Regional Competitive Industry Analysis Jackson and Josephine Counties October 2016 Josephine Jackson Michael Meyers, Economist (503) 229-6179 michael.meyers@oregon.gov Jill Cuyler, Research Analyst (503)
Transferability of Freight Trip Generation Models. Iván Sánchez-Díaz
 1 Transferability of Freight Trip Generation Models Iván Sánchez-Díaz Researcher Rensselaer Polytechnic Institute VREF S Center of Excellence for Sustainable Urban Freight Systems Co-Authors: José Holguín-Veras,
Presentation by Rick Engler, Director, New Jersey Work Environment Council (WEC) OSHA Listens, March 4, 2010, Washington, D.C.
 OSHA Listens, March 4, 2010, Washington, D.C.") Presentation by Rick Engler, Director, New Jersey Work Environment Council (WEC) OSHA Listens, March 4, 2010, Washington, D.C. The New Jersey Work Environment Council is an alliance of 70 labor, environmental,
Presentation by Rick Engler, Director, New Jersey Work Environment Council (WEC) OSHA Listens, March 4, 2010, Washington, D.C. The New Jersey Work Environment Council is an alliance of 70 labor, environmental,
GULF COAST RAIL DISTRICT VISION FOR REGIONAL RAIL
 GULF COAST RAIL DISTRICT VISION FOR REGIONAL RAIL OCTOBER 2014 Cover photographs courtesy of Top left - Mike Bates TABLE OF CONTENTS MISSION... 1 INTRODUCTION... 1 VISION STATEMENT... 1 BACKGROUND... 2
Business-Facts Summary Dublin city, CA ( )
") 3 Digit NAICS Top Ten Summary Healthcare and Social Assistance Ambulatory Health Care Retail Trade Professional, Scientific, and Technical Other (except Public Administration) Retail Trade Retail Trade
3 Digit NAICS Top Ten Summary Healthcare and Social Assistance Ambulatory Health Care Retail Trade Professional, Scientific, and Technical Other (except Public Administration) Retail Trade Retail Trade
Trade Logistics and the 2030 Agenda for Sustainable Development
 Multi-year Expert Meeting on Transport, Trade Logistics and Trade Facilitation: Trade Logistics and the 2030 Agenda for Sustainable Development 23-24 October 2017 by Mr. Sudhir Gota International Consultant
Traffic Congestion & Delay Cost Our Region.
 The Potential for Off Peak Delivery in Metropolitan Chicago October 15, 2015 Jim LaBelle Funding provided by Traffic Congestion & Delay Cost Our Region. Congestion costs our economy $7.6 billion annually.
TRANSPORTATION DEMAND FORECASTING INFORMATION SESSION
 GTA WEST CORRIDOR PLANNING AND EA STUDY-STAGE STAGE 1 TRANSPORTATION DEMAND FORECASTING INFORMATION SESSION JUNE 2008 Topics for this Session 1. The Challenge of Growth 2. Overview of GTAW Study 3. The
Institute for Research on Innovation & Science (IRIS)
") UMETRICS @ Institute for Research on Innovation & Science (IRIS) Creating trusted, independent data about research Jason Owen-Smith Executive Director, IRIS Professor, University of Michigan jdos@umich.edu
UMETRICS @ Institute for Research on Innovation & Science (IRIS) Creating trusted, independent data about research Jason Owen-Smith Executive Director, IRIS Professor, University of Michigan jdos@umich.edu
Appendix A NAICS Codes and Titles
 Appendix A NAICS Codes and Titles The current analysis of the US economy uses a classification system that is based on the 6-digit North American Industry Classification System (NAICS) introduced in year
MELITA AND REGION Economic Profile
 MELITA AND REGION Economic Profile This report contains demographic, job and business data within the geographic boundaries of the area known as Melita Self-contained Labour Area (SLA). It includes the:
New Mexico Statewide Model
 New Mexico Statewide Model Fifth Largest State in land area 2005 Population 1.97 million 42% of state in Albuquerque and Santa Fe area Outside urban areas population density very low New Mexico Planning
Fatal injuries. Total Goods producing
 Total 120 100.0 82 100.0 12 100.0 26 100.0 Goods producing 51 42.5 39 47.6 -- -- 9 34.6 Natural resources and mining 22 18.3 18 22.0 -- -- 4 15.4 Agriculture, forestry, fishing and hunting 14 11.7 10 12.2
Use Big Data and Modeling Tools To Decipher Traffic Patterns: Case Studies in Virginia
 Use Big Data and Modeling Tools To Decipher Traffic Patterns: Case Studies in Virginia Agenda Need for O-D Data O-D Data Collection A Primer Big Data and StreetLight Data Use Modeling Tool for O-D Estimation
Business-Facts: 3 Digit NAICS Summary 2015
 Business-Facts: 3 Digit NAICS Summary 25 McLean CRD 25 Polygon : MCLEAN, NAICS Code Business Description Establishment Employees Sales (in Millions) Agriculture, Forestry, Fishing and Hunting Crop Production
Multi-year Expert Meeting on Transport, Trade Logistics and Trade Facilitation
 Multi-year Expert Meeting on Transport, Trade Logistics and Trade Facilitation Sustainable Freight Transport Systems: Opportunities for Developing Countries 14-16 October 2015 URBAN FREIGHT PRESENTATION
FRESNO COG TRANSPORTATION MODEL DEVELOPMENT AND SUPPORT
 Proposal for Consulting Services for FRESNO COG TRANSPORTATION MODEL DEVELOPMENT AND SUPPORT Prepared for: Fresno Council of Governments (Fresno COG) P12-3814-WC Table of Contents OVERVIEW... 1 DETAILED
Summary of IAP Tallinn. Jaagup Ainsalu. Transport Department. Introduction to the city
 Summary of IAP Tallinn Jaagup Ainsalu Transport Department Introduction to the city Tallinn is the capital and largest city in Estonia, with approximately 33% of Estonia s total population. Tallinn never
An Integrated Transport - Economics Model for Ontario
 An Integrated Transport - Economics Model for Ontario by Sundar Damodaran, Ph.D., P.Eng. Ministry of Transportation, Ontario Paper prepared for presentation at the Travel Demand Modeling: Applications
Asmoothly functioning freight transportation
 NEW COOPERATIVE RESEARCH PROGRAMS REPORT Preserving and Protecting Freight Infrastructure and Routes MARK E. MEITZEN The author is Vice President, Christensen Associates, Madison, Wisconsin. Asmoothly
GIMLI AND REGION. Economic Profile
 GIMLI AND REGION Economic Profile This report contains demographic, job and business data within the geographic boundaries of the area known as the Gimli Self-contained Labour Area (SLA). It includes the:
LEAF RAPIDS AND REGION Economic Profile
 LEAF RAPIDS AND REGION Economic Profile This report contains demographic, job and business data. The data in this report and the analysis provide basic information about the economy of the region in order
New Trends. Observatory. Urban Logistics: an. Impacting
 New Trends Impacting Urban Logistics: an Observatory IFSTTAR, April 2018 C i yla b About the Observatory of Strategic Developments Impacting Urban Logistics Urban freight planning and operations need to
The Role of Classification Systems in Freight Trip Generation (FTG) Modeling
 Modeling") 1 The Role of Classification Systems in Freight Trip Generation (FTG) Modeling Shama Campbell, M.S. Researcher campbs4@rpi.edu Rensselaer Polytechnic Institute VREF Center of Excellence for Sustainable
1 The Role of Classification Systems in Freight Trip Generation (FTG) Modeling Shama Campbell, M.S. Researcher campbs4@rpi.edu Rensselaer Polytechnic Institute VREF Center of Excellence for Sustainable
Sabbir Saiyed, PhD., P.Eng. Manager, Transportation System Planning
 Sabbir Saiyed, PhD., P.Eng. Manager, Transportation System Planning February 5, 2016 Goods Movement is a Major Part of Peel s Economy Peel is one of Canada s most important freight hubs Close to major
City Logistics in Sustainable Planning
 5 th Cyprus Sustainable Mobility and Intelligent Transport Conference 16-17 May 2017 City Logistics in Sustainable Planning Prof. Seraphim KAPROS City Logistics in Sustainable Planning From Urban Goods
Business-Facts Summary - 3 Digit NAICS Summary
 - 3 Digit NAICS Summary Title Page Title Page Data Version: 2018 Feb (Internal) Report Generation Method: Single Analysis Area: 1789 STATE ST, SAN DIEGO, CA, 92101-2530 Reporting Detail: As Selected Include
Fluorescent Lamp Ballasts: 2003 Issued June 2004 Summary
 Fluorescent Lamp Ballasts: 2003 Issued June 2004 Summary MQ335C(03)-5 Current data are released electronically on Internet fluorescent lamp ballasts shipped decreased for all individual surveys as they
Employment Ontario Information System (EOIS) Case Management System
 Case Management System") Employment Ontario Information System (EOIS) Case Management System Service Provider User Guide: Reporting Canada Ontario Job Grant Employers (Client Level) #95 Version 1.2 September 2017 Table of Contents
Employment Ontario Information System (EOIS) Case Management System Service Provider User Guide: Reporting Canada Ontario Job Grant Employers (Client Level) #95 Version 1.2 September 2017 Table of Contents
Content of the module
 Content of the module Methodology approach Planning process Definition of working area Population and territorial context Supply Infrastructure Transport service Demand On board / at the stations or bus
Consumption Matrices and the Economy. In the early 1970's Wassily Leontief was doing research on how changes in one
 Consumption Matrices and the Economy 1 Benson Haglund Consumption Matrices and the Economy In the early 1970's Wassily Leontief was doing research on how changes in one economic sector may have an effect
Fluorescent Lamp Ballasts: 2001 Issued July 2002 Summary
 Fluorescent Lamp Ballasts: 2001 Issued July 2002 Summary MQ335C(01)-5 Current data are released electronically on Internet fluorescent lamp ballasts shipped decreased for all individual surveys as they
2019 TNCPE Board of Examiners Return Examiner Application
 2019 TNCPE Board of Examiners Return Examiner Application This form should be completed by applicants who have served on the TNCPE Board of Examiners within the last two years. Our Mission To drive organizational
SUBURBAN EDGE COMMUNITY ROLE COUNCIL ROLE ALL COMMUNITIES SUBURBAN EDGE
 Orderly and Efficient Land Use Align land use, development patterns, and infrastructure to make the best use of public and private investment. Plan and stage development for forecasted growth through 2040
2018 TNCPE Board of Examiners Return Examiner Application
 2018 TNCPE Board of Examiners Return Examiner Application This form should be completed by applicants who have served on the TNCPE Board of Examiners within the last two years. Our Mission To drive organizational
The distribution network in India has major channel components like retail network, wholesale
 Last Mile Distribution in India: Overview The distribution network in India has major channel components like retail network, wholesale network, and the logistic infrastructure. The traditionally followed
RURAL CENTER COMMUNITY ROLE COUNCIL ROLE RURAL CENTER ALL COMMUNITIES
 Orderly and Efficient Land Use Align land use, development patterns, and infrastructure to make the best use of public and private investment. Plan for forecasted population and household growth at overall
Region One Workforce Investment Board Partnership. Region One Priority Industry Sectors
 Region One Priority Industry Sectors Executive Summary The four priority target sectors selected by Region one includes: Construction (NAICS 236 238, excluding Residential) Manufacturing (NAICS 324-333),
VMTP 2025 Needs Assessment
 VMTP 2025 Needs Assessment Regional Needs Profile Northern Virginia December 2015 1. NEEDS ASSESSMENT PURPOSE The VMTP 2025 Needs Assessment framework is based on two principal objectives underlying transportation
Estimating traffic flows and environmental effects of urban commercial supply in global city logistics decision support
 Estimating traffic flows and environmental effects of urban commercial supply in global city logistics decision support Jesus Gonzalez-Feliu, Frédéric Henriot, Jean-Louis Routhier To cite this version:
Intergovernmental Eleventh Regional Environmentally. Sustainable Transport (EST) Forum in Asia. 2-5 October 2018 Ulaanbaatar, Mongolia
 Forum in Asia. 2-5 October 2018 Ulaanbaatar, Mongolia") Intergovernmental Eleventh Regional Environmentally Sustainable Transport (EST) Forum in Asia 2-5 October 2018 Ulaanbaatar, Mongolia Sustainable Urban Design and Development ~ Role of EST Country Report
Intergovernmental Eleventh Regional Environmentally Sustainable Transport (EST) Forum in Asia 2-5 October 2018 Ulaanbaatar, Mongolia Sustainable Urban Design and Development ~ Role of EST Country Report
The implementation of tools to support the data quality of the Business Register at Statistics Canada
 The implementation of tools to support the data quality of the Business Register at Statistics Canada Mario Ménard, Canada Abstract Business Registers contains a vast array of information concerning enterprises.
SUGAR. Joint Planning Exercise SWOT Analysis Municipality of Palma
 SUGAR Joint Planning Exercise SWOT Analysis Municipality of Palma 2 STRENGHTS WEAKNESSES -S1: REGUALTORY FRAMEWORK - W1: LACK OF FREIGHT TRANSPORT DATA - S2: CITY SPATIAL DISTRIBUTION -W2: URBAN MORPHOLOGY
2004 FEASIBILITY STUDY UPDATE
 Austin-San Antonio Intermunicipal Commuter Rail District 2004 FEASIBILITY STUDY UPDATE December 2004 EXECUTIVE SUMMARY INTRODUCTION Almost 3 million people in Central Texas, living and working between
COMMUNITY WORKPLACE POPULATION McHenry, Illinois
 COMMUNITY WORKPLACE POPULATION Prepared for City of McHenry September 2018 LOCATION CONTACT DOROTHY M. WOLF, ECONOMIC DEVELOPMENT COORDINATOR City of McHenry 333 S Green Street 60050 815.363.2175 dwolf@ci.mchenry.il.us
Integrating Freight into Downtown Life
 Integrating Freight into Downtown Life Presented by Chris Lamm, Cambridge Systematics NJTPA Freight Initiatives Committee February 20, 2018 Newark, NJ Downtowns and Smart Growth Communities Housing Preference
Regional Competitive Industry Analysis
 Regional Competitive Industry Analysis Baker, Union, and Wallowa Counties October 2017 Union Wallowa Baker Michael Meyers, Economist (503) 229-6179 michael.meyers@oregon.gov Jill Cuyler, Research Analyst
GLADSTONE AND REGION. Economic Profile
 GLADSTONE AND REGION Economic Profile This report contains demographic, job and business data within the geographic boundaries of the area known as Gladstone Self-contained Labour Area (SLA). It includes
Manchester, , POLIS Conference Sustainable Urban Logistics PlannIng To Enhance Regional freight transport
 Manchester, 24.11.2018, POLIS Conference Sustainable Urban Logistics PlannIng To Enhance Regional freight transport Holger Bach, Wirtschaftsförderung Region Stuttgart GmbH FUNCTIONAL URBAN AREA PERSPECTIVE
Bed and Bath Furnishings: 2004 Issued July 2005 Summary
 Bed and Bath Furnishings: 2004 Issued July 2005 Summary MQ314X(04)-5 NOTICE The MQ314X quarterly survey is discontinued as of December 2004. The 2004 summary report is the last publication for this survey.
SULPiTER project. New challenges for transport systems beyond 2020 Szczecin 14 th September 2018
 New challenges for transport systems beyond 2020 Szczecin 14 th September 2018 SULPiTER project SULPiTER Marcin Foltyński Institute of Logistics and Warehousing ILiM LOW CARBON CITIES AND REGIONS Poznan
The U.S. is getting new data for a New Economy and it s about time. BUSINESS WEEK. calibrating a new economy. Economic Classification Policy Committee
 The U.S. is getting new data for a New Economy and it s about time. BUSINESS WEEK calibrating a new economy Economic Classification Policy Committee www.census.gov/naics hat is NAICS? NAICS (pronounced
Consumption on the Woolen System and Worsted Combing: 2002 Issued June 2003 Summary
 Consumption on the Woolen System and Worsted Combing: 2002 Issued June 2003 Summary MQ313D(02)-5 Current data are released electronically on Internet for all individual surveys as they become available.
A Canadian Commodity Flow Survey
 A Canadian Commodity Flow Survey Statistics Canada and Transport Canada Transportation Research Board Commodity Flow Survey Workshop The Keck Center of the National Academies Washington, D.C. October 29,
José Holguín-Veras, William H. Hart Professor Director of the VREF Center of Excellence for Sustainable Urban Freight Systems
 1 The Center of Excellence for Sustainable Urban Freight Systems (CoE-SUFS) José Holguín-Veras, William H. Hart Professor Director of the VREF Center of Excellence for Sustainable Urban Freight Systems
THE REGION S PLAN POLICY FRAMEWORK. August 2015
 THE REGION S PLAN POLICY FRAMEWORK August 2015 2 What is The Policy Framework? Cover photo credit: Sinan Sinharoy for Atlanta BeltLine, Inc. Atlanta is one of the world s most dynamic metropolitan areas,
Drivers of Congestion Growth & Change
 Drivers of Congestion Growth & Change A Congestion Blueprint Transport Policy Branch, Department of Transport and Main Roads 1 Our values, our diversity 2 Queensland Government s objectives for the community
Moscow Transport in the Smart City: Current Status and Development Plans
 Moscow Transport in the Smart City: Current Status and Development Plans The Moscow City transportation development strategy is based on four key priorities Personal approach to a passenger Accurate and
Transportation and Warehousing Industry
 Peter Meade, Director John F. Palmieri, Director Transportation and Transportation and warehousing is one of the smaller industries in Boston, making up 2.8% of total employment in 2010. This ranks transportation
Stimulating Businesses and Jobs in Urbanizing Communities
 Stimulating Businesses and Jobs in Urbanizing Communities Town of Innisfil Market Saturation Analysis Presented by: Jamie Cook, Watson & Associates Economists Ltd. November 2, 2017 Study Purpose To assess
2010 Corpus Christi Urban Transportation Study Work Place Travel Survey Technical Summary
 2010 Corpus Christi Urban Transportation Study Work Place Travel Survey Technical Summary Prepared by the Texas A&M Transportation Institute November 2012 2010 Corpus Christi Urban Transportation Study
URBAN LOGISTICS In the Urban Mobility Plan context
 URBAN LOGISTICS In the Urban Mobility Plan context 2013 2018 New approaches to urban goods deliveries on-street and off-street in Barcelona Adrià Gomila Director of Mobility Services Amsterdam, June 2017
OFF PEAK DELIVERIES. Ministry of Transportation. Pan/Parapan Am Games Branch Goods Movement Office Peel Goods Movement Task Force November 1, 2013
 636 Days to Games OFF PEAK DELIVERIES Ministry of Transportation Pan/Parapan Am Games Branch Goods Movement Office Peel Goods Movement Task Force November 1, 2013 2 Off Peak Deliveries (OPD) Involves restricting
Memorandum. Date: RE: Citizens Advisory Committee
 Memorandum Date: 05.20.11 RE: Citizens Advisory Committee May 26, 2011 To: From: Subject: Citizens Advisory Committee Tilly Chang Deputy Director for Planning ACTION Adopt a Motion of Support for Approval
COMMUNITY WORKPLACE POPULATION Manvel, Texas
 COMMUNITY WORKPLACE POPULATION Prepared for Manvel Economic Development Corporation August 2016 LOCATION MANVEL CONTACT KYLE J. JUNG, CITY MANAGER City of Manvel 20025 Highway 6 77578 281.489.0630 281.489.0634
Lesson 2. Principles of. Transportation. Land Use 2-1
 Lesson 2 Principles of Transportation & Land Use 2-1 Learning Outcomes Explain transportation s impact on land use and development patterns, including historical growth patterns Explain how land use patterns