Reshaping Regional Economic Development: Clusters and Regional Strategy
|
|
|
- Barry Lucas
- 5 years ago
- Views:
Transcription


, Creating Shared Value (Harvard Business Review, Jan 2011), the Social Progress Index Report (Social")
1 Reshaping Regional Economic Development: Clusters and Regional Strategy Professor Michael E. Porter Harvard Business School U.S. Cluster Mapping Launch Event University of Minnesota, Minneapolis, MN September 29 th, 2014 This presentation draws on ideas from Professor Porter s articles and books, in particular, The Competitive Advantage of Nations (The Free Press, 1990), Building the Microeconomic Foundations of Competitiveness, in The Global Competitiveness Report (World Economic Forum), Clusters and the New Competitive Agenda for Companies and Governments in On Competition (Harvard Business School Press, 2008), Creating Shared Value (Harvard Business Review, Jan 2011), the Social Progress Index Report (Social Progress Imperative) and ongoing related research. No part of this publication may be reproduced, stored in a retrieval system, or transmitted in any form or by any means - electronic, mechanical, photocopying, recording, or otherwise - without the permission of Michael E. Porter. For further materials, see the website of the Institute for Strategy and Competitiveness ( FSG ( and the Social Progress Imperative (
2 The Challenge The US economy is slowly emerging from the deepest crisis we have experienced in a generation However, the trajectory of the U.S. economy was already disturbing well before 2008 and the long term trend is continuing The Midwest is no exception 2
3 Disturbing Trends Rolling 10-year Compound Annual Growth Rate in Total Number of U.S. Private Nonfarm Employees, % AVERAGE: 2.12% 2% 1% 0% -1% Source: Bureau of Labor Statistics, Current Employment Statistics survey; author s calculations. 3
4 Employment (in millions of jobs) 140 Disturbing Trends Private, Nonfarm Employment by Type of Industry INDUSTRIES SERVING LOCAL MARKETS (CAGR= 0.89%) INDUSTRIES EXPOSED TO INTERNATIONAL COMPETITION (CAGR= 0.02%) Source: Prof. Michael E. Porter, Harvard Business School; U.S. Cluster Mapping 2014 Benchmark Definitions (Delgado-Porter-Stern 2013), Richard Bryden, Project Director.
5 Compound annual growth rate Real Hourly Wage Growth by Educational Attainment Versus % 1.0% 0.5% 0.0% -0.5% -1.0% -1.5% Less than high school High school Some college College degree Advanced degree Source: Economic Policy Institute, A Decade of Flat Wages, August Based on Current Population Survey. U.S. COMPETITIVENESS PROJECT 5
6 Real GDP per Capita, 2012 $55,000 Prosperity Performance of U.S. States Delaware High but declining (+0.1%, $60,000) prosperity versus U.S. Connecticut Wyoming Alaska Alaska (+0.7%, (+0.7%, $61,000) $61,000) Massachusetts High and rising prosperity versus U.S. New York $50,000 $45,000 New Jersey Colorado Illinois California Virginia Minnesota New Hampshire Washington Texas Hawaii Louisiana Maryland North Dakota (+4.6%, $55,250) Nebraska Oregon (+3.1%, $48,069) South Dakota $40,000 U.S. Average GDP Per Capita, 2012: $42,784 Georgia Nevada Missouri North Carolina Ohio Wisconsin Pennsylvania Utah Indiana Rhode Island Kansas Vermont Iowa $35,000 $30,000 Michigan South Carolina Arizona Tennessee Maine Kentucky Florida New Mexico Idaho Source: BEA. Notes: GDP in real 2005 dollars. Growth rate is calculated as compound annual growth rate. 6 Oklahoma Alabama Arkansas West Virginia Mississippi Montana Low and declining prosperity Average U.S. GDP Low but rising prosperity versus U.S. Per Capita Real versus U.S. Growth Rate:.64% $25, % -0.5% 0.0% 0.5% 1.0% 1.5% 2.0% Real Growth in Gross Domestic Product per Capita, 2001 to 2012
7 Regional Economic Development: Prevailing Approaches Open for Business Big Game Hunting The Next Big Thing Build it and They Will Come Improve the general business environment Compete aggressively for plants and new investments Enter new high tech/ high growth industries Invest in large infrastructure/ industrial zone projects Attempt to match the policies of peers Long lists of areas for improvement, with limited progress Table stakes Zero Sum Winner s curse High cost, low return unless address underlying weakness Neglecting the existing base 7 Many competing for the same industries e.g. biotech, creative class Very few regions have the assets to succeed in them Rarely offer a strong advantage versus other regions Generic infrastructure will not offset lack of skills, other weaknesses, and absence of related businesses
8 Towards a New Economic Development Model Traditional approaches to economic development are not working We must reshape the approach to economic development in the U.S. based on a deeper understanding of the drivers of competitiveness in the modern global economy The New Direction Focus on competitiveness, not job creation per se Cluster-based, reflecting core drivers of jobs and wages Build on existing and potential strengths, versus rely on reducing weakness Develop an overall strategy rather than a list of actions Prioritized and sequenced, not treating all weaknesses equally Data driven, not political or based on wishful thinking 8
9 What is Competitiveness? A nation or region is competitive to the extent that firms operating there are able to compete successfully in the regional and global economy while maintaining or improving wages and living standards for the average citizen Competitiveness depends on the long-run productivity and efficiency of a location as a place to do business - The productivity of existing firms and workers - The ability to achieve high participation of citizens in the workforce Competitiveness is not: - Low wages - A weak currency - Jobs per se 9
10 Defining the Geographic Unit for Competitiveness Nation States Regions Regions are essential economic units for competitiveness US Cluster Mapping Launch Event v4 10
11 What Determines Competitiveness? Endowments Endowments, including natural resources, geographical location, population, and land area, create a foundation for prosperity, but true prosperity arises from productivity in the use of endowments 11
12 What Determines Competitiveness? Macroeconomic Competitiveness Sound Monetary and Fiscal Policies Human Development and Effective Political Institutions Endowments Macroeconomic competitiveness sets the economy-wide context for productivity to emerge, but is not sufficient to ensure productivity Endowments, including natural resources, geographical location, population, and land area, create a foundation for prosperity, but true prosperity arises from productivity in the use of endowments 12
13 What Determines Competitiveness? Microeconomic Competitiveness Quality of the Business Environment State of Cluster Development Sophistication of Company Operations and Strategy Macroeconomic Competitiveness Sound Monetary and Fiscal Policies Human Development and Effective Political Institutions Endowments Productivity ultimately depends on improving the microeconomic capability of the economy and the sophistication of local competition revealed at the level of firms, clusters, and regions Macroeconomic competitiveness sets the economy-wide context for productivity to emerge, but is not sufficient to ensure productivity Endowments, including natural resources, geographical location, population, and land area, create a foundation for prosperity, but true prosperity arises from productivity in the use of endowments 13
14 Improving the Quality of the Business Environment Context for Firm Strategy and Rivalry Factor (Input) Conditions Improving access to high quality business inputs Qualified human resources Capital availability Physical infrastructure Scientific and technological infrastructure Administrative and regulatory infrastructure Local rules and incentives that encourage investment and productivity e.g. incentives for capital investments, IP protection Sound corporate governance Open and vigorous local competition Openness to competition Strict competition laws Related and Supporting Industries Availability and quality of suppliers and supporting industries Demand Conditions Sophisticated and demanding local needs e.g., Strict quality, safety, and environmental standards Sophisticated demand in the private sector or government Many things matter for competitiveness Successful economic development is a process of successive upgrading, in which the business environment improves to enable increasingly sophisticated ways of competing 14
15 The Composition of Regional Economies Serve national and global markets Exposed to competition from other regions Serve almost exclusively the local market Little exposure to international or cross-regional competition for employment Local Clusters `` Traded Clusters Note: Cluster data includes all private, non-agricultural employment. Source: Michael E. Porter, Economic Performance of Regions, Regional Studies (2003); Updated via Cluster Mapping Project, Institute for Strategy and Competitiveness, Harvard Business School (2008) 15
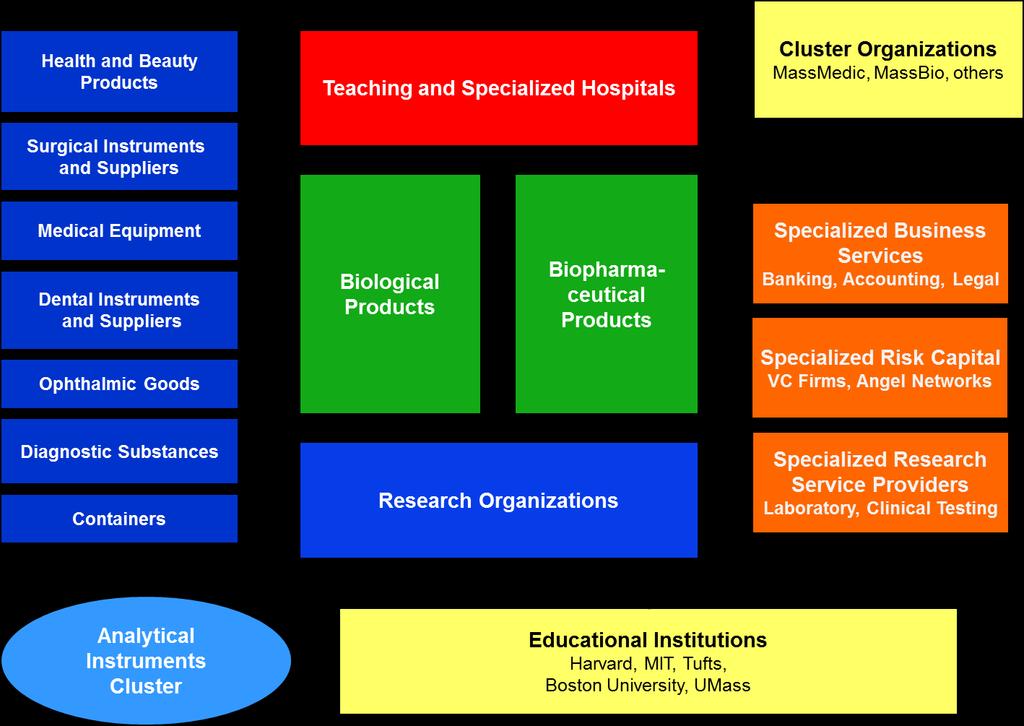

16 Clusters and Competitiveness Massachusetts Life Sciences 16
17 Institutions for Collaboration Selected Massachusetts Organizations, Life Sciences Life Sciences Industry Associations Massachusetts Biotechnology Council Massachusetts Medical Device Industry Council Massachusetts Hospital Association University Initiatives Harvard Biomedical Community MIT Enterprise Forum Biotech Club at Harvard Medical School Technology Transfer offices General Industry Associations Informal networks Associated Industries of Massachusetts Company alumni groups Greater Boston Chamber of Commerce Venture capital community High Tech Council of Massachusetts University alumni groups Economic Development Initiatives Joint Research Initiatives Massachusetts Technology Collaborative Mass Biomedical Initiatives Mass Development Massachusetts Alliance for Economic Development New England Healthcare Institute Whitehead Institute For Biomedical Research Center for Integration of Medicine and Innovative Technology (CIMIT) 17
18 Minneapolis Share of National Employment % Traded Cluster Composition of the Minneapolis Economy Overall change in the Minneapolis Share of US Traded Employment: -.055% Medical Devices (+.065%, 4.9%), Information Technology and Analytical Instruments 3.0% Insurance Services Printing Services Lighting and Electrical Equipment (+1.1%, 2.9%) 2.5% 2.0% 1.5% 1.0% 0.5% Transportation and Logistics Distribution and Electronic Commerce Production Technology and Heavy Machinery Food Processing and Manufacturing Upstream Metal Manufacturing Downstream Chemical Products Communications Equipment and Services Aerospace Vehicles and Defense Metalworking Technology Performing Arts Business Services Wood Products Hospitality and Tourism Plastics Automotive Financial Services Construction Products and Services Marketing, Design, and Publishing Downstream Metal Products Furniture Oil and Gas Production and Transportation Paper and Packaging Education and Knowledge Creation Biopharmaceuticals Electric Power Generation and Transmission Minneapolis Overall Share of US Traded Employment: 1.7% Employment Lost Jobs 0.0% -0.75% -0.50% -0.25% 0.00% 0.25% 0.50% 0.75% 0.85% Change in Minneapolis Share of National Employment Employees 15,000 = Source: Prof. Michael E. Porter, Harvard Business School; U.S. Cluster Mapping 2014 Benchmark Definitions (Delgado-Porter-Stern 2013), Richard Bryden, Project Director US Cluster Mapping Launch Event v17 18 Added Jobs
19 Strong Traded Clusters Drive Regional Performance Research Findings Presence of strong clusters Job growth Breadth of industries within each cluster Higher wages Higher patenting rates Greater new business formation, growth and survival Resilience in downturns Build on the region s existing and emerging clusters rather than chase hot fields Source: Cluster and Entrepreneurship by Mercedes Delgado, Michael E. Porter, and Scott Stern (2010); The Economic Performance of Regions by Michael E. Porter (2003) 19
20 Related Clusters and Economic Diversification Jewelry & Precious Metals Financial Services Processed Food Business Services Fishing & Fishing Products Agricultural Products Distribution Services Publishing & Printing Transportation & Logistics Education & Knowledge Creation Chemical Products Hospitality & Tourism Information Technology Medical Devices Biopharmaceuticals Entertainment Aerospace Vehicles & Defense Analytical Instruments Tobacco Lighting & Electrical Equipment Communications Services Prefabricated Enclosures Building Fixtures, Equipment & Services Power Generation & Transmission Motor Driven Products Furniture Textiles Heavy Construction Services Heavy Machinery Construction Materials Forest Products Production Technology Coal & Briquettes Footwear Apparel Leather & Related Products Oil & Gas Products Plastics Aerospace Engines Note: Clusters with overlapping borders or identical shading have at least 20% overlap (by number of industries) in both directions. 20 Metal Manufacturing Sporting, Recreational & Children s Goods Automotive Marine Equipment
21 Strong Traded Clusters Drive Regional Performance Research Findings Presence of strong clusters Job growth Breadth of industries within each cluster Strength in related clusters Higher wages Higher patenting rates Presence of a region s clusters in neighboring regions Greater new business formation, growth and survival Resilience in downturns Build on the region s existing and emerging clusters rather than chase hot fields Economic diversification usually occurs within clusters and across related clusters Source: Cluster and Entrepreneurship by Mercedes Delgado, Michael E. Porter, and Scott Stern (2010); The Economic Performance of Regions by Michael E. Porter (2003) 21
22 What is an Economic Strategy? Policy Improvement Economic Strategy Implementing best practices in each policy area An overall agenda for creating a more competitive and distinctive position for a country or region, based on its particular circumstances There are a huge number of policy areas that matter No region or country can (or should try to) make progress in all areas simultaneously 22
23 Developing a Regional Economic Strategy Regional Value Proposition What is a distinctive competitive position for the region given its location, legacy, existing strengths, and potential strengths? What unique advantages as a business location? For what types of activities and clusters? What roles in the surrounding regions, countries, and the global economy? Developing Unique Strengths What elements of the business environment can be unique strengths relative to peers/neighbors? What existing and emerging clusters can be built upon? Achieving and Maintaining Parity with Peers What weaknesses must be addressed to remove key constraints and achieve parity with peer locations? Priorities and sequencing are fundamental to successful economic development 23
24 Clusters as a Tool for Economic Development Leverages the power of spillovers and linkages to drive rapid economic development A vehicle for policies and investments that strengthen multiple related firms/institutions simultaneously Enhances the efficiency and effectiveness of traditional economic policy areas, such as training, R&D, export promotion, FDI attraction, etc. 24

 Quality and Environmental Specialized Physical standards")
25 Organize Public Policy around Clusters Export Promotion Business Attraction Education and Workforce Training Market Information and Disclosure Clusters Science and Technology Infrastructure (e.g., centers, university departments, technology transfer) Quality and Environmental Specialized Physical standards Infrastructure Natural Resource Protection Clusters provide a framework for organizing the implementation of many public policies and public investments directed at economic development 25
26 Clusters as a Tool for Economic Policy Leverage the power of spillovers and linkages to drive rapid economic development A vehicle for policies and investments that strengthen multiple related firms/institutions simultaneously Enhances the efficiency and effectiveness of traditional economic policy areas, such as training, R&D, export promotion, FDI attraction, etc. A forum for collaboration between the private sector, trade associations, government, educational, and research institutions A mechanism for constructive business-government dialog Brings together firms of all sizes, including SME s Clusters initiatives are a powerful private/public vehicle to identify and get alignment on problems and action recommendations Cluster upgrading fosters greater and more sophisticated competition rather than distorting the market Sound cluster policy addresses all existing and emerging clusters, and does not pick winners 26

27 U.S. Cluster Mapping National economic initiative based at HBS and sponsored by the U.S. Department of Commerce s Economic Development Administration. To help drive better regional economic strategy, the interactive website provides data to: Help regions understand their current competitiveness and sources of potential differentiation Help clusters assess their competitive position and highlight areas for potential growth Help Institutions for Collaboration engage with peers within and beyond their home region and cluster 27
Hawaii Competitiveness: Creating a State Economic Strategy
 Hawaii Competitiveness: Creating a State Economic Strategy Professor Michael E. Porter Harvard Business School March 20, 2012 For further material on regional competitiveness and clusters: www.isc.hbs.edu/econ-clusters.htm
Wyoming Competitiveness: Creating a State Economic Strategy
 Wyoming Competitiveness: Creating a State Economic Strategy Professor Michael E. Porter Harvard Business School April 10, 2012 For further material on regional competitiveness and clusters: www.isc.hbs.edu/econ-clusters.htm
Utah Competitiveness: Creating a State Economic Strategy
 Utah Competitiveness: Creating a State Economic Strategy Professor Michael E. Porter Harvard Business School March 28, 2012 For further material on regional competitiveness and clusters: www.isc.hbs.edu/econ-clusters.htm
Oklahoma Competitiveness: Creating a State Economic Strategy
 Oklahoma Competitiveness: Creating a State Economic Strategy Professor Michael E. Porter Harvard Business School March 28, 2012 For further material on regional competitiveness and clusters: www.isc.hbs.edu/econ-clusters.htm
Iowa Competitiveness: Creating a State Economic Strategy
 Iowa Competitiveness: Creating a State Economic Strategy Professor Michael E. Porter Harvard Business School March 20, 2012 For further material on regional competitiveness and clusters: www.isc.hbs.edu/econ-clusters.htm
New Jersey Competitiveness: Creating a State Economic Strategy
 New Jersey Competitiveness: Creating a State Economic Strategy Professor Michael E. Porter Harvard Business School August 2011 For further material on regional competitiveness and clusters: www.isc.hbs.edu/econ-clusters.htm
Indiana Competitiveness: Creating a State Economic Strategy
 Indiana Competitiveness: Creating a State Economic Strategy Professor Michael E. Porter Harvard Business School March 20, 2012 For further material on regional competitiveness and clusters: www.isc.hbs.edu/econ-clusters.htm
Georgia Competitiveness: Creating a State Economic Strategy
 Georgia Competitiveness: Creating a State Economic Strategy Professor Michael E. Porter Harvard Business School March 20, 2012 For further material on regional competitiveness and clusters: www.isc.hbs.edu/econ-clusters.htm
Wisconsin Competitiveness: Creating a State Economic Strategy
 Wisconsin Competitiveness: Creating a State Economic Strategy Professor Michael E. Porter Harvard Business School March 20, 2012 For further material on regional competitiveness and clusters: www.isc.hbs.edu/econ-clusters.htm
Nevada Competitiveness: Creating a State Economic Strategy
 Nevada Competitiveness: Creating a State Economic Strategy Professor Michael E. Porter Harvard Business School August 2011 For further material on regional competitiveness and clusters: www.isc.hbs.edu/econ-clusters.htm
Michigan Competitiveness: Creating an Economic Strategy in a Time of Austerity
 Michigan Competitiveness: Creating an Economic Strategy in a Time of Austerity Professor Michael E. Porter Harvard Business School Mackinac Policy Conference June 2, 2011 For further materials on the competitiveness
New Learnings on State and Regional Competitiveness: What Does it Mean for Tennessee?
 New Learnings on State and Regional Competitiveness: What Does it Mean for Tennessee? Dr. Christian Ketels Harvard Business School 19. October 2011 Nashville, Tennessee 1 Copyright 2011 Professor Michael
U.S. Regional Cluster Mapping Current Research and Tools for Practice
 U.S. Regional Cluster Mapping Current Research and Tools for Practice C2ER Webinar October 25, 2012 Rich Bryden Director of Information Products Institute for Strategy and Competitiveness Harvard Business
Massachusetts at a Crossroads: Renewing the
 at a Crossroads: Renewing the Competitiveness of Boston and the State Professor Michael E. Porter Institute for Strategy and Competitiveness Harvard Business School John LaWare Leadership Forum March 24,
Clusters, Cluster Initiatives, and Regional Competitiveness: What Have We Learned?
 Clusters, Cluster Initiatives, and Regional Competitiveness: What Have We Learned? Prof. Christian H. M. Ketels Institute for Strategy and Competitiveness Harvard Business School Innovative Foresight Planning
Watershed Condition Framework
 US Forest Service - Watershed Condition Classification Maps http://www.fs.fed.us/publications/watershed/ Page 1 of 2 1/9/2013 Watershed Condition Framework The Forest Service has released the first national
April June Labor Market Outlook. Published by the Society for Human Resource Management. Labor Market Outlook Survey Q (April June)
") April June 2009 Labor Market Outlook Published by the Society for Human Resource Management Labor Market Outlook Survey Q2 2009 (April June) LABOR MARKET OUTLOOK SURVEY Q2 2009 (April June) OPTIMISM ABOUT
April June 2009 Labor Market Outlook Published by the Society for Human Resource Management Labor Market Outlook Survey Q2 2009 (April June) LABOR MARKET OUTLOOK SURVEY Q2 2009 (April June) OPTIMISM ABOUT
Industrial Energy Efficiency as a Resource by Region
 Industrial Energy Efficiency as a Resource by Region Garrett Shields and Robert D. Naranjo, BCS Incorporated Sandy Glatt, U.S. Department of Energy ABSTRACT The energy intensity of specific manufacturing
Benchmarking Standards, Model Codes, Codes and Voluntary Guidelines on the HERS Index
 Benchmarking Standards, Model Codes, Codes and Voluntary Guidelines on the HERS Index Importance of Benchmarking Quantifying energy efficiency programs and codes helps: Consumers understand the performance
Labor Market Outlook. Labor Market Outlook Survey Q (October December) Published by the Society for Human Resource Management
 Published by the Society for Human Resource Management") October December 2009 Labor Market Outlook Published by the Society for Human Resource Management Labor Market Outlook Survey Q4 2009 (October December) LABOR MARKET OUTLOOK SURVEY Q4 2009 (October December)
October December 2009 Labor Market Outlook Published by the Society for Human Resource Management Labor Market Outlook Survey Q4 2009 (October December) LABOR MARKET OUTLOOK SURVEY Q4 2009 (October December)
Knowledge Exchange Report
 Knowledge Exchange Report February 2016 The Economic Impact of a Minimum Wage Increase on New York State Agriculture New York State is considering a minimum wage increase from $9.00 to $15.00 statewide.
HOW BIG IS AFRICA? Rules. recommended grades: 3-6
 AFRICA HOW BIG IS AFRICA? recommended grades: 3-6 time needed: 25 MINUTES Description Students develop a sense of scale by using their bodies and other tools to measure the length and width of Africa.
Trends in. U.S. Delivered Coal Costs: July 2012
 Trends in U.S. Delivered Coal Costs: 2004-2011 July 2012 By Teresa Foster, William Briggs and Leslie Glustrom Version 1.1 Inquiries or corrections to info@cleanenergyaction.org 1 2 Table of Contents INTRODUCTION...
Energy and Regional Economics
 Energy and Regional Economics Michael Carliner International instability and possible war affect the overall US economy, and economic conditions in different regions, in a variety of ways. Changes in energy
SAMPLE REPORT. Competitive Landscape for Wholesale Distribution: Fasteners $ RESEARCHED & PRODUCED BY:
 $295.95 2015 Competitive Landscape for Wholesale Distribution: Fasteners ANNUAL MARKET DATA, TRENDS AND ANALYSIS FOR THE NORTH AMERICAN WHOLESALE DISTRIBUTION INDUSTRY 2015 by Gale Media, Inc. All rights
Accelerating Energy Efficiency in Texas
 Accelerating Energy Efficiency in Texas Southwest Partnership for Energy Efficiency As a Resource Houston, Texas August 5, 2014 Jim Lazar RAP Senior Advisor The Regulatory Assistance Project 50 State Street,
Case Study: market growth strategy. - Selection of slides
 Case Study: market growth strategy - Selection of slides 1 Objective of the collaboration Situation: The Client, global AC player, would like to enhance its positioning in the USA In this sense, the overall
Building a Competitive Mexico: The Role of Business
 Building a Competitive Mexico: The Role of Business Professor Michael E. Porter Harvard Business School COPARMEX National Annual Meeting 2012 Durango, Mexico October 19, 2012 This presentation draws on
Government Spending and Air Pollution in the US
 Government Spending and Air Pollution in the US ONLINE APPENDIX Asif M. Islam* University of Maryland 2106 Symons Hall College Park, MD 20740 (651) 246 4017 aislam@arec.umd.edu Ramón E. López University
ENERGY STAR Oil Furnaces Product List
 ENERGY STAR Oil Furnaces Product List Below are currently qualified ENERGY STAR models available for sale in the U.S. and Canada * Air Leakage data was not collected under the Version 3.0 ENERGY STAR Program
The next big reliability challenge: EPA revised ozone standard
 The next big reliability challenge: EPA revised ozone standard Eugene M. Trisko Attorney-at-Law SSEB Clean Coal Technology Committee Kingsport, TN May 19, 2015 Background EPA is proposing to lower the
Q October-December. Jobs Outlook Survey Report. Published by the Society for Human Resource Management
 Q4 2011 October-December Jobs Outlook Survey Report Published by the Society for Human Resource Management JOBS OUTLOOK SURVEY REPORT Q4 2011 (October-December) OPTIMISM ABOUT JOB GROWTH IN Q4 2011 (OCTOBER-DECEMBER)
Knowledge Exchange Report. Economic Impact of Mandatory Overtime on New York State Agriculture
 Farm Credit East Knowledge Exchange Report September, 2014 Economic Impact of Mandatory Overtime on New York State Agriculture The New York State Legislature and Governor Andrew Cuomo are considering legislation
CALCULATING THE SUPPLEMENTAL NUTRITION ASSISTANCE PROGRAM (SNAP) PROGRAM ACCESS INDEX: A STEP-BY-STEP GUIDE FOR 2015
 PROGRAM ACCESS INDEX: A STEP-BY-STEP GUIDE FOR 2015") Food and Nutrition Service January 2017 CALCULATING THE SUPPLEMENTAL NUTRITION ASSISTANCE PROGRAM (SNAP) PROGRAM ACCESS INDEX: A STEP-BY-STEP GUIDE FOR 2015 Introduction The Program Access Index (PAI)
Food and Nutrition Service January 2017 CALCULATING THE SUPPLEMENTAL NUTRITION ASSISTANCE PROGRAM (SNAP) PROGRAM ACCESS INDEX: A STEP-BY-STEP GUIDE FOR 2015 Introduction The Program Access Index (PAI)
CALCULATING THE SUPPLEMENTAL NUTRITION ASSISTANCE PROGRAM (SNAP) PROGRAM ACCESS INDEX: A STEP-BY-STEP GUIDE FOR 2013
 PROGRAM ACCESS INDEX: A STEP-BY-STEP GUIDE FOR 2013") Food and Nutrition Service January 2015 CALCULATING THE SUPPLEMENTAL NUTRITION ASSISTANCE PROGRAM (SNAP) PROGRAM ACCESS INDEX: A STEP-BY-STEP GUIDE FOR 2013 Introduction The Program Access Index (PAI)
Food and Nutrition Service January 2015 CALCULATING THE SUPPLEMENTAL NUTRITION ASSISTANCE PROGRAM (SNAP) PROGRAM ACCESS INDEX: A STEP-BY-STEP GUIDE FOR 2013 Introduction The Program Access Index (PAI)
U.S. Political Activity & Public Policy Report 2013
 U.S. Political Activity & Public Policy Report 2013 Best Buy Co., Inc. 2013 Best Buy engages in the political process by developing and advocating public policy positions that directly impact our employees,
Labor Market Outlook. Labor Market Outlook Survey Q (October December) Published by the Society for Human Resource Management
 Published by the Society for Human Resource Management") October December 2010 Labor Market Outlook Published by the Society for Human Resource Management Labor Market Outlook Survey Q4 2010 (October December) LABOR MARKET OUTLOOK SURVEY Q4 2010 (October December)
October December 2010 Labor Market Outlook Published by the Society for Human Resource Management Labor Market Outlook Survey Q4 2010 (October December) LABOR MARKET OUTLOOK SURVEY Q4 2010 (October December)
Meat Animals Production, Disposition, and Income 2015 Summary
 United States Department of Agriculture National Agricultural Statistics Service Meat Animals Production, Disposition, and Income 2015 Summary ISSN: 0748-0318 April 2016 Contents Summary... 5 Meat Animals
Innovation and Competitiveness: Implications for Policy and Saudi Arabia
 Innovation and Competitiveness: Implications for Policy and Saudi Arabia Professor Michael E. Porter Global Competitiveness Forum Riyadh, Saudi Arabia January 2011 This presentation draws on ideas from
2012 Distribution Best Practices Benchmarking Company Profile Data Packet
 American Gas Association January 2012 Company Name: DOT Operating ID(s): Person Completing Form: Phone Number: Email Address: Required Fields Deadline for data submittal in BESS, http://www.aga.org/research/bess/
Milk Production, Disposition, and Income 2014 Summary
 United s Department of Agriculture National Agricultural Statistics Service Milk Production, Disposition, and Income 04 Summary ISSN: 949-506 April 05 Contents Summary... 4 Milk Cows and Production of
U.S. Political Activity & Public Policy Report 2012
 U.S. Political Activity & Public Policy Report 2012 Best Buy Co., Inc. 2012 Best Buy engages in the political process by developing and advocating public policy positions that directly impact our employees,
Do you have staff reviewing formation filings for name availability purposes or is this done electronically?
 Topic: Developing an Online Filing System Question by: Allison Clark Jurisdiction: Ohio Date: 2 February 2011 Jurisdiction Question(s) Manitoba Corporations Canada Alabama Alaska Arizona Arkansas California
Asphalt Pavement Mix Production Survey On Reclaimed Asphalt Pavement, Reclaimed Asphalt Shingles, And Warm-mix Asphalt Usage:
 Asphalt Pavement Mix Production Survey On Reclaimed Asphalt Pavement, Reclaimed Asphalt Shingles, And Warm-mix Asphalt Usage: 2009-2010 Appendix A Purpose The National Asphalt Pavement Association is working
Economic Impact Study
 Economic Impact Study U.S.- Based Scrap Recycling Industry 2017 Prepared for the Institute for Scrap Recycling Industries, Inc. Executive Summary Scrap recycling is a major U.S.-based industry dedicated
U.S. Political Activity & Public Policy Report 2011
 U.S. Political Activity & Public Policy Report 2011 Best Buy Co., Inc. 2011 Best Buy engages in the political process by developing and advocating public policy positions which directly impact our employees,
U.S. Drought Monitor, August 28, 2012
 University of Nebraska - Lincoln DigitalCommons@University of Nebraska - Lincoln US Ag in Drought Archive Drought -- National Drought Mitigation Center 8-28-2 U.S. Drought Monitor, August 28, 2 Brian Fuchs
U.S. Drought Monitor, September 4, 2012
 University of Nebraska - Lincoln DigitalCommons@University of Nebraska - Lincoln US Ag in Drought Archive Drought -- National Drought Mitigation Center 9--12 U.S. Drought Monitor, September, 12 Brian Fuchs
Other examples: tourism (lodging, car rental, etc.), tobacco and alcoholic beverage excise, real estate transfer
, tobacco and alcoholic beverage excise, real estate transfer") Local Option Taes Local option taes are taes levied with state approval by municipalities, county, and special district governments including school districts. Forty-three states authorize local option
Local Option Taes Local option taes are taes levied with state approval by municipalities, county, and special district governments including school districts. Forty-three states authorize local option
U.S. Drought Monitor, July 31, 2012
 University of Nebraska - Lincoln DigitalCommons@University of Nebraska - Lincoln US Ag in Drought Archive Drought -- National Drought Mitigation Center -3-2 U.S. Drought Monitor, July 3, 2 Mark D. Svoboda
ANNEX E: Methodology for Estimating CH 4 Emissions from Coal Mining
 1 1 1 1 1 1 1 1 0 1 0 1 ANNEX E: Methodology for Estimating CH Emissions from Coal Mining The methodology for estimating methane emissions from coal mining consists of two distinct steps. The first step
Fatal Occupational Injuries in Maine, 2008
 MAINE DEPARTMENT OF LABOR Fatal Occupational Injuries in Maine, 2008 An Annual Report September 2009 By: Ann Beaulieu D EPARTMENT OF L ABOR B UREAU OF L ABOR STANDARDS 45 STATE HOUSE STATION AUGUSTA, MAINE
Idaho s Forest Products Business Sector:
 Policy Analysis Group College of Natural Resources Report No. 26 August 2006 Idaho s Forest Products Business Sector: Jobs, Wages and Salaries, Direct and Indirect Effects Linkages, Multipliers, and Economic
The Denver Water System
 The Denver Water System Established in 1918 Unique structure Serves 1.3 million people 25% of Colorado s population System footprint - 4,000 square miles (2.5 million acres) 19 raw water reservoirs Critical
Q October-December. Jobs Outlook Survey Report. Published by the Society for Human Resource Management
 Q4 2012 October-December Jobs Outlook Survey Report Published by the Society for Human Resource Management JOBS OUTLOOK SURVEY REPORT Q4 2012 (October-December) OPTIMISM ABOUT JOB GROWTH IN Q4 2012 (OCTOBER-DECEMBER)
Milk Production, Disposition, and Income 2011 Summary
 United s Department of Agriculture National Agricultural Statistics Service Production, Disposition, and Income 2011 Summary April 2012 ISSN: 19491506 Contents Summary... 4 Cows and Production of and
https://aba2.issi.net/team/admin/wizard/survey/loadinstance.asp?formid=208&instanc...
 https://aba2.issi.net/team/admin/wizard/survey/loadinstance.asp?formid=208&instanc... Page 1 of 1 Print Last edited by Vicki Osman on Mar 28 2016 8:54AM Marketplace 2017 Associate Profile Page 1/1 Please
128 Million Reasons to Get BPI Certified
 128 Million Reasons to Get BPI Certified How BPI Certification Helps Build a Green Collar Work Force Larry Zarker Building Performance Institute Obituary Obituary Green, 36, Is Dead The word green, which
Legislative Trends: Upcoming Increases to Minimum Wage Round-up 2018
 Legislative Trends: Upcoming Increases to Minimum Wage Round-up 2018 While the last federal minimum wage increase was on July 24, 2009, when it rose from $6.55 to $7.25 per hour, many state and local governments
Paralegal Career Insight
 Paralegal Career Insight Emsi Q2 2017 Data Set Occupa on Summary for Paralegals and Legal Assistants 287,653 +1.1% $23.65/hr Jobs (2016) % Change (2016-2017) Median Hourly Earnings Emsi Q2 2017 Data Set
Meat Animals Production, Disposition, and Income 2011 Summary
 United States Department of Agriculture National Agricultural Statistics Service Meat Animals Production, Disposition, and Income 2011 Summary April 2012 ISSN: 0748-0318 Special Note Sheep: Monthly sheep
Updated State-level Greenhouse Gas Emission Coefficients for Electricity Generation
 Updated State-level Greenhouse Gas Emission Coefficients for Electricity Generation 1998-2000 Energy Information Administration Office of Integrated Analysis and Forecasting Energy Information Administration
AMERICAN FORESTRY CONGRESS
 PROCEEDINGS OF THE AMERICAN FORESTRY CONGRESS AT ITS MEETING HELD IN BOSTON, SEPTEMBER 1885 WASHINGTON DC JUDD & DETWILLER, PRINTERS FACTS AND FIGURES IN RESPECT TO THE FORESTS OF THE COUNTRY AND THEIR
2010 County Sustainability Strategies
 2010 County Sustainability Strategies TM 1 Highlights The most important benefit counties are realizing from sustainability efforts is cost savings. Energy Efficiency and Renewable Energy Generation, and
NEAUPG Annual Fall Meeting
 NEAUPG Annual Fall Meeting 1 Presentation Overview What does it mean to be Sustainable? What asphalt technologies are considered Sustainable and why? Why do we need to quantify our impact? What tools are
General Manager: Front Desk Manager: Front Desk/Shift Supervisor: Housekeeping or Environmental Services Manager: Housekeeping Supervisor/Inspector:
 1 Report Summary WageWatch, Inc. has partnered with AAHOA to provide its members with a Hospitality Salary Survey Report for limited/select service hotels twice a year. This is the first report and is
Pollution Control Exemptions for Pipelines
 Pollution Control Exemptions for Pipelines Greg Wood Ryan, LLC Atlanta, Georgia 30303 Greg.Wood@Ryan.com (919) 219-5605 Keith Fuqua Colonial Pipeline Company Alpharetta, Georgia 30009 kfuqua@colpipe.com
U.S. Drought Monitor, October 2, 2012
 University of Nebraska - Lincoln DigitalCommons@University of Nebraska - Lincoln US Ag in Drought Archive Drought -- National Drought Mitigation Center -2-12 U.S. Drought Monitor, October 2, 12 Anthony
Internet Appendix for The Impact of Bank Credit on Labor Reallocation and Aggregate Industry Productivity
 Internet Appendix for The Impact of Bank Credit on Labor Reallocation and Aggregate Industry Productivity John (Jianqiu) Bai, Daniel Carvalho and Gordon Phillips * June 4, 2017 This appendix contains three
Chapter TRI Data and Trends (Original Industries Only)
") Chapter 3 1999 TRI Data and 1995 1999 Trends (Original Industries Only) Chapter 3 1999 TRI Data and 1995 1999 Trends (Original Industries Only) INTRODUCTION This chapter summarizes information reported
Chapter 3 1999 TRI Data and 1995 1999 Trends (Original Industries Only) Chapter 3 1999 TRI Data and 1995 1999 Trends (Original Industries Only) INTRODUCTION This chapter summarizes information reported
Q October-December. Jobs Outlook Survey Report. Published by the Society for Human Resource Management
 Q4 2013 October-December Jobs Outlook Survey Report Published by the Society for Human Resource Management JOBS OUTLOOK SURVEY REPORT Q4 2013 (October-December) OPTIMISM ABOUT JOB GROWTH IN Q4 2013 (OCTOBER-DECEMBER)
Milk Production. January Milk Production up 2.7 Percent
 Milk Production ISSN: 9-557 Released February, 07, by the National Agricultural Statistics Service (NASS), Agricultural Statistics Board, United States Department of Agriculture (USDA). January Milk Production
Predict. Prevent. Protect. Transform.
 Optum solution uses global positioning system technology for Optum (CES) is an open-architecture claims editing tool that Program Integrity Solutions Optum provides 30 years worth of government expertise
Fatal Occupational Injuries in Maine 2004
 Fatal Occupational Injuries in Maine 2004 BLS 732 D EPARTMENT OF LABOR B UREAU OF LABOR S TANDARDS 45 STATE HOUSE STATION AUGUSTA, MAINE 04333-0045 LAURA A. FORTMAN COMMISSIONER JOHN ELIAS BALDACCI GOVERNOR
JAN-SAN MRO DATA ESTIMATED END-USER DEMAND BY REGION & END-MARKET
 $1,995.00 2014 U.S. MARKET ANALYSIS: JAN-SAN MRO DATA ESTIMATED END-USER DEMAND BY REGION & END-MARKET e l p m a S researched & produced by: www.imidata.com www.mdm.com 2014 by Gale Media Inc. All rights
Interstate Movement Of Municipal Solid Waste
 1.S: P'E C I A L R E P 0 R T: 2 Interstate Movement Of Municipal Solid Waste February 1992 The United States has an intricate web of beneficial interstate movements of municipal solid waste. Where interstate
U.S. Department of Labor
 U.S. Department of Labor Employment and Training Administration 200 Constitution Avenue, N.W. Washington, D.C. 20210 MEMORANDUM TO: State Workforce Agency Administrators FROM: William Carlson Chief, Division
Overview and Background: Regulation of Power Plants under EPA s Proposed Clean Power Plan
 Overview and Background: Regulation of Power Plants under EPA s Proposed Clean Power Plan Jennifer Macedonia Council of State Governments Annual Meeting August 11, 2014 BACKGROUND: EPA S PROPOSED CLEAN
Does your company lease any provider networks from other dental plans or network management companies? (Please check all that apply)
") Name Company Phone Email Address Which type of Dental benefit products does your company currently offer? (Please check all that apply) 1. 2. 3. DEPO 4. Dental Indemnity 5. Medicaid/CHIP 6. Medicare 7.
Name Company Phone Email Address Which type of Dental benefit products does your company currently offer? (Please check all that apply) 1. 2. 3. DEPO 4. Dental Indemnity 5. Medicaid/CHIP 6. Medicare 7.
THE VW SETTLEMENT HANDBOOK: Overview, Timeline, and Actions
 THE VW SETTLEMENT HANDBOOK: Overview, Timeline, and Actions Table of Contents: What is the VW Settlement?... 2 Why Do We Care About NOx and Transportation?... 3 The Environmental Mitigation Trust... 4
Honey Final Estimates
 United States Department of Agriculture National Agricultural Statistics Service Honey Final Estimates 200-2012 September 201 Statistical Bulletin Number 3 Contents Honey Price by Color Class United States:
Honey. United States Honey Production Down 1 Percent
 Honey ISSN: 199-192 Released March 18, 2013, by the National Agricultural Statistics Service (NASS), Agricultural Statistics Board, United States Department of Agriculture (USDA). United States Honey Production
Greenhouse Gas Emission Reductions From Existing Power Plants Under Section 111(d) of the Clean Air Act: Options to Ensure Electric System Reliability
 of the Clean Air Act: Options to Ensure Electric System Reliability") Greenhouse Gas Emission Reductions From Existing Power Plants Under Section 111(d) of the Clean Air Act: Options to Ensure Electric System Reliability Susan Tierney, Analysis Group May 8, 2014 Questions/Answers
Greenhouse Gas Emission Reductions From Existing Power Plants Under Section 111(d) of the Clean Air Act: Options to Ensure Electric System Reliability Susan Tierney, Analysis Group May 8, 2014 Questions/Answers
Farms and Land in Farms
 United States Department of Agriculture National Agricultural Statistics Service Farms and Land in Farms 2017 Summary February 2018 ISSN: 1995-2004 2 Farms and Land in Farms 2017 Summary (February 2018)
Trends in. U.S. Delivered Coal Costs: October 2013
 Trends in U.S. Delivered Coal Costs: 2004-2012 October 2013 By Teresa Foster and Leslie Glustrom Inquiries or corrections to info@cleanenergyaction.org 1 2 TABLE OF CONTENTS Introduction... 5 UNITED STATES
Electronic Check Service Quick Reference Guide
 Electronic Check Service Quick Reference Guide VeriFone Omni & Vx Series Using the RDM EC6000i VeriFone Omni & Vx Series Using the RDM EC6000i Image Settlement/Upload Check images are settled/uploaded
The Pyrogeographyof Wildfires in the Western U.S.
 The Pyrogeographyof Wildfires in the Western U.S. Dr. Michael Medler 1 2 3 4 The pumps buy you time, but minutes only. From this moment, no matter what we do, Titanic will founder. But this ship can't
U.S. Drought Monitor, August 7, 2012
 University of Nebraska - Lincoln DigitalCommons@University of Nebraska - Lincoln US Ag in Drought Archive Drought -- National Drought Mitigation Center -- U.S. Drought Monitor, August, Mark D. Svoboda
A Model Modernization: Edith Green-Wendell Wyatt Federal Building and GSA s Mid-Century Inventory
 A Model Modernization: Edith Green-Wendell Wyatt Federal Building and GSA s Mid-Century Inventory Leslie Shepherd, Chief Architect, General Services Administration Les Shepherd, FAIA Chief Architect General
ALUMNI MAGAZINE. Media Kit
 ALUMNI MAGAZINE Media Kit 2018 Alumni Profile PRINT CIRCULATION Winter Magazine: approx. 100,000 Spring/Fall Magazines: approx. 65-75,000 DEGREE HOLDERS Hold only an undergraduate degree from W&M: 62%
Methodology. Respondents. Survey Process
 Methodology The 2011 ABA Compensation & Benefits Survey was designed to meet the needs of banks across the nation. The survey was administered by enetrix, A Division of Gallup, Inc., and an invitation
Cattle. January 1 Cattle Inventory Up 3 Percent
 Cattle ISSN: 1948-90 Released January 29, 2016, by the National Agricultural Statistics Service (NASS), Agricultural Statistics Board, United States Department of Agriculture (USDA). January 1 Cattle Inventory
Clean and Secure Energy Actions Report 2010 Update. GHG Policies
 Alabama Alaska Arizona Arkansas California Colorado Connecticut Delaware Florida Georgia Participant in Climate Registry; climate action plan: Policy Planning to Reduce Greenhouse Gas Emissions in Alabama
U.S. Drought Monitor, August 14, 2012
 University of Nebraska - Lincoln DigitalCommons@University of Nebraska - Lincoln US Ag in Drought Archive Drought -- National Drought Mitigation Center 8-4-2 U.S. Drought Monitor, August 4, 2 Michael J.
Milk Production. January Milk Production up 1.8 Percent
 Milk Production ISSN: 9-557 Released February, 08, by the National Agricultural Statistics Service (NASS), Agricultural Statistics Board, United States Department of Agriculture (USDA). January Milk Production
LOOKING TO OUR FUTURE. Managing West Michigan Discards in an Emerging Circular Economy
 LOOKING TO OUR FUTURE Managing West Michigan Discards in an Emerging Circular Economy Kent County s Integrated Solid Waste Management System Includes Waste To Energy, Single Stream Recycling, Landfill,
BRAND REPORT FOR THE 6 MONTH PERIOD ENDED JUNE 2018 (Including Supplementary Data)
") Peerless Media, LLC a subsidiary of EH Media 111 Speen Street Suite 200 Framingham, MA 01701 Tel.: (508) 663-1500 www.mmh.com BRAND REPORT FOR THE 6 MONTH PERIOD ENDED JUNE 2018 (Including Supplementary
Peerless Media, LLC a subsidiary of EH Media 111 Speen Street Suite 200 Framingham, MA 01701 Tel.: (508) 663-1500 www.mmh.com BRAND REPORT FOR THE 6 MONTH PERIOD ENDED JUNE 2018 (Including Supplementary
130 Million Reasons to Develop a Green Workforce
 130 Million Reasons to Develop a Green Workforce An Overview of the BPI Credentialing Process Larry Zarker Building Performance Institute Home Performance Contracting is the Low Hanging Fruit in the Clean
BRAND REPORT FOR THE 6 MONTH PERIOD ENDED JUNE 2017 (Including Supplementary Data)
") BRAND REPORT FOR THE 6 MONTH PERIOD ENDED JUNE 2017 (Including Supplementary Data) No attempt has been made to rank the information contained in this report in order of importance, since BPA Worldwide
BRAND REPORT FOR THE 6 MONTH PERIOD ENDED JUNE 2017 (Including Supplementary Data) No attempt has been made to rank the information contained in this report in order of importance, since BPA Worldwide
VOTER REGISTRATION REMAINS CHALLENGING FOR MANY NEW YORKERS
 : Good for Democracy and Sound Fiscal Sense February 11, 2019 VOTER REGISTRATION REMAINS CHALLENGING FOR MANY NEW YORKERS who may not know how or where to register to vote, or whose minor errors on voter